
A Scoping Review of the Application of Metabolomics in Nutrition Research: The Literature Survey 2000–2019


Abstract
:
1. Introduction
2. Materials and Methods
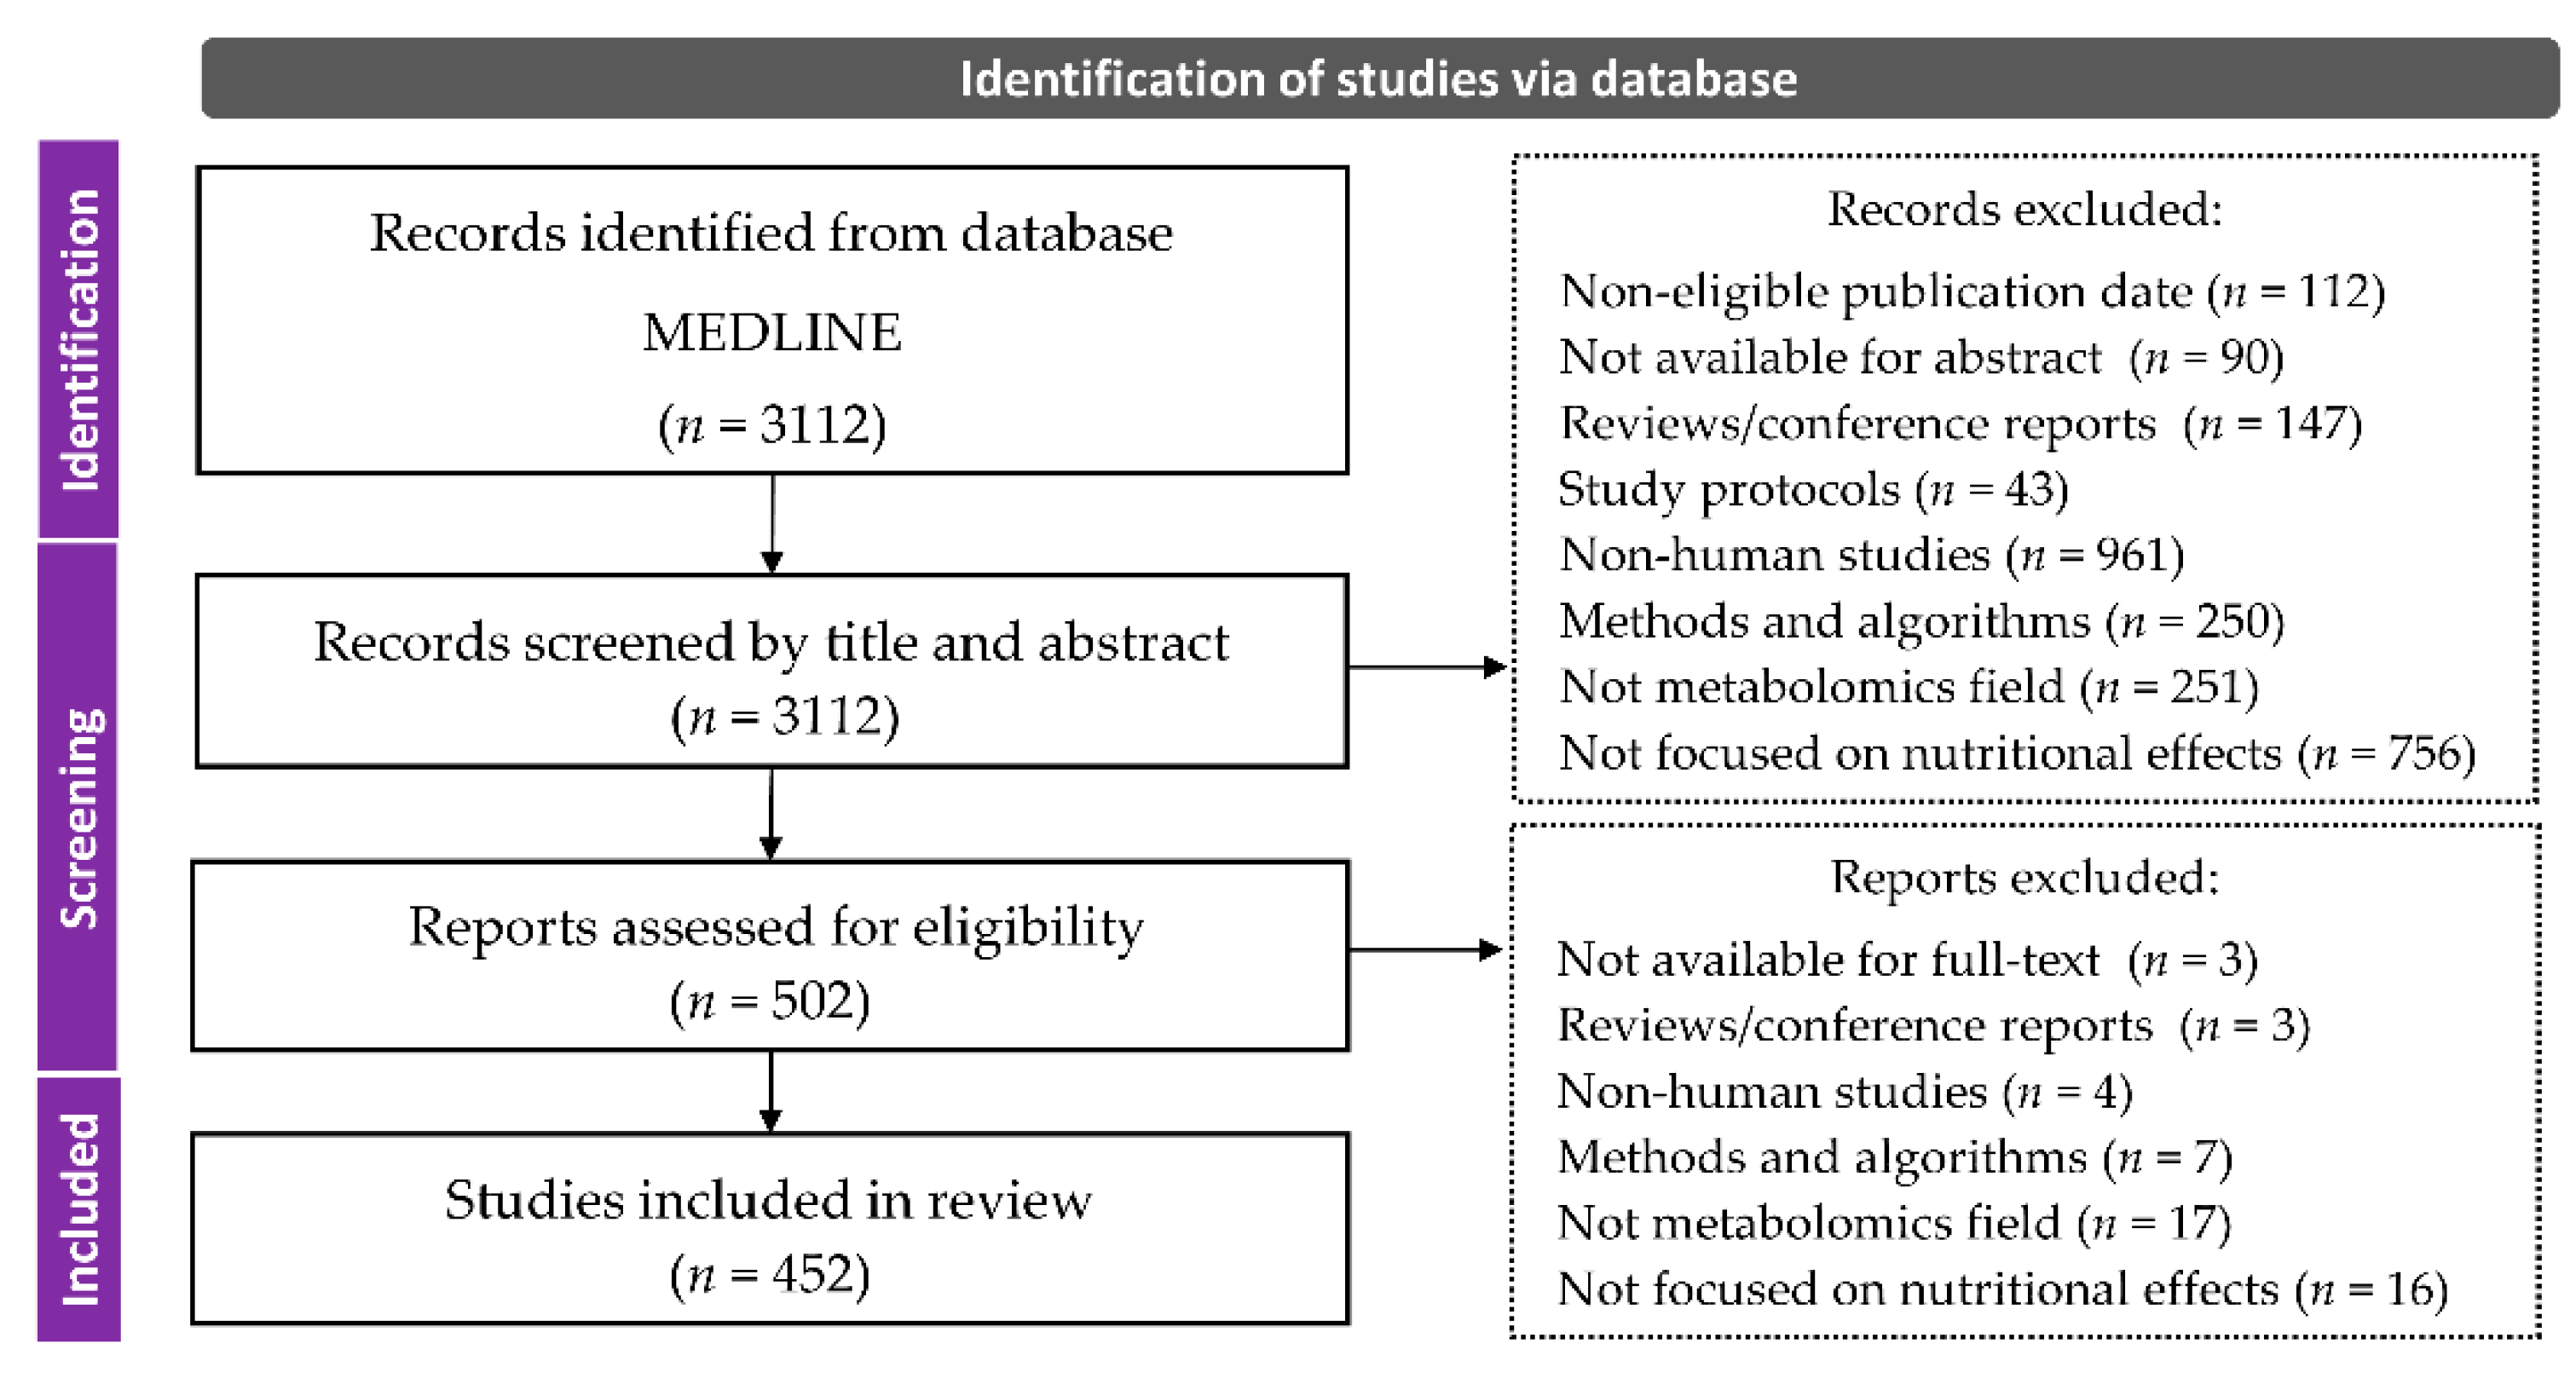
2.1. Search Strategy
2.2. Selection Criteria
2.3. Classification and Data Collection
3. Results and Discussion
3.1. Pioneering Studies (2000–2009)
3.2. Study Design
3.3. Biofluid Samples
3.3.1. Blood (Plasma/Serum)
3.3.2. Urine
3.3.3. Feces
3.3.4. Saliva
3.3.5. Human Milk
3.4. Fields of Application
3.4.1. Dietary Assessment
3.4.2. Metabolic Profiling
3.4.3. Risk Prediction
3.4.4. Gut Microbiota Diversity
3.4.5. Genetic Interaction
3.4.6. Human Milk Profiling
3.4.7. Diet Sensitivity
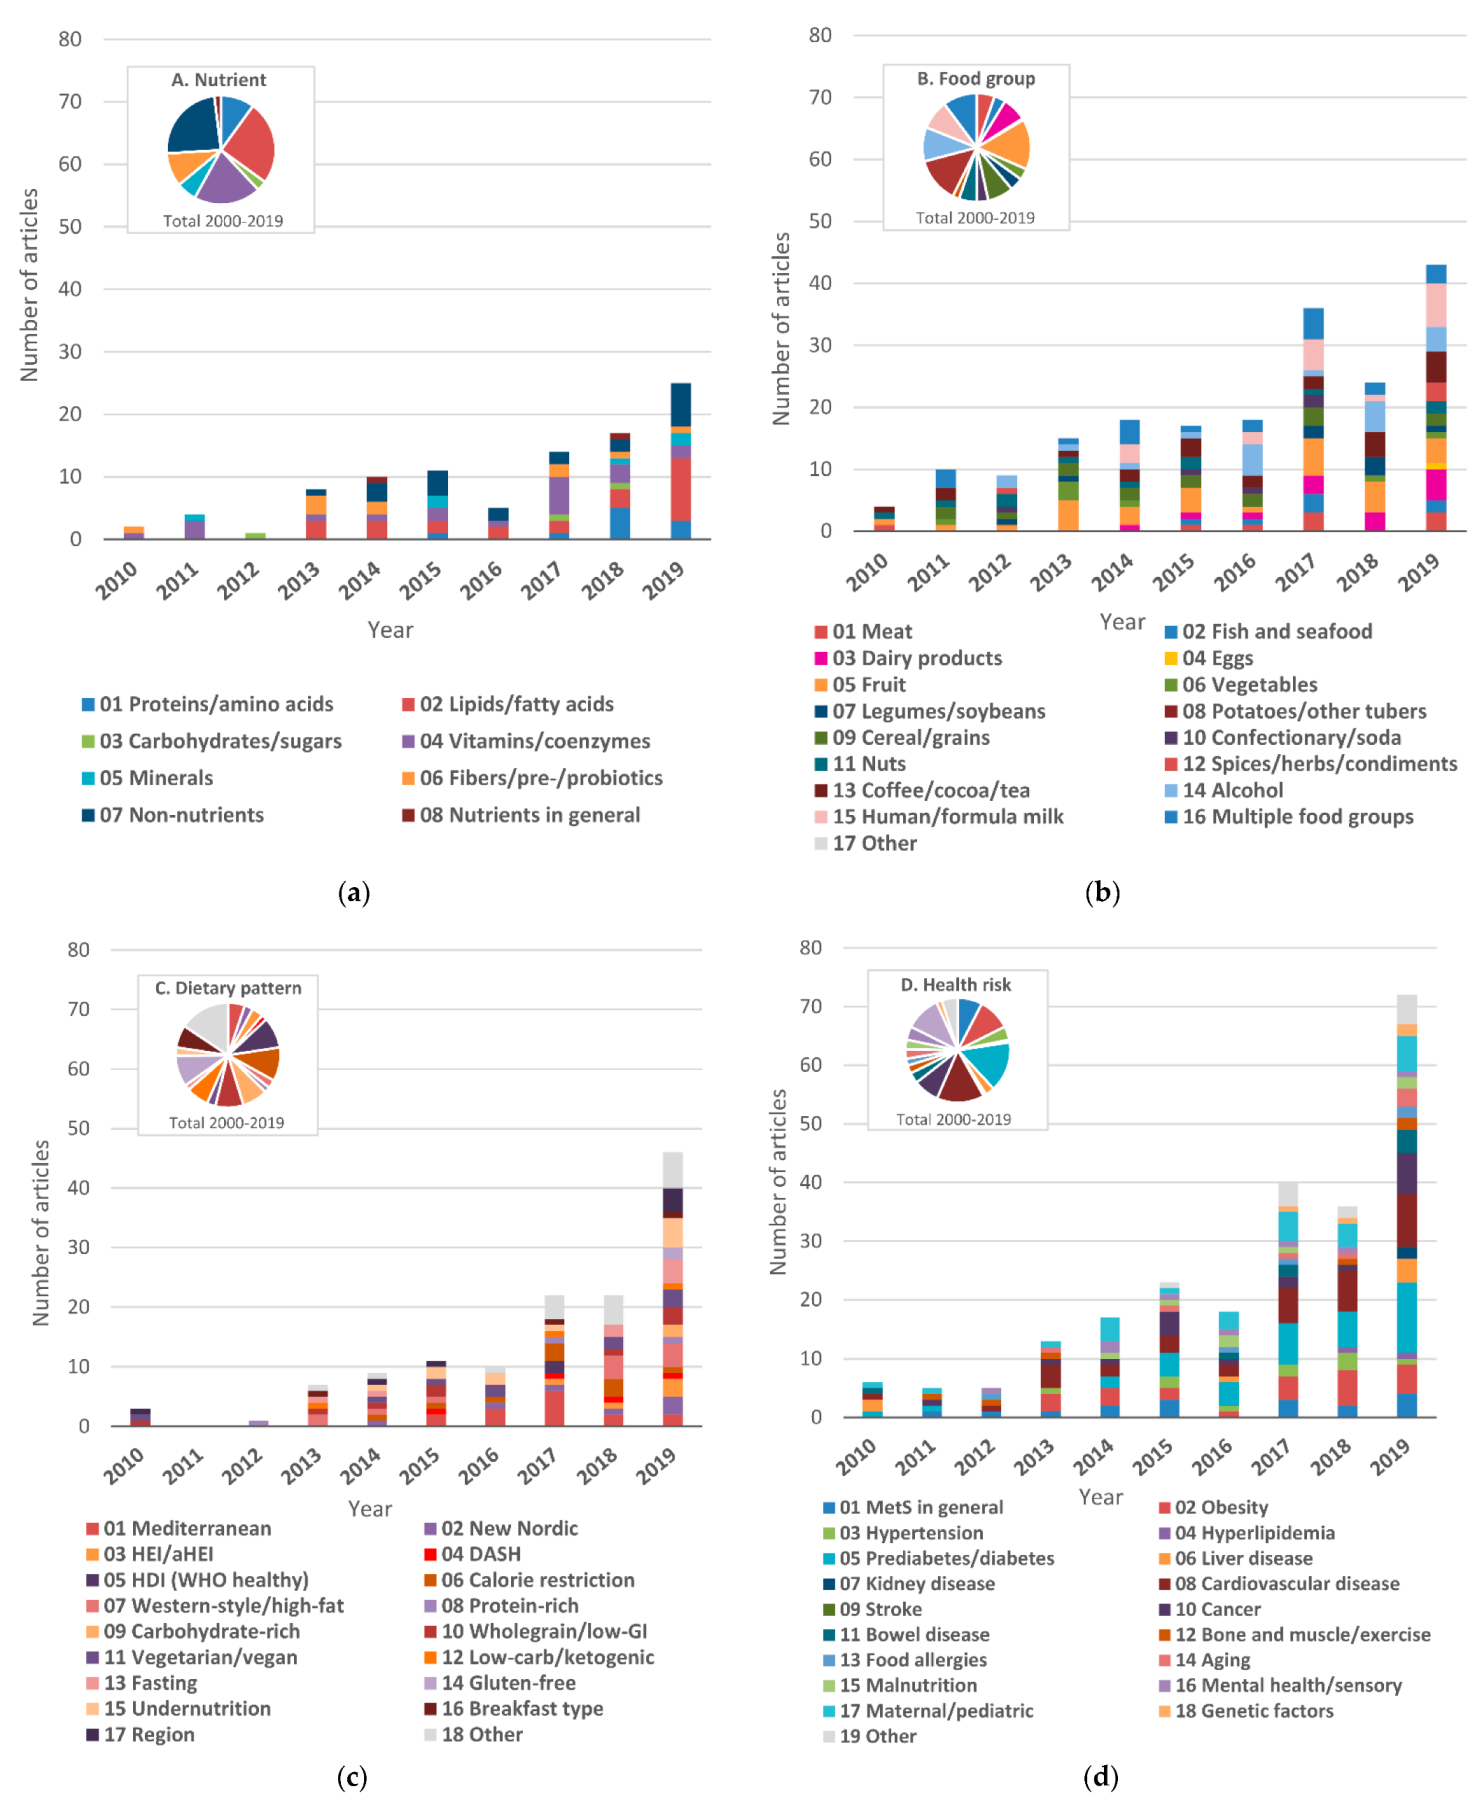
3.5. Dietary Factors
3.5.1. Nutrients
3.5.2. Food Groups
3.5.3. Dietary Patterns
3.6. Targeted Health Risks
3.7. Future Aspects and Issues
3.8. Limitations
4. Conclusions
Supplementary Materials
Author Contributions
Funding
Institutional Review Board Statement
Informed Consent Statement
Conflicts of Interest
Appendix A

| I 2000–2009 | II 2010–2014 | III 2015–2019 | Total | |||||||||
|---|---|---|---|---|---|---|---|---|---|---|---|---|
| Total Number of Articles | n = 18 | n = 105 | n = 329 | n = 452 | ||||||||
| Study design | ||||||||||||
| NRCT | 9 | 47% | RCT parallel | 31 | 30% | RCT parallel | 92 | 28% | RCT parallel | 126 | 28% | |
| RCT crossover | 4 | 21% | RCT crossover | 31 | 30% | RCT crossover | 78 | 24% | RCT crossover | 113 | 25% | |
| RCT parallel | 3 | 16% | NRCT | 18 | 17% | Cross-sectional | 65 | 20% | Cross-sectional | 84 | 18% | ↑2 |
| Biofluid | ||||||||||||
| Urine | 16 | 59% | Blood | 60 | 51% | Blood | 230 | 59% | Blood | 300 | 56% | ↑ |
| Blood | 10 | 37% | Urine | 45 | 38% | Urine | 108 | 28% | Urine | 169 | 32% | |
| Saliva | 1 | 4% | Feces | 5 | 4% | Feces | 36 | 9% | Feces | 41 | 8% | ↑ |
| Human milk | 5 | 4% | ||||||||||
| Application field | ||||||||||||
| Metabolic profiling | 11 | 61% | Metabolic profiling | 55 | 52% | Metabolic profiling | 125 | 38% | Metabolic profiling | 191 | 42% | |
| Diet sensitivity | 4 | 22% | Dietary assessment | 20 | 19% | Risk prediction | 86 | 26% | Risk prediction | 101 | 22% | ↑ |
| Dietary assessment | 2 | 11% | Risk prediction | 14 | 13% | Dietary assessment | 69 | 21% | Dietary assessment | 91 | 20% | ↑ |
| Dietary factor | ||||||||||||
| Food group | 11 | 69% | Food group | 56 | 56% | Food group | 136 | 44% | Food group | 203 | 47% | |
| Nutrient | 3 | 19% | Nutrient | 24 | 24% | Dietary pattern | 104 | 33% | Dietary pattern | 126 | 29% | ↑ |
| Dietary pattern | 2 | 13% | Dietary pattern | 20 | 20% | Nutrient | 72 | 23% | Nutrient | 99 | 23% | |
| I 2000–2009 | II 2010–2014 | III 2015–2019 | Total | |||||||||
|---|---|---|---|---|---|---|---|---|---|---|---|---|
| Nutrient | ||||||||||||
| Non-nutrients | 3 | 100% | Lipids/fatty acids | 6 | 24% | Lipids/fatty acids | 19 | 26% | Lipids/fatty acids | 25 | 25% | ↑2 |
| - | - | - | Vitamins/coenzymes | 6 | 24% | Non-nutrients | 17 | 24% | Non-nutrients | 24 | 24% | ↑ |
| - | - | - | Fibers/pre-/probiotics | 6 | 24% | Vitamins/coenzymes | 14 | 19% | Vitamins/coenzymes | 20 | 20% | |
| Food group | ||||||||||||
| Coffee/tea/cocoa | 6 | 50% | Fruit | 11 | 20% | Fruit | 20 | 14% | Fruit | 31 | 15% | |
| Meat | 2 | 17% | Multiple food groups | 8 | 14% | Coffee/tea/cocoa | 16 | 12% | Coffee/tea/cocoa | 28 | 14% | ↑ |
| Confectionary/soda | 2 | 17% | Cereal/grains | 7 | 13% | Alcohol | 16 | 12% | Alcohol | 21 | 10% | ↑ |
| Dairy products | 1 | 8% | Nuts | 6 | 11% | Human/formula milk | 15 | 11% | Multiple food groups | 21 | 10% | |
| Alcohol | 1 | 8% | Coffee/tea/cocoa | 6 | 11% | Dairy products | 13 | 9% | Human/formula milk | 18 | 9% | ↑ |
| - | - | - | Vegetables | 5 | 9% | Multiple food groups | 13 | 9% | Cereal/grains | 16 | 8% | |
| Dietary pattern | ||||||||||||
| Calorie restriction | 1 | 50% | Western/high-fat | 3 | 15% | Mediterranean | 15 | 14% | Mediterranean | 15 | 12% | ↑ |
| Region | 1 | 50% | Wholegrain/low-GI | 3 | 15% | Undernutrition | 10 | 9% | Western/high-fat | 12 | 9% | |
| - | - | - | Vegetarian/vegan | 2 | 10% | Calorie restriction | 9 | 8% | Calorie restriction | 11 | 8% | ↑ |
| - | - | - | Fasting | 2 | 10% | Western/high-fat | 9 | 8% | Undernutrition | 11 | 8% | ↑ |
| - | - | - | Region | 2 | 10% | Vegetarian/vegan | 8 | 7% | Vegetarian/vegan | 10 | 8% | |
| - | - | - | 6 items (respectively) | 1 | 5% | New Nordic | 6 | 5% | Wholegrain/low-GI | 9 | 7% | |
| Wholegrain/low-GI | 6 | 5% | ||||||||||
| Fasting | 6 | 5% | ||||||||||
| Targeted health risks | ||||||||||||
| Mental/preference | 2 | 50% | CVD | 8 | 17% | Diabetes | 33 | 17% | Diabetes | 37 | 15% | ↑ |
| MetS in general | 1 | 25% | Maternal/pediatric | 7 | 15% | CVD | 27 | 14% | CVD | 35 | 15% | |
| Cancer | 1 | 25% | Obesity | 6 | 13% | Maternal/pediatric | 19 | 10% | Maternal/pediatric | 26 | 11% | |
| - | - | - | MetS in general | 5 | 11% | Obesity | 18 | 10% | Obesity | 24 | 10% | |
| - | - | - | Diabetes | 4 | 9% | Cancer | 15 | 8% | Cancer | 19 | 8% | ↑ |
| - | - | - | Cancer | 3 | 7% | MetS in general | 12 | 6% | MetS in general | 18 | 8% | |
| Bone and muscle | 3 | 7% | ||||||||||
| Mental/sensory | 3 | 7% | ||||||||||
| Author | Year | Research Topic | Design 1 | n | Biofluid 2 | Ref. |
|---|---|---|---|---|---|---|
| Rezzi, et al. | 2007 | Metabolic phenotypes in specific dietary preferences | RCT-CO | 22 | U, P | [27] |
| Martin, et al. | 2009 | Dietary preferences and anxiety trait | RCT-P | 30 | U, P | [30] |
| Martin. et al. | 2012 | Dietary preferences linked to differing gut microbiota | RCT-P | 20 | U, P | [51] |
| Heinzmann, et al. | 2012 | Stability and robustness in response to sequential food challenges | NRCT | 7 | U | [102] |
| Dror, et al. | 2013 | Impact of refeeding on blood profiles in elderly patients | NRCT | 53 | B | [103] |
| Mounayar, et al. | 2014 | Taste perception phenotype in sensitivity to taste of fat | RCT-CO | 73 | SV | [39] |
| Pallister, et al. | 2015 | Food preference patterns in a UK Twin cohort | CS | 1491 | P, S | [52] |
| Badoud, et al. | 2015 | Difference in responses to a calorie challenge among obese people | RCT-P | 30 | P, S | [104] |
| Liu, et al. | 2015 | Postprandial change in insulin resistance | NRCT | 30 | S | [105] |
| Malagelada, et al. | 2016 | Cognitive and hedonic responses to meal ingestion | NRCT | 18 | B | [53] |
| Geidenstam, et al. | 2016 | Changes in glucose-induced metabolite response after weight loss | NRCT | 14 | S | [106] |
| Shrestha, et al. | 2017 | Metabolic responses from fasting state to postprandial | NRCT | 19 | S | [107] |
| Fiamoncini, et al. | 2018 | Postprandial state with susceptibility to weight-loss | RCT-P | 72 | P | [108] |
| Malagelada, et al. | 2018 | Metabolomic signature of the postprandial experience | NRCT | 32 | P, S | [109] |
| Takahashi, et al. | 2018 | Meal timing on postprandial glucose metabolism | RCT-CO | 16 | S | [110] |
References
- Gibney, M.J.; Walsh, M.; Brennan, L.; Roche, H.M.; German, B.; van Ommen, B. Metabolomics in human nutrition: Opportunities and challenges. Am. J. Clin. Nutr. 2005, 82, 497–503. [Google Scholar] [CrossRef]
- Jenab, M.; Slimani, N.; Bictash, M.; Ferrari, P.; Bingham, S.A. Biomarkers in nutritional epidemiology: Applications, needs and new horizons. Hum. Genet. 2009, 125, 507–525. [Google Scholar] [CrossRef]
- Ismail, N.A.; Posma, J.M.; Frost, G.; Holmes, E.; Garcia-Perez, I. The role of metabonomics as a tool for augmenting nutritional information in epidemiological studies. Electrophoresis 2013, 34, 2776–2786. [Google Scholar] [CrossRef]
- Scalbert, A.; Brennan, L.; Manach, C.; Andres-Lacueva, C.; Dragsted, L.O.; Draper, J.; Rappaport, S.M.; van der Hooft, J.J.; Wishart, D.S. The food metabolome: A window over dietary exposure. Am. J. Clin. Nutr. 2014, 99, 1286–1308. [Google Scholar] [CrossRef] [PubMed] [Green Version]
- Guertin, K.A.; Moore, S.C.; Sampson, J.N.; Huang, W.Y.; Xiao, Q.; Stolzenberg-Solomon, R.Z.; Sinha, R.; Cross, A.J. Metabolomics in nutritional epidemiology: Identifying metabolites associated with diet and quantifying their potential to uncover diet-disease relations in populations. Am. J. Clin. Nutr. 2014, 100, 208–217. [Google Scholar] [CrossRef] [Green Version]
- Fiehn, O. Combining genomics, metabolome analysis, and biochemical modelling to understand metabolic networks. Comp. Funct. Genomics 2001, 2, 155–168. [Google Scholar] [CrossRef] [Green Version]
- Nicholson, J.K.; Lindon, J.C.; Holmes, E. ‘Metabonomics’: Understanding the metabolic responses of living systems to pathophysiological stimuli via multivariate statistical analysis of biological nmr spectroscopic data. Xenobiotica 1999, 29, 1181–1189. [Google Scholar] [CrossRef]
- Fiehn, O. Metabolomics—The link between genotypes and phenotypes. Plant Mol. Biol. 2002, 48, 155–171. [Google Scholar] [CrossRef] [PubMed]
- Zhang, X.; Yap, Y.; Wei, D.; Chen, G.; Chen, F. Novel omics technologies in nutrition research. Biotechnol. Adv. 2008, 26, 169–176. [Google Scholar] [CrossRef] [PubMed]
- Di Renzo, L.; Gualtieri, P.; Romano, L.; Marrone, G.; Noce, A.; Pujia, A.; Perrone, M.A.; Aiello, V.; Colica, C.; De Lorenzo, A. Role of personalized nutrition in chronic-degenerative diseases. Nutrients 2019, 11, 1707. [Google Scholar] [CrossRef] [Green Version]
- O’Sullivan, A.; Henrick, B.; Dixon, B.; Barile, D.; Zivkovic, A.; Smilowitz, J.; Lemay, D.; Martin, W.; German, J.B.; Schaefer, S.E. 21st century toolkit for optimizing population health through precision nutrition. Crit. Rev. Food Sci. Nutr. 2018, 58, 3004–3015. [Google Scholar] [CrossRef] [PubMed]
- Gao, Q.; Praticò, G.; Scalbert, A.; Vergères, G.; Kolehmainen, M.; Manach, C.; Brennan, L.; Afman, L.A.; Wishart, D.S.; Andres-Lacueva, C.; et al. A scheme for a flexible classification of dietary and health biomarkers. Genes Nutr. 2017, 12, 34. [Google Scholar] [CrossRef] [Green Version]
- Zuppi, C.; Messana, I.; Forni, F.; Ferrari, F.; Rossi, C.; Giardina, B. Influence of feeding on metabolite excretion evidenced by urine 1h nmr spectral profiles: A comparison between subjects living in rome and subjects living at arctic latitudes (svaldbard). Clin. Chim. Acta 1998, 278, 75–79. [Google Scholar] [CrossRef]
- Lenz, E.M.; Bright, J.; Wilson, I.D.; Morgan, S.R.; Nash, A.F. A 1h nmr-based metabonomic study of urine and plasma samples obtained from healthy human subjects. J. Pharm. Biomed. Anal. 2003, 33, 1103–1115. [Google Scholar] [CrossRef]
- Lenz, E.M.; Bright, J.; Wilson, I.D.; Hughes, A.; Morrisson, J.; Lindberg, H.; Lockton, A. Metabonomics, dietary influences and cultural differences: A 1h nmr-based study of urine samples obtained from healthy british and swedish subjects. J. Pharm. Biomed. Anal. 2004, 36, 841–849. [Google Scholar] [CrossRef]
- Walsh, M.C.; Brennan, L.; Malthouse, J.P.; Roche, H.M.; Gibney, M.J. Effect of acute dietary standardization on the urinary, plasma, and salivary metabolomic profiles of healthy humans. Am. J. Clin. Nutr. 2006, 84, 531–539. [Google Scholar] [CrossRef] [Green Version]
- Wang, Y.; Tang, H.; Nicholson, J.K.; Hylands, P.J.; Sampson, J.; Holmes, E. A metabonomic strategy for the detection of the metabolic effects of chamomile (matricaria recutita l.) ingestion. J. Agric. Food. Chem. 2005, 53, 191–196. [Google Scholar] [CrossRef] [PubMed]
- Van Dorsten, F.A.; Daykin, C.A.; Mulder, T.P.; Van Duynhoven, J.P. Metabonomics approach to determine metabolic differences between green tea and black tea consumption. J. Agric. Food Chem. 2006, 54, 6929–6938. [Google Scholar] [CrossRef] [PubMed]
- Stalmach, A.; Mullen, W.; Barron, D.; Uchida, K.; Yokota, T.; Cavin, C.; Steiling, H.; Williamson, G.; Crozier, A. Metabolite profiling of hydroxycinnamate derivatives in plasma and urine after the ingestion of coffee by humans: Identification of biomarkers of coffee consumption. Drug Metab. Dispos. 2009, 37, 1749–1758. [Google Scholar] [CrossRef] [Green Version]
- Altmaier, E.; Kastenmüller, G.; Römisch-Margl, W.; Thorand, B.; Weinberger, K.M.; Adamski, J.; Illig, T.; Döring, A.; Suhre, K. Variation in the human lipidome associated with coffee consumption as revealed by quantitative targeted metabolomics. Mol. Nutr. Food Res. 2009, 53, 1357–1365. [Google Scholar] [CrossRef]
- Llorach, R.; Urpi-Sarda, M.; Jauregui, O.; Monagas, M.; Andres-Lacueva, C. An lc-ms-based metabolomics approach for exploring urinary metabolome modifications after cocoa consumption. J. Proteome Res. 2009, 8, 5060–5068. [Google Scholar] [CrossRef]
- Solanky, K.S.; Bailey, N.J.; Beckwith-Hall, B.M.; Davis, A.; Bingham, S.; Holmes, E.; Nicholson, J.K.; Cassidy, A. Application of biofluid 1h nuclear magnetic resonance-based metabonomic techniques for the analysis of the biochemical effects of dietary isoflavones on human plasma profile. Anal. Biochem. 2003, 323, 197–204. [Google Scholar] [CrossRef] [PubMed]
- Walsh, M.C.; Brennan, L.; Pujos-Guillot, E.; Sébédio, J.L.; Scalbert, A.; Fagan, A.; Higgins, D.G.; Gibney, M.J. Influence of acute phytochemical intake on human urinary metabolomic profiles. Am. J. Clin. Nutr. 2007, 86, 1687–1693. [Google Scholar] [CrossRef] [PubMed]
- Teague, C.; Holmes, E.; Maibaum, E.; Nicholson, J.; Tang, H.; Chan, Q.; Elliott, P.; Stamler, J.; Ueshima, H.; Zhou, B.; et al. Ethyl glucoside in human urine following dietary exposure: Detection by 1h nmr spectroscopy as a result of metabonomic screening of humans. Analyst 2004, 129, 259–264. [Google Scholar] [CrossRef] [PubMed]
- Solanky, K.S.; Bailey, N.J.; Beckwith-Hall, B.M.; Bingham, S.; Davis, A.; Holmes, E.; Nicholson, J.K.; Cassidy, A. Biofluid 1h nmr-based metabonomic techniques in nutrition research - metabolic effects of dietary isoflavones in humans. J. Nutr. Biochem. 2005, 16, 236–244. [Google Scholar] [CrossRef] [PubMed]
- Stella, C.; Beckwith-Hall, B.; Cloarec, O.; Holmes, E.; Lindon, J.C.; Powell, J.; van der Ouderaa, F.; Bingham, S.; Cross, A.J.; Nicholson, J.K. Susceptibility of human metabolic phenotypes to dietary modulation. J. Proteome Res. 2006, 5, 2780–2788. [Google Scholar] [CrossRef]
- Rezzi, S.; Ramadan, Z.; Martin, F.P.; Fay, L.B.; van Bladeren, P.; Lindon, J.C.; Nicholson, J.K.; Kochhar, S. Human metabolic phenotypes link directly to specific dietary preferences in healthy individuals. J. Proteome Res. 2007, 6, 4469–4477. [Google Scholar] [CrossRef] [Green Version]
- Bertram, H.C.; Hoppe, C.; Petersen, B.O.; Duus, J.; Mølgaard, C.; Michaelsen, K.F. An nmr-based metabonomic investigation on effects of milk and meat protein diets given to 8-year-old boys. Br. J. Nutr. 2007, 97, 758–763. [Google Scholar] [CrossRef] [PubMed] [Green Version]
- Law, W.S.; Huang, P.Y.; Ong, E.S.; Ong, C.N.; Li, S.F.; Pasikanti, K.K.; Chan, E.C. Metabonomics investigation of human urine after ingestion of green tea with gas chromatography/mass spectrometry, liquid chromatography/mass spectrometry and (1)h nmr spectroscopy. Rapid Commun. Mass Spectrom. 2008, 22, 2436–2446. [Google Scholar] [CrossRef]
- Martin, F.P.; Rezzi, S.; Peré-Trepat, E.; Kamlage, B.; Collino, S.; Leibold, E.; Kastler, J.; Rein, D.; Fay, L.B.; Kochhar, S. Metabolic effects of dark chocolate consumption on energy, gut microbiota, and stress-related metabolism in free-living subjects. J. Proteome Res. 2009, 8, 5568–5579. [Google Scholar] [CrossRef]
- Ong, K.R.; Sims, A.H.; Harvie, M.; Chapman, M.; Dunn, W.B.; Broadhurst, D.; Goodacre, R.; Wilson, M.; Thomas, N.; Clarke, R.B.; et al. Biomarkers of dietary energy restriction in women at increased risk of breast cancer. Cancer Prev Res. 2009, 2, 720–731. [Google Scholar] [CrossRef] [Green Version]
- Toledo, E.; Wang, D.D.; Ruiz-Canela, M.; Clish, C.B.; Razquin, C.; Zheng, Y.; Guasch-Ferré, M.; Hruby, A.; Corella, D.; Gómez-Gracia, E.; et al. Plasma lipidomic profiles and cardiovascular events in a randomized intervention trial with the mediterranean diet. Am. J. Clin. Nutr. 2017, 106, 973–983. [Google Scholar] [CrossRef]
- Friedrich, N.; Pietzner, M.; Cannet, C.; Thuesen, B.H.; Hansen, T.; Wallaschofski, H.; Grarup, N.; Skaaby, T.; Budde, K.; Pedersen, O.; et al. Urinary metabolomics reveals glycemic and coffee associated signatures of thyroid function in two population-based cohorts. PLoS ONE 2017, 12, e0173078. [Google Scholar] [CrossRef] [PubMed]
- Wedekind, R.; Keski-Rahkonen, P.; Robinot, N.; Viallon, V.; Ferrari, P.; Engel, E.; Boutron-Ruault, M.C.; Mahamat-Saleh, Y.; Mancini, F.R.; Kühn, T.; et al. Syringol metabolites as new biomarkers for smoked meat intake. Am. J. Clin. Nutr. 2019, 110, 1424–1433. [Google Scholar] [CrossRef] [PubMed]
- Potischman, N. Biologic and methodologic issues for nutritional biomarkers. J. Nutr. 2003, 133 Suppl. S3, 875s–880s. [Google Scholar] [CrossRef] [Green Version]
- Sugimoto, M.; Wong, D.T.; Hirayama, A.; Soga, T.; Tomita, M. Capillary electrophoresis mass spectrometry-based saliva metabolomics identified oral, breast and pancreatic cancer-specific profiles. Metabolomics 2010, 6, 78–95. [Google Scholar] [CrossRef] [PubMed] [Green Version]
- Hofman, L.F. Human saliva as a diagnostic specimen. J. Nutr. 2001, 131, 1621s–1625s. [Google Scholar] [CrossRef] [PubMed]
- De Filippis, F.; Vannini, L.; La Storia, A.; Laghi, L.; Piombino, P.; Stellato, G.; Serrazanetti, D.I.; Gozzi, G.; Turroni, S.; Ferrocino, I.; et al. The same microbiota and a potentially discriminant metabolome in the saliva of omnivore, ovo-lacto-vegetarian and vegan individuals. PLoS ONE 2014, 9, e112373. [Google Scholar] [CrossRef] [Green Version]
- Mounayar, R.; Morzel, M.; Brignot, H.; Tremblay-Franco, M.; Canlet, C.; Lucchi, G.; Ducoroy, P.; Feron, G.; Neyraud, E. Nutri-metabolomics applied to taste perception phenotype: Human subjects with high and low sensitivity to taste of fat differ in salivary response to oleic acid. Omics 2014, 18, 666–672. [Google Scholar] [CrossRef]
- Isganaitis, E.; Venditti, S.; Matthews, T.J.; Lerin, C.; Demerath, E.W.; Fields, D.A. Maternal obesity and the human milk metabolome: Associations with infant body composition and postnatal weight gain. Am. J. Clin. Nutr. 2019, 110, 111–120. [Google Scholar] [CrossRef] [PubMed]
- Fleddermann, M.; Demmelmair, H.; Hellmuth, C.; Grote, V.; Trisic, B.; Nikolic, T.; Koletzko, B. Association of infant formula composition and anthropometry at 4 years: Follow-up of a randomized controlled trial (bemim study). PLoS ONE 2018, 13, e0199859. [Google Scholar] [CrossRef] [PubMed]
- Altmaier, E.; Kastenmüller, G.; Römisch-Margl, W.; Thorand, B.; Weinberger, K.M.; Illig, T.; Adamski, J.; Döring, A.; Suhre, K. Questionnaire-based self-reported nutrition habits associate with serum metabolism as revealed by quantitative targeted metabolomics. Eur. J. Epidemiol. 2011, 26, 145–156. [Google Scholar] [CrossRef] [PubMed] [Green Version]
- Gibbons, H.; McNulty, B.A.; Nugent, A.P.; Walton, J.; Flynn, A.; Gibney, M.J.; Brennan, L. A metabolomics approach to the identification of biomarkers of sugar-sweetened beverage intake. Am. J. Clin. Nutr. 2015, 101, 471–477. [Google Scholar] [CrossRef] [PubMed]
- Peron, G.; Hidalgo-Liberona, N.; González-Domínguez, R.; Garcia-Aloy, M.; Guglielmetti, S.; Bernardi, S.; Kirkup, B.; Kroon, P.A.; Cherubini, A.; Riso, P.; et al. Exploring the molecular pathways behind the effects of nutrients and dietary polyphenols on gut microbiota and intestinal permeability: A perspective on the potential of metabolomics and future clinical applications. J. Agric. Food Chem. 2020, 68, 1780–1789. [Google Scholar] [CrossRef]
- Wang, Y.X.; Wu, Y.; Chen, H.G.; Duan, P.; Wang, L.; Shen, H.Q.; Lu, W.Q.; Sun, B.; Wang, Q.; Zhang, B.; et al. Seminal plasma metabolome in relation to semen quality and urinary phthalate metabolites among chinese adult men. Environ. Int. 2019, 129, 354–363. [Google Scholar] [CrossRef] [PubMed]
- Shin, J.H.; Jung, S.; Kim, S.A.; Kang, M.S.; Kim, M.S.; Joung, H.; Hwang, G.S.; Shin, D.M. Differential effects of typical korean versus american-style diets on gut microbial composition and metabolic profile in healthy overweight koreans: A randomized crossover trial. Nutrients 2019, 11, 2450. [Google Scholar] [CrossRef] [PubMed] [Green Version]
- Mayengbam, S.; Lambert, J.E.; Parnell, J.A.; Tunnicliffe, J.M.; Nicolucci, A.C.; Han, J.; Sturzenegger, T.; Shearer, J.; Mickiewicz, B.; Vogel, H.J.; et al. Impact of dietary fiber supplementation on modulating microbiota-host-metabolic axes in obesity. J. Nutr. Biochem. 2019, 64, 228–236. [Google Scholar] [CrossRef]
- Kakkoura, M.G.; Sokratous, K.; Demetriou, C.A.; Loizidou, M.A.; Loucaides, G.; Kakouri, E.; Hadjisavvas, A.; Kyriacou, K. Mediterranean diet-gene interactions: A targeted metabolomics study in greek-cypriot women. Mol. Nutr. Food Res. 2017, 61, e1600558. [Google Scholar] [CrossRef] [PubMed]
- Lai, C.Q.; Smith, C.E.; Parnell, L.D.; Lee, Y.C.; Corella, D.; Hopkins, P.; Hidalgo, B.A.; Aslibekyan, S.; Province, M.A.; Absher, D.; et al. Epigenomics and metabolomics reveal the mechanism of the apoa2-saturated fat intake interaction affecting obesity. Am. J. Clin. Nutr. 2018, 108, 188–200. [Google Scholar] [CrossRef] [Green Version]
- Armah, C.N.; Traka, M.H.; Dainty, J.R.; Defernez, M.; Janssens, A.; Leung, W.; Doleman, J.F.; Potter, J.F.; Mithen, R.F. A diet rich in high-glucoraphanin broccoli interacts with genotype to reduce discordance in plasma metabolite profiles by modulating mitochondrial function. Am. J. Clin. Nutr. 2013, 98, 712–722. [Google Scholar] [CrossRef]
- Martin, F.P.; Montoliu, I.; Nagy, K.; Moco, S.; Collino, S.; Guy, P.; Redeuil, K.; Scherer, M.; Rezzi, S.; Kochhar, S. Specific dietary preferences are linked to differing gut microbial metabolic activity in response to dark chocolate intake. J. Proteome Res. 2012, 11, 6252–6263. [Google Scholar] [CrossRef] [PubMed]
- Pallister, T.; Sharafi, M.; Lachance, G.; Pirastu, N.; Mohney, R.P.; MacGregor, A.; Feskens, E.J.; Duffy, V.; Spector, T.D.; Menni, C. Food preference patterns in a uk twin cohort. Twin Res. Hum. Genet. 2015, 18, 793–805. [Google Scholar] [CrossRef] [PubMed] [Green Version]
- Malagelada, C.; Barba, I.; Accarino, A.; Molne, L.; Mendez, S.; Campos, E.; Gonzalez, A.; Alonso-Cotoner, C.; Santos, J.; Malagelada, J.R.; et al. Cognitive and hedonic responses to meal ingestion correlate with changes in circulating metabolites. Neurogastroenterol. Motil. 2016, 28, 1806–1814. [Google Scholar] [CrossRef] [PubMed]
- Gürdeniz, G.; Rago, D.; Bendsen, N.T.; Savorani, F.; Astrup, A.; Dragsted, L.O. Effect of trans fatty acid intake on lc-ms and nmr plasma profiles. PLoS ONE 2013, 8, e69589. [Google Scholar] [CrossRef] [PubMed] [Green Version]
- O’Sullivan, A.; Gibney, M.J.; Connor, A.O.; Mion, B.; Kaluskar, S.; Cashman, K.D.; Flynn, A.; Shanahan, F.; Brennan, L. Biochemical and metabolomic phenotyping in the identification of a vitamin d responsive metabotype for markers of the metabolic syndrome. Mol. Nutr. Food Res. 2011, 55, 679–690. [Google Scholar] [CrossRef]
- Fernández-Arroyo, S.; Gómez-Martínez, A.; Rocamora-Reverte, L.; Quirantes-Piné, R.; Segura-Carretero, A.; Fernández-Gutiérrez, A.; Ferragut, J.A. Application of nanolc-esi-tof-ms for the metabolomic analysis of phenolic compounds from extra-virgin olive oil in treated colon-cancer cells. J. Pharm. Biomed. Anal. 2012, 63, 128–134. [Google Scholar] [CrossRef]
- Edmands, W.M.; Ferrari, P.; Rothwell, J.A.; Rinaldi, S.; Slimani, N.; Barupal, D.K.; Biessy, C.; Jenab, M.; Clavel-Chapelon, F.; Fagherazzi, G.; et al. Polyphenol metabolome in human urine and its association with intake of polyphenol-rich foods across european countries. Am. J. Clin. Nutr. 2015, 102, 905–913. [Google Scholar] [CrossRef] [Green Version]
- Zambrana, L.E.; McKeen, S.; Ibrahim, H.; Zarei, I.; Borresen, E.C.; Doumbia, L.; Boré, A.; Cissoko, A.; Douyon, S.; Koné, K.; et al. Rice bran supplementation modulates growth, microbiota and metabolome in weaning infants: A clinical trial in nicaragua and mali. Sci. Rep. 2019, 9, 13919. [Google Scholar] [CrossRef] [PubMed] [Green Version]
- Baldrick, F.R.; McFadden, K.; Ibars, M.; Sung, C.; Moffatt, T.; Megarry, K.; Thomas, K.; Mitchell, P.; Wallace, J.M.W.; Pourshahidi, L.K.; et al. Impact of a (poly)phenol-rich extract from the brown algae ascophyllum nodosum on DNA damage and antioxidant activity in an overweight or obese population: A randomized controlled trial. Am. J. Clin. Nutr. 2018, 108, 688–700. [Google Scholar] [CrossRef]
- Smit, S.; Szymańska, E.; Kunz, I.; Gomez Roldan, V.; van Tilborg, M.W.; Weber, P.; Prudence, K.; van der Kloet, F.M.; van Duynhoven, J.P.; Smilde, A.K.; et al. Nutrikinetic modeling reveals order of genistein phase ii metabolites appearance in human plasma. Mol. Nutr. Food Res. 2014, 58, 2111–2121. [Google Scholar] [CrossRef] [Green Version]
- Nuñez-Sánchez, M.A.; García-Villalba, R.; Monedero-Saiz, T.; García-Talavera, N.V.; Gómez-Sánchez, M.B.; Sánchez-Álvarez, C.; García-Albert, A.M.; Rodríguez-Gil, F.J.; Ruiz-Marín, M.; Pastor-Quirante, F.A.; et al. Targeted metabolic profiling of pomegranate polyphenols and urolithins in plasma, urine and colon tissues from colorectal cancer patients. Mol. Nutr. Food Res. 2014, 58, 1199–1211. [Google Scholar] [CrossRef] [PubMed]
- Miller, J.A.; Pappan, K.; Thompson, P.A.; Want, E.J.; Siskos, A.P.; Keun, H.C.; Wulff, J.; Hu, C.; Lang, J.E.; Chow, H.H. Plasma metabolomic profiles of breast cancer patients after short-term limonene intervention. Cancer Prev. Res. 2015, 8, 86–93. [Google Scholar] [CrossRef] [PubMed] [Green Version]
- García-Villalba, R.; Tomás-Barberán, F.A.; Fança-Berthon, P.; Roller, M.; Zafrilla, P.; Issaly, N.; García-Conesa, M.T. Targeted and untargeted metabolomics to explore the bioavailability of the secoiridoids from a seed/fruit extract (fraxinus angustifolia vahl) in human healthy volunteers: A preliminary study. Molecules 2015, 20, 22202–22219. [Google Scholar] [CrossRef] [Green Version]
- Yu, D.; Shu, X.O.; Rivera, E.S.; Zhang, X.; Cai, Q.; Calcutt, M.W.; Xiang, Y.B.; Li, H.; Gao, Y.T.; Wang, T.J.; et al. Urinary levels of trimethylamine-n-oxide and incident coronary heart disease: A prospective investigation among urban chinese adults. J. Am. Heart Assoc. 2019, 8, e010606. [Google Scholar] [CrossRef] [PubMed] [Green Version]
- Manor, O.; Zubair, N.; Conomos, M.P.; Xu, X.; Rohwer, J.E.; Krafft, C.E.; Lovejoy, J.C.; Magis, A.T. A multi-omic association study of trimethylamine n-oxide. Cell Rep. 2018, 24, 935–946. [Google Scholar] [CrossRef] [Green Version]
- Cheung, W.; Keski-Rahkonen, P.; Assi, N.; Ferrari, P.; Freisling, H.; Rinaldi, S.; Slimani, N.; Zamora-Ros, R.; Rundle, M.; Frost, G.; et al. A metabolomic study of biomarkers of meat and fish intake. Am. J. Clin. Nutr. 2017, 105, 600–608. [Google Scholar] [CrossRef]
- Shibutami, E.; Ishii, R.; Harada, S.; Kurihara, A.; Kuwabara, K.; Kato, S.; Iida, M.; Akiyama, M.; Sugiyama, D.; Hirayama, A.; et al. Charged metabolite biomarkers of food intake assessed via plasma metabolomics in a population-based observational study in japan. PLoS ONE 2021, 16, e0246456. [Google Scholar] [CrossRef]
- Playdon, M.C.; Sampson, J.N.; Cross, A.J.; Sinha, R.; Guertin, K.A.; Moy, K.A.; Rothman, N.; Irwin, M.L.; Mayne, S.T.; Stolzenberg-Solomon, R.; et al. Comparing metabolite profiles of habitual diet in serum and urine. Am. J. Clin. Nutr. 2016, 104, 776–789. [Google Scholar] [CrossRef] [Green Version]
- Lloyd, A.J.; Beckmann, M.; Favé, G.; Mathers, J.C.; Draper, J. Proline betaine and its biotransformation products in fasting urine samples are potential biomarkers of habitual citrus fruit consumption. Br. J. Nutr. 2011, 106, 812–824. [Google Scholar] [CrossRef] [Green Version]
- Gibbons, H.; Michielsen, C.J.R.; Rundle, M.; Frost, G.; McNulty, B.A.; Nugent, A.P.; Walton, J.; Flynn, A.; Gibney, M.J.; Brennan, L. Demonstration of the utility of biomarkers for dietary intake assessment; proline betaine as an example. Mol. Nutr. Food Res. 2017, 61, e1700037. [Google Scholar] [CrossRef] [Green Version]
- Larmo, P.S.; Kangas, A.J.; Soininen, P.; Lehtonen, H.M.; Suomela, J.P.; Yang, B.; Viikari, J.; Ala-Korpela, M.; Kallio, H.P. Effects of sea buckthorn and bilberry on serum metabolites differ according to baseline metabolic profiles in overweight women: A randomized crossover trial. Am. J. Clin. Nutr. 2013, 98, 941–951. [Google Scholar] [CrossRef] [PubMed] [Green Version]
- De Mello, V.D.; Lankinen, M.A.; Lindström, J.; Puupponen-Pimiä, R.; Laaksonen, D.E.; Pihlajamäki, J.; Lehtonen, M.; Uusitupa, M.; Tuomilehto, J.; Kolehmainen, M.; et al. Fasting serum hippuric acid is elevated after bilberry (vaccinium myrtillus) consumption and associates with improvement of fasting glucose levels and insulin secretion in persons at high risk of developing type 2 diabetes. Mol. Nutr. Food Res. 2017, 61, e1700019. [Google Scholar] [CrossRef] [PubMed]
- Rothwell, J.A.; Fillâtre, Y.; Martin, J.F.; Lyan, B.; Pujos-Guillot, E.; Fezeu, L.; Hercberg, S.; Comte, B.; Galan, P.; Touvier, M.; et al. New biomarkers of coffee consumption identified by the non-targeted metabolomic profiling of cohort study subjects. PLoS ONE 2014, 9, e93474. [Google Scholar] [CrossRef] [Green Version]
- Guertin, K.A.; Loftfield, E.; Boca, S.M.; Sampson, J.N.; Moore, S.C.; Xiao, Q.; Huang, W.Y.; Xiong, X.; Freedman, N.D.; Cross, A.J.; et al. Serum biomarkers of habitual coffee consumption may provide insight into the mechanism underlying the association between coffee consumption and colorectal cancer. Am. J. Clin. Nutr. 2015, 101, 1000–1011. [Google Scholar] [CrossRef]
- Neacsu, M.; McMonagle, J.; Fletcher, R.J.; Hulshof, T.; Duncan, S.H.; Scobbie, L.; Duncan, G.J.; Cantlay, L.; Horgan, G.; de Roos, B.; et al. Availability and dose response of phytophenols from a wheat bran rich cereal product in healthy human volunteers. Mol. Nutr. Food Res. 2017, 61, e1600202. [Google Scholar] [CrossRef] [Green Version]
- Keski-Rahkonen, P.; Kolehmainen, M.; Lappi, J.; Micard, V.; Jokkala, J.; Rosa-Sibakov, N.; Pihlajamäki, J.; Kirjavainen, P.V.; Mykkänen, H.; Poutanen, K.; et al. Decreased plasma serotonin and other metabolite changes in healthy adults after consumption of wholegrain rye: An untargeted metabolomics study. Am. J. Clin. Nutr. 2019, 109, 1630–1639. [Google Scholar] [CrossRef]
- Cuparencu, C.; Rinnan, Å.; Dragsted, L.O. Combined markers to assess meat intake-human metabolomic studies of discovery and validation. Mol. Nutr. Food Res. 2019, 63, e1900106. [Google Scholar] [CrossRef]
- Wei, R.; Ross, A.B.; Su, M.; Wang, J.; Guiraud, S.P.; Draper, C.F.; Beaumont, M.; Jia, W.; Martin, F.P. Metabotypes related to meat and vegetable intake reflect microbial, lipid and amino acid metabolism in healthy people. Mol. Nutr. Food Res. 2018, 62, e1800583. [Google Scholar] [CrossRef]
- Playdon, M.C.; Moore, S.C.; Derkach, A.; Reedy, J.; Subar, A.F.; Sampson, J.N.; Albanes, D.; Gu, F.; Kontto, J.; Lassale, C.; et al. Identifying biomarkers of dietary patterns by using metabolomics. Am. J. Clin. Nutr. 2017, 105, 450–465. [Google Scholar] [CrossRef] [Green Version]
- McCullough, M.L.; Maliniak, M.L.; Stevens, V.L.; Carter, B.D.; Hodge, R.A.; Wang, Y. Metabolomic markers of healthy dietary patterns in us postmenopausal women. Am. J. Clin. Nutr. 2019, 109, 1439–1451. [Google Scholar] [CrossRef] [PubMed]
- Navarro, S.L.; Tarkhan, A.; Shojaie, A.; Randolph, T.W.; Gu, H.; Djukovic, D.; Osterbauer, K.J.; Hullar, M.A.; Kratz, M.; Neuhouser, M.L.; et al. Plasma metabolomics profiles suggest beneficial effects of a low-glycemic load dietary pattern on inflammation and energy metabolism. Am. J. Clin. Nutr. 2019, 110, 984–992. [Google Scholar] [CrossRef]
- Hernández-Alonso, P.; Giardina, S.; Cañueto, D.; Salas-Salvadó, J.; Cañellas, N.; Bulló, M. Changes in plasma metabolite concentrations after a low-glycemic index diet intervention. Mol. Nutr. Food Res. 2019, 63, e1700975. [Google Scholar] [CrossRef] [Green Version]
- Rådjursöga, M.; Lindqvist, H.M.; Pedersen, A.; Karlsson, B.G.; Malmodin, D.; Ellegård, L.; Winkvist, A. Nutritional metabolomics: Postprandial response of meals relating to vegan, lacto-ovo vegetarian, and omnivore diets. Nutrients 2018, 10, 1063. [Google Scholar] [CrossRef] [Green Version]
- Draper, C.F.; Tini, G.; Vassallo, I.; Godin, J.P.; Su, M.; Jia, W.; Beaumont, M.; Moco, S.; Martin, F.P. Vegan and animal meal composition and timing influence glucose and lipid related postprandial metabolic profiles. Mol. Nutr. Food Res. 2019, 63, e1800568. [Google Scholar] [CrossRef] [PubMed]
- Wang, F.; Wan, Y.; Yin, K.; Wei, Y.; Wang, B.; Yu, X.; Ni, Y.; Zheng, J.; Huang, T.; Song, M.; et al. Lower circulating branched-chain amino acid concentrations among vegetarians are associated with changes in gut microbial composition and function. Mol. Nutr. Food Res. 2019, 63, e1900612. [Google Scholar] [CrossRef]
- Yap, I.K.; Brown, I.J.; Chan, Q.; Wijeyesekera, A.; Garcia-Perez, I.; Bictash, M.; Loo, R.L.; Chadeau-Hyam, M.; Ebbels, T.; De Iorio, M.; et al. Metabolome-wide association study identifies multiple biomarkers that discriminate north and south chinese populations at differing risks of cardiovascular disease: Intermap study. J. Proteome Res. 2010, 9, 6647–6654. [Google Scholar] [CrossRef] [Green Version]
- Walsh, M.C.; McLoughlin, G.A.; Roche, H.M.; Ferguson, J.F.; Drevon, C.A.; Saris, W.H.; Lovegrove, J.A.; Risérus, U.; López-Miranda, J.; Defoort, C.; et al. Impact of geographical region on urinary metabolomic and plasma fatty acid profiles in subjects with the metabolic syndrome across europe: The lipgene study. Br. J. Nutr. 2014, 111, 424–431. [Google Scholar] [CrossRef]
- Trimigno, A.; Khakimov, B.; Savorani, F.; Tenori, L.; Hendrixson, V.; Čivilis, A.; Glibetic, M.; Gurinovic, M.; Pentikäinen, S.; Sallinen, J.; et al. Investigation of variations in the human urine metabolome amongst european populations: An exploratory search for biomarkers of people at risk-of-poverty. Mol. Nutr. Food Res. 2019, 63, e1800216. [Google Scholar] [CrossRef] [PubMed] [Green Version]
- Meyer, A.; Montastier, E.; Hager, J.; Saris, W.H.M.; Astrup, A.; Viguerie, N.; Valsesia, A. Plasma metabolites and lipids predict insulin sensitivity improvement in obese, nondiabetic individuals after a 2-phase dietary intervention. Am. J. Clin. Nutr. 2018, 108, 13–23. [Google Scholar] [CrossRef] [PubMed]
- Zheng, Y.; Yu, B.; Alexander, D.; Steffen, L.M.; Boerwinkle, E. Human metabolome associates with dietary intake habits among african americans in the atherosclerosis risk in communities study. Am. J. Epidemiol. 2014, 179, 1424–1433. [Google Scholar] [CrossRef] [PubMed] [Green Version]
- Steck, S.E.; Murphy, E.A. Dietary patterns and cancer risk. Nat. Rev. Cancer 2020, 20, 125–138. [Google Scholar] [CrossRef]
- Moazzami, A.A.; Zhang, J.X.; Kamal-Eldin, A.; Aman, P.; Hallmans, G.; Johansson, J.E.; Andersson, S.O. Nuclear magnetic resonance-based metabolomics enable detection of the effects of a whole grain rye and rye bran diet on the metabolic profile of plasma in prostate cancer patients. J. Nutr. 2011, 141, 2126–2132. [Google Scholar] [CrossRef]
- Baxter, B.A.; Oppel, R.C.; Ryan, E.P. Navy beans impact the stool metabolome and metabolic pathways for colon health in cancer survivors. Nutrients 2018, 11, 28. [Google Scholar] [CrossRef] [PubMed] [Green Version]
- Pan, P.; Skaer, C.W.; Stirdivant, S.M.; Young, M.R.; Stoner, G.D.; Lechner, J.F.; Huang, Y.W.; Wang, L.S. Beneficial regulation of metabolic profiles by black raspberries in human colorectal cancer patients. Cancer Prev Res. 2015, 8, 743–750. [Google Scholar] [CrossRef] [PubMed] [Green Version]
- Playdon, M.C.; Ziegler, R.G.; Sampson, J.N.; Stolzenberg-Solomon, R.; Thompson, H.J.; Irwin, M.L.; Mayne, S.T.; Hoover, R.N.; Moore, S.C. Nutritional metabolomics and breast cancer risk in a prospective study. Am. J. Clin. Nutr. 2017, 106, 637–649. [Google Scholar] [CrossRef]
- Beynon, R.A.; Richmond, R.C.; Santos Ferreira, D.L.; Ness, A.R.; May, M.; Smith, G.D.; Vincent, E.E.; Adams, C.; Ala-Korpela, M.; Würtz, P.; et al. Investigating the effects of lycopene and green tea on the metabolome of men at risk of prostate cancer: The prodiet randomised controlled trial. Int. J. Cancer 2019, 144, 1918–1928. [Google Scholar] [CrossRef] [PubMed] [Green Version]
- Landberg, R.; Hanhineva, K. Biomarkers of a healthy nordic diet-from dietary exposure biomarkers to microbiota signatures in the metabolome. Nutrients 2019, 12, 27. [Google Scholar] [CrossRef] [PubMed] [Green Version]
- Dragsted, L.O.; Gao, Q.; Praticò, G.; Manach, C.; Wishart, D.S.; Scalbert, A.; Feskens, E.J.M. Dietary and health biomarkers-time for an update. Genes Nutr. 2017, 12, 24. [Google Scholar] [CrossRef] [Green Version]
- Picó, C.; Serra, F.; Rodríguez, A.M.; Keijer, J.; Palou, A. Biomarkers of nutrition and health: New tools for new approaches. Nutrients 2019, 11, 1092. [Google Scholar] [CrossRef] [Green Version]
- Maruvada, P.; Lampe, J.W.; Wishart, D.S.; Barupal, D.; Chester, D.N.; Dodd, D.; Djoumbou-Feunang, Y.; Dorrestein, P.C.; Dragsted, L.O.; Draper, J.; et al. Perspective: Dietary biomarkers of intake and exposure-exploration with omics approaches. Adv. Nutr. 2020, 11, 200–215. [Google Scholar] [CrossRef] [PubMed]
- Biesalski, H.K.; Dragsted, L.O.; Elmadfa, I.; Grossklaus, R.; Müller, M.; Schrenk, D.; Walter, P.; Weber, P. Bioactive compounds: Definition and assessment of activity. Nutrition 2009, 25, 1202–1205. [Google Scholar] [CrossRef]
- Heinzmann, S.S.; Merrifield, C.A.; Rezzi, S.; Kochhar, S.; Lindon, J.C.; Holmes, E.; Nicholson, J.K. Stability and robustness of human metabolic phenotypes in response to sequential food challenges. J. Proteome Res. 2012, 11, 643–655. [Google Scholar] [CrossRef]
- Dror, Y.; Almashanu, S.; Lubart, E.; Sela, B.A.; Shimoni, L.; Segal, R. The impact of refeeding on blood fatty acids and amino acid profiles in elderly patients: A metabolomic analysis. JPEN J. Parenter. Enteral. Nutr. 2013, 37, 109–116. [Google Scholar] [CrossRef]
- Badoud, F.; Lam, K.P.; Perreault, M.; Zulyniak, M.A.; Britz-McKibbin, P.; Mutch, D.M. Metabolomics reveals metabolically healthy and unhealthy obese individuals differ in their response to a caloric challenge. PLoS ONE 2015, 10, e0134613. [Google Scholar] [CrossRef] [Green Version]
- Liu, L.; Feng, R.; Guo, F.; Li, Y.; Jiao, J.; Sun, C. Targeted metabolomic analysis reveals the association between the postprandial change in palmitic acid, branched-chain amino acids and insulin resistance in young obese subjects. Diabetes Res. Clin. Pract. 2015, 108, 84–93. [Google Scholar] [CrossRef]
- Geidenstam, N.; Danielsson, A.P.; Spégel, P.; Ridderstråle, M. Changes in glucose-elicited blood metabolite responses following weight loss and long term weight maintenance in obese individuals with impaired glucose tolerance. Diabetes Res. Clin. Pract. 2016, 113, 187–197. [Google Scholar] [CrossRef]
- Shrestha, A.; Müllner, E.; Poutanen, K.; Mykkänen, H.; Moazzami, A.A. Metabolic changes in serum metabolome in response to a meal. Eur. J. Nutr. 2017, 56, 671–681. [Google Scholar] [CrossRef]
- Fiamoncini, J.; Rundle, M.; Gibbons, H.; Thomas, E.L.; Geillinger-Kästle, K.; Bunzel, D.; Trezzi, J.P.; Kiselova-Kaneva, Y.; Wopereis, S.; Wahrheit, J.; et al. Plasma metabolome analysis identifies distinct human metabotypes in the postprandial state with different susceptibility to weight loss-mediated metabolic improvements. FASEB J. 2018, 32, 5447–5458. [Google Scholar] [CrossRef] [Green Version]
- Malagelada, C.; Pribic, T.; Ciccantelli, B.; Cañellas, N.; Gomez, J.; Amigo, N.; Accarino, A.; Correig, X.; Azpiroz, F. Metabolomic signature of the postprandial experience. Neurogastroenterol. Motil. 2018, 30, e13447. [Google Scholar] [CrossRef]
- Takahashi, M.; Ozaki, M.; Kang, M.I.; Sasaki, H.; Fukazawa, M.; Iwakami, T.; Lim, P.J.; Kim, H.K.; Aoyama, S.; Shibata, S. Effects of meal timing on postprandial glucose metabolism and blood metabolites in healthy adults. Nutrients 2018, 10, 1763. [Google Scholar] [CrossRef] [Green Version]


| Medline Search | |
|---|---|
| Search engine | PubMed |
| Keywords 1 Search formula | (metabolomics OR metabonomics) AND (nutrition OR food OR diet OR meal OR intake OR consumption) |
| Species | Humans |
| Publication date | 2000–2019 |
| Publication type | Excluding: review/systematic review |
| Year | Author | Research Focus | Design 1 | n2 | Sex | Biofluid 3 | Method 4 | Ref. |
|---|---|---|---|---|---|---|---|---|
| 2003 | Lenz, et al. | Biofluid comparison | NRCT | 12 | M | U, P | NMR | [14] |
| Solanky, et al. | Isoflavone intake | NRCT | 5 | F | P | NMR | [22] | |
| 2004 | Teague, et al. | Alcohol (ethyl glucoside) consumption | NRCT | 2 | FM | U | NMR | [24] |
| Lenz, et al. | Diurnal fluctuation/regional difference | CSR/CS | 30/120 | FM | U | NMR | [15] | |
| 2005 | Wang, et al. | Chamomile tea consumption | NRCT | 14 | FM | U | NMR | [17] |
| Solanky, et al. | Isoflavones intake | NRCT | 9 | F | U | NMR | [25] | |
| 2006 | Van Dorsten, et al. | Green tea/black tea consumption | RCT-CO | 17 | M | U | NMR | [18] |
| Stella, et al. | Meat diet/vegetarian | RCT-CO | 12 | M | U | NMR | [26] | |
| Walsh, et al. | Biofluid comparison | NRCT | 30 | FM | U, P, SV | NMR, MS | [16] | |
| 2007 | Rezzi, et al. | Dietary preferences | RCT-CO | 22 | FM | U, P | NMR | [27] |
| Bertram, et al. | Milk/meat protein for child nutrition | RCT-P | 24 | M | U, S | NMR | [28] | |
| Walsh, et al. | Phytochemical intake | NRCT | 21 | FM | U | NMR, MS | [23] | |
| 2008 | Law, et al. | Data comparison between different analytical methods | NRCT | 8 | M | U | NMR, LC-MS, GC-MS | [29] |
| 2009 | Martin, et al. | Dietary preferences and anxiety trait | RCT-P | 30 | U, P | NMR, MS | [30] | |
| Stalmach, et al. | Coffee consumption | NRCT | 11 | FM | U, P | LC-MS | [19] | |
| Llorach, et al. | Cocoa consumption | RCT-CO | 10 | FM | U | LC-MS | [21] | |
| Ong, et al. | Energy restriction on breast cancer | RCT-P | 19 | F | U, S | GC-MS | [31] | |
| Altmaier, et al. | Coffee consumption | CS | 284 | M | S | LC-MS, MS | [20] |
| Large-Scale Epidemiological Study | Population | Nutrimetabolomics Focus |
|---|---|---|
| Alpha-Tocopherol, Beta-Carotene Cancer Prevention study (ATBC) | Finland | Beta -carotene (2013), vitamin D (2016), diet indexes (2017) |
| Atherosclerosis Risk in Communities Study (ARIC) | USA | Dietary habits among African Americans (2014), alcohol (2016) |
| Cancer Prevention Study-II Nutrition Cohort (CPS- II Nutrition) | USA | Food group (2018), dietary indexes (2019) |
| Cardiovascular disease, Living, and Ageing in Halle (CARLA) | Germany | Effects of fasting time (2018) |
| Cooperative Health Research in the Region Augsburg (KORA) | Germany | Self-reported dietary habits (2011), fecal sterols (2019) |
| European Prospective Investigation into Cancer and Nutrition (EPIC) | 10 European countries | Dietary pattern (2013, 2015, 2017), wholegrains (2014), meat/fish (2015,2017), alcohol (2018, 2019), coffee (2019), smoked meat (2019) |
| Finnish Dietary, Lifestyle, and Genetic Determinants of Obesity and Metabolic Syndrome (DILGOM) | Finland | Food neophobia (2019) |
| International Study on Major Nutrients and Micronutrients and Blood Pressure (INTERMAP) | UK, USA, China, Japan | Phenotype diversity (2008), fruit/proline betaine (2010), Chinese population (2010), African Americans (2013), WHO healthy (2019) |
| Nurses’ Health Study (NHS) | USA | Branched-chain amino acids (2018), nuts (2019) |
| Prevención con Dieta Mediterránea (PREDIMED) | Spain | MED effects (2015), CVD risk (2016, 2017), nuts (2014), pulse (2017), coffee/cocoa (2015, 2019), red wine (2019), choline pathway (2017) |
| Special Turku Coronary Risk Factor Intervention Project (STRIP) | Finland | Dietary counseling (2018) |
| STORK-Groruddalen cohort study (STORK) | Norway | Breastfeeding (2014) |
| Systems biology in Controlled Dietary Interventions and Cohort Studies (SYSDIET) | 5 Nordic countries | Healthy Nordic diet (2019) |
| TwinsUK Study (TwinsUK) | UK | Food preference (2015), self-reporting (2016), dairy (2017), omega-3 fatty acid (2017), gut microbiota (2017) |
Publisher’s Note: MDPI stays neutral with regard to jurisdictional claims in published maps and institutional affiliations. |
© 2021 by the authors. Licensee MDPI, Basel, Switzerland. This article is an open access article distributed under the terms and conditions of the Creative Commons Attribution (CC BY) license (https://creativecommons.org/licenses/by/4.0/).
Share and Cite
Shibutami, E.; Takebayashi, T. A Scoping Review of the Application of Metabolomics in Nutrition Research: The Literature Survey 2000–2019. Nutrients 2021, 13, 3760. https://doi.org/10.3390/nu13113760
Shibutami E, Takebayashi T. A Scoping Review of the Application of Metabolomics in Nutrition Research: The Literature Survey 2000–2019. Nutrients. 2021; 13(11):3760. https://doi.org/10.3390/nu13113760
Chicago/Turabian StyleShibutami, Eriko, and Toru Takebayashi. 2021. "A Scoping Review of the Application of Metabolomics in Nutrition Research: The Literature Survey 2000–2019" Nutrients 13, no. 11: 3760. https://doi.org/10.3390/nu13113760
APA StyleShibutami, E., & Takebayashi, T. (2021). A Scoping Review of the Application of Metabolomics in Nutrition Research: The Literature Survey 2000–2019. Nutrients, 13(11), 3760. https://doi.org/10.3390/nu13113760