
The Effect of Dietary Supplements on Oxidative Stress in Pregnant Women with Gestational Diabetes Mellitus: A Network Meta-Analysis

 , ,
, ,
Abstract
:1. Introduction
2. Materials and Methods
2.1. Reporting Guideline and Registration
2.2. Inclusion Criteria
2.3. Exclusion Criteria
2.4. Primary Outcome Measures
2.5. Secondary Outcome Measures
2.6. Search Methods
2.7. Study Selection
2.8. Data Extraction
2.9. Risk of Bias
2.10. Geometry of the Networks
2.11. Assessment of Transitivity
2.12. Statistical Analysis
2.13. Assessment of Inconsistency
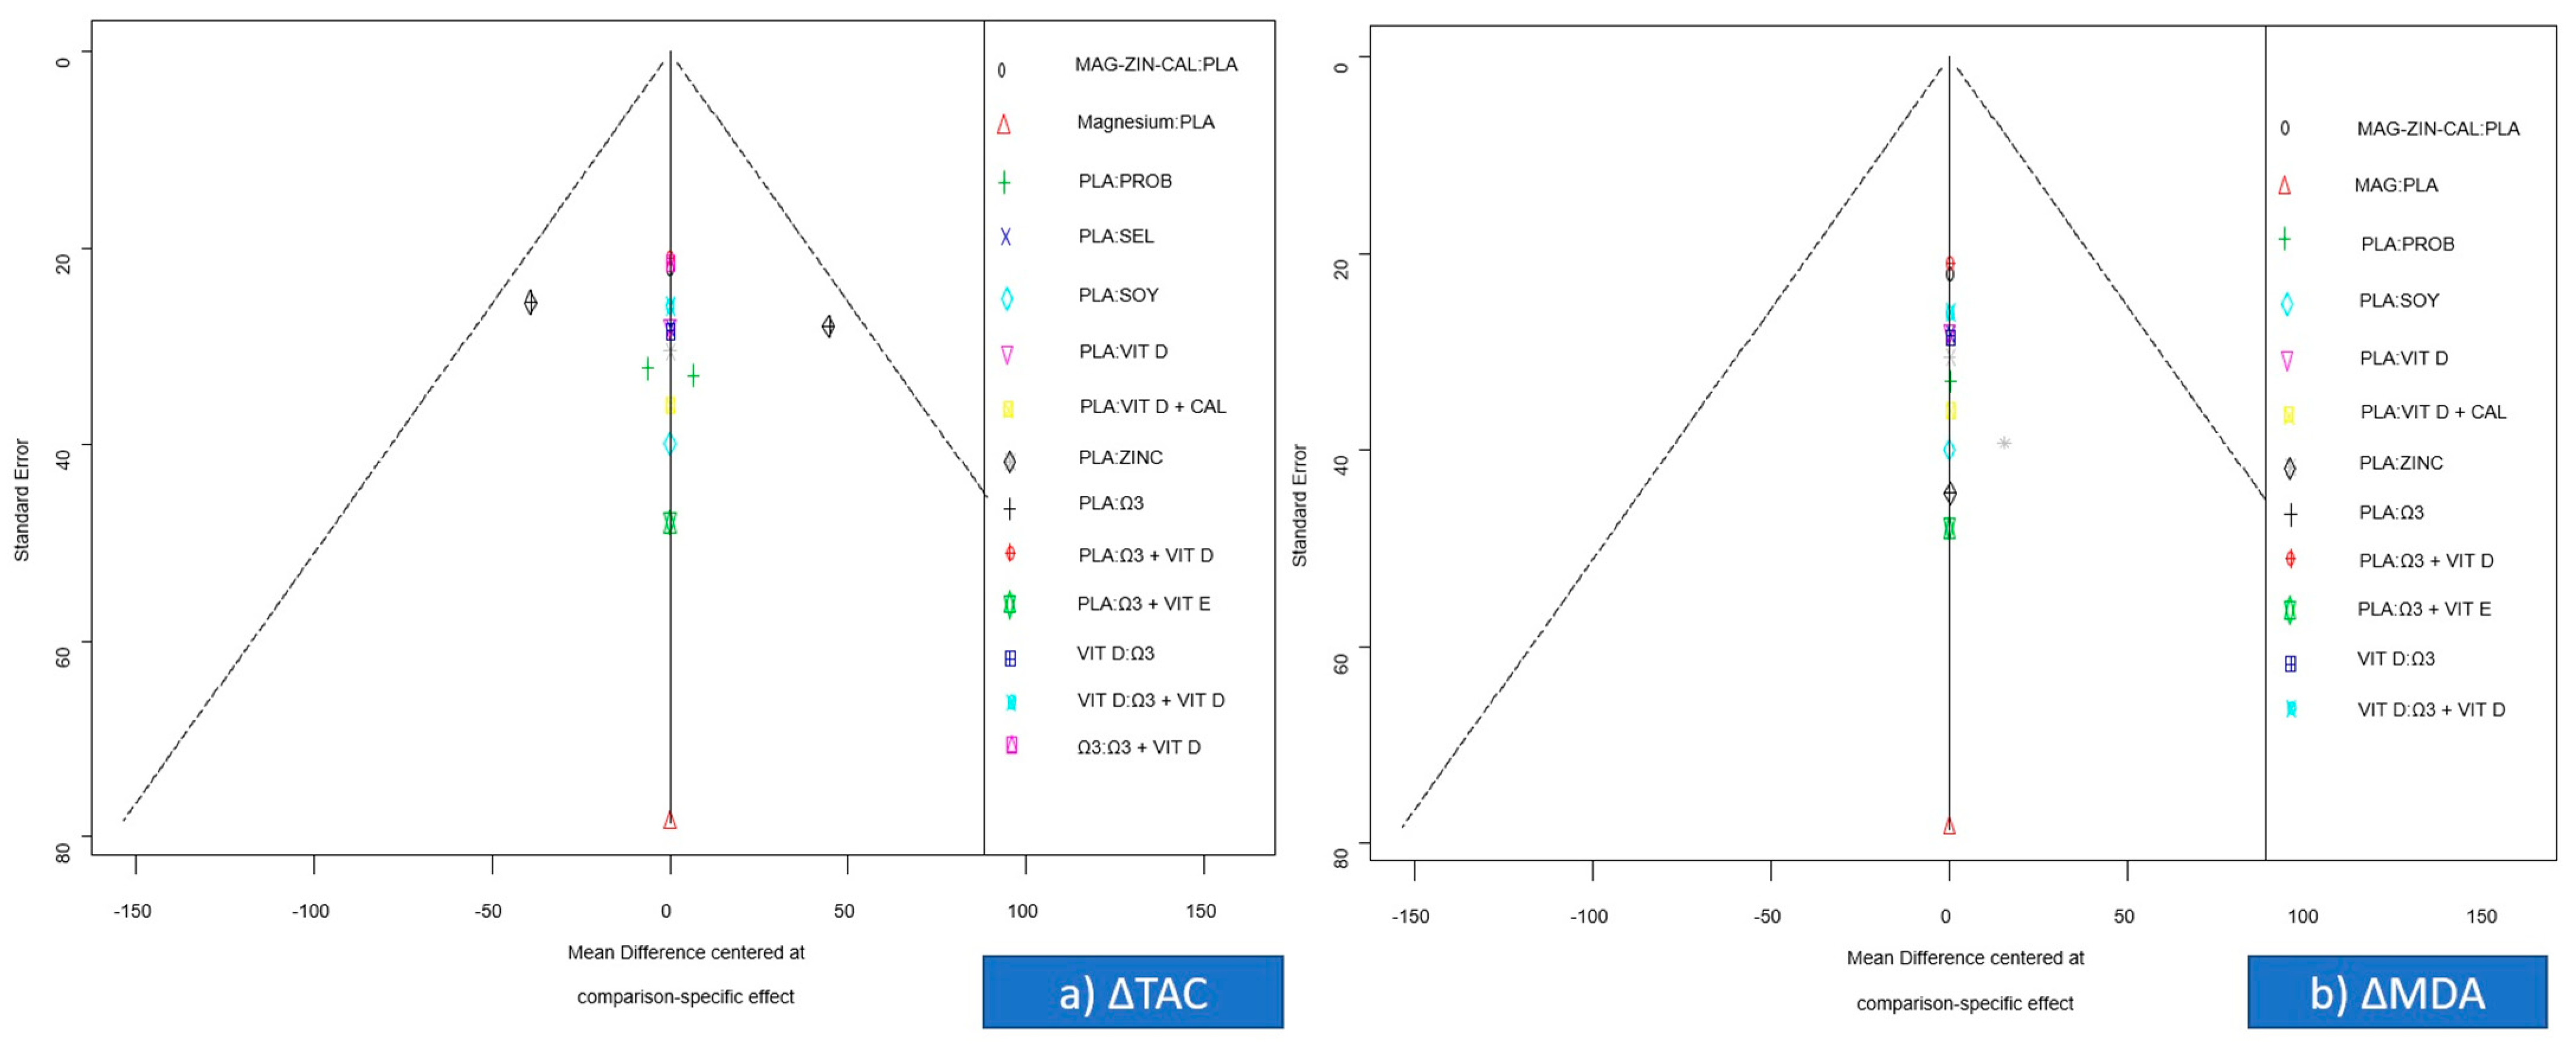
2.14. Assessment of Small-Study Effects
3. Results
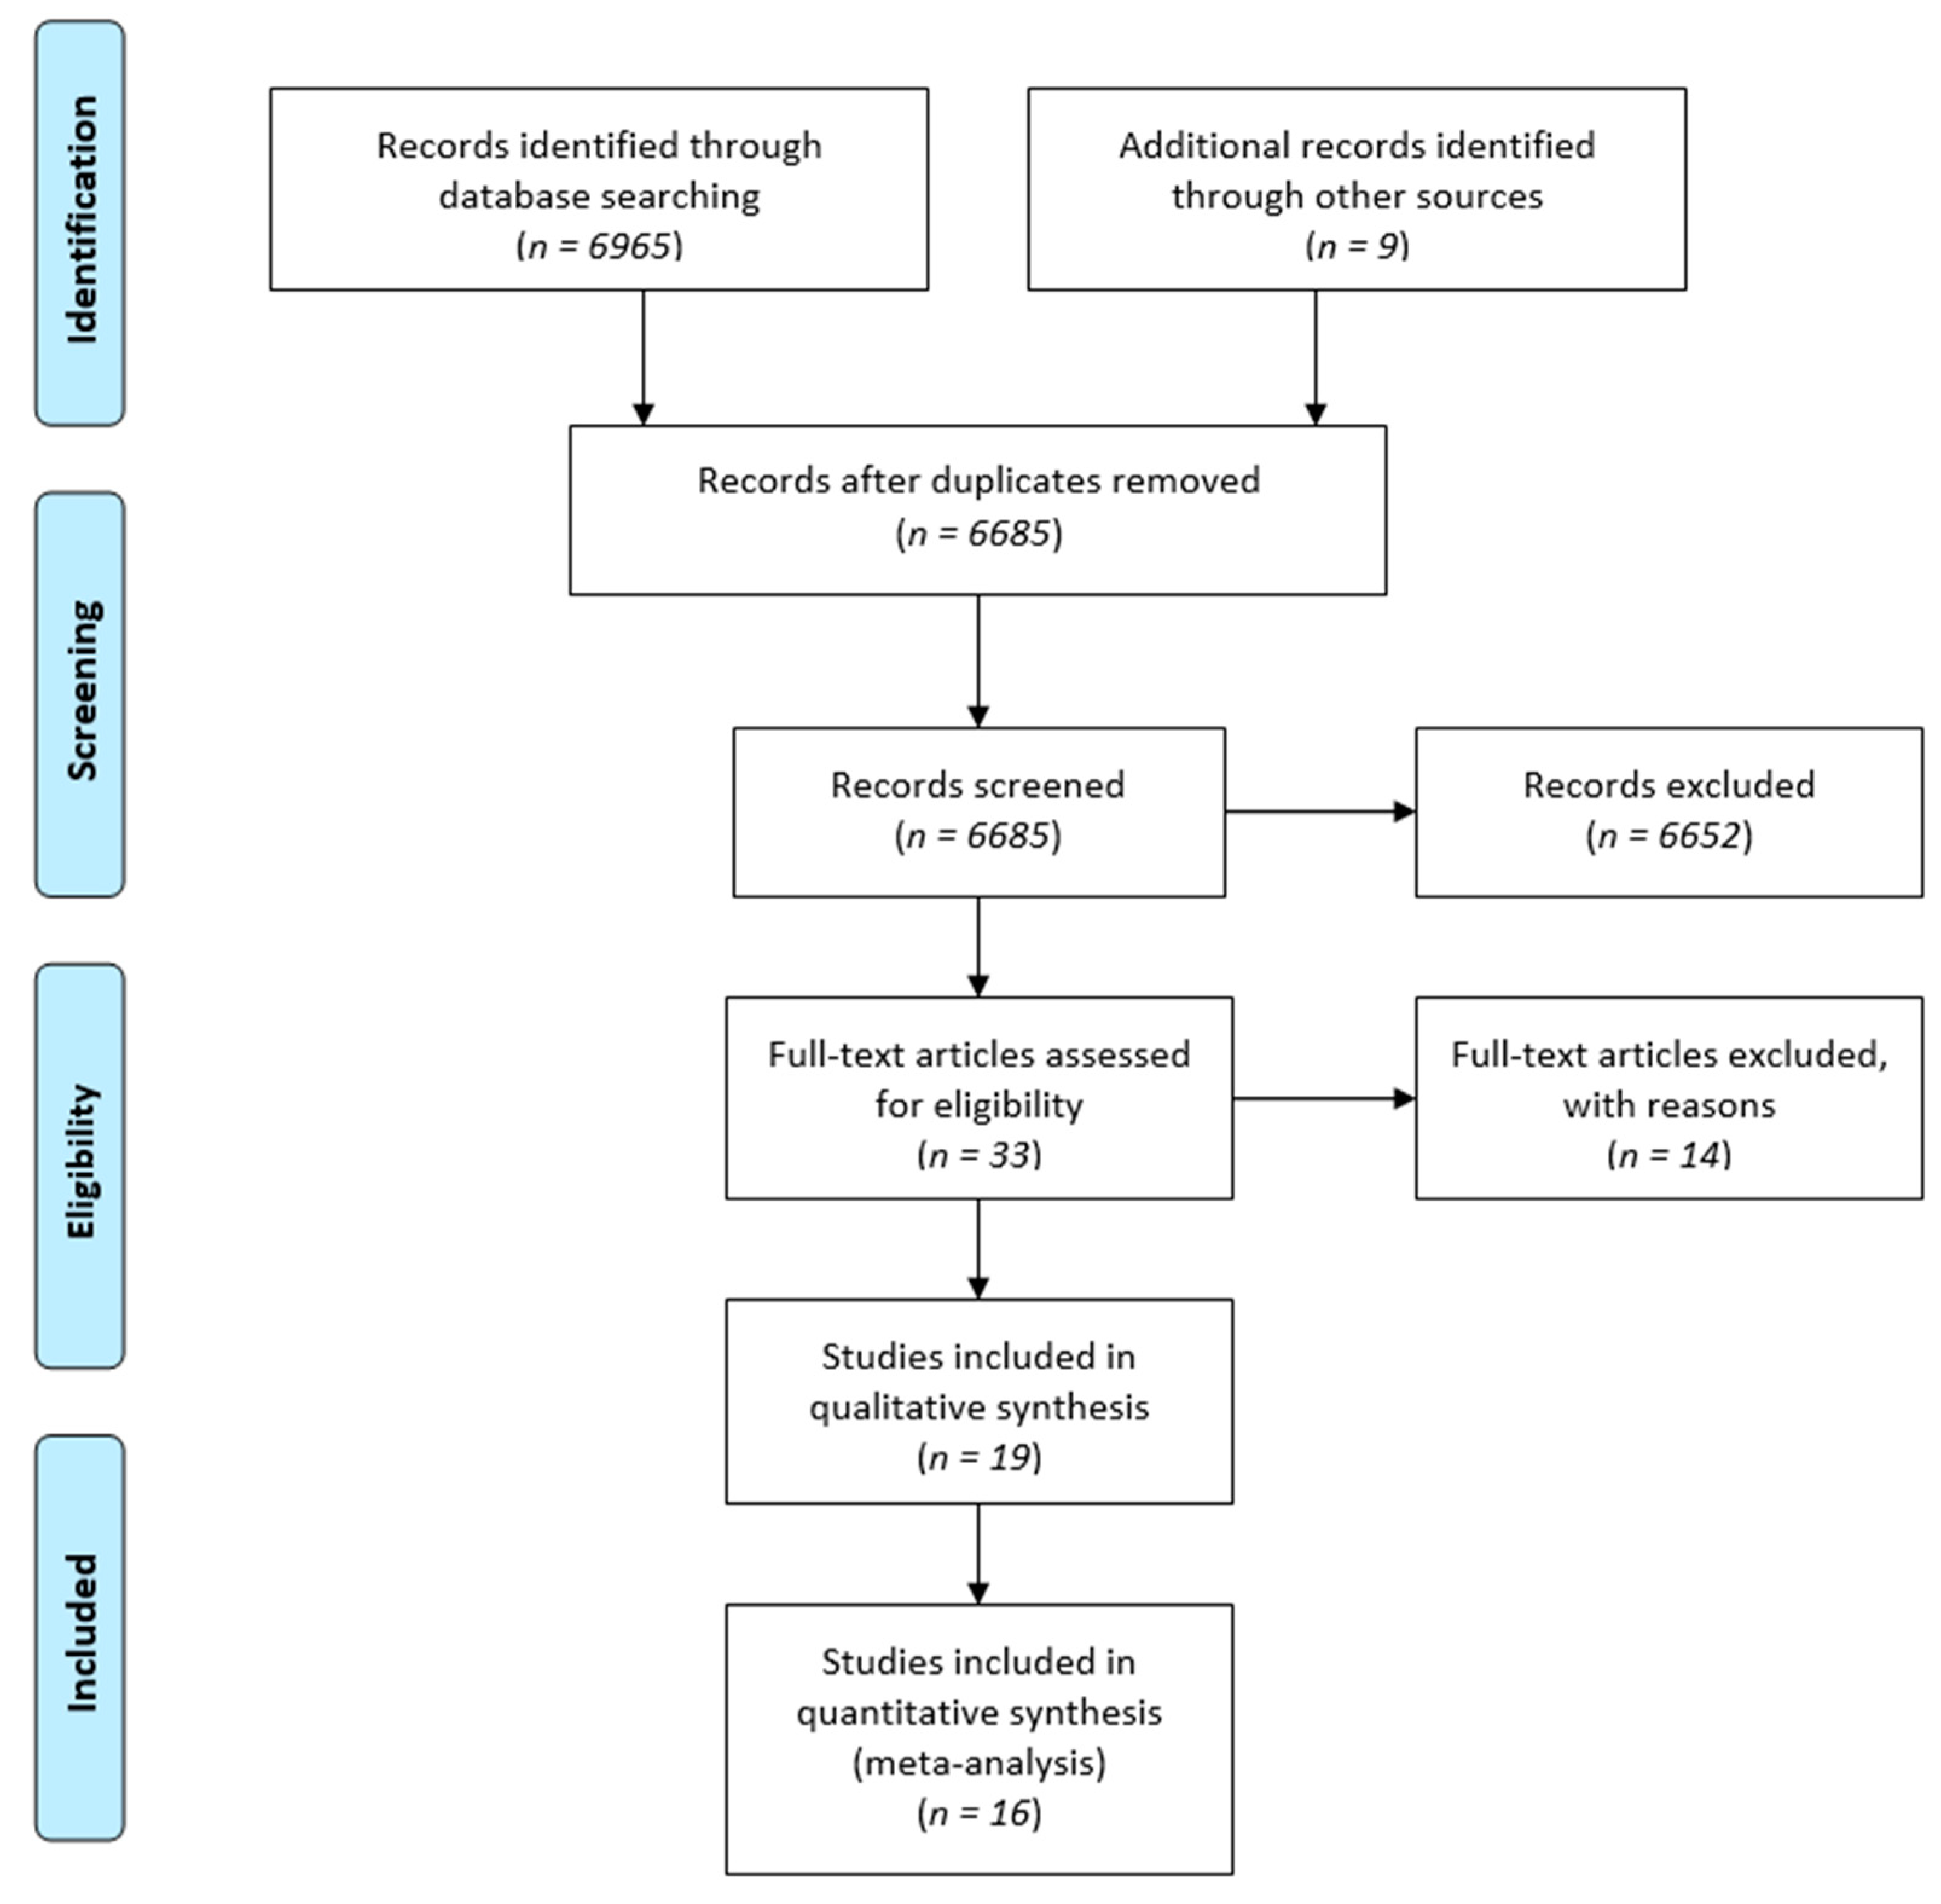
3.1. Search Results
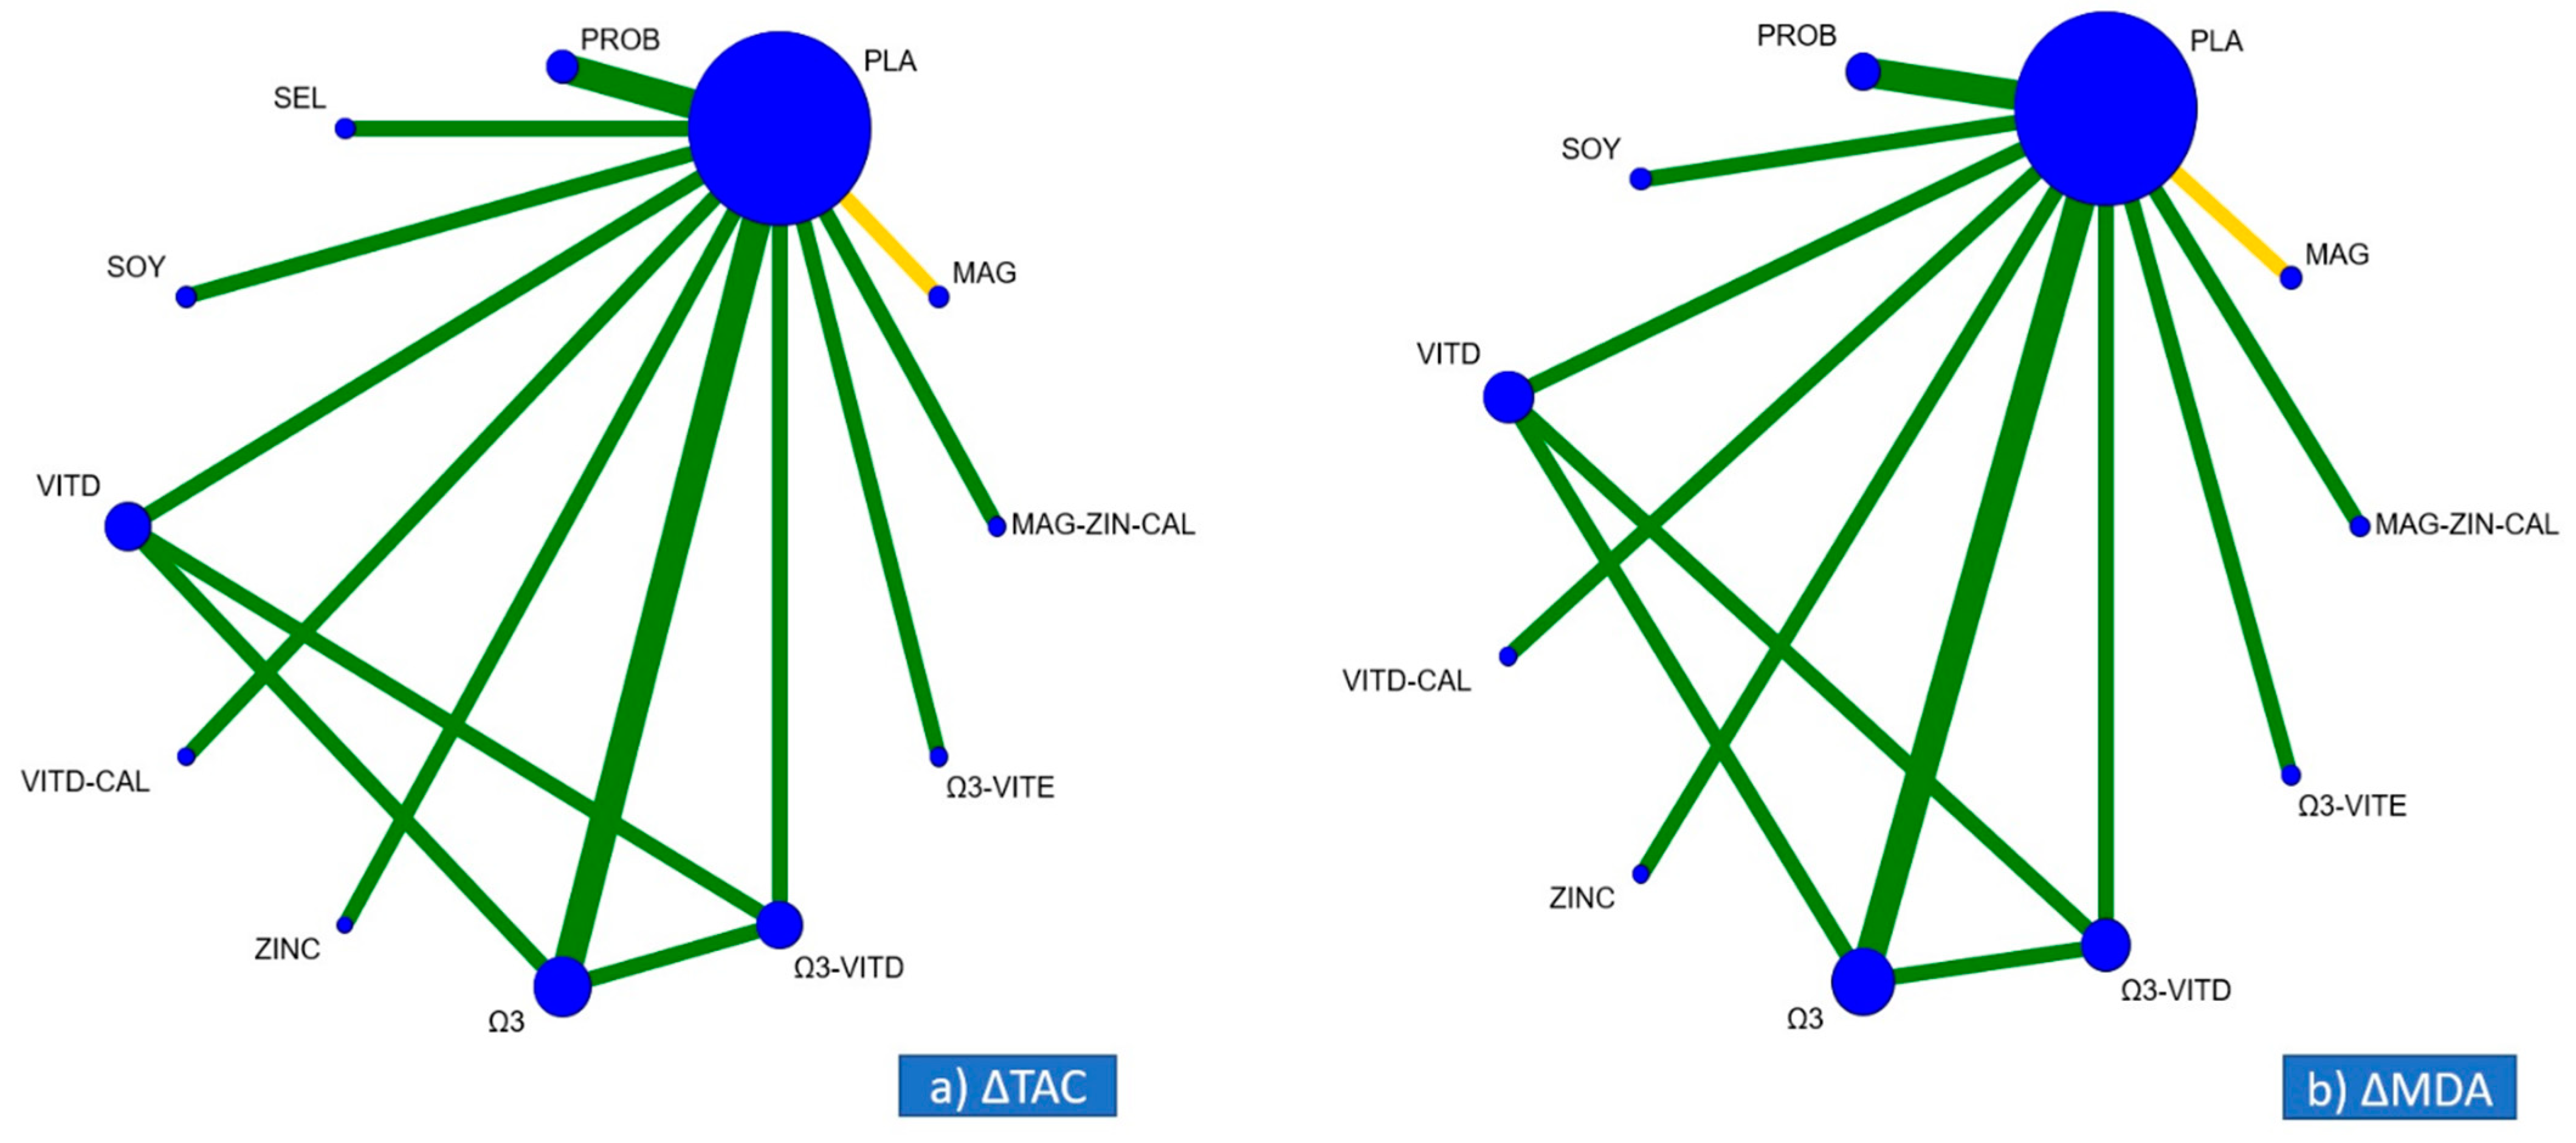
3.2. Geometry of the Networks
3.3. Risk of Bias
3.4. Assessment of Transitivity and Inconsistency
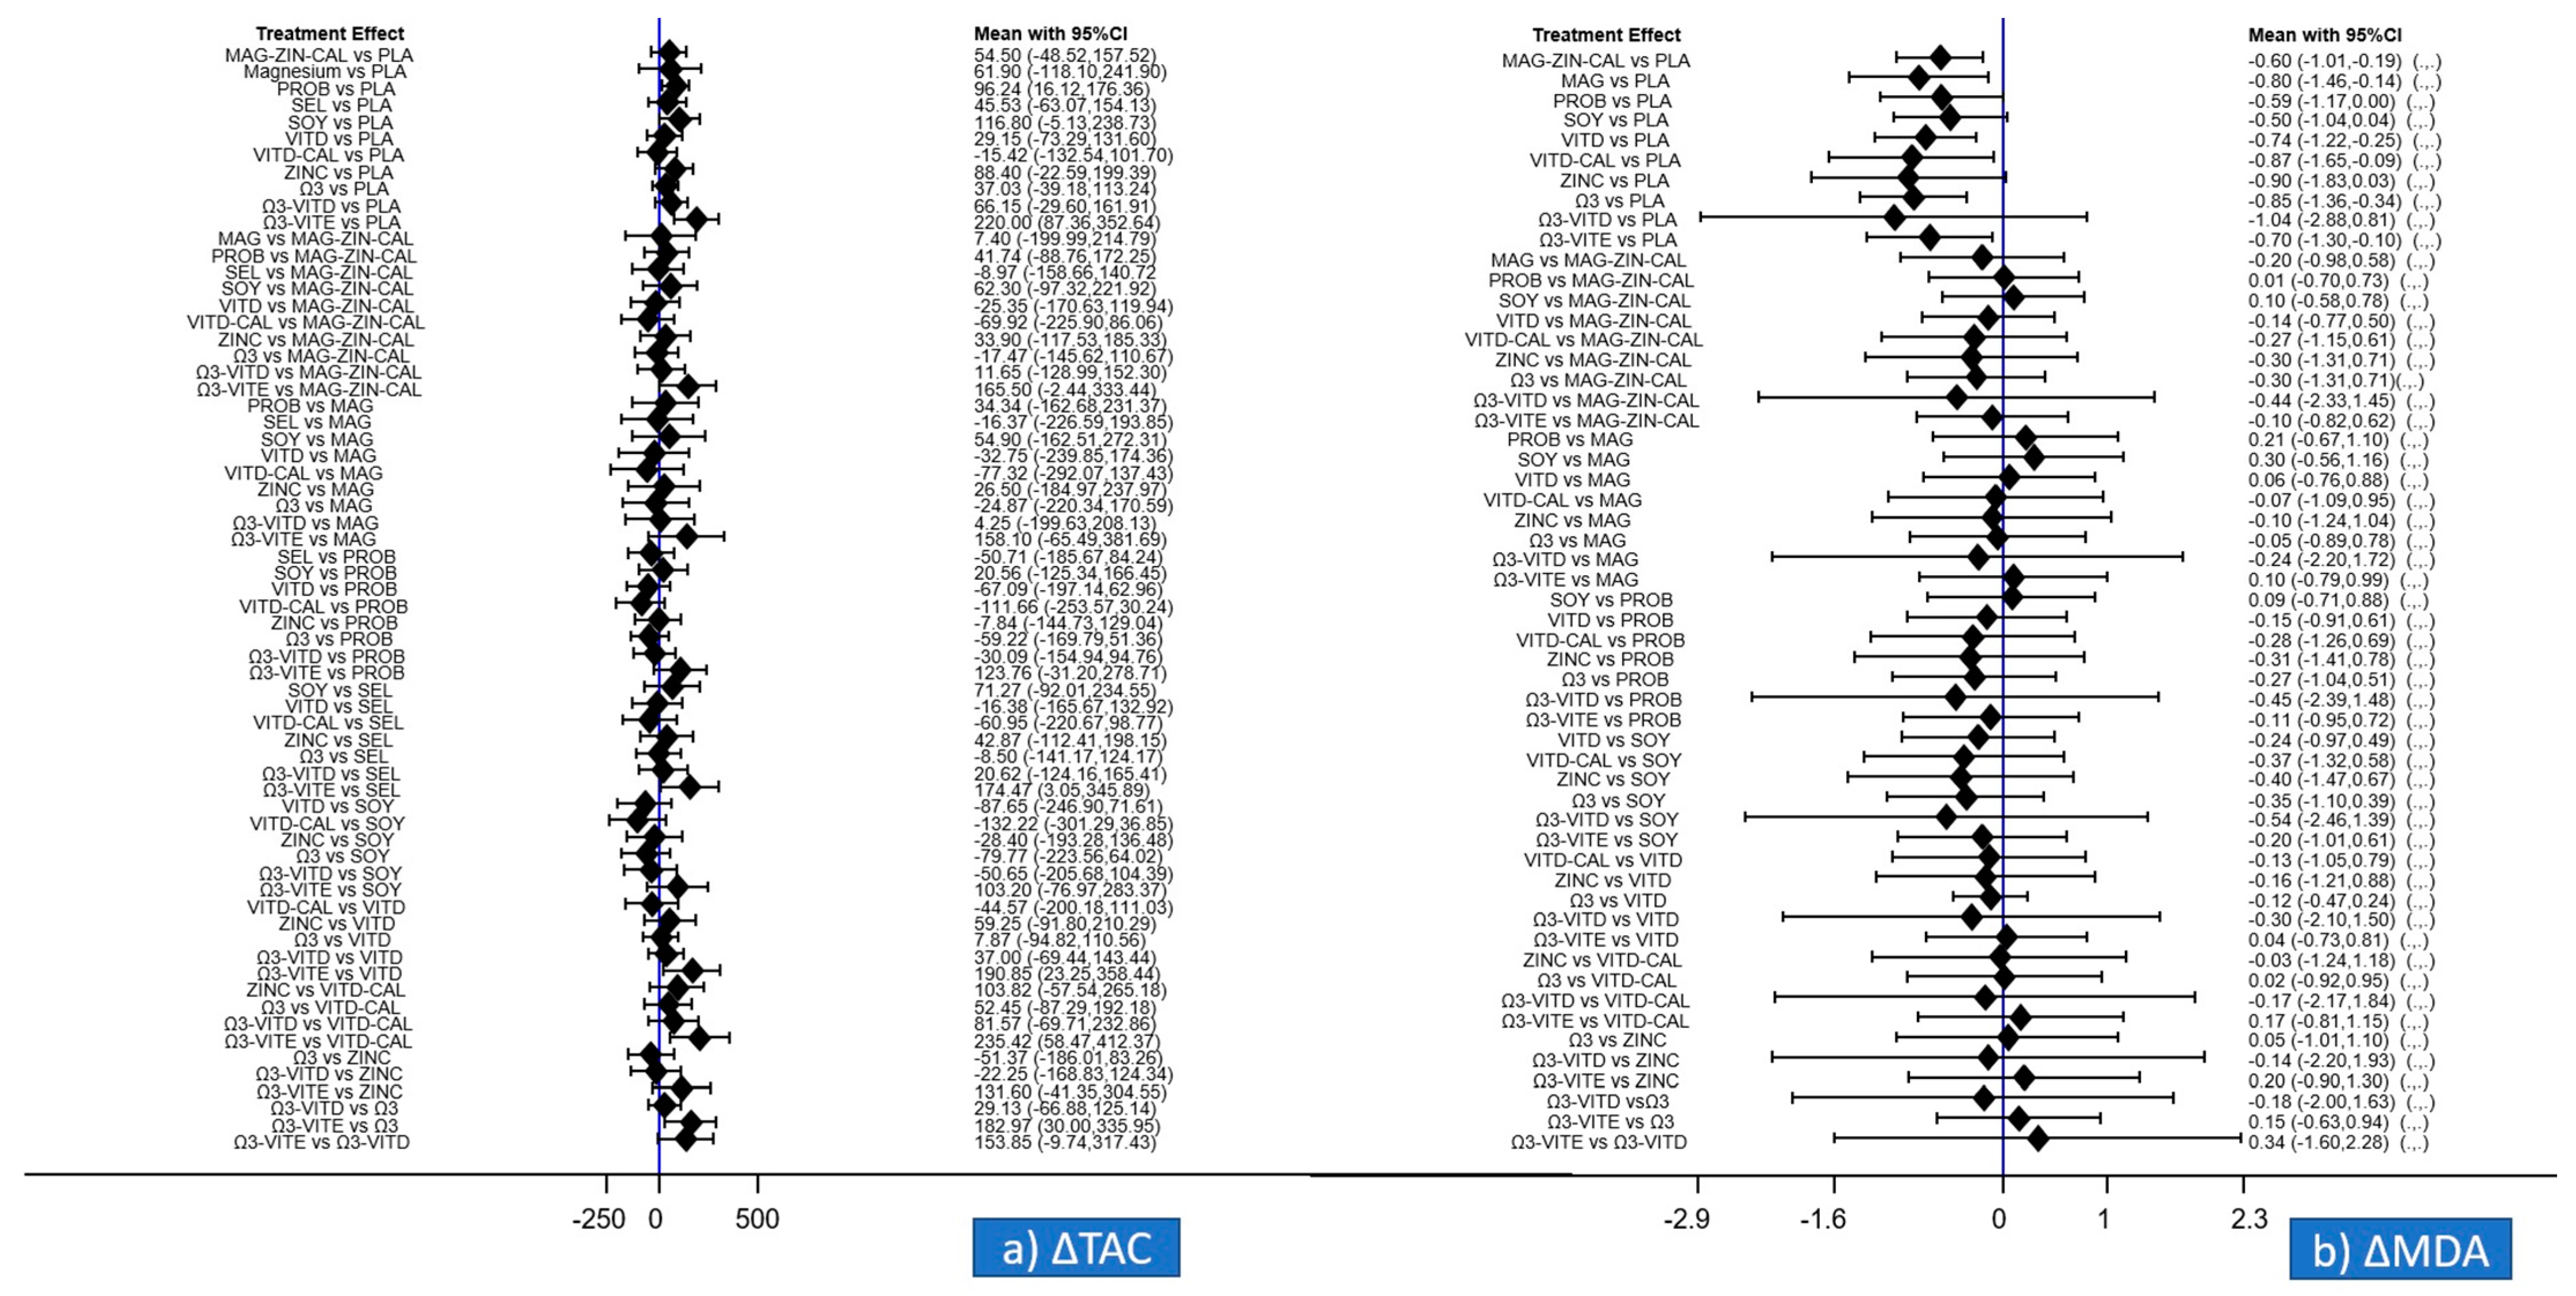
3.5. Primary Outcomes of the Meta-Analysis Regarding ΔTAC and ΔMDA
3.6. Secondary Outcomes of the Meta-Analysis Regarding TAC, GSH, MDA, ΔGSH
3.7. Small-Study Effects
3.8. Quality of the Evidence
4. Discussion
4.1. Summary of the Evidence
4.2. Interpretation
4.3. Strengths and Limitations
5. Conclusions
Supplementary Materials
Author Contributions
Funding
Institutional Review Board Statement
Informed Consent Statement
Data Availability Statement
Conflicts of Interest
References
- American Diabetes Association 2. Classification and Diagnosis of Diabetes: Standards of Medical Care in Diabetes—2021. Diabetes Care 2021, 44, S15–S33. [Google Scholar] [CrossRef]
- International Diabetes Federation. IDF Diabetes Atlas; International Diabetes Federation: Brussels, Belgium, 2019; ISBN 9782930229874. [Google Scholar]
- Lappas, M.; Hiden, U.; Desoye, G.; Froehlich, J.; Mouzon, S.H.; De Jawerbaum, A. The role of oxidative stress in the pathophysiology of gestational diabetes mellitus. Antioxid. Redox Signal 2011, 15, 3061–3100. [Google Scholar] [CrossRef] [PubMed]
- Chen, X.; Scholl, T.O. Oxidative stress: Changes in pregnancy and with gestational diabetes mellitus. Curr. Diabetes Rep. 2005, 5, 282–288. [Google Scholar] [CrossRef]
- Arikan, S.; Konukoğlu, D.; Arıkan, Ç.; Akçay, T.; Davas, I. Lipid Peroxidation and Antioxidant Status in Maternal and Cord Blood. Gynecol. Obstet. Investig. 2001, 51, 145–149. [Google Scholar] [CrossRef] [PubMed]
- Orhan, H.; Önderoglu, L.; Yücel, A.; Sahin, G.; Onderoglu, L.; Yücel, A.; Sahin, G. Circulating biomarkers of oxidative stress in complicated pregnancies. Arch. Gynecol. Obstet. 2003, 267, 189–195. [Google Scholar] [CrossRef] [PubMed]
- Djordjevic, A.; Spasic, S.; Djordjevic, R. Case Report Oxidative stress in diabetic pregnancy: SOD, CAT and GSH-Px activity and lipid peroxidation products. J. Matern. Neonatal Med. 2004, 16, 367–372. [Google Scholar] [CrossRef]
- Vetrani, C.; Costabile, G.; Di Marino, L.; Rivellese, A.A. Nutrition and oxidative stress: A systematic review of human studies. Int. J. Food Sci. Nutr. 2012, 64, 312–326. [Google Scholar] [CrossRef]
- Osawa, T.; Kato, Y. Protective Role of Antioxidative Food Factors in Oxidative Stress Caused by Hyperglycemia. Ann. N. Y. Acad. Sci. 2005, 1043, 440–451. [Google Scholar] [CrossRef]
- Hutton, B.; Salanti, G.; Caldwell, D.M.; Chaimani, A.; Schmid, C.H.; Cameron, C.; Ioannidis, J.P.A.; Straus, S.; Thorlund, K.; Jansen, J.P.; et al. The PRISMA Extension Statement for Reporting of Systematic Reviews Incorporating Network Meta-analyses of Health Care Interventions: Checklist and Explanations. Ann. Intern. Med. 2015, 162, 777. [Google Scholar] [CrossRef] [PubMed] [Green Version]
- Risk of Bias Tools—RoB 2 Tool. Available online: https://methods.cochrane.org/bias/resources/rob-2-revised-cochrane-risk-bias-tool-randomized-trials (accessed on 29 June 2021).
- Chaimani, A.; Salanti, G. Visualizing Assumptions and Results in Network Meta-analysis: The Network Graphs Package. Stata J. Promot. Commun. Stat. 2015, 15, 905–950. [Google Scholar] [CrossRef] [Green Version]
- Salanti, G. Indirect and mixed-treatment comparison, network, or multiple-treatments meta-analysis: Many names, many benefits, many concerns for the next generation evidence synthesis tool. Res. Synth. Methods 2012, 3, 80–97. [Google Scholar] [CrossRef] [PubMed]
- Caldwell, D.M.; Ades, A.E.; Higgins, J.P.T. Simultaneous comparison of multiple treatments: Combining direct and indirect evidence. BMJ 2005, 331, 897–900. [Google Scholar] [CrossRef] [Green Version]
- Turner, R.M.; Davey, J.; Clarke, M.J.; Thompson, S.G.; Higgins, J.P. Predicting the extent of heterogeneity in meta-analysis, using empirical data from the Cochrane Database of Systematic Reviews. Int. J. Epidemiol. 2012, 41, 818–827. [Google Scholar] [CrossRef] [Green Version]
- White, I.R.; Barrett, J.K.; Jackson, D.; Higgins, J.P.T. Consistency and inconsistency in network meta-analysis: Model estimation using multivariate meta-regression. Res. Synth. Methods 2012, 3, 111–125. [Google Scholar] [CrossRef] [PubMed] [Green Version]
- Higgins, J.P.T.; Thompson, S.G.; Spiegelhalter, D.J. A re-evaluation of random-effects meta-analysis. J. R. Stat. Soc. Ser. A Stat. Soc. 2009, 172, 137–159. [Google Scholar] [CrossRef] [Green Version]
- Chaimani, A.; Higgins, J.P.T.; Mavridis, D.; Spyridonos, P.; Salanti, G. Graphical Tools for Network Meta-Analysis in STATA. PLoS ONE 2013, 8, e76654. [Google Scholar] [CrossRef]
- Zhang, Q.; Cheng, Y.; He, M.; Li, T.; Ma, Z.; Cheng, H. Effect of various doses of vitamin D supplementation on pregnant women with gestational diabetes mellitus: A randomized controlled trial. Exp. Ther. Med. 2016, 12, 1889–1895. [Google Scholar] [CrossRef] [Green Version]
- Fei, B.B.; Ling, L.; Hua, C.; Ren, S.Y. Effects of soybean oligosaccharides on antioxidant enzyme activities and insulin resistance in pregnant women with gestational diabetes mellitus. Food Chem. 2014, 158, 429–432. [Google Scholar] [CrossRef] [PubMed]
- Aslfalah, H.; Jamilian, M.; Khosrowbeygi, A. Elevation of the adiponectin/leptin ratio in women with gestational diabetes mellitus after supplementation with alpha-lipoic acid. Gynecol. Endocrinol. 2019, 35, 271–275. [Google Scholar] [CrossRef] [PubMed]
- Asemi, Z.; Hashemi, T.; Karamali, M.; Samimi, M.; Esmaillzadeh, A. Effects of vitamin D supplementation on glucose metabolism, lipid concentrations, inflammation, and oxidative stress in gestational diabetes: A double-blind randomized controlled clinical trial1-3. Am. J. Clin. Nutr. 2013, 98, 1425–1432. [Google Scholar] [CrossRef] [PubMed] [Green Version]
- Asemi, Z.; Karamali, M.; Esmaillzadeh, A. Effects of calcium-vitamin D co-supplementation on glycaemic control, inflammation and oxidative stress in gestational diabetes: A randomised placebo-controlled trial. Diabetologia 2014, 57, 1798–1806. [Google Scholar] [CrossRef]
- Jamilian, M.; Amirani, E.; Asemi, Z. The effects of vitamin D and probiotic co-supplementation on glucose homeostasis, inflammation, oxidative stress and pregnancy outcomes in gestational diabetes: A randomized, double-blind, placebo-controlled trial. Clin. Nutr. 2018. [Google Scholar] [CrossRef] [PubMed]
- Karamali, M.; Nasiri, N.; Taghavi Shavazi, N.; Jamilian, M.; Bahmani, F.; Tajabadi-Ebrahimi, M.; Asemi, Z. The Effects of Synbiotic Supplementation on Pregnancy Outcomes in Gestational Diabetes. Probiotics Antimicrob. Proteins 2018, 10, 496–503. [Google Scholar] [CrossRef]
- Babadi, M.; Khorshidi, A.; Aghadavood, E.; Samimi, M.; Kavossian, E.; Bahmani, F.; Mafi, A.; Shafabakhsh, R.; Satari, M.; Asemi, Z. The Effects of Probiotic Supplementation on Genetic and Metabolic Profiles in Patients with Gestational Diabetes Mellitus: A Randomized, Double-Blind, Placebo-Controlled Trial. Probiotics Antimicrob. Proteins 2018. [Google Scholar] [CrossRef]
- Hajifaraji, M.; Jahanjou, F.; Abbasalizadeh, F.; Aghamohammadzadeh, N.; Abbasi, M.M.; Dolatkhah, N. Effect of probiotic supplements in women with gestational diabetes mellitus on inflammation and oxidative stress biomarkers: A randomized clinical trial. Asia Pac. J. Clin. Nutr. 2018, 27, 581–591. [Google Scholar] [CrossRef]
- Badehnoosh, B.; Karamali, M.; Zarrati, M.; Jamilian, M.; Bahmani, F.; Tajabadi-Ebrahimi, M.; Jafari, P.; Rahmani, E.; Asemi, Z. The effects of probiotic supplementation on biomarkers of inflammation, oxidative stress and pregnancy outcomes in gestational diabetes. J. Matern. Neonatal Med. 2018, 31, 1128–1136. [Google Scholar] [CrossRef] [PubMed] [Green Version]
- Asemi, Z.; Karamali, M.; Jamilian, M.; Foroozanfard, F.; Bahmani, F.; Heidarzadeh, Z.; Benisi-Kohansal, S.; Surkan, P.J.; Esmaillzadeh, A. Magnesium supplementation affects metabolic status and pregnancy outcomes in gestational diabetes: A randomized, double-blind, placebo-controlled trial. Am. J. Clin. Nutr. 2015, 102, 222–229. [Google Scholar] [CrossRef] [Green Version]
- Jamilian, M.; Mirhosseini, N.; Eslahi, M.; Bahmani, F.; Shokrpour, M.; Chamani, M.; Asemi, Z. The effects of magnesium-zinc-calcium-vitamin D co-supplementation on biomarkers of inflammation, oxidative stress and pregnancy outcomes in gestational diabetes. BMC Pregnancy Childbirth 2019, 19, 1–8. [Google Scholar] [CrossRef] [PubMed]
- Jamilian, M.; Samimi, M.; Kolahdooz, F.; Khalaji, F.; Razavi, M.; Asemi, Z. Omega-3 fatty acid supplementation affects pregnancy outcomes in gestational diabetes: A randomized, double-blind, placebo-controlled trial. J. Matern. Neonatal Med. 2016, 29, 669–675. [Google Scholar] [CrossRef]
- Jamilian, M.; Hashemi Dizaji, S.; Bahmani, F.; Taghizadeh, M.; Memarzadeh, M.R.; Karamali, M.; Akbari, M.; Asemi, Z. A Randomized Controlled Clinical Trial Investigating the Effects of Omega-3 Fatty Acids and Vitamin E Co-Supplementation on Biomarkers of Oxidative Stress, Inflammation and Pregnancy Outcomes in Gestational Diabetes. Can. J. Diabetes 2017, 41, 143–149. [Google Scholar] [CrossRef]
- Razavi, M.; Jamilian, M.; Samimi, M.; Afshar Ebrahimi, F.; Taghizadeh, M.; Bekhradi, R.; Seyed Hosseini, E.; Haddad Kashani, H.; Karamali, M.; Asemi, Z. The effects of Vitamin D and omega-3 fatty acids co-supplementation on biomarkers of inflammation, oxidative stress and pregnancy outcomes in patients with gestational diabetes. Nutr. Metab. 2017, 14, 1–9. [Google Scholar] [CrossRef] [PubMed] [Green Version]
- Asemi, Z.; Jamilian, M.; Mesdaghinia, E.; Esmaillzadeh, A. Effects of selenium supplementation on glucose homeostasis, inflammation, and oxidative stress in gestational diabetes: Randomized, double-blind, placebo-controlled trial. Nutrition 2015, 31, 1235–1242. [Google Scholar] [CrossRef] [PubMed]
- Jamilian, M.; Asemi, Z. The effect of soy intake on metabolic profiles of women with gestational diabetes mellitus. J. Clin. Endocrinol. Metab. 2015, 100, 4654–4661. [Google Scholar] [CrossRef] [PubMed]
- Karamali, M.; Heidarzadeh, Z.; Seifati, S.M.; Samimi, M.; Tabassi, Z.; Talaee, N.; Bahardoost, H.; Asemi, Z. Zinc Supplementation and the Effects on Pregnancy Outcomes in Gestational Diabetes: A Randomized, Double-blind, Placebo-controlled Trial. Exp. Clin. Endocrinol. Diabetes 2015, 124, 28–33. [Google Scholar] [CrossRef] [PubMed]
- Maged, A.M.; Torky, H.; Fouad, M.A.; GadAllah, S.H.; Waked, N.M.; Gayed, A.S.; Salem, A.K. Role of antioxidants in gestational diabetes mellitus and relation to fetal outcome: A randomized controlled trial. J. Matern. Neonatal Med. 2016, 29, 4049–4054. [Google Scholar] [CrossRef]
- Applying GRADE Ideas to Network Meta-Analysis. Cochrane Comparing Multiple Interventions. Available online: https://training.cochrane.org/resource/grade-approach-rate-certainty-evidence-network-meta-analysis-and-summary-findings-tables (accessed on 29 June 2021).
- Barbour, L.A.; McCurdy, C.E.; Hernandez, T.L.; Kirwan, J.P.; Catalano, P.M.; Friedman, J.E. Cellular mechanisms for insulin resistance in normal pregnancy and gestational diabetes. Diabetes Care 2007, 30, S112–S119. [Google Scholar] [CrossRef] [Green Version]
- Sonagra, A.D.; Biradar, S.M.; K., D.; Murthy D.S., J. Normal pregnancy—A state of insulin resistance. J. Clin. Diagn. Res. 2014, 8, 1–3. [Google Scholar] [CrossRef] [PubMed]
- Plows, J.F.; Stanley, J.L.; Baker, P.N.; Reynolds, C.M.; Vickers, M.H. The pathophysiology of gestational diabetes mellitus. Int. J. Mol. Sci. 2018, 19, 3342. [Google Scholar] [CrossRef] [Green Version]
- Li, H.; Yin, Q.; Li, N.; Ouyang, Z.; Zhong, M. Plasma markers of oxidative stress in patients with gestational diabetes mellitus in the second and third trimester. Obstet. Gynecol. Int. 2016, 2016. [Google Scholar] [CrossRef] [Green Version]
- Rodrigues, F.; de Lucca, L.; Neme, W.S.; de Lima Gonçalves, T. Influence of gestational diabetes on the activity of δ-aminolevulinate dehydratase and oxidative stress biomarkers. Redox Rep. 2018, 23, 63–67. [Google Scholar] [CrossRef] [Green Version]
- Parast, V.M.; Paknahad, Z. Antioxidant Status and Risk of Gestational Diabetes Mellitus: A Case-Control Study. Clin. Nutr. Res. 2017, 6, 81. [Google Scholar] [CrossRef] [Green Version]
- Arribas, L.; Almansa, I.; Miranda, M.; Muriach, M.; Romero, F.J.; Villar, V.M. Serum malondialdehyde concentration and glutathione peroxidase activity in a longitudinal study of gestational diabetes. PLoS ONE 2016, 11, 1–13. [Google Scholar] [CrossRef] [Green Version]
- Rueangdetnarong, H.; Sekararithi, R.; Jaiwongkam, T.; Kumfu, S.; Chattipakorn, N.; Tongsong, T.; Jatavan, P. Comparisons of the oxidative stress biomarkers levels in gestational diabetes mellitus (GDM) and non-GDM among Thai population: Cohort study. Endocr. Connect. 2018, 7, 681–687. [Google Scholar] [CrossRef]
- Usluoğullari, B.; Usluogullari, C.A.; Balkan, F.; Orkmez, M. Role of serum levels of irisin and oxidative stress markers in pregnant women with and without gestational diabetes. Gynecol. Endocrinol. 2017, 33, 405–407. [Google Scholar] [CrossRef]
- Toljic, M.; Egic, A.; Munjas, J.; Karadzov Orlic, N.; Milovanovic, Z.; Radenkovic, A.; Vuceljic, J.; Joksic, I. Increased oxidative stress and cytokinesis-block micronucleus cytome assay parameters in pregnant women with gestational diabetes mellitus and gestational arterial hypertension. Reprod. Toxicol. 2017, 71, 55–62. [Google Scholar] [CrossRef] [PubMed]
- Sudharshana Murthy, K.; Bhandiwada, A.; Chandan, S.; Gowda, S.; Sindhusree, G. Evaluation of oxidative stress and proinflammatory cytokines in gestational diabetes mellitus and their correlation with pregnancy outcome. Indian J. Endocrinol. Metab. 2018, 22, 79. [Google Scholar] [CrossRef]
- Karacay, Ö.; Sepici-Dincel, A.; Karcaaltincaba, D.; Sahin, D.; Yalvaç, S.; Akyol, M.; Kandemir, Ö.; Altan, N. A quantitative evaluation of total antioxidant status and oxidative stress markers in preeclampsia and gestational diabetic patients in 24–36 weeks of gestation. Diabetes Res. Clin. Pract. 2010, 89, 231–238. [Google Scholar] [CrossRef] [PubMed]
- Cepas, V.; Collino, M.; Mayo, J.C.; Sainz, R.M. Redox signaling and advanced glycation endproducts (AGEs) in diet-related diseases. Antioxidants 2020, 9, 142. [Google Scholar] [CrossRef] [Green Version]
- Perrone, A.; Giovino, A.; Benny, J.; Martinelli, F. Advanced Glycation End Products (AGEs): Biochemistry, Signaling, Analytical Methods, and Epigenetic Effects. Oxid. Med. Cell. Longev. 2020, 2020, 1–18. [Google Scholar] [CrossRef] [PubMed] [Green Version]
- Vlassara, H.; Uribarri, J. Advanced glycation end products (AGE) and diabetes: Cause, effect, or both? Curr. Diab. Rep. 2014, 14, 453. [Google Scholar] [CrossRef] [Green Version]
- Rhee, S.Y.; Kim, Y.S. The role of advanced glycation end products in diabetic vascular complications. Diabetes Metab. J. 2018, 42, 188–195. [Google Scholar] [CrossRef]
- Singh, R.; Barden, A.; Mori, T.; Beilin, L. Advanced glycation end-products: A review. Diabetologia 2001, 44, 129–146. [Google Scholar] [CrossRef] [Green Version]
- Park, L.; Raman, K.G.; Lee, K.J.; Lu, Y.; Ferran, L.J.; Choe, W.S.; Stern, D.; Schmidt, A.M. Suppression of accelerated diabetic atherosclerosis by the soluble receptor for advanced glycation endproducts. Nat. Med. 1998, 4, 1025–1031. [Google Scholar] [CrossRef]
- Goldin, A.; Beckman, J.A.; Schmidt, A.M.; Creager, M.A. Advanced glycation end products: Sparking the development of diabetic vascular injury. Circulation 2006, 114, 597–605. [Google Scholar] [CrossRef] [Green Version]
- Vlassara, H.; Palace, M.R. Diabetes and advanced glycation endproducts. J. Intern. Med. 2002, 251, 87–101. [Google Scholar] [CrossRef]
- Rolo, A.P.; Palmeira, C.M. Diabetes and mitochondrial function: Role of hyperglycemia and oxidative stress. Toxicol. Appl. Pharmacol. 2006, 212, 167–178. [Google Scholar] [CrossRef] [Green Version]
- Davì, G.; Falco, A.; Patrono, C. Lipid peroxidation in diabetes mellitus. Antioxid. Redox Signal. 2005, 7, 256–268. [Google Scholar] [CrossRef] [PubMed]
- De Souza Bastos, A.; Graves, D.T.; de Melo Loureiro, A.P.; Júnior, C.R.; Corbi, S.C.T.; Frizzera, F.; Scarel-Caminaga, R.M.; Câmara, N.O.; Andriankaja, O.M.; Hiyane, M.I.; et al. Diabetes and increased lipid peroxidation are associated with systemic inflammation even in well-controlled patients. J. Diabetes Complicat. 2016, 30, 1593–1599. [Google Scholar] [CrossRef] [PubMed] [Green Version]
- Horal, M.; Zhang, Z.; Stanton, R.; Virkamäki, A.; Loeken, M.R. Activation of the hexosamine pathway causes oxidative stress and abnormal embryo gene expression: Involvement in diabetic teratogenesis. Birth Defects Res. Part A Clin. Mol. Teratol. 2004, 70, 519–527. [Google Scholar] [CrossRef] [PubMed]
- Kolm-Litty, V.; Sauer, U.; Nerlich, A.; Lehmann, R.; Schleicher, E.D. High glucose-induced transforming growth factor β1 production is mediated by the hexosamine pathway in porcine glomerular mesangial cells. J. Clin. Investig. 1998, 101, 160–169. [Google Scholar] [CrossRef]
- Du, X.L.; Edelstein, D.; Rossetti, L.; Fantus, I.G.; Goldberg, H.; Ziyadeh, F.; Wu, J.; Brownlee, M. Hyperglycemia-induced mitochondrial superoxide overproduction activates the hexosamine pathway and induces plasminogen activator inhibitor-1 expression by increasing Sp1 glycosylation. Proc. Natl. Acad. Sci. USA 2000, 97, 12222–12226. [Google Scholar] [CrossRef] [Green Version]
- Rajapakse, A.G.; Ming, X.F.; Carvas, J.M.; Yang, Z. The hexosamine biosynthesis inhibitor azaserine prevents endothelial inflammation and dysfunction under hyperglycemic condition through antioxidant effects. Am. J. Physiol. Circ. Physiol. 2009, 296, H815–H822. [Google Scholar] [CrossRef] [PubMed] [Green Version]
- Turner, J.F.; Turner, D.H. The Regulation of Glycolysis and the Pentose Phosphate Pathway. In Metabolism and Respiration; Elsevier: Amsterdam, The Netherlands, 1980; pp. 279–316. [Google Scholar]
- Wamelink, M.M.C.; Struys, E.A.; Jakobs, C. The biochemistry, metabolism and inherited defects of the pentose phosphate pathway: A review. J. Inherit. Metab. Dis. 2008, 31, 703–717. [Google Scholar] [CrossRef] [PubMed]
- Kruger, N.J.; Von Schaewen, A. The oxidative pentose phosphate pathway: Structure and organisation. Curr. Opin. Plant Biol. 2003, 6, 236–246. [Google Scholar] [CrossRef]
- McLennan, S.V.; Heffernan, S.; Wright, L.; Rae, C.; Fisher, E.; Yue, D.K.; Turtle, J.R. Changes in hepatic glutathione metabolism in diabetes. Diabetes 1991, 40, 344–348. [Google Scholar] [CrossRef] [PubMed]
- Bray, T.M.; Taylor, C.G. Tissue glutathione, nutrition, and oxidative stress. Can. J. Physiol. Pharmacol. 1993, 71, 746–751. [Google Scholar] [CrossRef]
- Barceló-Coblijn, G.; Murphy, E.J. Alpha-linolenic acid and its conversion to longer chain n-3 fatty acids: Benefits for human health and a role in maintaining tissue n-3 fatty acid levels. Prog. Lipid Res. 2009, 48, 355–374. [Google Scholar] [CrossRef] [PubMed]
- Li, H.; Ruan, X.Z.; Powis, S.H.; Fernando, R.; Mon, W.Y.; Wheeler, D.C.; Moorhead, J.F.; Varghese, Z. EPA and DHA reduce LPS-induced inflammation responses in HK-2 cells: Evidence for a PPAR-γ-dependent mechanism. Kidney Int. 2005, 67, 867–874. [Google Scholar] [CrossRef] [Green Version]
- Jamilian, M.; Samimi, M.; Mirhosseini, N.; Ebrahimi, F.A.; Aghadavod, E.; Taghizadeh, M.; Asemi, Z. A randomized double-blinded, placebo-controlled trial investigating the effect of fish oil supplementation on gene expression related to insulin action, blood lipids, and inflammation in gestational diabetes mellitus-fish oil supplementation and gestational diabetes. Nutrients 2018, 10, 163. [Google Scholar] [CrossRef] [Green Version]
- Sorto-Gomez, T.E.; Ortiz, G.G.; Pacheco-Moises, F.P.; Torres-Sanchez, E.D.; Ramirez-Ramirez, V.; Macias-Islas, M.A.; Celis de la Rosa, A.; Velázquez-Brizuela, I.E. Effect of fish oil on glutathione redox system in multiple sclerosis. Am. J. Neurodegener. Dis. 2016, 5, 145–151. [Google Scholar] [PubMed]
- Patten, A.R.; Brocardo, P.S.; Christie, B.R. Omega-3 supplementation can restore glutathione levels and prevent oxidative damage caused by prenatal ethanol exposure. J. Nutr. Biochem. 2013, 24, 760–769. [Google Scholar] [CrossRef]
- Soleimani, Z.; Hashemdokht, F.; Bahmani, F.; Taghizadeh, M.; Memarzadeh, M.R.; Asemi, Z. Clinical and metabolic response to flaxseed oil omega-3 fatty acids supplementation in patients with diabetic foot ulcer: A randomized, double-blind, placebo-controlled trial. J. Diabetes Complicat. 2017, 31, 1394–1400. [Google Scholar] [CrossRef] [PubMed]
- Yang, J.; Fernández-Galilea, M.; Martínez-Fernández, L.; González-Muniesa, P.; Pérez-Chávez, A.; Martínez, J.A.; Moreno-Aliaga, M.J. Oxidative stress and non-alcoholic fatty liver disease: Effects of omega-3 fatty acid supplementation. Nutrients 2019, 11, 872. [Google Scholar] [CrossRef] [PubMed] [Green Version]
- Domínguez-Perles, R.; Gil-Izquierdo, A.; Ferreres, F.; Medina, S. Update on oxidative stress and inflammation in pregnant women, unborn children (nasciturus), and newborns—Nutritional and dietary effects. Free Radic. Biol. Med. 2019, 142, 38–51. [Google Scholar] [CrossRef]
- Sepidarkish, M.; Akbari-Fakhrabadi, M.; Daneshzad, E.; Yavari, M.; Rezaeinejad, M.; Morvaridzadeh, M.; Heshmati, J. Effect of omega-3 fatty acid plus vitamin E Co-Supplementation on oxidative stress parameters: A systematic review and meta-analysis. Clin. Nutr. 2019, 39, 1019–1025. [Google Scholar] [CrossRef] [PubMed]
- Wang, Y.; Wu, Y.; Wang, Y.; Xu, H.; Mei, X.; Yu, D.; Wang, Y.; Li, W. Antioxidant properties of probiotic bacteria. Nutrients 2017, 9, 521. [Google Scholar] [CrossRef] [PubMed]
- Scirpo, R.; Fiorotto, R.; Villani, A.; Amenduni, M.; Spirli, C.; Strazzabosco, M. Stimulation of nuclear receptor peroxisome proliferator-activated receptor-γ limits NF-κB-dependent inflammation in mouse cystic fibrosis biliary epithelium. Hepatology 2015, 62, 1551–1562. [Google Scholar] [CrossRef] [Green Version]
- Miraghajani, M.; Dehsoukhteh, S.S.; Rafie, N.; Hamedani, S.G.; Sabihi, S.; Ghiasvand, R. Potential mechanisms linking probiotics to diabetes: A narrative review of the literature. Sao Paulo Med. J. 2017, 135, 169–178. [Google Scholar] [CrossRef] [Green Version]
- Wang, Y.C.; Yu, R.C.; Chou, C.C. Antioxidative activities of soymilk fermented with lactic acid bacteria and bifidobacteria. Food Microbiol. 2006, 23, 128–135. [Google Scholar] [CrossRef]
- Maritim, A.C.; Sanders, R.A.; Watkins, J.B. Diabetes, oxidative stress, and antioxidants: A review. J. Biochem. Mol. Toxicol. 2003, 17, 24–38. [Google Scholar] [CrossRef]
- Mayne, S.T. Oxidative stress, dietary antioxidant supplements, and health: Is the glass half full or half empty? Cancer Epidemiol. Biomark. Prev. 2013, 22, 2145–2147. [Google Scholar] [CrossRef] [PubMed] [Green Version]
- Ryan, M.J.; Dudash, H.J.; Docherty, M.; Geronilla, K.B.; Baker, B.A.; Haff, G.G.; Cutlip, R.G.; Alway, S.E. Vitamin E and C supplementation reduces oxidative stress, improves antioxidant enzymes and positive muscle work in chronically loaded muscles of aged rats. Exp. Gerontol. 2010, 45, 882–895. [Google Scholar] [CrossRef] [Green Version]
- Nikooyeh, B.; Neyestani, T.R.; Tayebinejad, N.; Alavi-Majd, H.; Shariatzadeh, N.; Kalayi, A.; Zahedirad, M.; Heravifard, S.; Salekzamani, S. Daily intake of vitamin D- or calcium-vitamin D-fortified Persian yogurt drink (doogh) attenuates diabetes-induced oxidative stress: Evidence for antioxidative properties of vitamin D. J. Hum. Nutr. Diet. 2014, 27, 276–283. [Google Scholar] [CrossRef] [PubMed]
- Neyestani, T.R.; Nikooyeh, B.; Alavi-Majd, H.; Shariatzadeh, N.; Kalayi, A.; Tayebinejad, N.; Heravifard, S.; Salekzamani, S.; Zahedirad, M. Improvement of vitamin D status via daily intake of fortified yogurt drink either with or without extra calcium ameliorates systemic inflammatory biomarkers, including adipokines, in the subjects with type 2 diabetes. J. Clin. Endocrinol. Metab. 2012, 97, 2005–2011. [Google Scholar] [CrossRef] [PubMed] [Green Version]
- Nikooyeh, B.; Neyestani, T.R. Oxidative stress, type 2 diabetes and vitamin D: Past, present and future. Diabetes Metab. Res. Rev. 2016, 32, 260–267. [Google Scholar] [CrossRef] [PubMed]
- Salanti, G.; Del Giovane, C.; Chaimani, A.; Caldwell, D.M.; Higgins, J.P.T. Evaluating the Quality of Evidence from a Network Meta-Analysis. PLoS ONE 2014, 9, e99682. [Google Scholar] [CrossRef]
- Riley, R.D.; Jackson, D.; Salanti, G.; Burke, D.L.; Price, M.; Kirkham, J.; White, I.R. Multivariate and network meta-analysis of multiple outcomes and multiple treatments: Rationale, concepts, and examples. BMJ 2017, 358, j3932. [Google Scholar] [CrossRef] [Green Version]
- Asemi, Z.; Samimi, M.; Tabassi, Z.; Sabihi, S.-s.; Esmaillzadeh, A. A Randomized Controlled Clinical Trial Investigating the Effect of DASH Diet on Insulin Resistance, Inflammation, and Oxidative Stress in Gestational Diabetes. Nutrition 2013, 29, 619–624. [Google Scholar] [CrossRef] [PubMed]
- López-Tinoco, C.; Roca, M.; García-Valero, A.; Murri, M.; Tinahones, F.J.; Segundo, C.; Bartha, J.L.; Aguilar-Diosdado, M. Oxidative Stress and Antioxidant Status in Patients with Late-Onset Gestational Diabetes Mellitus. Acta Diabetol. 2013, 50, 201–208. [Google Scholar] [CrossRef] [PubMed]
- Samimi, M.; Jamilian, M.; Asemi, Z.; Esmaillzadeh, A. Effects of Omega-3 Fatty Acid Supplementation on Insulin Metabolism and Lipid Profiles in Gestational Diabetes: Randomized, Double-Blind, Placebo-Controlled Trial. Clin. Nutr. 2015, 34, 388–393. [Google Scholar] [CrossRef]
- Smith, J.; Sallman, M.A.; Berens, P.; Viteri, O.; Hutchinson, M.; Ramin, S.; Blackwell, S.; Refuerzo, J. 658: Metformin Improved Lipid Profiles in Women with Gestational Diabetes in the First Six Weeks Postpartum. Am. J. Obstet. Gynecol. 2015, 212, S324. [Google Scholar] [CrossRef]
- Yazdchi, R.; Gargari, B.P.; Asghari-Jafarabadi, M.; Sahhaf, F. Effects of Vitamin D Supplementation on Metabolic Indices and Hs-CRP Levels in Gestational Diabetes Mellitus Patients: A Randomized, Double-Blinded, Placebo-Controlled Clinical Trial. Nutr. Res. Pract. 2016, 10, 328–335. [Google Scholar] [CrossRef]
- Yessoufou, A.; Nekoua, M.P.; Gbankoto, A.; Mashalla, Y.; Moutairou, K. Beneficial Effects of Omega-3 Polyunsaturated Fatty Acids in Gestational Diabetes: Consequences in Macrosomia and Adulthood Obesity. J. Diabetes Res. 2015, 2015. [Google Scholar] [CrossRef] [PubMed] [Green Version]
- Aslfalah, H.; Jamilian, M.; Rafiei, F.; Khosrowbeygi, A. Reduction in Maternal Serum Values of Glucose and Gamma-Glutamyltransferase after Supplementation with Alpha-Lipoic Acid in Women with Gestational Diabetes Mellitus. J. Obstet. Gynaecol. Res. 2019, 45, 313–317. [Google Scholar] [CrossRef]
- Dolatkhah, N.; Hajifaraji, M.; Abbasalizadeh, F.; Aghamohammadzadeh, N.; Mehrabi, Y.; Abbasi, M.M. Is There a Value for Probiotic Supplements in Gestational Diabetes Mellitus? A Randomized Clinical Trial. J. Health Popul. Nutr. 2015, 33, 1–8. [Google Scholar] [CrossRef] [PubMed] [Green Version]
- Li, Q.; Xing, B. Vitamin D3-Supplemented Yogurt Drink Improves Insulin Resistance and Lipid Profiles in Women with Gestational Diabetes Mellitus: A Randomized Double Blinded Clinical Trial. Ann. Nutr. Metab. 2016, 68, 285–290. [Google Scholar] [CrossRef] [PubMed]
- Valizadeh, M.; Piri, Z.; Mohammadian, F.; Kamali, K.; Moghadami, H.R.A. The Impact of Vitamin D Supplementation on Post-Partum Glucose Tolerance and Insulin Resistance in Gestational Diabetes: A Randomized Controlled Trial. Int. J. Endocrinol. Metab. 2016, 14. [Google Scholar] [CrossRef] [Green Version]
- Liang, H.Y.; Hou, F.; Ding, Y.L.; Zhang, W.N.; Huang, X.H.; Zhang, B.Y.; Liu, Y. Clinical Evaluation of the Antioxidant Activity of Astragalus in Women with Gestational Diabetes. J. South. Med Univ. 2009, 29, 1402–1404. [Google Scholar]
- Jafarnejad, S.; Saremi, S.; Jafarnejad, F.; Arab, A. Effects of a Multispecies Probiotic Mixture on Glycemic Control and Inflammatory Status in Women with Gestational Diabetes: A Randomized Controlled Clinical Trial. J. Nutr. Metab. 2016, 2016. [Google Scholar] [CrossRef] [Green Version]


| Author | Country | Participants | Intervention | Intervention Period | Outcomes | |
|---|---|---|---|---|---|---|
| VITAMIN D | ||||||
| 1 | Asemi 2013 [22] | Iran | 54 pregnant women diagnosed with GDM (27 vitamin D, 27 Placebo) | Oral vitamin D3 50,000 IU, 2 times in 6 wk (1 at baseline, 2nd at day 21) | 6 weeks (from 24–28 wk of gestation) | FPG, HOMA-IR, HOMA-B, QUICKI, plasma TAC, GSH, total cholesterol, LDL cholesterol, HDL cholesterol, serum calcium, triglycerides, hs-CRP, Insulin |
| 2 | Zhang 2016 [19] | China | 133 pregnant women diagnosed with GDM (38 200 IU vitamin D, 38 50,000 IU monthly (2000 IU daily for 25 days), 37 50,000 IU every 2 weeks (4000 IU daily for 12.5 days), 20 Placebo) | Oral 200 IU vitamin D or 50,000 IU monthly (2000 IU daily for 25 days) or 50,000 IU every 2 weeks (4000 IU daily for 12.5 days) | From 24–28 weeks of pregnancy until delivery | FPG, Insulin, HOMA-IR, total cholesterol, triglycerides, hs-CRP, TAC, GSH |
| VITD + CALCIUM | ||||||
| 3 | Asemi 2014 [23] | Iran | 56 pregnant women diagnosed with GDM (28 Calcium-Vitamin D, 28 Placebo) | Oral 1000 mg calcium per day and Vitamin D3 50,000 IU 2 times in 6 wk (1 at baseline, 2nd at day 21) | 6 weeks (from 24–28 wk of gestation) | FPG, HOMA-IR, HOMA-8, Insulin, QUICKI, Total Cholesterol, Triacylglycerol, LDL cholesterol, HDL cholesterol, hs-CRP, NO, TAC, GSH, MDA |
| VITD + PROBIOTIC/PROBIOTIC ALONE | ||||||
| 4 | Jamilian 2018 [24] | Iran | 87 pregnant women diagnosed with GDM (30 Vitamin D plus Probiotic, 29 Probiotic, 28 Placebo) | Oral 50,000 IU vitamin D3 every 2 weeks plus 8 × 10⁹ CFU/g probiotic containing L. acidophilus, B. bifidum, L. reuteri, and L fermentum (each 2 × 10⁹) or 8 × 10⁹ CFU/g probiotic containing Lactobacillus acidophilus, Bifidobacterium bifidum, L. reuteri, and Lactobacillus fermentum (each 2 × 10⁹) | 6 weeks (from 24–28 wk of gestation) | 25-hydroxyvitamin D, FPG, Insulin, HOMA-IR, QUICKI, Triglycerides, VLDL-cholesterol, total cholesterol, LDL-cholesterol, HDL-cholesterol, total-/HDL-cholesterol ratio, hs-CRP, NO, TAC, GSH, MDA, newborns’ hospitalization, newborns’ hyperbilirubinemia, polyhydramnios, preterm delivery, newborns’ macrosomia > 4000 g, c-section, gestational age, pre-eclampsia, newborns’ weight, newborns’ length, newborns’ head circumference, Apgar score, newborns’ hypoglycemia |
| PROBIOTICS | ||||||
| 5 | Karamali 2018 [25] | Iran | 60 pregnant women diagnosed with GDM (30 synbiotic capsule, 30 Placebo) | One oral synbiotic capsule containing Lactobacillus acidophilus strain T16, L. casei strain T2 and Bifidobacterium bifidum strain T1 (2 × 10⁹ CFU/g each) plus 800 mg inulin | 6 weeks | Primary outcomes were inflammatory markers (hs-CRP). The secondary outcomes were biomarkers of oxidative stress (TAC, NO, GSH, MDA) and pregnancy outcomes (c-section, preterm delivery, pre-eclampsia, polyhydramnios, maternal hospitalization, macrosomia > 4000 g, gestational age, newborns’ weight, newborns’ length, newborns’ head circumference, Apgar score, newborns’ hyperbilirubinemia, newborns’ hypoglycemia) |
| 6 | Babadi 2018 [26] | Iran | 48 pregnant women diagnosed with GDM (24 Probiotic supplement, 24 Placebo) | Oral probiotic capsule containing Lactobacillus acidophilus, Lactobacillus casei, Bifidobacterium bifidum, and Lactobacillus fermentum (2 × 10⁹ CFU/g each) per day | 6 weeks (from 24–28 wk of gestation) | Gene expression of PPAR-γ, TGF-β, VEGF and TNF-α, LDRL, IL-1, IL-8 FPG, serum insulin, HOMA-IR, QUICKI, triglycerides, VLDL-cholesterol, total-/HDL-cholesterol ratio, HDL cholesterol, MDA, NO, TAC |
| 7 | Hajifaraji 2018 [27] | Iran | 64 pregnant women diagnosed with GDM (32 probiotic supplement, 32 Placebo). Finally, 56 analyzed (29 probiotic, 27 placebo) | Oral probiotic capsule containing L. acidophilus LA-5, Bifidobacterium BB-12, Streptococcus thermophilus and Lactobacillus delbrueckii bulgaricus (4 biocap > 4 × 10⁹ CFU) per day | 8 weeks (from 24 to 28-weeks (+6 days) of gestation) | hs-CRP, TNF-α, IL-6, TAC, MDA, serum GSHR, erythrocyte GPx, serum uric acid, erythrocyte SOD |
| 8 | Badehnoosh 2018 [28] | Iran | 60 pregnant women diagnosed with GDM (30 Probiotic supplement, 30 Placebo) | Oral probiotic capsule containing Lactobacillus acidophilus, Lactobacillus casei and Bifidobacterium bifidum (2×10⁹ CFU/g each) per day | 6 weeks (from 24–28 wk of gestation) | FPG, hs-CRP, NO, TAC, GSH, MDA, MDA/TAC, c-section, preterm delivery, need to insulin therapy after intervention, pre-eclampsia, polyhydramnios, maternal hospitalization, macrosomia > 4000 g, gestational age, newborn’s weight, newborn’s length, newborn’s head circumference, LGA, Apgar score (1 min and 5 min), newborns’ hyperbilirubinemia, newborn’s hospitalization, newborn’s hypoglycemia |
| MAGNESIUM | ||||||
| 9 | Asemi 2015 [29] | Iran | 70 pregnant women diagnosed with GDM (35 Magnesium, 35 Placebo) | Oral magnesium supplement 250 mg daily for 6 wk | 6 weeks (from 24–28 wk of gestation) | FPG, HOMA-IR, QUICKI, serum insulin levels, hs-CRP, plasma GSH, triglycerides, HOMA-B, MDA, plasma NO, TAC, GSH, magnesium, total cholesterol, newborn hyperbilirubinemia, newborn hospitalization rate, c-section, need for insulin therapy, polyhydramnios, maternal hospitalization, preterm delivery, gestational age, newborn birth size, Apgar score, and newborn hypoglycemia, macrosomia, preterm delivery, preeclampsia, weight-length-head circumference of newborns |
| MAGN-ZINC-CALCIUM-VITD | ||||||
| 10 | Jamilian 2019 [30] | Iran | 60 pregnant women diagnosed with GDM (30 magnesium-zinc-calcium-vitamin D co-supplementation, 30 Placebo) | Oral 100 mg magnesium, 4 mg zinc, 400 mg calcium plus 200IU vitamin D supplements twice a day | 6 weeks | hs-CRP, FPG, Magnesium, Zinc, Calcium, 25-OH-vitamin D, total nitrite, TAC, GSH, MDA, c-section, preterm delivery, need to insulin therapy after intervention, pre-eclampsia, polyhydramnios, macrosomia > 4000 g, gestational age, newborns’ weight, newborns’ length, newborns’ head circumference, Apgar score, newborns’ hyperbilirubinemia, newborns’ hypoglycemia |
| OMEGA-3 | ||||||
| 11 | Jamilian 2016 [31] | Iran | 54 pregnant women diagnosed with GDM (27 omega-3 supplement, 27 Placebo) | Oral 1000 mg omega-3 fatty acid supplements (containing 180 mg eicosapentaenoic acid and 120 mg docosahexanoic acid) per day | 6 weeks (from 24–28 wk of gestation) | maternal polyhydramnios, pre-eclampsia, gestational age, cesarean section, newborn’s size, Apgar score, hyperbilirubinemia, inflammatory factors and biomarkers of oxidative stress (hs-CRP, TAC, NO, GSH, MDA) |
| OMEGA-3 + VIT E | ||||||
| 12 | Jamilian 2017 [32] | Iran | 60 pregnant women diagnosed with GDM (30 Omega-3 plus Vitamin E supplements, 30 Placebo) | Oral 1000 mg omega-3 fatty acids from flaxseed oil plus 400 IU vitamin E supplements per day | 6 weeks | TAC, NO, GSH, MDA, hs-CRP, maternal polyhydramnios, preeclampsia, gestational age, caesarean section, newborn’s size, Apgar score, newborns’ hyperbilirubinemia, newborns’ hospitalization |
| OMEGA-3 + VIT D | ||||||
| 13 | Razavi 2017 [33] | Iran | 120 pregnant women diagnosed with GDM (30 omega-3, 30 vitD, 30 omega-3 +vitD, 30 Placebo) | 1000 mg omega-3 fatty acids containing 180 mg eicosapentaenoic acid (EPA) and 120 mg docosahexaenoic acid (DHA) twice a day or 50,000 IU vitamin D every 2 weeks or both | 6 weeks (from 24–28 wk of Gestation) | Primary outcome: inflammatory factors (hs-CRP) Secondary outcomes: biomarkers of oxidative stress (TAC, NO, GSH, MDA) and pregnancy outcomes (c-section, preterm delivery, pre-eclampsia, polyhydramnios, macrosomia > 4000 g, gestational age, newborns’ weight, newborns’ length, newborns’ head circumference, Apgar score, newborns’ hyperbilirubinemia, newborns’ hospitalization, newborns’ hypoglycemia) |
| SELENIUM | ||||||
| 14 | Asemi 2015 [34] | Iran | 70 pregnant women diagnosed with GDM (35 Selenium, 35 Placebo) | Oral selenium supplement 200 µg as tablet per day for 6 wk | 6 weeks (from 24–28 wk of Gestation) | FPG, HOMA-IR, QUICKI, serum insulin levels, hs-CRP, plasma GSH, plasma MDA, HOMA-B, lipid profiles, plasma NO, TAC concentrations, systolic and diastolic blood pressure, c-section, newborn’s hyperbilirubinemia, weight-height-head circumference of newborns |
| Alpha-Lipoid-Acid | ||||||
| 15 | Aslfalah 2019 [21] | Iran | 60 pregnant women diagnosed with GDM (30 Alpha-lipoic acid (ALA), 30 Placebo) | Orally one capsule of ALA (100 mg) per day for 8 weeks during lunch | 8 weeks (from 24–28 wk of gestation) | FPG, Insulin, HOMA-IR, QUICKI, ALA, Adiponectin, Leptin, MDA/TAC, A/L ratio, L/A ratio, A/H ratio |
| SOY | ||||||
| 16 | Fei 2014 [20] | China | 97 pregnant women diagnosed with GDM (46 SBOS, 51 Placebo) | SBOS (soybean oligosaccharides) 10 g/day in 200–300 mL warm water, took in orally before sleep). 100 min in week 2. | 8 weeks | SOD, Catalase, GPx, TBARS, FPG, FINS, Adiponectin, HOMA-IR, HBCI (islet b-cells function index), need to insulin therapy after intervention |
| 17 | Jamilian 2015 [35] | Iran | 68 pregnant women diagnosed with GDM (34 soy protein, 34 Placebo) | A diet (soy diet) containing the 0.8-g/kg protein with 35% animal protein, 35% soy protein, and 30% other plant proteins | 6 weeks | FPG, Insulin, HOMA-IR, HOMA-B, QUICKI, triglycerides, VLDL-C, TC, LDL cholesterol, HDL cholesterol T-/HDL-C ratio, hs-CRP, NO, TAC, GSH, MDA, newborn hyperbilirubinemia, newborn hospitalization, c-section, need for insulin therapy after the intervention, polyhydramnios, maternal hospitalization, preterm delivery, gestational age, newborn birth size, Apgar score, and newborn hypoglycemia |
| ZINC | ||||||
| 18 | Karamali 2015 [36] | Iran | 50 pregnant women diagnosed with GDM (25 zinc supplementation, 25 Placebo) | Oral 233 mg zinc gluconate (containing 30 mg zinc) | 6 weeks (from 24–28 wk of Gestation) | Zinc, hs-CRP, TAC, MDA, NO, GSH, c-section, need to insulin therapy after intervention, polyhydramnios, macrosomia > 4000 g, gestational age, newborns’ weight, newborns’ length, newborns’ head circumference, Apgar score, newborns’ hyperbilirubinemia, newborns’ hypoglycemia |
| VITAMIN C | ||||||
| 19 | Maged 2016 [37] | Egypt | 200 pregnant women diagnosed with GDM (100Vitamin C, 100 Placebo) | Orally 1-g L-ascorbic acid (vitamin C) per day | from 28–32 weeks until the time of delivery | Neonatal outcomes (Apgar score, neonatal sugar, NICU admission, RDS, hypoglycemia, hyperbilirubinemia needing phototherapy, hyperbilirubinemia needing exchange transfusion, perinatal mortality) nonenzymatic (GSH and MDA) and enzymatic (SOD, CAT, GPx) oxidative stress parameters in placental tissues homogenates, maternal blood plasma/lysate and neonatal blood. |
| Study | Intervention | Randomization Process | Deviations from Intended Interventions | Missing Outcome Data | Measurement of the Outcome | Selection of the Reported Results | Overall |
|---|---|---|---|---|---|---|---|
| Asemi 2013 [22] | Vitamin D |  | | | | |  |
| Asemi 2014 [23] | Vitamin D + calcium | | | | | | |
| Asemi 2015 [34] | Selenium | | | | | | |
| Asemi 2015 [29] | Magnesium | | | | | | |
| Badehnoosh 2018 [28] | Probiotics | | | | | | |
| Jamilian 2015 [35] | Soy | | | | | | |
| Jamilian 2016 [31] | Omega3 | | | | | | |
| Jamilian 2017 [32] | Omega3 + Vitamin E | | | | | | |
| Jamilian 2019 [30] | magnesium-zinc-calcium-vitamin D | | | | | | |
| Karamali 2015 [36] | Zinc | | | | | | |
| Karamali 2018 [25] | Probiotics | | | | | | |
| Razavi 2017 [33] | Vitamin D + Omega3 | | | | | | |
| Babadi 2018 [26] | Probiotics | | | | | | |
| Hajifaraji 2018 [27] | Probiotics | | | | | | |
| Jamilian 2018 [24] | Vitamin D + Probiotics | | | | | | |
| Zhang 2016 [19] | Vitamin D | | | | | | |
| Maged 2016 [37] | Vitamin C |  | | | | |  |
Low risk Some concerns  High risk High risk | |||||||
| MAG+ZINC+CAL | 54.50 (11.27, 97.73) | ||||||||||
| 7.40 (−199.99, 214.79) | MAG | 61.90 (−91.90, 215.70) | |||||||||
| 41.74 (−88.76, 172.25) | 34.34 (−162.68, 231.37) | PROB | 96.34 (51.10, 141.58) | ||||||||
| −8.97 (−158, 66, 140, 72) | −16.37 (−226.59, 193.85) | −50.71 (−185.67, 84.24) | SEL | 45.53 (−9.70, 100.76) | |||||||
| 62.30 (−97.32, 221.92) | 54.90 (−162.51, 272.31) | 20.56 (−125.34, 166.45) | 71.27 (−92.01, 234.55) | SOY | 116.80 (38.55, 195.05) | ||||||
| −25.35 (−170.63, 119.94) | −32.75 (−239.85, 174.36) | −67.09 (−197.14, 62.96) | −16.38 (−165.67, 132.92) | −87.65 (−246.90, 71.61) | VIT D | −33.30 (−89.13, 22.53) | 37.00 (−13.85, 87.85) | 14.85 (−81.08, 110.79) | |||
| −69.92 (−225.90, 86.06) | −77.32 (−292.07, 137.43) | −111.66 (−253.57, 30.24) | −60.95 (−220.67, 98.77) | −132.22 (−301.29, 36.85) | −44.57 (−200.18, 111.03) | VIT D + CAL | −15.42 (−85.95, 55.11) | ||||
| 33.90 (−117.53, 185.33) | 26.50 (−184.97, 237.97) | −7.84 (−144.73, 129.04) | 42.87 (−112.41, 198.15) | −28.40 (−193.28, 136.48) | 59.25 (−91.80, 210.29) | 103.82 (−57.54, 265.18) | ZINC | 88.40 (28.61, 148.19) | |||
| −17.47 (−145.62, 110.67) | −24.87 (−220.34, 170.59) | −59.22 (−169.79, 51.36) | −8.50 (−141.17, 124.17) | −79.77 (−223.56, 64.02) | 7.87 (−94.82, 110.56) | 52.45 (−87.29, 192.18) | −51.37 (−186.01, 83.26) | Ω3 | 3.70 (−38.61, 46.01) | 35.68 (−68.64, 140.01) | |
| 11.65 (−128.99, 152.30) | 4.25 (−199.63, 208.13) | −30.09 (−154.94, 94.76) | 20.62 (−124.16, 165.41) | −50.65 (−205.68, 104.39) | 37.00 (−69.44, 143.44) | 81.57 (−69.71, 232.86) | −22.25 (−168.83, 124.34) | 29.13 (−66.88, 125.14) | Ω3 + VIT D | 91.10 (50.05, 132.15) | |
| 165.50 (−2.44, 333.44) | 158.10 (−65.49, 381.69) | 123.76 (−31.20, 278.71) | 174.47 (3.05, 345.89) | 103.20 (−76.97, 283.37) | 190.85 (23.25, 358.44) | 235.42 (58.47, 412.37) | 131.60 (−41.35, 304.55) | 182.97 (30.00, 335.95) | 153.85 (−9.74, 317.43) | Ω3 + VIT E | 220.00 (125.93, 314.07) |
| 54.5 (−48.52, 157.52) | 61.9 (−118.1, 241.9) | 96.24 (16.12, 176.36) | 45.53 (−63.07, 154.13) | 116.8 (−5.13, 238.73) | 29.15 (−73.3, 131.6) | −15.42 (−132.54, 101.7) | 88.40 (−22.6, 199.4) | 37.03 (−39.18, 113.24) | 66.15 (−29.6, 161.91) | 220.0 (87.36, 35) | PLA |
| MAG+ZINC+CAL | −0.60 (−1.01, −0.19) | |||||||||
| −0.20 (−0.98, 0.58) | MAG | −0.80 (−1.46, −0.14) | ||||||||
| 0.01 (−0.70, 0.73) | 0.21 (−0.67, 1.10) | PROB | −0.45 (−0.74, −0.16) | |||||||
| 0.10 (−0.58, 0.78) | 0.30 (−0.56, 1.16) | 0.09 (−0.71, 0.88) | SOY | −0.50 (−1.04, 0.04) | ||||||
| −0.14 (−0.77, 0.50) | 0.06 (−0.76, 0.88) | −0.15 (−0.91, 0.61) | −0.24 (−0.97, 0.49) | VIT D | 0.10 (−0.27, 0.47) | −0.30 (−0.55, −0.05) | −0.70 (−1.23, −0.17) | |||
| −0.27 (−1.15, 0.61) | −0.07 (−1.09, 0.95) | −0.28 (−1.26, 0.69) | −0.37 (−1.32, 0.58) | −0.13 (−1.05, 0.79) | VIT D + CAL | −0.87 (−1.65, −0.09) | ||||
| −0.30 (−1.31, 0.71) | −0.10 (−1.24, 1.04) | −0.31 (−1.41, 0.78) | −0.40 (−1.47, 0.67) | −0.16 (−1.21, 0.88) | −0.03 (−1.24, 1.18) | ZINC | −0.90 (−1.83, 0.03) | |||
| −0.30 (−1.31, 0.71) | −0.05 (−0.89, 0.78) | −0.27 (−1.04, 0.51) | −0.35 (−1.10, 0.39) | −0.12 (−0.47, 0.24) | 0.02 (−0.92, 0.95) | 0.05 (−1.01, 1.10) | Ω3 | −0.20 (−0.57, 0.17) | −0.85 (−1.36, −0.34) | |
| −0.44 (−2.33, 1.45) | −0.24 (−2.20, 1.72) | −0.45 (−2.39, 1.48) | −0.54 (−2.46, 1.39) | −0.30 (−2.10, 1.50) | −0.17 (−2.17, 1.84) | −0.14 (−2.20, 1.93) | −0.18 (−2.00, 1.63) | Ω3 + VIT D | −1.00 (−1.53, −0.47) | |
| −0.10 (−0.82, 0.62) | 0.10 (−0.79, 0.99) | −0.11 (−0.95, 0.72) | −0.20 (−1.01, 0.61) | 0.04 (−0.73, 0.81) | 0.17 (−0.81, 1.15) | 0.20 (−0.90, 1.30) | 0.15 (−0.63, 0.94) | 0.34 (−1.60, 2.28) | Ω3 + VIT E | −0.70 (−1.30, −0.10) |
| −0.60 (−1.01, −0.19) | −0.80 (−1.46, −0.14) | −0.59 (−1.17, 0.00) | −0.50 (−1.04, 0.04) | −0.74 (−1.22, −0.25) | −0.87 (−1.65, −0.09) | −0.90 (−1.83, 0.03) | −0.85 (−1.36, −0.34) | −1.04 (−2.88, 0.81) | −0.70 (−1.30, −0.10) | PLA |
| MAG+ZINC+CAL | −20.80 (−68.41, 26.81) | |||||||||||
| 266.23 (−18.84, 551.31) | VIT D + PROB | 156.00 (108.10, 203.90) | ||||||||||
| 76.10 (−219.56, 371.76) | 190.13 (−133.69, 513.96) | MAG | 55.30 (−105.51, 216.11) | |||||||||
| 145.63 (−63.27, 354.54) | 120.60 (−73.37, 314.57) | 69.53 (−189.76, 328.83) | PROB | 102.07 (30.83, 173.30) | ||||||||
| 91.70 (−165.40, 348.80) | −174.53 (−463.58, 114.51) | 15.60 (−283.89, 315.09) | −53.93 (−268.23, 160.36) | SEL | 70.92 (3.47, 138.37) | |||||||
| 24.30 (−236.11, 284.71) | −241.93 (−533.93, 50.06) | −51.80 (−354.13, 250.53) | −121.33 (−339.59, 96.92) | −67.40 (−332.15, 197.35) | SOY | 3.50 (−75.62, 82.62) | ||||||
| 92.98 (−131.05, 317.01) | −173.26 (−433.30, 86.78) | 16.88 (−254.75, 288.51) | −52.66 (−225.85, 120.54) | 1.28 (−227.78, 230.34) | 68.68 (−164.09, 301.45) | VIT D | −37.10 (−89.16, 14.96) | 136.20 (92.10, 180.30) | 110.77 (66.44, 155.10) | |||
| −17.25 (−278.25, 243.75) | −283.48 (−576.00, 9.03) | −93.35 (−396.19, 209.49 | −162.88 (−381.84, 56.07) | −108.95 (−374.28, 156.38) | −41.55 (−310.08, 226.98) | −110.23 (−343.65, 123.20) | VIT D + CAL | −38.05 (−119.08, 42.98) | ||||
| 37.00 (−222.19, 296.19) | −229.23 (−520.14, 61.67) | −39.10 (−340.38, 262.18) | −108.63 (−325.43, 108.16) | −54.70 (−318.25, 208.85) | 12.70 (−254.08, 279.48) | −55.98 (−287.38, 175.43) | 98.44 (−128.89, 325.77) | ZINC | 16.20 (−58.80, 91.20) | |||
| 81.19 (−136.48, 298.86) | −185.05 (−439.85, 69.76) | 5.09 (−261.32, 271.50) | −64.45 (−229.68, 100.78) | −10.51 (−233.36, 212.33) | 56.89 (−169.77, 283.54) | −11.79 (−162.61, 139.02) | 242.74 (−6.52, 492.00) | 44.19 (−181.06, 269.44) | Ω3 | 99.10 (49.18, 149.02) | 54.10 (−137.46, 245.66) | |
| 225.49 (−14.99, 465.97) | −40.74 (−315.13, 233.64) | 149.39 (−135.96, 434.74) | 79.86 (−114.21, 273.92) | 133.79 (−111.39, 378.97) | 201.19 (−47.45, 449.83) | 132.51 (−36.19, 301.22) | −18.13 (−120.65, 84.39) | 188.49 (−58.88, 435.86) | 144.30 (−20.15, 308.76) | Ω3 + VIT D | 249.40 (205.49, 293.31) | |
| 358.70 (95.98, 621.42) | 92.47 (−201.59, 386.52) | 282.60 (−21.73, 586.93) | 213.07 (−7.94, 434.08) | 267.00 (−0.02, 534.02) | 334.40 (64.19, 604.61) | 265.72 (30.37, 501.08) | −69.61 (−182.38, 43.16) | 321.70 (52.66, 590.74) | 277.51 (48.20, 506.82) | 133.21 (−117.86, 384.28) | Ω3 + VIT ET E | 337.30 (250.85, 423.75) |
| −20.80 (−199.43, 157.83) | 245.43 (23.27, 467.60) | 55.30 (−180.29, 290.89) | 124.83 (16.52, 233.15) | 70.90 (−114.00, 255.80) | 3.50 (−185.98, 192.98) | 72.18 (−63.03, 207.38) | −38.05 (−228.34, 152.24) | 16.20 (−171.60, 204.00) | 60.39 (−63.99, 184.76) | 204.69 (43.69, 365.69) | 337.90 (145.25, 530.55) | PLA |
| MAG+ZINC+CAL | −0.70 (−1.17, −0.23) | |||||||||||
| 0.34 (−0.24, 0.92) | VIT D + PROB | −0.30 (−0.74, 0.14) | ||||||||||
| 0.50 (−0.35, 1.35) | −0.16 (−0.94, 0.62) | MAG | −0.20 (−0.90, 0.50) | |||||||||
| −0.08 (−0.59, 0.44) | 0.42 (0.11, 0.72) | −0.58 (−1.31, 0.16) | PROB | −0.78 (−0.98, −0.57) | ||||||||
| 0.10 (−0.74, 0.94) | 0.24 (−0.53, 1.01) | −0.40 (−1.39, 0.59) | 0.18 (−0.55, 0.90) | SOY | −0.60 (−1.29, 0.09) | |||||||
| −2.17 (−2.68, −1.66) | 2.51 (2.12, 2.90) | −2.67 (−3.40, −1.94) | −2.09 (−2.37, −1.82) | −2.27 (−2.99, −1.55) | VIT C | −2.87 (−3.06, −2.68) | ||||||
| −0.59 (−1.27, 0.10) | 0.93 (0.33, 1.53) | −1.09 (−1.95, −0.23) | −0.51 (−1.05, 0.02) | −0.69 (−1.54, 0.16) | 1.58 (1.05, 2.11) | VIT D | −0.70 (−0.88, −0.52) | 0.00 (−0.15, 0.15) | −1.20 (−1.78, −0.62) | |||
| 0.13 (−0.74, 1.00) | 0.21 (−0.59, 1.01) | −0.37 (−1.38, 0.64) | 0.21 (−0.55, 0.96) | 0.03 (−0.98, 1.04) | 2.30 (1.55, 3.05) | 0.72 (−0.16, 1.60) | VIT D + CAL | −0.57 (−1.30, 0.16) | ||||
| 0.90 (−0.26, 2.06) | 0.56 (−0.55, 1.67) | 0.40 (−0.87, 1.67) | 0.98 (−0.10, 2.05) | 0.80 (−0.47, 2.07) | 3.07 (1.99, 4.15) | 1.49 (0.32, 2.66) | 0.77 (−0.52, 2.06) | ZINC | 0.20 (−0.86, 1.26) | |||
| 0.11 (−0.56, 0.79) | −0.23 (−0.82, 0.36) | −0.39 (−1.24, 0.47) | 0.19 (−0.34, 0.71) | 0.01 (−0.83, 0.86) | 2.28 (1.76, 2.80) | 0.70 (0.59, 0.81) | −0.02 (−0.89, 0.86) | −0.79 (−1.95, 0.38) | Ω3 | −0.70 (−0.88, −0.52) | −0.59 (−1.08, −0.10) | |
| −0.59 (−1.27, 0.10) | −0.93 (−1.53, −0.33) | −1.09 (−1.95, −0.23) | −0.51 (−1.05, 0.02) | −0.69 (−1.54, 0.16) | 1.58 (1.05, 2.11) | 0.00 (−0.15, 0.15) | −0.72 (−1.60, 0.16) | −1.49 (−2.66, −0.32) | −0.70 (−0.81, −0.59) | Ω3 + VIT D | −1.20 (−1.78, −0.62) | |
| −0.30 (−1.12, 0.52) | −0.64 (−1.39, 0.11)) | −0.80 (−1.77, 0.17) | −0.22 (−0.92, 0.47) | −0.40 (−1.36, 0.56) | 1.87 (1.18, 2.56) | 0.29 (−0.54, 1.12) | −0.43 (−1.42, 0.56) | −1.20 (−2.45, 0.05) | −0.41 (−1.24, 0.41) | 0.29 (−0.54, 1.12) | Ω3 + VIT E | −1.00 (−1.67, −0.33) |
| −0.70 (−1.17, −0.23) | −0.36 (−0.70, −0.02) | −0.20 (−0.90, 0.50) | −0.78 (−0.98, −0.57) | −0.60 (−1.29, 0.09) | 2.87 (−3.06, −2.68) | −1.29 (−1.78, −0.79) | −0.57 (−1.30, 0.16) | 0.20 (−0.86, 1.26) | −0.59 (−1.07, −0.10) | −1.29 (−1.78, −0.79) | −1.00 (−1.67, −0.33 | PLA |
| MAG+ZINC+CAL | 20.90 (−19.17, 60.97) | ||||||||||
| 71.17 (2.80, 139.54) | SEL | 92.07 (37.66, 146.48) | |||||||||
| −99.00 (−195.11, −2.89) | 170.17 (67.79, 272.55) | MAG | −78.10 (−164.83, 8.63) | ||||||||
| 19.82 (−31.66, 71.30) | 51.35 (−11.06, 113.77) | 118.82 (26.85, 210.79) | PROB | 40.72 (10.13, 71.31) | |||||||
| 73.70 (−1.58, 148.98) | 2.53 (−80.61, 85.67) | 172.70 (65.58, 279.82) | 53.88 (−16.04, 123.80) | SOY | 94.60 (31.73, 157.47) | ||||||
| 8.04 (−51.61, 67.69) | −63.13 (−132.44, 6.17) | 107.04 (10.26, 203.82) | −11.78 (−64.49, 40.94) | −65.66 (−141.79, 10.47) | VIT D | 0.70 (0.52, 0.88) | 52.90 (14.70, 91.10) | −199.20 (−716.26, 317.85) | |||
| 77.51 (−21.39, 176.41) | 6.34 (−98.67, 111.35) | 176.51 (51.65, 301.37) | 57.69 (−37.19, 152.57) | 3.81 (−105.82, 113.44) | 69.47 (−30.08, 169.02) | VIT D + CAL | 3.87 (−85.94, 93.68) | ||||
| −30.80 (−101.42, 39.82) | −101.97 (−180.92, −23.02) | 68.20 (−35.70, 172.10) | −50.62 (−115.49, 14.26) | −104.50 (−189.51, −19.49) | −38.84 (−110.37, 32.69) | −108.31 (−214.80, −1.82) | ZINC | −9.90 (−67.11, 47.31) | |||
| 10.76 (−48.85, 70.37) | −60.41 (−129.69, 8.86) | 109.76 (13.00, 206.51) | −9.06 (−61.74, 43.62) | −62.94 (−139.05, 13.16) | 2.72 (−29.06, 34.50) | −66.75 (−166.28, 32.77) | 41.56 (−29.94, 113.06) | Ω3 | 45.90 (6.80, 85.00) | 26.71 (−18.18, 71.59) | |
| 59.38 (−5.11, 123.86) | −11.79 (−85.30, 61.72) | 158.38 (58.55, 258.21) | 39.56 (−18.57, 97.70) | −14.32 (−94.30, 65.66) | 51.34 (13.37, 89.32) | −18.13 (−120.65, 84.39) | 90.18 (14.57, 165.79) | 48.62 (9.89, 87.35) | Ω3 + VIT D | 83.70 (28.82, 138.58) | |
| 7.90 (−71.88, 87.68) | −63.27 (−150.51, 23.97) | 106.90 (−3.43, 217.23) | −11.92 (−86.66, 62.83) | −65.80 (−158.56, 26.96) | −0.14 (−80.73, 80.45) | −69.61 (−182.38, 43.16) | 38.70 (−50.32, 127.72) | −2.86 (−83.42, 77.70) | −51.48 (−135.71, 32.75) | Ω3 + VIT E | 28.80 (−39.40, 97.00) |
| 20.90 (−20.51, 62.31) | 92.07 (37.66, 146.48) | −78.10 (−164.83, 8.63) | 40.72 (10.13, 71.31) | 94.60 (31.73, 157.47) | 28.94 (−13.99, 71.87) | 98.41 (8.60, 188.22) | −9.90 (−67.11, 47.31) | 31.66 (−11.23, 74.54) | 80.28 (30.84, 129.72) | 28.80 (−39.40, 97.00) | PLA |
| MAG+ZINC+CAL | 19.20 (−37.70, 76.10) | ||||||||||||
| −0.45 (−1.97, 1.07) | MAG | −37.90 (−100.12, 24.32) | |||||||||||
| −0.22 (−1.74, 1.30) | 0.23 (−1.28, 1.74) | SEL | −7.97 (−83.12, 67.18) | ||||||||||
| 3.26 (1.74, 4.77) | 3.71 (2.21, 5.21) | 3.47 (1.97, 4.97) | VIT C | 0.76 (0.70, 0.82) | |||||||||
| 0.08 (−1.13, 1.30) | 0.53 (−0.67, 1.73) | −0.30 (−1.50, 0.90) | 3.18 (1.99, 4.36) | PROB | 28.60 (−10.48, 67.68) | ||||||||
| −0.76 (−2.29, 0.77) | −0.31 (−1.82, 1.21) | −0.54 (−2.06, 0.97) | 4.01 (2.51, 5.52) | −0.84 (−2.05, 0.37) | SOY | −106.80 (−191.91, −21.69) | |||||||
| −0.54 (−1.85, 0.78) | −0.09 (−1.39, 1.22) | −0.32 (−1.62, 0.98) | −3.79 (−5.08, −2.50) | −0.62 (−1.54, 0.31) | 0.22 (−1.09, 1.53) | VIT D | −82.90 (−112.63, −53.17) | 114.60 (84.08, 145.12) | −32.46 (−131.25, 66.33) | ||||
| −0.02 (−1.48, 1.44) | 0.43 (−1.02, 1.88) | 0.20 (−1.25, 1.65) | −3.28 (−4.71, −1.84) | −0.10 (−1.08, 0.88) | 0.74 (−0.72, 2.19) | 0.52 (−0.71, 1.75) | VIT D + PROB | −28.60 (−128.80, 71.60) | |||||
| −0.50 (−2.04, 1.04) | −0.05 (−1.58, 1.48) | −0.28 (−1.81, 1.25) | −3.76 (−5.28, −2.24) | −0.58 (−1.81, 0.64) | 0.26 (−1.28, 1.79) | 0.04 (−1.29, 1.36) | 0.48 (−0.99, 1.95) | VIT D + CAL | −92.37 (−235.91, 51.17) | ||||
| −0.08 (−1.63, 1.47) | 0.37 (−1.17, 1.91) | 0.14 (−1.40, 1.68) | −3.34 (−4.87, −1.81) | −0.16 (−1.40, 1.07) | 0.68 (−0.87, 2.22) | 0.46 (−0.88, 1.79) | −0.06 (−1.54, 1.42) | 0.42 (−1.14, 1.98) | ZINC | 9.90 (−51.44, 71.24) | |||
| −0.02 (−1.33, 1.30) | 0.43 (−0.87, 1.74) | 0.20 (−1.10, 1.50) | −3.27 (−4.57, −1.98) | −0.10 (−1.03, 0.83) | 0.74 (−0.57, 2.05) | 0.52 (−0.37, 1.41) | 0.00 (−1.23, 1.24) | 0.48 (−0.84, 1.81) | 0.06 (−1.27, 1.40) | Ω3 | 31.70 (1.66, 61.74) | −8.45 (−188.50, 171.59) | |
| 0.64 (−0.82, 2.10) | 1.09 (−0.36, 2.54) | 0.86 (−0.59, 2.31) | −2.62 (−4.05, −1.18) | 0.56 (−0.56, 1.68) | 1.40 (−0.06, 2.85) | 1.18 (0.16, 2.20) | 0.66 (−0.72, 2.05) | 1.14 (−0.33, 2.61) | 0.72 (−0.76, 2.20) | 0.66 (−0.36, 1.67) | Ω3 + VIT D | 110.20 (48.54, 171.86) | |
| −0.45 (−1.99, 1.08) | 0.00 (−1.53, 1.52) | −0.24 (−1.76, 1.29) | −3.71 (−5.22, −2.20) | −0.53 (−1.75, 0.68) | 0.30 (−1.22, 1.83) | 0.08 (−1.23, 1.40) | −0.43 (−1.90, 1.03) | 0.05 (−1.49, 1.59) | −0.37 (−1.92, 1.18) | −0.44 (−1.76, 0.88) | −1.09 (−2.56, 0.37) | Ω3 + VIT E | −48.10 (−132.46, 36.26) |
| 0.17 (−0.92, 1.25) | −0.28 (−1.35, 0.79) | −0.05 (−1.12, 1.02) | 3.42 (2.37, 4.48) | 0.25 (−0.30, 0.80) | −0.59 (−1.66, 0.49) | −0.37 (−1.11, 0.38) | 0.15 (−0.83, 1.13) | −0.33 (−1.43, 0.76) | 0.09 (−1.02, 1.20) | 0.15 (−0.60, 0.90) | 0.81 (−0.17, 1.79) | 0.28 (−1.37, 0.80) | PLA |
Publisher’s Note: MDPI stays neutral with regard to jurisdictional claims in published maps and institutional affiliations. |
© 2021 by the authors. Licensee MDPI, Basel, Switzerland. This article is an open access article distributed under the terms and conditions of the Creative Commons Attribution (CC BY) license (https://creativecommons.org/licenses/by/4.0/).
Share and Cite
Chatzakis, C.; Sotiriadis, A.; Tsakmaki, E.; Papagianni, M.; Paltoglou, G.; Dinas, K.; Mastorakos, G. The Effect of Dietary Supplements on Oxidative Stress in Pregnant Women with Gestational Diabetes Mellitus: A Network Meta-Analysis. Nutrients 2021, 13, 2284. https://doi.org/10.3390/nu13072284
Chatzakis C, Sotiriadis A, Tsakmaki E, Papagianni M, Paltoglou G, Dinas K, Mastorakos G. The Effect of Dietary Supplements on Oxidative Stress in Pregnant Women with Gestational Diabetes Mellitus: A Network Meta-Analysis. Nutrients. 2021; 13(7):2284. https://doi.org/10.3390/nu13072284
Chicago/Turabian StyleChatzakis, Christos, Alexandros Sotiriadis, Evangelia Tsakmaki, Maria Papagianni, George Paltoglou, Konstantinos Dinas, and George Mastorakos. 2021. "The Effect of Dietary Supplements on Oxidative Stress in Pregnant Women with Gestational Diabetes Mellitus: A Network Meta-Analysis" Nutrients 13, no. 7: 2284. https://doi.org/10.3390/nu13072284