Review

Relative Efficacy of Weight Management, Exercise, and Combined Treatment for Muscle Mass and Physical Sarcopenia Indices in Adults with Overweight or Obesity and Osteoarthritis: A Network Meta-Analysis of Randomized Controlled Trials

1
College of Nursing and Health Management, Shanghai University of Medicine and Health Sciences, Shanghai 201318, China
2
Department of Physical Medicine and Rehabilitation, Shuang Ho Hospital, Taipei Medical University, New Taipei City 235041, Taiwan
3
Department of Physical Medicine and Rehabilitation, School of Medicine, College of Medicine, Taipei Medical University, Taipei 110301, Taiwan
4
Master Program in Long-Term Care, Taipei Medical University, College of Nursing, Taipei 110301, Taiwan
*
Author to whom correspondence should be addressed.
Shu-Fen Chu and Tsan-Hon Liou equally contributed to this study.
Nutrients 2021, 13(6), 1992; https://doi.org/10.3390/nu13061992
Submission received: 12 April 2021 / Revised: 3 June 2021 / Accepted: 4 June 2021 / Published: 10 June 2021
(This article belongs to the Special Issue Nutrition, Physical Activity, Aging and Health)

Abstract

:
Aging and osteoarthritis are associated with high risk of muscle mass loss, which leads to physical disability; this loss can be effectively alleviated by diet (DI) and exercise (ET) interventions. This study investigated the relative effects of different types of diet, exercise, and combined treatment (DI+ET) on muscle mass and functional outcomes in individuals with obesity and lower-limb osteoarthritis. A comprehensive search of online databases was performed to identify randomized controlled trials (RCTs) examining the efficacy of DI, ET, and DI+ET in patients with obesity and lower-extremity osteoarthritis. The included RCTs were analyzed through network meta-analysis and risk-of-bias assessment. We finally included 34 RCTs with a median (range/total) Physiotherapy Evidence Database score of 6.5 (4–8/10). DI plus resistance ET, resistance ET alone, and aerobic ET alone were ranked as the most effective treatments for increasing muscle mass (standard mean difference (SMD) = 1.40), muscle strength (SMD = 1.93), and walking speed (SMD = 0.46). Our findings suggest that DI+ET is beneficial overall for muscle mass in overweight or obese adults with lower-limb osteoarthritis, especially those who are undergoing weight management.

1. Introduction

Osteoarthritis (OA) or degenerative arthritis is the most prevalent musculoskeletal disorder worldwide [1], with rapid increases in its prevalence after the sixth decade of lifespan and with a strong impact on the health of the aging population [2]. OA commonly affects knee and hip joints, and it impairs muscle morphology and function, leading to physical disability [3,4,5], especially in individuals with obesity [6,7]. Observational studies have indicated that older individuals with OA exhibited lower muscle mass or volume than healthy controls [3,5,8,9], and having less muscle was further associated with lower muscle strength and poor functional outcomes [10,11]. Recent studies have reported that OA was associated with high risk of sarcopenia [12,13], an age-related condition characterized by attenuated muscle mass [14,15].
Obesity and sarcopenia have become public health concerns in the older population, and sarcopenic obesity might synergistically increase the risk of physical disability [16,17]. Such compounding effects of sarcopenic obesity may affect OA [18] because obesity has become epidemic in the OA population [19] and sarcopenic obesity is closely associated with OA [20]. Because obesity exerts negative effects on physical function in obese individuals with OA [7,19,21] and a high percentage body fat (BF%) is significantly associated with sarcopenia [22], people with overweight or obesity and knee or hip OA have a high risk of physical disability due to sarcopenic obesity.
Among the nonpharmacological and nonsurgical treatments for OA, exercise therapy and weight loss (for individuals with obesity) have been recommended as first-line treatments [23]. According to well-established evidence, exercise interventions benefit muscle mass and functional outcomes [24,25], and weight loss through an energy-restricted diet improves pain and function in patients with OA [26,27,28]. In particular, successful diet-induced weight loss for older adults with obesity may reduce both lean body mass (LBM) and fat-free mass (FFM) [29,30,31], with 3.8% and 15–25% of weight loss as LBM [31] and FFM [29], respectively; in addition, nearly 5% loss of leg lean mass may occur after weight management for those with obesity and OA [31]. Accordingly, for patients with OA who are at high risk of sarcopenia, muscle mass should be retained or even increased as much as possible during a weight-loss intervention through increased protein intake (e.g., high-protein diet or protein supplementation) and exercise [32,33]. However, the optimal treatment combination remains unclear due to the variety of exercise training modes for increasing muscle mass and strength [34] and the variety of dietary intervention types for pain relief [35]. Given the high prevalence and increasing burden of OA [1,36], identifying the optimal treatment strategy for preventing sarcopenia is relevant for OA, especially for those who are overweight or obese.
Previous systemic review and meta-analysis studies have investigated the efficacy of diet alone or diet in combination with exercise for patients with OA and obesity [26,27,28,30,37], among which only two studies reported walk performance [26,27]; none of them focused on muscle mass and strength outcomes. In addition, few studies have compared the relative effects of combined treatments composed of different diet and exercise types. The purpose of this study was to (1) identify the relative effects of diet, exercise, and combined treatment on muscle mass, strength, and walking speed by using network meta-analysis (NMA) and (2) identify the optimal treatment by ranking the probability of each intervention type for people with overweight or obesity and knee or hip OA.

2. Materials and Methods

2.1. Design

The present NMA study was conducted in accordance with the guidelines of the Preferred Reporting Items for Systematic Reviews and Meta-Analyses [38] and the extension statement for reporting of systematic reviews incorporating NMA [39,40]. The study protocol was registered at PROSPERO (registration number: CRD42021198023). A comprehensive search of online sources was performed on 12 May 2021 to identify eligible randomized controlled trials (RCTs) examining the efficacy of diet, exercise, or combined treatment for patients with OA who had overweight or obesity. Articles were obtained from the following online databases: PubMed, EMBASE, the Physiotherapy Evidence Database (PEDro), the ClinicalKey database, the Cochrane Library Database, the China Knowledge Resource Integrated Database, and Google Scholar. Secondary sources included papers cited in articles retrieved from the aforementioned sources. To minimize publication and language biases, no limitation was imposed on the publication year or language. Two authors (CDL and HCC) independently searched for relevant articles, screened them, and extracted data. Any disagreement between the authors was resolved through consensus reached in collaboration with the other team members (SFC and THL).

2.2. Search Strategy

The following keywords were used for participants’ conditions: (“older adult” OR “elder individual”) AND (“overweight” OR “obesity”) AND “osteoarthritis”. The following keywords were used for the intervention: (“land exercise training” OR “water exercise training”) OR (“diet intervention” OR “weight loss”). The detailed search formulas for each database are presented in Table S1.

2.3. Criteria for Selecting Studies

Trials were included if they met the following criteria: (1) the study design was an RCT or quasi-RCT; (2) the study enrolled participants who were aged ≥40 years, had body mass index (BMI) ≥25 kg/m2, and had a symptom or radiographic diagnosis of primary hip or knee OA. Participants were excluded if they had comorbidities such as rheumatic arthritis, neurological diseases (e.g., stroke, spinal stenosis), and substantial abnormalities in hematological, hepatic, or renal functions; (3) the treatment groups received diet therapy alone, exercise alone, or their combination; (4) the control group received a comparative intervention including placebo treatment alone or an intervention not related to diet therapy or exercise, which was considered usual care (UC) in the present study; (5) the diet therapy involved weight loss, dietary protein, or protein supplementation; (6) the exercise involved any mode of muscle strength therapy including resistance exercise training (RET), multicomponent exercise training (MET)—composed of two or more of RET, aerobic exercise (AET), balance training, and physical activity training—and an exercise intervention with physical therapies such as neuromuscular electric stimulation (NMES) and blood flow restriction (BFR); (7) the study conducted an acute intervention with a short period ranging from a few days to 12 weeks, a medium-term or a long-term intervention with a treatment period of ≥6 months; and (8) the study reported outcome measures including the primary and secondary outcomes defined below (in Section 2.4).
Studies were excluded if (1) the trial was conducted in vitro or in vivo in an animal model or (2) the trial had a non-RCT design such as case report, case series, or prospectively designed trial without a comparison group.
Study selection was initially performed by two authors (CDL and HCC) who independently screened and identified potentially relevant articles based on title and abstract. The full texts of all potentially eligible articles were examined to ensure they matched the inclusion criteria. In cases of inconclusiveness, the disagreements were resolved by discussions until consensus was obtained. A third author (THL) was consulted to discuss eligibility if the disagreement persisted.

2.4. Outcome Measures

The primary outcomes of interest included measures of muscle mass, strength, and walking speed, all of which are sarcopenia indicators recommended by the Asian Working Group for Sarcopenia [14] and the European Working Group on Sarcopenia in Older People [15]. The muscle mass measures included, but were not limited to, LBM, FFM, appendicular lean mass, muscle cross-sectional area, muscle volume, and muscle thickness. If LBM or FFM was not available, BF% and body weight was used to estimate the percentage FFM. For muscle strength measures, muscle quality (i.e., ratio of muscle strength to muscle mass) was prioritized [15]. Other strength measures were extracted on the basis of the following sequence of preference: concentric/eccentric power and peak torque, and maximum voluntary isometric contraction of knee extensors, knee flexors, and hip abductors; bench press and hand grip strength of upper extremity. Walking speed was assessed using gait and walking parameters (e.g., walking time).

2.5. Data Extraction

The following data were extracted from each included trial: (1) characteristics of the study design and sample, including study arm, age, BMI, and sex distribution; (2) characteristics of the exercise and diet interventions; (3) measurement time points; and (4) main outcomes. One author (CDL) extracted the relevant data from included trials, and the second author (HCC) checked the extracted data. Any disagreement between the two authors was resolved through the consensus procedure. A third author (THL) was consulted if the disagreement persisted.
Treatment effects of varying intensities or bilateral legs were combined to obtain a single treatment effect as recommended in the Cochrane Handbook [41]. The follow-up duration was assessed and was defined as short-term (≤3 months), medium-term (<3 months and ≤6 months), and long-term (>6 months) for subgroup analysis; when multiple time points were reported within the same time frame, the longest period was used for analysis (e.g., if the follow-up time points for walking speed measurement were 6 and 12 months, the data for the 12-month period were used as the long-term results). We also examined the compliance for interventions as well as adverse events reported by the included studies.

2.6. Assessment of Bias Risks and Methodological Quality of Included Studies

Quality was assessed using the PEDro quality score to determine the risk of bias. The methodological quality of all the included studies was independently assessed by two researchers in accordance with the PEDro classification scale, which is a valid measure of the methodological quality of clinical trials [42]. In the PEDro scale, the following 10 items are scored: random allocation, concealed allocation, similarity at baseline, subject blinding, therapist blinding, assessor blinding, >85% follow-up for at least one key outcome, intention-to-treat analysis, between-group statistical comparison of at least one key outcome, and point and variability measures for at least one key outcome. Each item is scored as either 1 for present or 0 for absent, and a total score ranging from 0 to 10 is obtained through summation of the scores of all the 10 items. An interrater reliability generalized kappa statistic value between 0.53 and 0.94 has been reported for the PEDro scale [43], and an intraclass correlation coefficient of 0.91 (95% confidence interval (CI): 0.84–0.95) associated with the cumulative PEDro score has been reported for nonpharmacological studies [44]. In this study, on the basis of the PEDro score, the methodological quality of the included RCTs was rated as high (≥7/10), medium (4–6/10), and low (≤3/10) [45].

2.7. Data Synthesis and Analysis

We separately computed effect sizes for each outcome measure in each intervention. The effect size was defined as a pooled estimate of the mean difference in change scores between any two study arms. Change scores (i.e., change from baseline) were analyzed to partially correct between-participant variability [46]. Change scores were extracted when the mean and standard deviation (SD) of the changes were available. If the exact variance of the paired difference was not derivable, conservative estimation was performed by assuming a within-participant correlation coefficient of 0.7, as recommended by Rosenthal (1993) [47], between the baseline and posttest measured data. If the SD was not reported, it was estimated using p-values or 95% CIs. If data were presented as the median and interquartile range, the mean value was estimated using the median, and the SD was calculated by dividing the interquartile range by 1.35 [46].
Because of the varied tools employed for measuring muscle mass, strength, and walking speed among the included studies, the standard mean difference (SMD) with 95% CI was calculated for all the extracted outcome data to ensure sufficient comparability of effect sizes. The odds ratio with 95% CI was estimated for dichotomous outcomes, such as occurrence rate of adverse events. We categorized the magnitude of the SMD using the following Cohen’s criteria [48]: trivial (d < 0.10), small (0.10 ≤ d < 0.25), medium (0.25 ≤ d < 0.40), and large (d ≥ 0.40).
We conducted random-effects NMA within a frequentist framework by using statistical software R (version 4.0.4, The R Foundation for Statistical Computing, Vienna, Austria) [49,50]. Direct and indirect comparisons of different diet and ET interventions were performed using the netmeta package of R [51]. Tests of heterogeneity (within designs) and inconsistency (between designs) were performed using the I2 statistic and Cochran Q test. The magnitude of τ2 was calculated to estimate the variance across all treatment comparisons. The design-by-treatment inconsistency model, loop-specific approach, and node-splitting method were used to assess the inconsistency between the direct and indirect comparisons [52,53]. A two-sided p-value of <0.05 was considered statistically significant.
For evaluation of relative efficacy, we calculated the ranking probabilities of each treatment on the basis of effect sizes by using the frequentist treatment ranking method [54]; and a P-score which has been shown to be equivalent to the surface under the cumulative ranking curve score within a Bayesian framework was expressed to represent the probabilities for each treatment [54]. Network forest plots for treatment effects in comparison with UC effects were produced to provide a visual representation of the uncertainty in NMA [55].
Network meta-regression analyses were performed to assess the moderating effects of age, BMI, sex distribution (i.e., proportion of female participants in the sample), treatment duration, sample size, and methodological level (i.e., PEDro score) on the relative efficacy of treatments.
Potential publication bias was investigated through visual inspection of a funnel plot to explore possible reporting bias [56] and was assessed using Egger’s regression asymmetry test [57].

3. Results

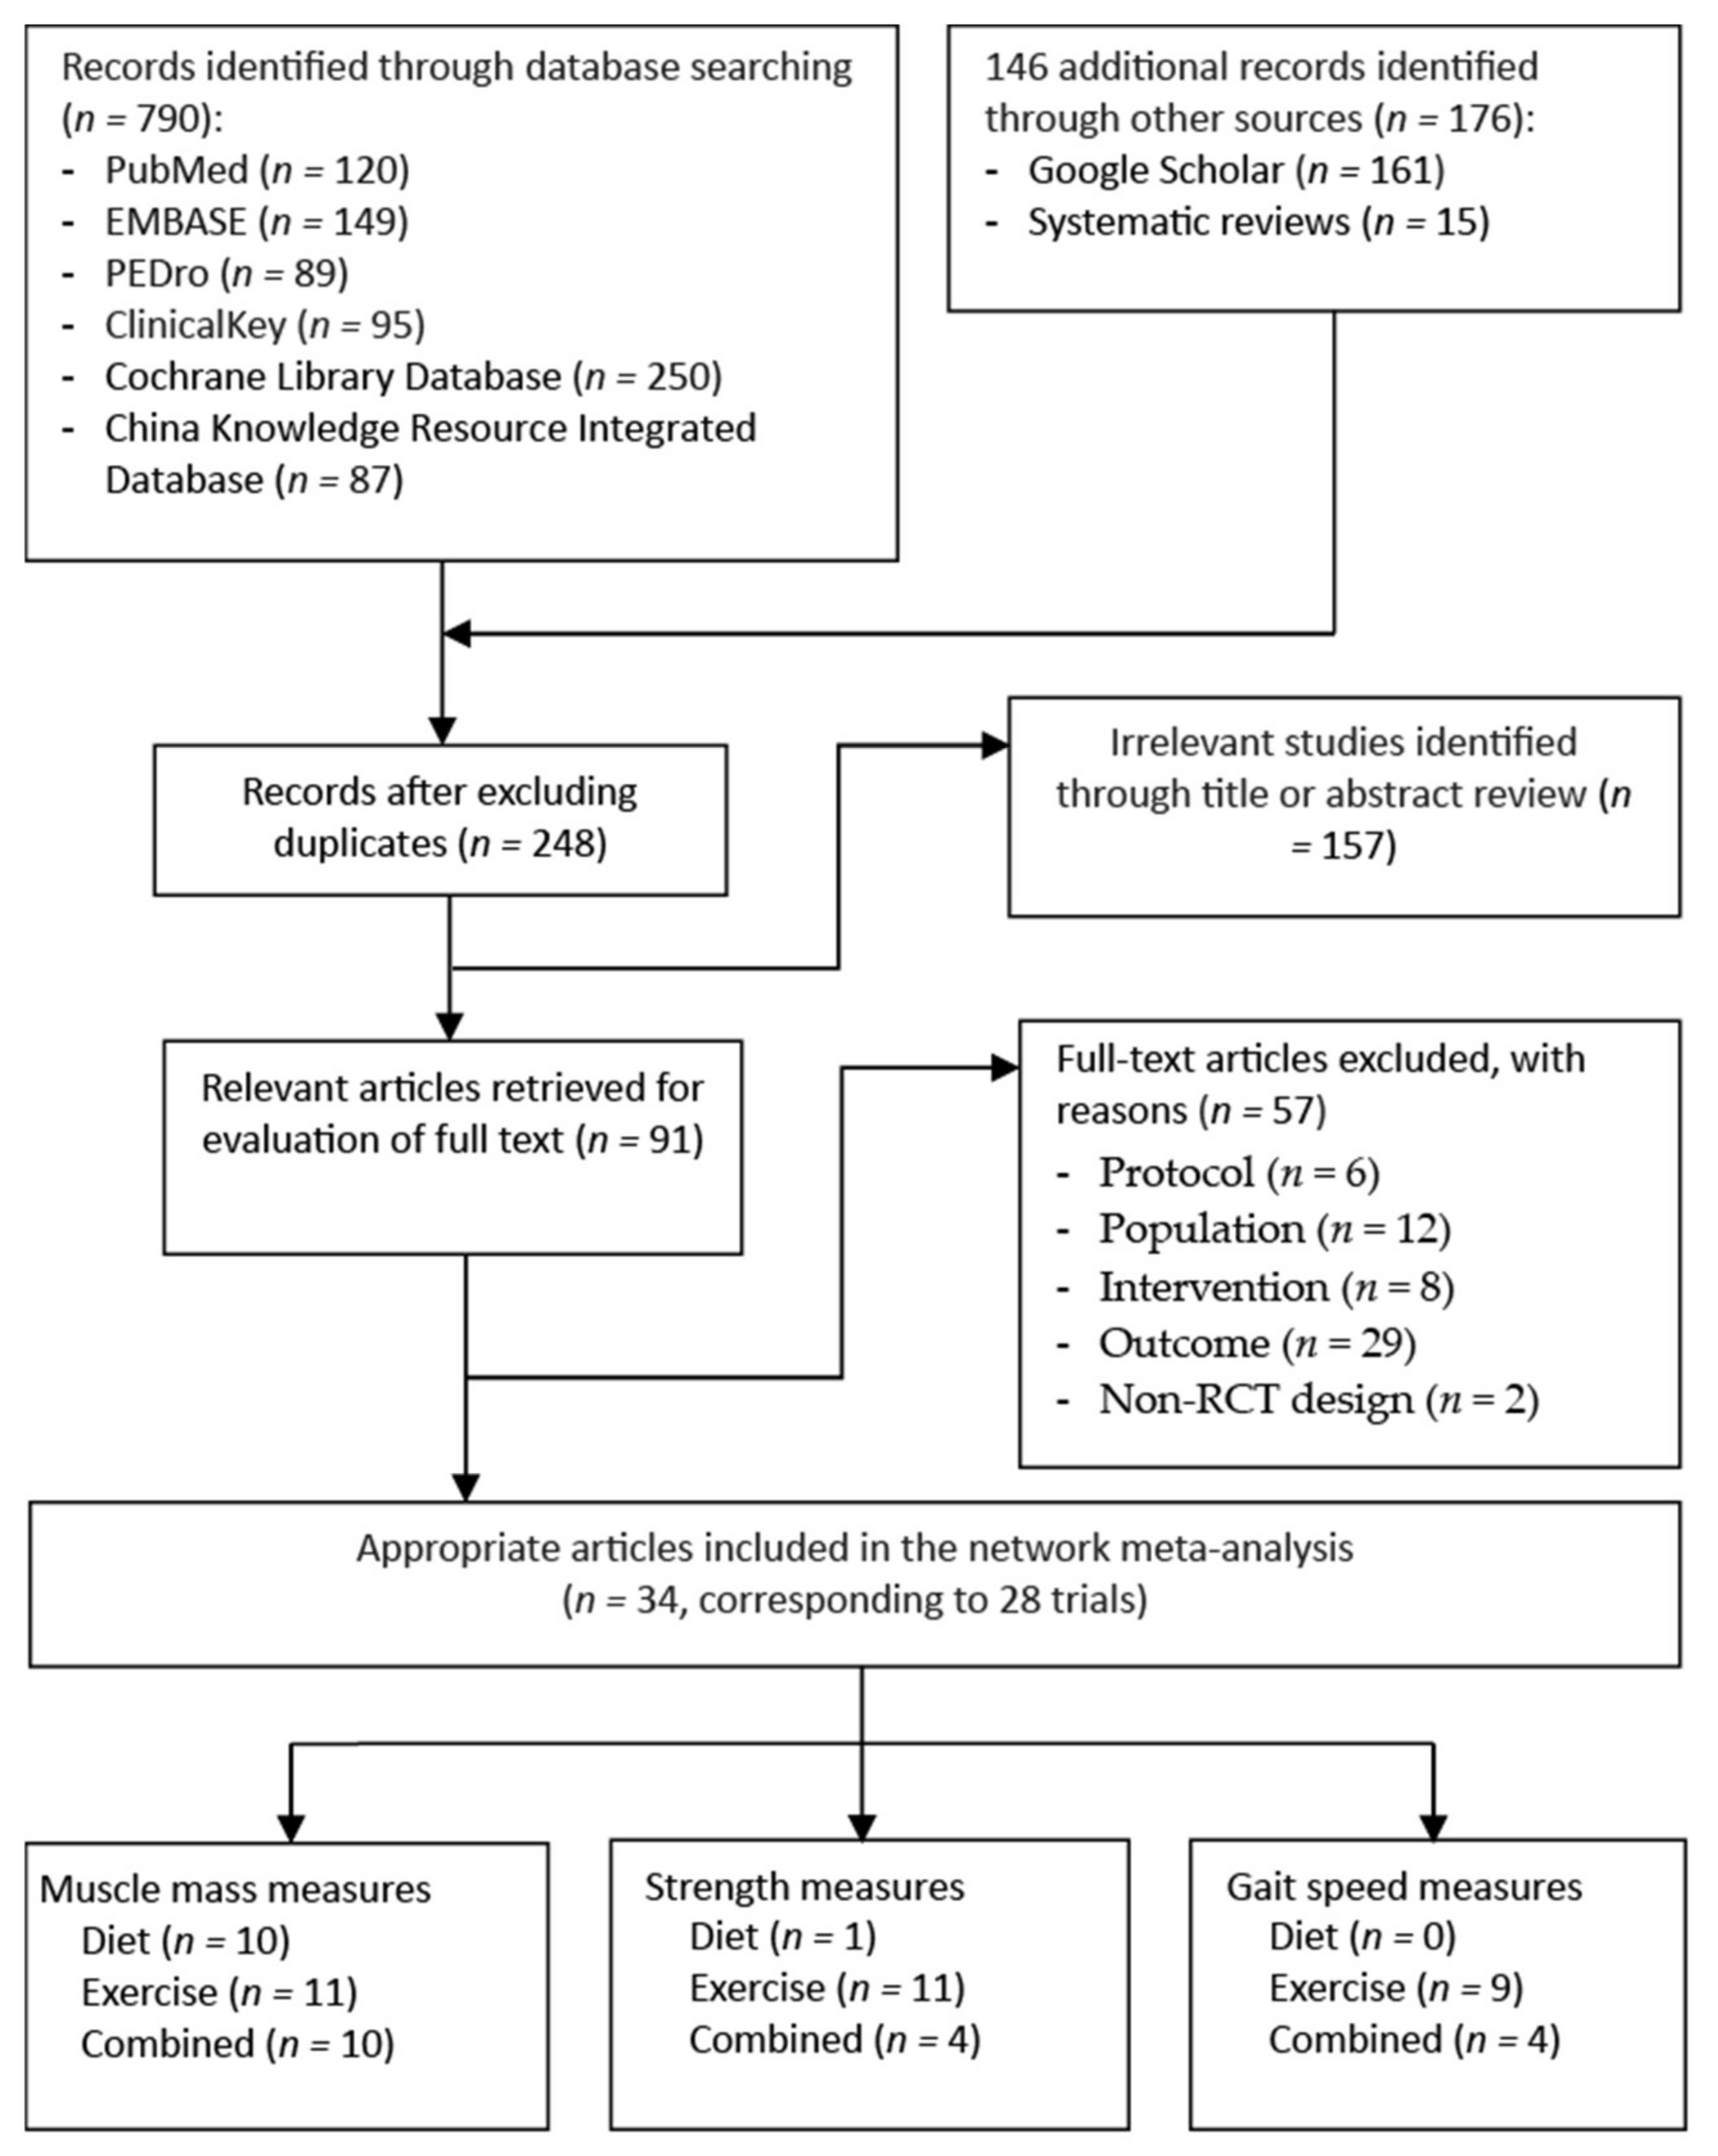
3.1. Trial Selection Flowchart

Figure 1 shows a flowchart of the trial selection process. Through an electronic and manual literature search, we identified 966 articles. After excluding duplicates, we reviewed the titles and abstracts of 248 studies to assess their eligibility; 91 were considered to be relevant for full-text assessment (Figure 1). The final sample consisted of 34 RCTs [58,59,60,61,62,63,64,65,66,67,68,69,70,71,72,73,74,75,76,77,78,79,80,81,82,83,84,85,86,87,88,89,90,91], which were derived from 28 trials and were published between 2000 and 2020. Two of the included RCTs [58,74] had a common study protocol [92], as did another two RCTs [59,62], two RCTs [82,83], and three RCTs [75,76,91], which respectively employed three trial protocols [76,93,94].

3.2. Study Characteristics

Table 1 summarizes the study characteristics of and patient demographic data from the included RCTs. A total of 3563 participants were recruited, with a mean age of 64.7 (range: 41.4–71.6) years; the mean BMI was 33.1 (range: 26.4–41.4) kg/m2, and the average proportion of female participants was 71.0% (range: 39.1–95.0%), which was estimated by excluding eight sex-specific (women or men alone) RCTs [68,69,71,77,80,81,88,89]. All included RCTs enrolled participants who had received a diagnosis of symptomatic or radiographic knee OA, whereas four RCTs recruited individuals with a diagnosis of hip OA [64,67,72,85].
In this study, 23 of the included RCTs had a two-arm design [61,64,65,66,67,68,69,73,75,76,77,78,80,81,82,83,84,85,86,87,89,90,91] and the remaining 11 RCTs were multiarm studies, with a total of 21 treatment arms. Among all participants, 711 (19.9%) received diet therapy alone, 1235 (34.7%) received exercise alone, 858 (24.1%) received combined treatment, and 759 (21.3%) received UC. Regarding the follow-up duration for measuring outcomes, 23 RCTs [61,63,64,65,66,67,68,69,70,71,72,77,79,80,81,82,84,85,86,87,88,89,90] had a short-term follow-up duration of ≤12 weeks, whereas 12 RCTs [58,64,73,74,75,76,78,82,85,86,87,91] had a medium-term follow-up duration ranging from 14 to 24 weeks, and six RCTs [58,69,70,74,82,83] had a long-term follow-up duration ranging from 8 to 36 months.
Table 1. Summary of the study characteristics of included trials.
Study
(Author, y, Ref)
Study Arm 1Age (y) 2BMI
(kg/m2)
Sex
(F/M)
NInvolved
Joint
Exercise InterventionDiet InterventionMeasured
Time Point
(weeks)
Main
Outcome Measure
Type
(COM%)
Frequency ×
Duration
Type
(COM%)
WL Target
(% or kg) 6
Diet intervention alone
Christensen, D60.5 ± 11.636.3 ± 5.635/540KneeNoneNoneMRNoneBaselineFFM
2005 [61]UC64.6 ± 10.435.5 ± 4.636/440 (6 meals/d), Posttest: 8
DIA, CBT
−93.2
Christensen, D1, Regular MR63.7 ± 6.532.6 ± 3.762/1577KneeNoneNoneMR NoneBaselineLBM
2017 [60]D2, Intermittent63.9 ± 6.334.0 ± 5.365/1176 (1–3 meals/d), Midtest: 52
MR DIA Posttest: 156
−71.2
López-D1, Uni-MR60.9 ± 11.238.9 ± 5.135/1752HipNoneNoneMR (1 or ↓ 5 kgBaselineFFM
Gómez,D2, Multi-MR61.4 ± 11.040.2 ± 5.346/1460Knee 2 meals/d) Posttest: 12
2020 [67] (NR)
Exercise intervention alone
Gill, Water-based ET69.2 ± 10.541.4 ± 3.928/1442Hip AQET,2 d/wk × 6 wkNoneNoneBaselineGS
2009 [64]Land-based ET71.6 ± 8.939.8 ± 13.123/1740KneeRET(12 sessions) Posttest: 7
(81.7–87.5) Follow-up: 15
Kuptniratsaikul,Water-based ET62.1 ± 6.427.9 ± 1.538/240KneeAQET3 d/wk × 4 wkNoneNoneBaselineQd strength
2019 [65]Land-based ET61.7 ± 6.927.6 ± 1.737/340 IMET (12 sessions) Posttest: 4
(76–91.7)
Lim, Water-based ET65.7 ± 8.927.9 ± 1.523/326KneeAQET;3 d/wk × 8 wkNoneNoneBaselineLBM
2010 [66]Land-based ET67.7 ± 7.727.6 ± 1.721/425 RET;(24 sessions) Posttest: 8FFM
Home-based ET63.3 ± 5.327.7 ± 2.021/324 (NR) Qd strength
Mahmoud,ET54.6 ± 8.635.0 ± 4.10/3232KneeIM-ET3 d/wk × 12 wkNoneNoneBaselineMT
2017 [69]UC 353.2 ± 9.634.8 ± 4.20/1212 (NR)(36 sessions) Posttest: 12Qd strength
Mangani, AET68.7 ± 5.6 533.3 ± 5.0 5146/51 557KneeAET3 d/wk × 72 wkNoneNoneBaselineGS
2006 [70]RET 64 RET(216 sessions) Mid-test: 12, 36
UC 76 (50.5–81.4) Posttest: 72
Matsuse, NMES + ET58.8 ± 11.837.5 ± 4.510/010KneeAET2 d/wk × 12 wkNoneNoneBaselineGS
2020 [71]ET59.7 ± 6.136.1 ± 3.410/010 (NR)(24 sessions) Posttest: 12Qd strength
Rabe, NMES67.3 ± 8.527.5 ± 6.117/017KneeRET2 d/wk × 12 wkNoneNoneBaselineGS
2018 [77]ET65.9 ± 9.427.5 ± 4.118/018 (NR)(24 sessions) Posttest: 12Qd strength
Exercise intervention alone
Rosemffet, NMES + ET62.4 ± 8.7 4,531.6 ± 5.3 420/6 58KneeMET3 d/wk × 8 wkNoneNoneBaselineQd strength
2004 [79]NMES 34.2 ± 6.7 4 8 −70.3(24 sessions) Posttest: 8
ET 29.1 ± 3.3 4 10
Segal, BFR-ET58.4 ± 8.731.3 ± 5.30/1919KneeRET3 d/wk × 4 wkNoneNoneBaselineLeg press 1-RM
2015a [80]ET56.1 ± 7.730.4 ± 4.20/2222 −100(12 sessions) Posttest: 4
Segal, BFR-ET56.1 ± 5.928.7 ± 4.419/019KneeRET3 d/wk × 4 wkNoneNoneBaselineQd volume
2015b [81]ET54.6 ± 6.932.5 ± 5.221/021 −97.2(12 sessions) Posttest: 4Leg press 1-RM
Swank, ET63.1 ± 7.335.9 ± 8.524/1236KneeRET3 d/wk × 4–8 wkNoneNoneBaselineQd strength
2011 [84]UC 362.6 ± 7.632.9 ± 5.722/1335 −90(12–24 sessions) Posttest: 8
Tak,ET67.4 ± 7.626.4 ± 3.029/1645HipMET7 d/wk × 8 wkNoneNoneBaselineGS
2005 [85]UC 368.9 ± 7.626.6 ± 4.335/1449 −77(56 sessions) Posttest: 8
Follow-up: 20
Talbot, ET69.6 ± 6.731.0 ± 5.913/417KneeAET3 d/wk × 12 wkNoneNoneBaselineGS
2003a [86]UC 370.8 ± 4.732.6 ± 6.913/417 −76(36 sessions) Posttest: 12 Qd strength
Follow-up: 24
Talbot, NMES70.3 ± 5.629.5 ± 4.115/318KneeIMET3 d/wk × 12 wkNoneNoneBaselineGS
2003b [87]UC 370.8 ± 4.931.6 ± 5.94/1216 −85(36 sessions) Posttest: 12 Qd strength
Follow-up: 24
Wallis,ET68.0 ± 8.034.0 ± 5.29/1423KneeAET7 d/wk × 12 wkNoneNoneBaselineGS
2017 [90]UC 367.0 ± 7.034.0 ± 7.411/1223 −70(84 sessions) Posttest: 13
Combined treatments
Beavers,D + ET65.5 ± 6.033.5 ± 3.7108/43151KneeMET3 d/wk × 72 wkMR↓ ≥10%BaselineFFM 4
2015 [58]ET65.5 ± 6.433.5 ± 3.7108/42150 (58–70)(216 sessions)(2 meals/d), Midtest: 24
D65.8 ± 6.233.7 ± 3.8105/44149 DIA, CBT Posttest: 72
−63
Christensen,D + ET62.9 ± 5.836.5 ± 4.452/1264 MET3 d/wk × 52 wkMR ↓ ≥10%BaselineLBM;
2013 [59];D63.0 ± 6.537.9 ± 5.352/1264 −59.1(156 sessions)(1 meal/d), Posttest: 52
2015 [62]UC61.7 ± 6.837.6 ± 4.551/1364 DIA, CBT
−61.5
Combined treatments
Ghroubi,D + ET41.4 ± 3.937.5 ± 3.7NR12KneeMET3 d/wk × 8 wkMR NRBaselineLBM
2008 [63]ET43.8 ± 13.137.1 ± 5.7 10 (NR)(24 sessions)(3 meals/d), Posttest: 8
D41.5 ± 11.738.7 ± 6.1 12 (NR)
UC 342.4 ± 9.839.2 ± 3.7 11
Magrans-D + ET54.0 ± 9.0 533.3 ± 5.0 514/014KneeRET3 d/wk × 14 wkDIA↓ 3–5 kgBaselineFFM
Courtney,ET 16/016 (NR)(42 sessions)(NR) Midtest: 10Bench-
2011 [68] Posttest: 14press 1-RM
McLeod, D + ET66.5 ± 4.833.7 ± 7.664/872Hip MET3 d/wk × 8 wkDIA, CBT↓ 5%BaselineLBM
2020 [72]ET67.2 ± 5.733.9 ± 7.373/1083Knee(NR)(24 sessions)(NR) Posttest: 8FFM 4
Messier,D + ET67.0 ± 4.035.0 ± 5.010/313KneeMET3 d/wk × 24 wkDIA, CBT↓ ≥6.8 kgBaselineGS
2000 [73]ET69.0 ± 5.038.0 ± 6.07/411 −94.7(72 sessions)−82.6 Midtest: 12Qd strength
Posttest: 24
Messier, D + ET65.0 ± 6.033.6 ± 3.7109/43152KneeMET3 d/wk × 72 wkMR ↓ 10–15%BaselineLBM
2013 [74]ET66.0 ± 6.033.5 ± 3.7108/42150 (54–70)(216 sessions)(2 meals/d), Midtest: 24
D66.0 ± 6.033.7 ± 3.8108/44152 DIA, CBT Posttest: 72
(61.0–63.0)
Miller,D + ET69.8 ± 8.234.9 ± 6.543/2467KneeMET3 d/wk × 24 wkMR, ↓ 10%BaselineFFM
2006 [76]UC 369.5 ± 8.234.4 ± 5.738/2967 (72–83)(72 sessions)(2 meals/d) Posttest: 24
DIA, CBT
−75
Miller,D + ET69.3 ± 6.635.7 ± 6.614/1226KneeMET3 d/wk × 24 wkMR ↓ 10%BaselineFFM
2012 [75]UC 369.3 ± 6.534.9 ± 4.013/1225 −76.3(72 sessions)(2 meals/d), Posttest: 24
DIA, CBT
−74
Robbins, D + ET62.5 ± 7.434.6 ± 6.9 457/3087KneeMET3 d/wk × 18 wkMR NRBaselineGS
2020 [78]UC 363.8 ± 7.336.3 ± 7.5 452/3284 (89/73)(54 sessions)(2 meals/d), Midtest: 20Qd strength
−94 Posttest: 32
Skou,D + ET64.8 ± 8.730.6 ± 5.626/2450KneeMET2 d/wk × 12 wkDIA↓ ≥5%BaselineGS
2015 [82]UC 367.1 ± 9.129.4 ± 5.225/2550 −65.8(24 sessions)−67.5 Posttest: 12
Follow-up: 24, 52
Combined treatments
Skou,D + ET65.9 ± 8.731.3 ± 5.756/44100KneeMET2 d/wk × 12 wkDIA↓ ≥5%BaselineGS
2018 [83]UC 367.1 ± 9.129.4 ± 5.225/2550 (NR)(24 sessions)(NR) Posttest: 12
Follow-up: 24, 104
Toda, D + ET56.5 ± 11.128.1 ± 1.111/011KneeAET7 d/wk × 8 wkMR NRBaselineLBM
2000 [89]UC 361.9 ± 5.528.8 ± 3.331/031 RET(56 sessions)(2 meals/d), Posttest: 8
(NR) (NR)
Toda, D + ET63.2 ± 7.927.4 ± 3.1 463/063KneeAET7 d/wk × 8 wkMR NRBaselineLLM
2001 [88]ET61.0 ± 11.726.6 ± 4.0 484/084 RET(56 sessions)(2 meals/d), Posttest: 8
D60.1 ± 13.527.9 ± 4.7 429/029 (NR) (NR)
UC 363.1 ± 9.326.4 ± 4.1 452/052
Wang,D + ET69.9 ± 5.735.0 ± 5.825/1540KneeMET3 d/wk × 24 wkMR ↓ 10%BaselineLBM
2007 [91]UC 368.8 ± 5.734.7 ± 4.321/1233 −77.5(72 sessions)(2 meals/d), Posttest: 24Qd strength
DIA, CBT
−75
1 All study arms are presented for each trial. 2 Values are presented as mean and SD (or range). 3 No diet intervention, and no muscle strength exercise training. 4 Data were estimated. 5 Values of all samples. 6 Values denote the weight loss target in terms of body weight reduction in % or kg. AET, aerobic exercise training; AQET, aquatic exercise training; BFR-ET, exercise training with blood flow restriction; BMI, body mass index; CBT, cognitive behavioral therapy; COM, compliance; D, diet; DIA, diet instruction and advisement; ET, exercise training; FFM, fat-free mass; GS, gait speed; IMET, isometric exercise training; LBM, lean body mass; LLM, leg lean mass; MET, multicomponent exercise training; MR, meal replacement; MT, muscle thickness; NC, nutrition class; NMES, neuromuscular electric stimulation; NR, not reported; PLA, placebo; Qd; quadriceps muscle; Ref, reference number; RET, resistance exercise training; UC, usual care; WL, weight loss.

3.3. Dietary Intervention Characteristics

The protocols for diet therapy are summarized in Table 1. Dietary interventions employed intermittent meal replacement (MR) in one RCT [60] and regular MR in 14 RCTs [58,59,60,61,62,63,67,74,75,76,78,88,89,91]. The MR prescribed was one meal daily (uni-MR) in four RCTs [59,60,62,67] and two or more meals daily (multi-MR) in 12 RCTs [58,60,61,63,67,74,75,76,78,88,89,91]. In addition, diet instruction and advisement (DIA), which had been conducted through nutrition classes and cognitive behavior therapy, was employed in five RCTs [68,72,73,82,83] or applied in combination with MR in nine RCTs [58,59,60,61,62,74,75,76,91]. In summary, a total of five types of diet therapy for weight management were included in the NMA: intermittent multi-MR with DIA (IMMR-DIA), regular uni-MR (RUMR), RUMR combined with DIA (RUMR-DIA), regular multi-MR (RMMR), and RMMR combined with DIA (RMMR-DIA).

3.4. Exercise Training Protocol

A summary of protocols for exercise is presented in Table 1. Regarding the training mode of exercise, seven types of exercise were identified; AET was used in six RCTs [70,71,86,88,89,90] and RET in 10 RCTs [64,66,68,70,77,80,81,84,88,89], aquatic exercise (AQET) in three RCTs [64,65,66], isometric exercise in three RCTs [65,66,69], MET in 13 RCTs [58,59,62,63,72,73,74,75,76,78,79,85,91], NMES in four RCTs [71,77,79,87], and RET with BFR in two RCTs [80,81]. Moreover, 23 RCTs [58,59,62,63,64,65,66,68,69,70,71,73,74,77,79,80,81,84,85,86,87,88,90] employed exercise alone, whereas 14 RCTs incorporated exercise with dietary interventions [58,63,68,72,73,74,75,76,78,82,83,88,89,91]. Regarding the treatment duration, 19 RCTs [63,64,65,66,69,71,72,77,79,80,81,82,83,84,85,86,87,88,89] conducted a short intervention lasting 4–12 weeks (12–56 sessions), whereas eight RCTs [68,70,73,75,76,78,90,91] had a medium-term exercise duration of 14–24 weeks (42–72 sessions); in addition, five RCTs [58,59,62,70,74] had a long-term training period of 52–72 weeks (156–216 sessions).

3.5. Risk of Bias in Included Studies

The individual PEDro scores are listed in Table S2. Overall, methodological quality assessment revealed that half of the included RCTs [59,60,62,64,65,66,68,69,74,78,80,81,82,83,85,88,90] had high methodological quality and the other 17 RCTs [58,61,63,67,70,71,72,73,75,76,77,79,84,86,87,89,91] were ranked as medium, with a median PEDro score of 6.5/10 (range: 4/10 to 8/10). The interrater reliability of the cumulative PEDro scores was acceptable, with an intraclass correlation coefficient of 0.97 (95% CI: 0.93–0.98). All the 34 included RCTs employed random allocation, similarity at baseline, between-group comparisons, and point estimates and variability. Moreover, 11 of the 17 (64.7%) high-quality RCTs [59,60,62,64,65,78,80,81,82,83,90] performed allocation concealment, whereas only 1 medium-quality RCT did [71]. Owing to the intervention nature, it was difficult to blind the participants and therapists in all the included RCTs. However, assessor blinding was performed by all the high-quality RCTs, as well as five medium-quality RCTs [58,70,71,73,77].

3.6. Effectiveness of Treatment for Muscle Mass Assessed in NMA

Figure 2 presents the network of eligible comparisons for the treatment options for patients with overweight or obesity and OA. The effects of each treatment relative to UC on muscle mass, muscle strength, and walking speed at each follow-up time point are shown in Figure 3, Figure 4 and Figure 5, respectively, and the details of each comparison are presented in Figures S1–S3. The supplementary league tables, Tables S3–S5, present direct comparisons from the pairwise meta-analysis and NMA results and the relative efficacy of different treatments in comparison with UC.

3.6.1. Pairwise Meta-Analysis

Direct comparisons of pairwise meta-analyses (Table S3) indicated that IMET (SMD = 1.13, 95% CI: 0.27–1.98) and regular IMMR-DIA (SMD = 1.02, 95% CI: 0.35–1.69) were more efficacious than UC for increasing muscle mass, as were the combined treatments regular IMMR-DIA plus MET (SMD = 1.16, 95% CI: 0.75–1.58) and regular multi-MR plus either RET (SMD = 1.26, 95% CI: 0.59–1.92) or AET (SMD = 1.17, 95% CI: 0.47–1.86). In addition, the combined treatment of regular multi-MR plus RET produced greater changes in muscle mass than regular multi-MR alone (SMD = 0.76, 95% CI: 0.19–1.33) or RET alone (SMD = 0.64, 95% CI: 0.01–1.29).

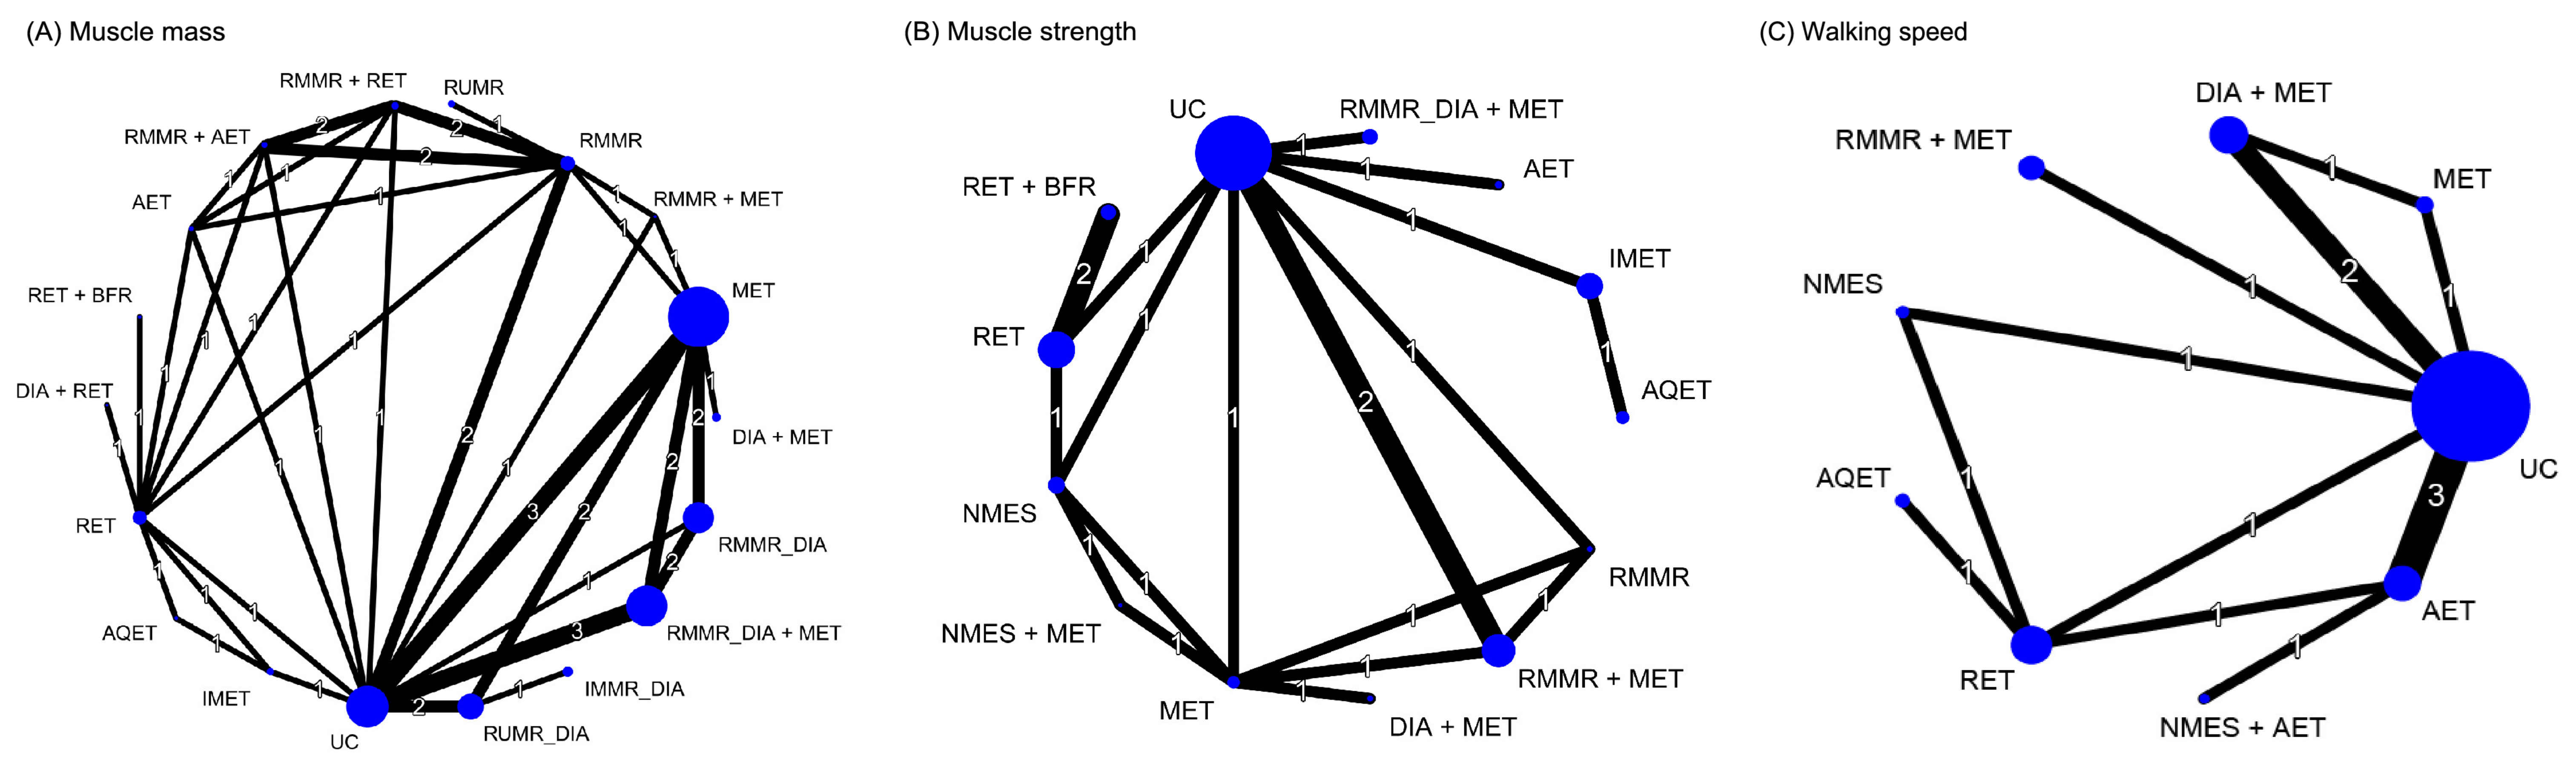
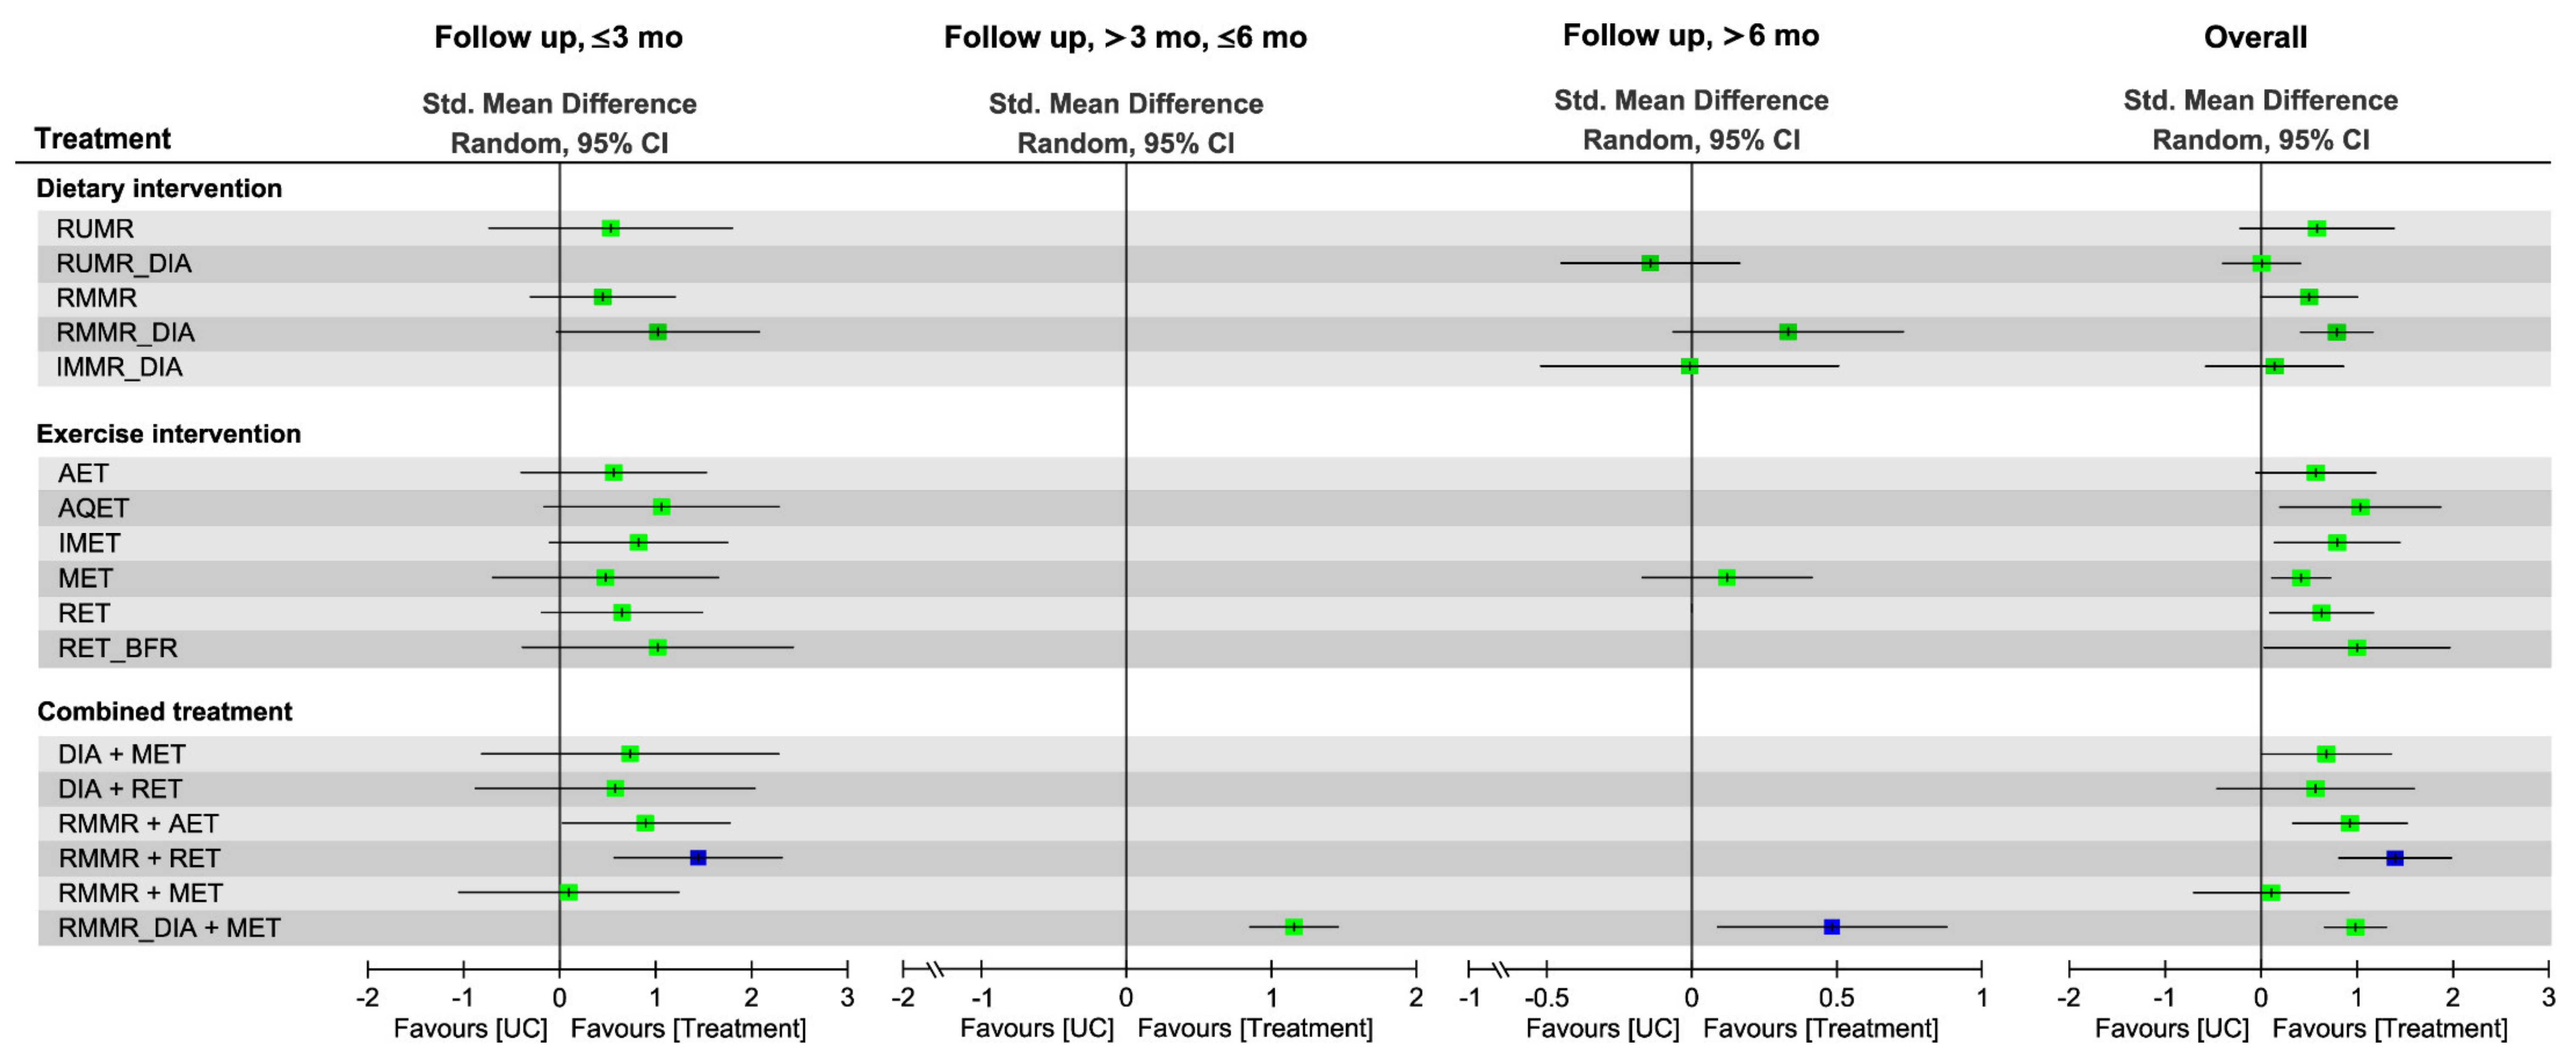
3.6.2. Global Effects in NMA

The NMA results showed that in comparison with UC, the diet interventions RMMR-DIA (SMD = 0.79) and RMMR (SMD = 0.51) produced greater changes in muscle mass—as did the exercise interventions AQET (SMD = 1.04), RET with BFR (SMD = 1.00), IMET (SMD = 0.79), RET (SMD = 0.63), and MET (SMD = 0.43)—during the overall follow-up duration (Figure 3 and Figure S1). In addition, the combined effects of RMMR plus RET (SMD = 1.40), RMMR-DIA plus MET (SMD = 0.99), RMMR plus AET (SMD = 0.93), and DIA plus MET (SMD = 0.69) on muscle mass gain relative to UC appeared to be stronger than the effect of diet intervention alone or exercise alone. Pooling all treatment effects in NMA, RMMR plus RET was ranked as the most effective (P score = 0.95) among all treatment arms for muscle mass gain—followed by regular IMMR-DIA plus MET (P score = 0.78), AQET (P score = 0.77), and RET with BFR (P score = 0.73)—during the overall follow-up duration (Figure 3 and Figure S1). The global heterogeneity of the NMA model for muscle mass was significant (τ2 = 0.06, I2 = 56.7%, p = 0.005). The node splitting results for inconsistency of NMA revealed no inconsistencies between direct and indirect evidence; the same results were detected through visual inspection of the forest plot (Figure S4).

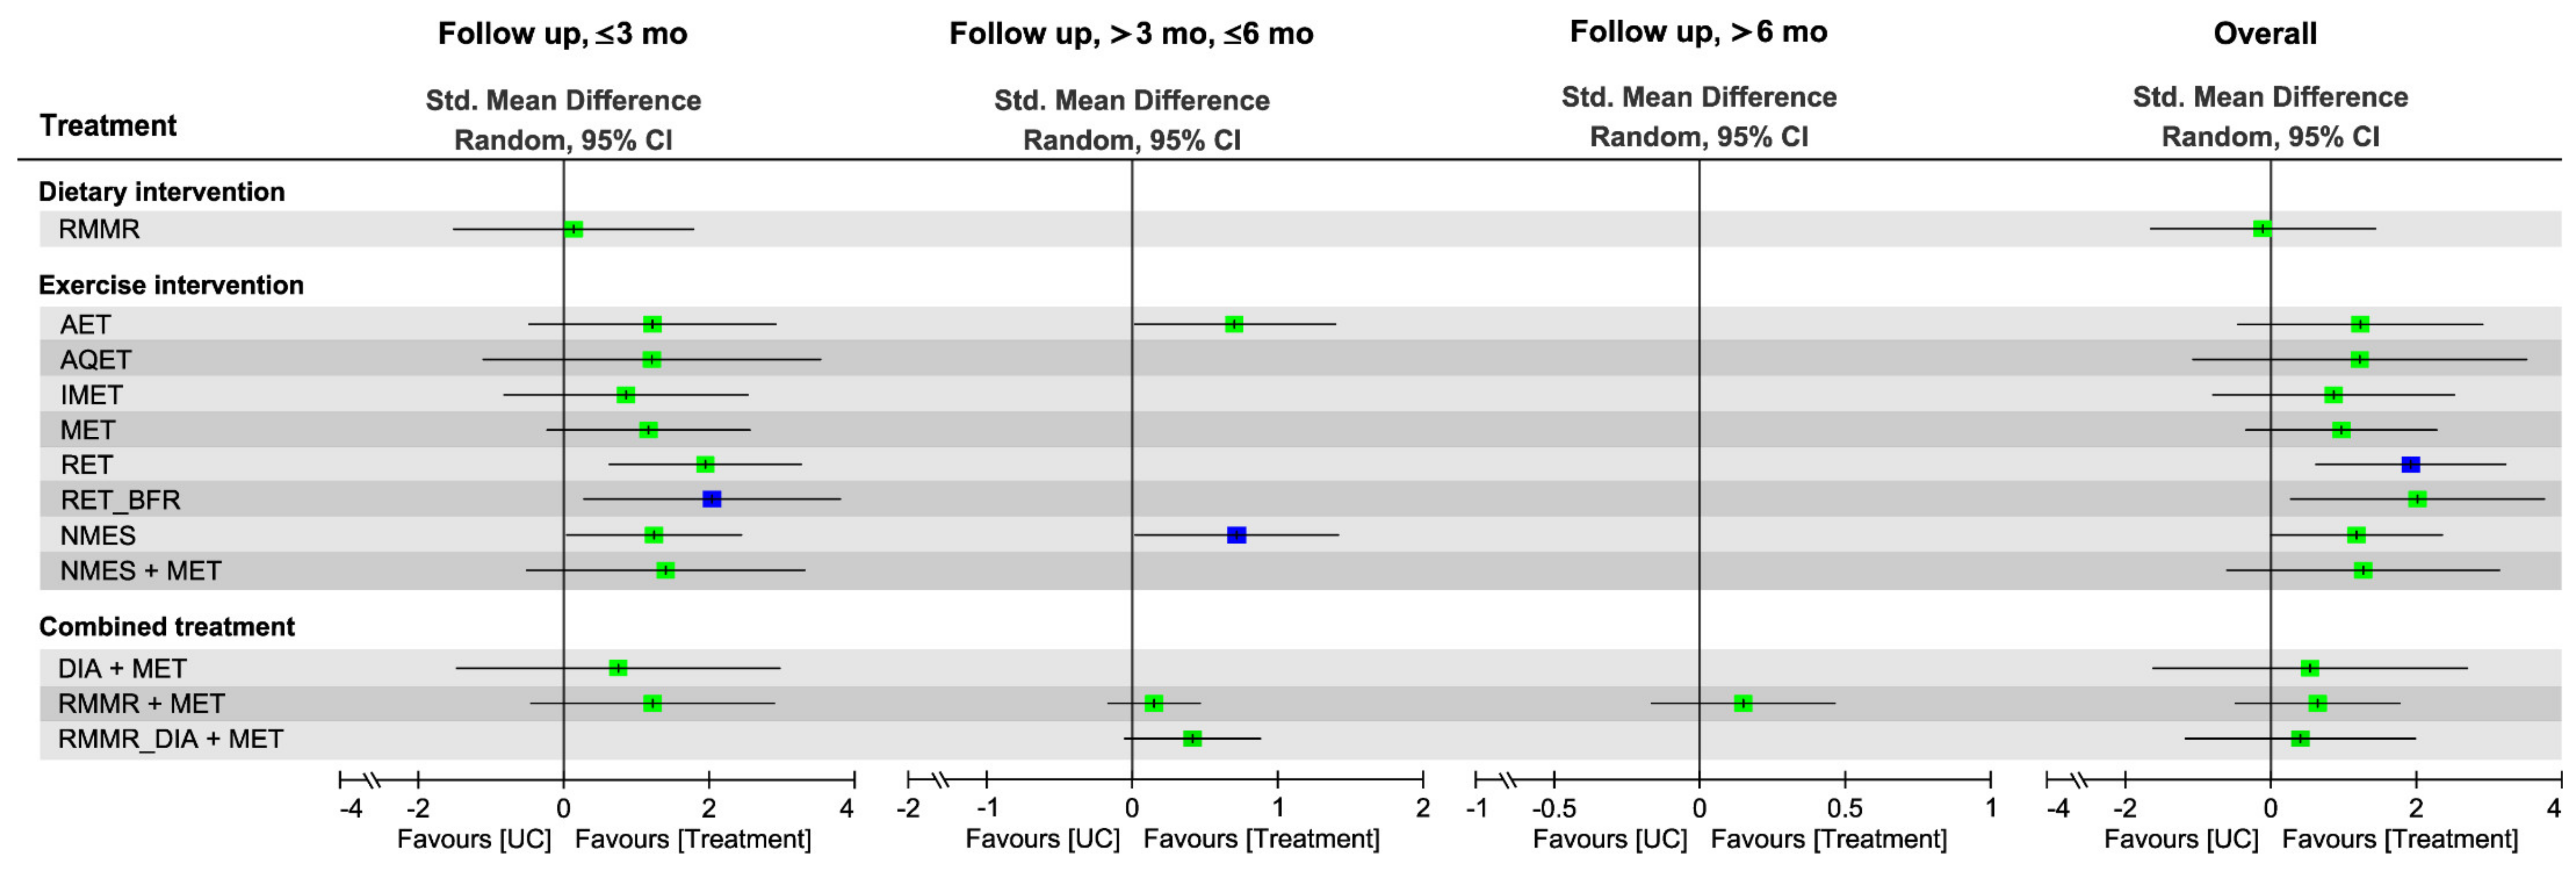
3.6.3. Subgroup Analysis of Follow-Up Duration

The combined treatment RMMR plus RET was ranked as the optimal treatment for muscle mass (SMD = 1.44, 95% CI: 0.57–2.31, P score = 0.88) over the short-term follow-up duration, whereas RMMR-DIA plus MET (SMD = 0.50, 95% CI: 0.11–0.90, P score = 0.97) was ranked highest over the long-term follow-up (Figure 3 and Figure S1); only a single comparison was conducted in NMA over medium-term follow-up, and the results showed that RMMR-DIA plus MET exerted a significant effect on muscle mass (SMD = 1.16, 95% CI: 0.86–1.47).

3.7. Effectiveness of Treatment for Muscle Strength

3.7.1. Pairwise Meta-Analysis

Direct comparisons of pairwise meta-analyses (Table S4) indicated that AET (SMD = 0.51, 95% CI: 0.10–0.91) and MET (SMD = 0.42, 95% CI: 0.20–0.65) were more efficacious than UC for muscle strength, as was DIA plus MET (SMD = 0.52, 95% CI: 0.26–0.77). In addition, the combined treatment RMMR-DIA plus MET yielded greater changes in walking speed than RMMR-DIA alone (SMD = 1.64, 95% CI: 1.29–1.99) or MET alone (SMD = 0.55, 95% CI: 0.22–0.87); similar results were observed for the comparison between DIA plus MET and DIA alone (SMD = 0.68, 95% CI: 0.26–1.11).

3.7.2. Global Effects of NMA

The NMA results showed that during the overall follow-up duration, the exercise interventions RET (SMD = 1.93), RET with BFR (SMD = 2.03), and NMES (SMD = 1.18) exerted significant effects on strength gain relative to UC, whereas the diet intervention and combined treatment did not (Figure 4 and Figure S2). RET was ranked as the most effective (P score = 0.82) among all treatment arms for muscle strength—followed by RET with BFR (P score = 0.81), NMES plus MET (SMD = 1.27, P score = 0.61), and AET (SMD = 1.23, P score = 0.60)—during the overall follow-up duration (Figure 4 and Figure S2). The global heterogeneity of the NMA model for muscle strength was significant (τ2 = 0.16, I2 = 74.2%, p < 0.0001). The node splitting results for inconsistency of NMA showed no inconsistencies between direct and indirect evidence; the same results were detected through visual inspection of the forest plot (Figure S5).

3.7.3. Subgroup Analysis of Follow-Up Duration

RET plus BFR and NMES ranked the highest in terms of short-term (SMD = 2.06, 95% CI: 0.28–3.84, P score = 0.79) and medium-term (SMD = 0.71, 95% CI: 0.01–1.41, P score = 0.79) treatment efficacy, respectively, for muscle strength (Figure 4 and Figure S2); only one RCT [78] reported the long-term treatment effects of RMMR plus MET (SMD = 0.15, 95% CI: −0.17 to 0.46).

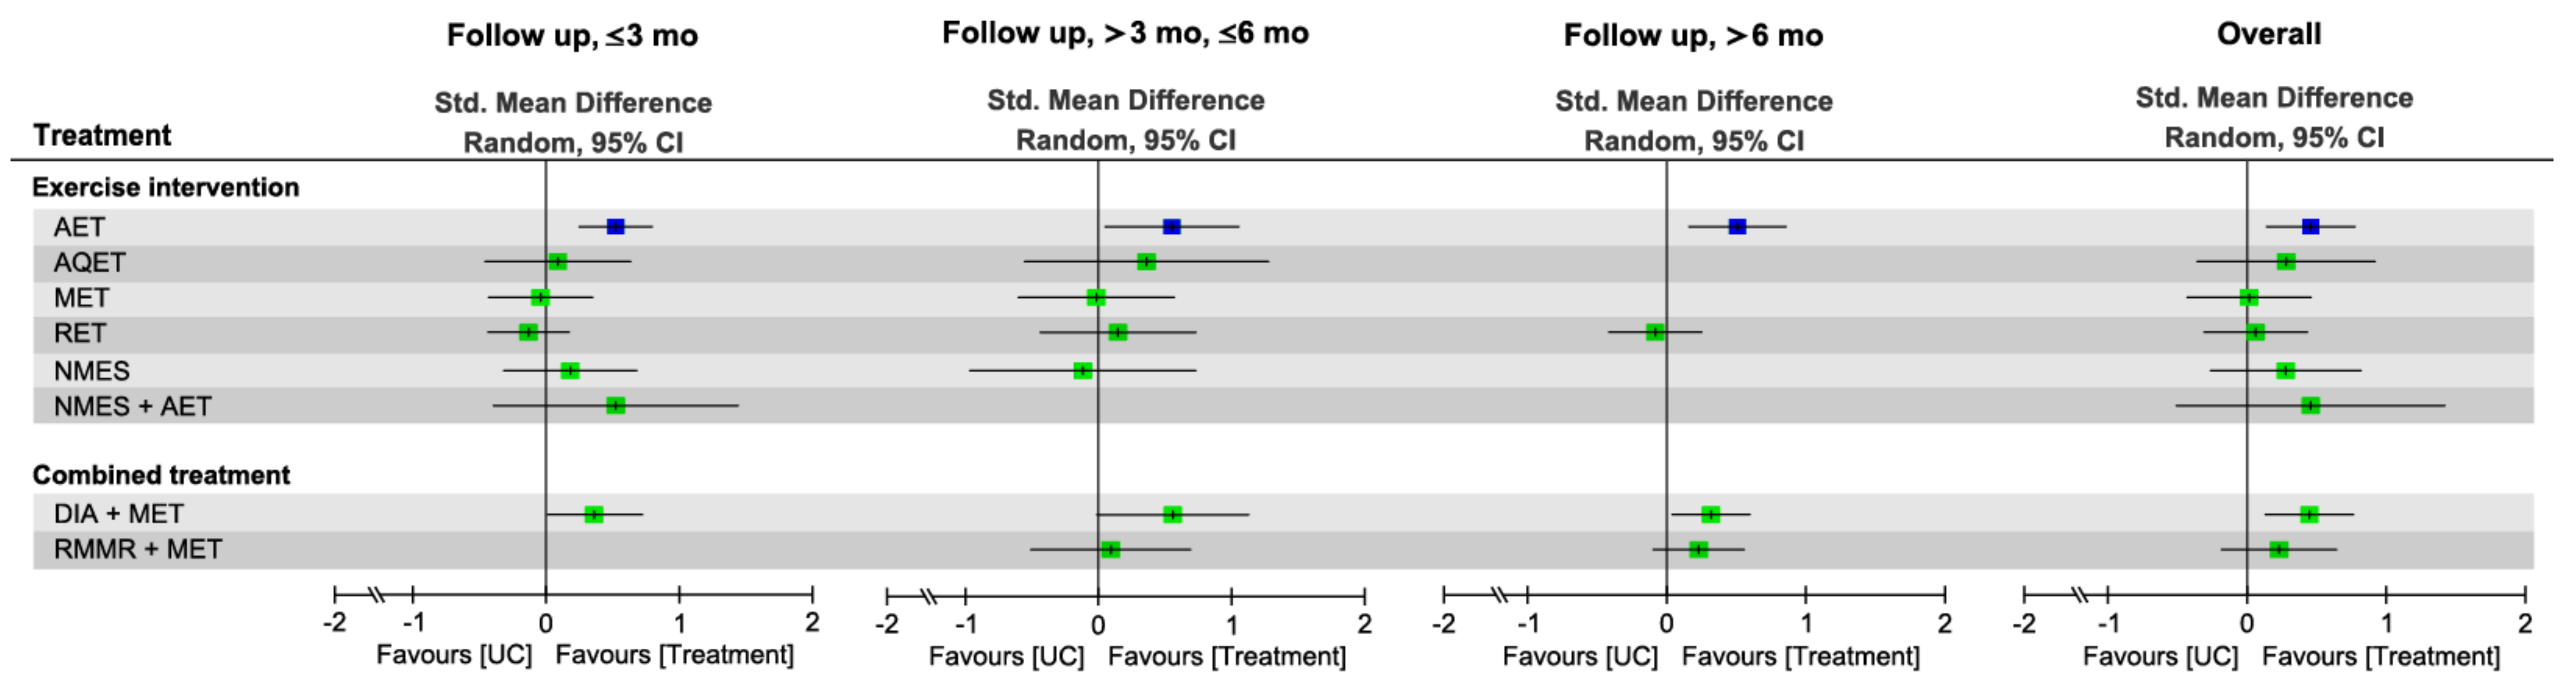
3.8. Effectiveness of Treatment for Walking Speed

3.8.1. Pairwise Meta-Analysis

Direct comparisons of pairwise meta-analyses (Table S5) indicated that AET (SMD = 0.47, 95% CI: 0.15–0.80) was more efficacious than UC for the walking speed, as well as the combined treatment DIA plus MET (SMD = 0.36, 95% CI: 0.02–0.69) did. In addition, the combined treatment DIA plus MET yielded greater changes in walking speed than MET alone (SMD = 1.12, 95% CI: 0.21–2.03).

3.8.2. Global Effects of NMA

The NMA results revealed that during the overall follow-up duration, AET alone (SMD = 0.46) and DIA plus MET (SMD = 0.45) achieved greater changes in walking speed in comparison with UC (Figure 5 and Figure S3). In addition, during the overall follow-up duration, AET was ranked as the most effective (P score = 0.77) among all treatment arms regarding the effect on walking speed, followed by DIA plus MET (P score = 0.75), NMES plus AET (SMD = 0.46, P score = 0.66), and AQET (SMD = 0.28, P score = 0.55; Figure 5 and Figure S3). The global heterogeneity of the NMA model for muscle strength was insignificant (τ2 = 0.02, I2 = 20.1%, p = 0.28). The node splitting results for inconsistency of NMA showed no inconsistencies between direct and indirect evidence; the same result was detected through visual inspection of the forest plot (Figure S6).

3.8.3. Subgroup Analysis of Follow-Up Duration

For walking speed, AET alone was discovered to be the optimal treatment in the short-term (SMD = 0.52, 95% CI: 0.25–0.80, P score = 0.87), medium-term (SMD = 0.55, 95% CI: 0.05–1.05, P score = 0.82), and long-term (SMD = 0.51, 95% CI: 0.16–0.86, P score = 0.92) follow-up durations, respectively (Figure 5 and Figure S3).

3.9. Network Meta-Regression Results for Moderators of Treatment Efficacy

The results of network meta-regression analyses are shown in Supplementary Table S6. No moderator was identified to have an influence on the treatment efficacy regarding muscle mass, strength gains, and walking speed.

3.10. Side Effects and Compliance

No serious adverse events, side effects, or severe complications were reported after diet therapy, exercise intervention, or combined treatment in all of the included RCTs. Nonserious adverse events related to exercise intervention were observed by nine RCTs [59,62,65,66,71,74,78,82,90], among which most commonly conditions were training-induced knee pain or muscle soreness of short duration (Table S7). Three RCTs [60,61,78] reported adverse events related to the diet therapy which included food intolerances and mild gastrointestinal reactions (Table S7). In addition, among the 16 RCTs [59,60,61,62,64,65,66,71,74,75,76,77,78,82,90,91] which had information about adverse events, seven [59,62,74,75,76,82,91] and five [64,75,76,77,91] reported no any adverse event occurred during (or after) diet therapy and exercise intervention, respectively.
The rate of compliance with the exercise interventions was 50.5–100% among the included RCTs that reported the adherence to exercise protocols or attendance rate of exercise sessions (Table 1) [58,59,62,65,70,73,74,75,76,78,80,81,82,84,86,87,91,95,96]. The rate of compliance with diet therapy was 61.0–94.7% in 13 RCTs [58,59,60,61,62,73,74,75,76,78,82,91,95].

3.11. Publication Bias

Visual inspection of the funnel plot of publication bias across the included RCTs for each primary outcome revealed no substantial asymmetry (Figure S7). Egger’s test results for muscle mass also did not indicate any obvious reporting bias among the RCTs included in the NMA (p = 0.24; Figure S7A), nor did those for muscle strength (p = 0.42; Figure S7B) or walking speed (p = 0.39; Figure S7C).

4. Discussion

The primary goal of this study was to identify the relative efficacy of different diet therapies, exercise interventions, and combined treatments for muscle mass, strength, and functional outcomes in individuals with obesity and OA. The NMA results in the present study showed that (1) diet therapy alone (particularly RMMR) and exercise therapy alone had significant effects on muscle mass relative to UC, whereas combined treatment had additional treatment efficacy, irrespective of the specific intervention and follow-up duration; (2) in comparison with UC, exercise therapy alone and combined treatment exerted favorable effects on muscle strength and walking speed, respectively; (3) based on the cumulative ranking results, RMMR plus RET, RET alone, and AET alone were the optimal treatment strategy for muscle mass gain, strength gain, and walking speed recovery, respectively.
The present NMA can be considered clinically useful specifically because of the vast number of available treatment strategies and compositions for overweight or obese people who have lower-extremity OA. In the conservative pairwise meta-analysis coupling with multiple independent head-to-head trials, it is difficult to determine which treatment is the most efficacious [97]. By contrast, NMA provides consistent estimates of the relative treatment effects compared with each other using both direct (i.e., conservative pairwise meta-analysis) and indirect evidence without double counting the participants [98]. In addition, with a specific treatment such as RMMR plus MET, the inclusion of active comparators (i.e., RMMR alone or MET alone) is important as it encourages optimal clinical decision among different treatment options by clinicians for overweight or obese patients with OA. Even in the absence of head-to-head RCTs, this NMA provides clinicians with the bottom-line knowledge regarding the best available evidence on the comparative efficacy among different diet, exercise, and combined treatments for overweight or obese people with OA, especially those who are undergoing weight management.
In the present study, combined treatment incorporating RMMR and RET was overall ranked as the most effective treatment for muscle mass gain for a number of possible reasons. First, weight management may synergically cause decreases in absolute lean mass as well as total body weight and fat mass in older individuals with obesity and OA [31]. However, the negative effects of diet-induced weight loss on muscle mass may be overestimated when using changes in absolute LBM or FFM. In this NMA, the ratio of muscle mass to total body weight in terms of percentage FFM or LBM was used to estimate the effect size of each treatment, and the NMA results showed that diet intervention alone, particularly RMMR and RMMR-DIA, exerted positive effects on muscle mass gain relative to UC. Our findings indicate that the efficacy of diet therapy for muscle mass can be objectively estimated using percentage LBM or FFM rather than absolute values. Second, previous systemic review studies have indicated that muscle strength training, especially RET, augments muscle mass gain in older people with sarcopenia [99,100], individuals with obesity and OA [101], and older adults with OA [24]. The muscle mass gain caused by exercise may be beneficial for older adults with obesity who are undergoing weight management [31,102]. The previous results support our findings that RET plus RMMR for dietary weight management exerts superior effects on muscle mass relative to RMMR or RET alone. Our findings also indicate that muscle mass can be effectively maintained or muscle mass loss can be prevented by the adjunct therapy of RET in individuals with obesity and OA who are undergoing a dietary weight loss intervention. Finally, a previous NMA indicated that RET and MET are equally ranked as optimal exercise therapies for muscle mass gain in adults with obesity [101], which supports the present study finding that RET and MET combined with diet therapy were ranked as the first two optimal treatments for individuals with obesity and knee or hip OA. We further identified that PMMR plus RET had the highest efficacy for muscle mass gain over a short-term follow-up, and PMMR-DIA plus MET had the strongest long-term effect on muscle mass and walking speed outcomes.
The present NMA demonstrated that RET alone and RET with BFR were overall the two optimal treatments for muscle strength gain in people with obesity and OA; in addition, over the medium-term follow-up, NMES and AET had higher effects on muscle strength gain than combined treatment did. In OA, muscle weakness has been associated with low muscle mass [103]. Based on the facts that reduction in fat mass is accompanied by loss of absolute FFM caused by weight loss [29,30,31] and that decreased muscle mass is more sensitive for detecting muscle strength loss than fat mass reduction in individuals with OA [9], an exercise intervention employed as monotherapy may achieve more positive effects on muscle strength gain than dietary therapy alone, supporting the results in the current NMA.
In this NMA, a series of meta-regression analyses were performed to identify the factors affecting treatment efficacy, and we found no significant moderation effects of age, BMI, gender, sample size, and methodological level (i.e., PEDro score). However, substantial moderating effects of some factors were noted. First, substantially but insignificantly minor treatment effects were exerted on muscle strength and walking speed in participants of an older age. In addition, a similar association was observed between age and muscle mass gain, although the finding was nonsignificant (Table S6). Previous studies have indicated that age-related changes in muscle mass are associated with a decline in strength and walking speed [104,105]. Conversely, intervention-induced increases in muscle mass may improve the strength and walking ability of older people who have sarcopenia and frailty risks [106]. The previous results may explain the parallel associations between age and muscle mass change and between age and strength and walking speed that were discovered in this NMA. Second, compared with male sex, female sex may be associated with poorer walking speed outcomes after interventions in such patients with obesity and OA. Results in this NMA were in line with a previous systemic review which found such a sex-specific difference in physical mobility after a diet plus exercise intervention in older individuals with OA [107]. Our findings further indicate that sex mediates the relative treatment efficacy among different diet therapies, exercise interventions, and combined treatments for physical mobility, which may be explained by the sex-specific muscle adaptations in response to diet and exercise interventions for the older population [108,109,110] and those with OA [24,111].
The findings of the present NMA should be interpreted on the basis of the following limitations. First, given the variation in dietary prescriptions and instructions (e.g., contents of MR and prescribed amounts, nutritional classes, and cognitive behavior therapy) and exercise protocols (training mode, duration, and volume), making a definite conclusion regarding the effect of specific types of treatment on muscle mass or strength gains was difficult. Second, some of our included trials had small group samples of fewer than 20 participants [63,68,69,71,73,77,79,86,87,88,96]; these studies found nonsignificant treatment effects on primary outcomes, which may have contributed negatively to the overall effect size. Third, because of the small number of RCTs with multiple exercise intensities (e.g., low and high intensities of RET), we combined the treatment effects of different exercise intensities within an exercise class, and the results should therefore be interpreted with caution. Fourth, the estimates for treatment arms—including IMMR, RUMR, AQET, NMES, RET with BFR, DIA plus RET, and DIA plus MET—were subject to considerable uncertainty with wide credibility intervals because the number of relevant RCTs was small. Finally, inadequate statistical power to detect inconsistency was noted owing to the small number of study arms relative to the number of treatment comparisons, although inconsistency was not detected in the current NMA.

5. Conclusions

This NMA determined the relative efficacy of different diet therapies, exercise interventions, and combined treatments for sarcopenia indices in individuals with obesity and hip or knee OA; in addition, the combined treatment RMMR plus RET was determined to be the optimal treatment strategy for muscle mass gain or preservation, whereas RET and AET alone were the optimal treatment options for strength and walking speed, regardless of the intervention and follow-up duration. According to the results of this study, we conclude that exercise alone increases muscle strength and walking speed, whereas an intervention incorporating diet therapy and exercise, especially RMMR plus RET, has superior effects on muscle mass and in individuals with obesity and lower-limb OA. The results of this study contribute to the knowledge on optimal diet and exercise intervention strategies, and an interdisciplinary and practical approach is required to counteract muscle loss and functional decline in the older population with obesity and OA. The findings of this review may guide the prescription of diet and exercise type for ensuring optimal treatment outcomes. Given the limitations of the current study, additional studies with large samples should be conducted for the identification of specific supplementation protocols.

Supplementary Materials

The following are available online at https://www.mdpi.com/article/10.3390/nu13061992/s1, Table S1. Database search formulas; Table S2. Summary of methodological quality based on the PEDro classification scale; Table S3. League table for pairwise and network meta-analysis of mean change in muscle mass from baseline; Table S4. League table for pairwise and network meta-analysis of mean change in muscle strength from baseline; Table S5. League table for pairwise and network meta-analysis of mean change in walk speed from baseline; Table S6. Results of network meta-regression analyses for associations of moderators with treatment efficiency; Table S7. Summary of adverse events of the included studies; Figure S1. Forest plot summarizing effects of diet, exercise interventions, and combined treatments on changes of muscle mass at each follow-up duration; Figure S2. Forest plot summarizing effects of diet, exercise interventions, and combined treatments on changes of muscle strength at each follow-up duration; Figure S3. Forest plot summarizing effects of diet, exercise interventions, and combined treatments on changes of walk speed at each follow-up duration; Figure S4. Forest plot summarizing node splitting results for inconsistency of network meta-analysis related to muscle mass outcome; Figure S5. Forest plot summarizing node splitting results for inconsistency of network meta-analysis related to muscle strength outcome; Figure S6. Forest plot summarizing node splitting results for inconsistency of network meta-analysis related to walk speed outcome; Figure S7. Funnel plots of the intervention effects for (A) muscle mass, (B) muscle strength, and (C) walk speed.

Author Contributions

The authors’ responsibilities are outlined as follows—C.-D.L., S.-F.C., S.-W.H., and T.-H.L. conceived and designed the experiments; C.-D.L., H.-C.C., and T.-H.L. searched for and selected relevant studies; C.-D.L., H.-C.C., and T.-H.L. extracted the data; C.-D.L. and H.-C.C. analyzed the data; S.-F.C. and C.-D.L. wrote the paper; H.-C.C. and T.-H.L. reviewed and verified the paper; C.-D.L. and T.-H.L. take the primary responsibility for the final content of the paper. All authors have read and agreed to the published version of the manuscript.

Funding

This study was funded by grants from the Ministry of Science and Technology, Taiwan (MOST 108-2314-B-038-102-MY3), and Taipei Medical University-Shuang Ho Hospital, Ministry of Health and Welfare, Taiwan (grant no. 109TMU-SHH-13). The funding source played no role in the design, implementation, data analysis, interpretation, or reporting of the study. The contents of this publication are solely the responsibility of the authors and do not necessarily represent the official view of the funding sources.

Institutional Review Board Statement

Ethical review and approval were not applicable for this study, due to the research design of systemic review and network meta-analysis. This systemic review and network meta-analysis followed the guidelines the guidelines of the Preferred Reporting Items for Systematic Reviews and Meta-Analyses (PRISMA) and the study protocol was registered at the PROSPERO database (registration number: CRD42021198023). All of the included randomized controlled trials obtained individual approvals from the respective local research ethics committee.

Informed Consent Statement

Not applicable. All of the included randomized controlled trials obtained individual informed consents from the respectively enrolled participants.

Data Availability Statement

Refer to Supplementary Materials. Raw data available on request.

Conflicts of Interest

The authors declare that they have no conflict of interest to the publication of this article.

References

  1. Lewis, R.; Gómez Álvarez, C.B.; Rayman, M.; Lanham-New, S.; Woolf, A.; Mobasheri, A. Strategies for optimising musculoskeletal health in the 21(st) century. BMC Musculoskelet. Disord. 2019, 20, 164. [Google Scholar] [CrossRef] [PubMed] [Green Version]
  2. Hunter, D.J.; Bierma-Zeinstra, S. Osteoarthritis. Lancet 2019, 393, 1745–1759. [Google Scholar] [CrossRef]
  3. Alshami, A.M.; Alhassany, H.A. Girth, strength, and flexibility of the calf muscle in patients with knee osteoarthritis: A case-control study. J. Taibah Univ. Med. Sci. 2020, 15, 197–202. [Google Scholar] [CrossRef]
  4. Zacharias, A.; Green, R.A.; Semciw, A.; English, D.J.; Kapakoulakis, T.; Pizzari, T. Atrophy of hip abductor muscles is related to clinical severity in a hip osteoarthritis population. Clin. Anat. 2018, 31, 507–513. [Google Scholar] [CrossRef] [PubMed]
  5. Loureiro, A.; Constantinou, M.; Diamond, L.E.; Beck, B.; Barrett, R. Individuals with mild-to-moderate hip osteoarthritis have lower limb muscle strength and volume deficits. BMC Musculoskelet Disord. 2018, 19, 303. [Google Scholar] [CrossRef] [PubMed]
  6. Coriolano, K.; Aiken, A.; Pukall, C.; Harrison, M. Changes in self-reported disability after performance-based tests in obese and non-obese individuals diagnosed with osteoarthritis of the knee. Disabil. Rehabil. 2015, 37, 1152–1161. [Google Scholar] [CrossRef] [PubMed] [Green Version]
  7. Batsis, J.A.; Zbehlik, A.J.; Barre, L.K.; Bynum, J.P.; Pidgeon, D.; Bartels, S.J. Impact of obesity on disability, function, and physical activity: Data from the Osteoarthritis Initiative. Scand. J. Rheumatol. 2015, 44, 495–502. [Google Scholar] [CrossRef]
  8. Jeon, H.; Lee, S.U.; Lim, J.Y.; Chung, S.G.; Lee, S.J.; Lee, S.Y. Low skeletal muscle mass and radiographic osteoarthritis in knee, hip, and lumbar spine: A cross-sectional study. Aging Clin. Exp. Res. 2019, 31, 1557–1562. [Google Scholar] [CrossRef]
  9. Zhang, X.; Pan, X.; Deng, L.; Fu, W. Relationship between Knee Muscle Strength and Fat/Muscle Mass in Elderly Women with Knee Osteoarthritis Based on Dual-Energy X-Ray Absorptiometry. Int. J. Environ. Res. Public Health 2020, 17, 573. [Google Scholar] [CrossRef] [Green Version]
  10. Park, H.M.; Kim, H.J.; Lee, B.; Kwon, M.; Jung, S.M.; Lee, S.W.; Park, Y.B.; Song, J.J. Decreased muscle mass is independently associated with knee pain in female patients with radiographically mild osteoarthritis: A nationwide cross-sectional study (KNHANES 2010-2011). Clin. Rheumatol. 2018, 37, 1333–1340. [Google Scholar] [CrossRef]
  11. Cheon, Y.H.; Kim, H.O.; Suh, Y.S.; Kim, M.G.; Yoo, W.H.; Kim, R.B.; Yang, H.S.; Lee, S.I.; Park, K.S. Relationship between decreased lower extremity muscle mass and knee pain severity in both the general population and patients with knee osteoarthritis: Findings from the KNHANES V 1-2. PLoS ONE 2017, 12, e0173036. [Google Scholar] [CrossRef]
  12. Pickering, M.E.; Chapurlat, R. Where Two Common Conditions of Aging Meet: Osteoarthritis and Sarcopenia. Calcif. Tissue Int. 2020, 107, 203–211. [Google Scholar] [CrossRef]
  13. Shorter, E.; Sannicandro, A.J.; Poulet, B.; Goljanek-Whysall, K. Skeletal Muscle Wasting and Its Relationship With Osteoarthritis: A Mini-Review of Mechanisms and Current Interventions. Curr. Rheumatol. Rep. 2019, 21, 40. [Google Scholar] [CrossRef] [PubMed] [Green Version]
  14. Chen, L.K.; Woo, J.; Assantachai, P.; Auyeung, T.W.; Chou, M.Y.; Iijima, K.; Jang, H.C.; Kang, L.; Kim, M.; Kim, S.; et al. Asian Working Group for Sarcopenia: 2019 Consensus Update on Sarcopenia Diagnosis and Treatment. J. Am. Med. Dir. Assoc. 2020, 21, 300–307. [Google Scholar] [CrossRef]
  15. Cruz-Jentoft, A.J.; Bahat, G.; Bauer, J.; Boirie, Y.; Bruyere, O.; Cederholm, T.; Cooper, C.; Landi, F.; Rolland, Y.; Sayer, A.A.; et al. Sarcopenia: Revised European consensus on definition and diagnosis. Age Ageing 2019, 48, 16–31. [Google Scholar] [CrossRef] [PubMed] [Green Version]
  16. Barazzoni, R.; Bischoff, S.C.; Boirie, Y.; Busetto, L.; Cederholm, T.; Dicker, D.; Toplak, H.; Van Gossum, A.; Yumuk, V.; Vettor, R. Sarcopenic obesity: Time to meet the challenge. Clin. Nutr. 2018, 37, 1787–1793. [Google Scholar] [CrossRef]
  17. Woo, J. Obesity in older persons. Curr. Opin. Clin. Nutr. Metab. Care 2015, 18, 5–10. [Google Scholar] [CrossRef]
  18. Godziuk, K.; Prado, C.M.; Woodhouse, L.J.; Forhan, M. The impact of sarcopenic obesity on knee and hip osteoarthritis: A scoping review. BMC Musculoskelet Disord. 2018, 19, 271. [Google Scholar] [CrossRef]
  19. Ackerman, I.N.; Osborne, R.H. Obesity and increased burden of hip and knee joint disease in Australia: Results from a national survey. BMC Musculoskelet Disord. 2012, 13, 254. [Google Scholar] [CrossRef] [Green Version]
  20. Misra, D.; Fielding, R.A.; Felson, D.T.; Niu, J.; Brown, C.; Nevitt, M.; Lewis, C.E.; Torner, J.; Neogi, T. Risk of Knee Osteoarthritis With Obesity, Sarcopenic Obesity, and Sarcopenia. Arthritis Rheumatol. 2019, 71, 232–237. [Google Scholar] [CrossRef] [PubMed] [Green Version]
  21. Ambrose, N.L.; Keogan, F.; O’Callaghan, J.P.; O’Connell, P.G. Obesity and disability in the symptomatic Irish knee osteoarthritis population. Ir. J. Med. Sci. 2010, 179, 265–268. [Google Scholar] [CrossRef]
  22. Vlietstra, L.; Stebbings, S.; Meredith-Jones, K.; Abbott, J.H.; Treharne, G.J.; Waters, D.L. Sarcopenia in osteoarthritis and rheumatoid arthritis: The association with self-reported fatigue, physical function and obesity. PLoS ONE 2019, 14, e0217462. [Google Scholar] [CrossRef] [Green Version]
  23. Skou, S.T.; Roos, E.M. Physical therapy for patients with knee and hip osteoarthritis: Supervised, active treatment is current best practice. Clin. Exp. Rheumatol. 2019, 37 (Suppl. 120), 112–117. [Google Scholar]
  24. Liao, C.D.; Chen, H.C.; Kuo, Y.C.; Tsauo, J.Y.; Huang, S.W.; Liou, T.H. Effects of muscle strength training on muscle mass gain and hypertrophy in older adults with osteoarthritis: A systematic review and meta-analysis. Arthritis Care Res. 2020, 72, 1703–1718. [Google Scholar] [CrossRef]
  25. Goh, S.L.; Persson, M.S.M.; Stocks, J.; Hou, Y.; Lin, J.; Hall, M.C.; Doherty, M.; Zhang, W. Efficacy and potential determinants of exercise therapy in knee and hip osteoarthritis: A systematic review and meta-analysis. Ann. Phys. Rehabil. Med. 2019, 62, 356–365. [Google Scholar] [CrossRef]
  26. Robson, E.K.; Hodder, R.K.; Kamper, S.J.; O’Brien, K.M.; Williams, A.; Lee, H.; Wolfenden, L.; Yoong, S.; Wiggers, J.; Barnett, C.; et al. Effectiveness of Weight Loss Interventions for Reducing Pain and Disability in People With Common Musculoskeletal Disorders: A Systematic Review With Meta-Analysis. J. Orthop. Sports Phys. Ther. 2020, 50, 319–333. [Google Scholar] [CrossRef]
  27. Chu, I.J.H.; Lim, A.Y.T.; Ng, C.L.W. Effects of meaningful weight loss beyond symptomatic relief in adults with knee osteoarthritis and obesity: A systematic review and meta-analysis. Obes. Rev. 2018, 19, 1597–1607. [Google Scholar] [CrossRef] [PubMed]
  28. Christensen, R.; Bartels, E.M.; Astrup, A.; Bliddal, H. Effect of weight reduction in obese patients diagnosed with knee osteoarthritis: A systematic review and meta-analysis. Ann. Rheum. Dis. 2007, 66, 433–439. [Google Scholar] [CrossRef]
  29. Weinheimer, E.M.; Sands, L.P.; Campbell, W.W. A systematic review of the separate and combined effects of energy restriction and exercise on fat-free mass in middle-aged and older adults: Implications for sarcopenic obesity. Nutr. Rev. 2010, 68, 375–388. [Google Scholar] [CrossRef] [PubMed]
  30. Miller, W.C.; Koceja, D.M.; Hamilton, E.J. A meta-analysis of the past 25 years of weight loss research using diet, exercise or diet plus exercise intervention. Int. J. Obes. Relat. Metab. Disord. 1997, 21, 941–947. [Google Scholar] [CrossRef] [PubMed] [Green Version]
  31. Henriksen, M.; Christensen, R.; Danneskiold-Samsøe, B.; Bliddal, H. Changes in lower extremity muscle mass and muscle strength after weight loss in obese patients with knee osteoarthritis: A prospective cohort study. Arthritis Rheum. 2012, 64, 438–442. [Google Scholar] [CrossRef]
  32. Ariani, A.; Manara, M.; Fioravanti, A.; Iannone, F.; Salaffi, F.; Ughi, N.; Prevete, I.; Bortoluzzi, A.; Parisi, S.; Scire, C.A. The Italian Society for Rheumatology clinical practice guidelines for the diagnosis and management of knee, hip and hand osteoarthritis. Reumatismo 2019, 71, 5–21. [Google Scholar] [CrossRef]
  33. Bannuru, R.R.; Osani, M.C.; Vaysbrot, E.E.; Arden, N.K.; Bennell, K.; Bierma-Zeinstra, S.M.A.; Kraus, V.B.; Lohmander, L.S.; Abbott, J.H.; Bhandari, M.; et al. OARSI guidelines for the non-surgical management of knee, hip, and polyarticular osteoarthritis. Osteoarthr. Cartil. 2019, 27, 1578–1589. [Google Scholar] [CrossRef] [Green Version]
  34. Bennell, K.L.; Wrigley, T.V.; Hunt, M.A.; Lim, B.W.; Hinman, R.S. Update on the role of muscle in the genesis and management of knee osteoarthritis. Rheum. Dis. Clin. N. Am. 2013, 39, 145–176. [Google Scholar] [CrossRef] [PubMed]
  35. Bierma-Zeinstra, S.; van Middelkoop, M.; Runhaar, J.; Schiphof, D. Nonpharmacological and nonsurgical approaches in OA. Best Pract. Res. Clin. Rheumatol. 2020, 34, 101564. [Google Scholar] [CrossRef]
  36. Kiadaliri, A.A.; Lohmander, L.S.; Moradi-Lakeh, M.; Petersson, I.F.; Englund, M. High and rising burden of hip and knee osteoarthritis in the Nordic region, 1990–2015. Acta Orthop. 2018, 89, 177–183. [Google Scholar] [CrossRef] [PubMed] [Green Version]
  37. Hall, M.; Castelein, B.; Wittoek, R.; Calders, P.; Van Ginckel, A. Diet-induced weight loss alone or combined with exercise in overweight or obese people with knee osteoarthritis: A systematic review and meta-analysis. Semin. Arthritis Rheum. 2019, 48, 765–777. [Google Scholar] [CrossRef]
  38. Shamseer, L.; Moher, D.; Clarke, M.; Ghersi, D.; Liberati, A.; Petticrew, M.; Shekelle, P.; Stewart, L.A. Preferred reporting items for systematic review and meta-analysis protocols (PRISMA-P) 2015: Elaboration and explanation. BMJ 2015, 349, g7647. [Google Scholar] [CrossRef] [PubMed] [Green Version]
  39. Hutton, B.; Salanti, G.; Caldwell, D.M.; Chaimani, A.; Schmid, C.H.; Cameron, C.; Ioannidis, J.P.; Straus, S.; Thorlund, K.; Jansen, J.P.; et al. The PRISMA extension statement for reporting of systematic reviews incorporating network meta-analyses of health care interventions: Checklist and explanations. Ann. Intern. Med. 2015, 162, 777–784. [Google Scholar] [CrossRef] [Green Version]
  40. Hutton, B.; Catalá-López, F.; Moher, D. The PRISMA statement extension for systematic reviews incorporating network meta-analysis: PRISMA-NMA. Med. Clínica 2016, 147, 262–266. [Google Scholar] [CrossRef]
  41. Higgins, J.P.T.; Thomas, J.; Chandler, J.; Cumpston, M.; Li, T.; Page, M.J.; Welch, V.A. (Eds.) Chapter 3: Defining the criteria for including studies and how they will be grouped for the synthesis. In Cochrane Handbook for Systematic Reviews of Interventions; Version 6.2 (Updated February 2021); Cochrane: London, UK, 2021; Available online: www.training.cochrane.org/handbook (accessed on 5 June 2021).
  42. Wu, C.H.; Chen, K.T.; Hou, M.T.; Chang, Y.F.; Chang, C.S.; Liu, P.Y.; Wu, S.J.; Chiu, C.J.; Jou, I.M.; Chen, C.Y. Prevalence and associated factors of sarcopenia and severe sarcopenia in older Taiwanese living in rural community: The Tianliao Old People study 04. Geriatr. Gerontol. Int. 2014, 14 (Suppl. 1), 69–75. [Google Scholar] [CrossRef] [PubMed] [Green Version]
  43. Tooth, L.; Bennett, S.; McCluskey, A.; Hoffmann, T.; McKenna, K.; Lovarini, M. Appraising the quality of randomized controlled trials: Inter-rater reliability for the OTseeker evidence database. J. Eval. Clin. Pract. 2005, 11, 547–555. [Google Scholar] [CrossRef]
  44. Foley, N.C.; Bhogal, S.K.; Teasell, R.W.; Bureau, Y.; Speechley, M.R. Estimates of quality and reliability with the physiotherapy evidence-based database scale to assess the methodology of randomized controlled trials of pharmacological and nonpharmacological interventions. Phys. Ther. 2006, 86, 817–824. [Google Scholar] [CrossRef]
  45. Briani, R.V.; Ferreira, A.S.; Pazzinatto, M.F.; Pappas, E.; De Oliveira Silva, D.; Azevedo, F.M. What interventions can improve quality of life or psychosocial factors of individuals with knee osteoarthritis? A systematic review with meta-analysis of primary outcomes from randomised controlled trials. Br. J. Sports Med. 2018, 52, 1031–1038. [Google Scholar] [CrossRef] [Green Version]
  46. Higgins, J.P.T.; Li, T.; Deeks, J.J. Chapter 6: Choosing effect measures and computing estimates of effect. In Cochrane Handbook for Systematic Reviews of Interventions; Version 6.2 (Updated February 2021); Higgins, J.P.T., Thomas, J., Chandler, J., Cumpston, M., Li, T., Page, M.J., Welch, V.A., Eds.; Cochrane: London, UK, 2021; Available online: www.training.cochrane.org/handbook (accessed on 5 June 2021).
  47. Rosenthal, R. Meta-Analytic Procedures for Social Research; Rosenthal, R., Ed.; Sage Publications: Newbury Park, CA, USA, 1993. [Google Scholar]
  48. Cohen, J. Statistical Power Analysis for the Behavioral Sciences, 2nd ed.; Lawrence Erlbaum Associates: Hillsdale, NY, USA, 1988. [Google Scholar]
  49. R Core Team. R: A Language and Environment for Statistical Computing; R Foundation for Statistical Computing: Vienna, Austria, 2021. [Google Scholar]
  50. Harrer, M.; Cuijpers, P.; Furukawa, T.A.; Ebert, D.D. Doing Meta-Analysis in R: A Hands-on Guide; PROTECT Lab: Erlangen, Germany, 2019. [Google Scholar]
  51. Shim, S.R.; Kim, S.-J.; Lee, J.; Rücker, G. Network meta-analysis: Application and practice using R software. Epidemiol. Health 2019, 41, e201901. [Google Scholar] [CrossRef] [PubMed] [Green Version]
  52. Higgins, J.P.; Jackson, D.; Barrett, J.K.; Lu, G.; Ades, A.E.; White, I.R. Consistency and inconsistency in network meta-analysis: Concepts and models for multi-arm studies. Res. Synth. Methods 2012, 3, 98–110. [Google Scholar] [CrossRef] [PubMed] [Green Version]
  53. Jackson, D.; Barrett, J.K.; Rice, S.; White, I.R.; Higgins, J.P. A design-by-treatment interaction model for network meta-analysis with random inconsistency effects. Stat. Med. 2014, 33, 3639–3654. [Google Scholar] [CrossRef] [Green Version]
  54. Rücker, G.; Schwarzer, G. Ranking treatments in frequentist network meta-analysis works without resampling methods. BMC Med. Res. Methodol. 2015, 15, 58. [Google Scholar] [CrossRef] [Green Version]
  55. Mbuagbaw, L.; Rochwerg, B.; Jaeschke, R.; Heels-Andsell, D.; Alhazzani, W.; Thabane, L.; Guyatt, G.H. Approaches to interpreting and choosing the best treatments in network meta-analyses. Syst. Rev. 2017, 6, 79. [Google Scholar] [CrossRef] [Green Version]
  56. Beaudreuil, J.; Coudreuse, J.M.; Guyen, N.G.; Deat, P.; Chabaud, A.; Pereira, B.; Lorenzo, A.; Sailhan, F.; Rannou, F.; Coudeyre, E. An algorithm to improve knee orthosis prescription for osteoarthritis patients. Ann. Phys. Rehabil. Med. 2016, 59, e156. [Google Scholar] [CrossRef]
  57. Egger, M.; Davey Smith, G.; Schneider, M.; Minder, C. Bias in meta-analysis detected by a simple, graphical test. BMJ. 1997, 315, 629–634. [Google Scholar] [CrossRef] [Green Version]
  58. Beavers, K.M.; Beavers, D.P.; Newman, J.J.; Anderson, A.M.; Loeser, R.F., Jr.; Nicklas, B.J.; Lyles, M.F.; Miller, G.D.; Mihalko, S.L.; Messier, S.P. Effects of total and regional fat loss on plasma CRP and IL-6 in overweight and obese, older adults with knee osteoarthritis. Osteoarthr. Cartil. 2015, 23, 249–256. [Google Scholar] [CrossRef] [Green Version]
  59. Christensen, P.; Frederiksen, R.; Bliddal, H.; Riecke, B.F.; Bartels, E.M.; Henriksen, M.; Juul, S.R.T.; Gudbergsen, H.; Winther, K.; Astrup, A.; et al. Comparison of three weight maintenance programs on cardiovascular risk, bone and vitamins in sedentary older adults. Obesity 2013, 21, 1982–1990. [Google Scholar] [CrossRef]
  60. Christensen, P.; Henriksen, M.; Bartels, E.M.; Leeds, A.R.; Meinert Larsen, T.; Gudbergsen, H.; Riecke, B.F.; Astrup, A.; Heitmann, B.L.; Boesen, M.; et al. Long-term weight-loss maintenance in obese patients with knee osteoarthritis: A randomized trial. Am. J. Clin. Nutr. 2017, 106, 755–763. [Google Scholar] [CrossRef] [Green Version]
  61. Christensen, R.; Astrup, A.; Bliddal, H. Weight loss: The treatment of choice for knee osteoarthritis? A randomized trial. Osteoarthr. Cartil. 2005, 13, 20–27. [Google Scholar] [CrossRef] [PubMed] [Green Version]
  62. Christensen, R.; Henriksen, M.; Leeds, A.R.; Gudbergsen, H.; Christensen, P.; Sorensen, T.J.; Bartels, E.M.; Riecke, B.F.; Aaboe, J.; Frederiksen, R.; et al. Effect of weight maintenance on symptoms of knee osteoarthritis in obese patients: A twelve-month randomized controlled trial. Arthritis Care Res. 2015, 67, 640–650. [Google Scholar] [CrossRef]
  63. Ghroubi, S.; Elleuch, H.; Kaffel, N.; Echikh, T.; Abid, M.; Elleuch, M.H. Contribution of exercise and diet in the management of knee osteoarthritis in the obese. Ann. Readapt. Med. Phys. 2008, 51, 663–670. [Google Scholar] [CrossRef] [PubMed]
  64. Gill, S.D.; McBurney, H.; Schulz, D.L. Land-based versus pool-based exercise for people awaiting joint replacement surgery of the hip or knee: Results of a randomized controlled trial. Arch. Phys. Med. Rehabil. 2009, 90, 388–394. [Google Scholar] [CrossRef] [PubMed]
  65. Kuptniratsaikul, V.; Kittichaikarn, C.; Suntornpiyapan, P.; Kovintaset, K.; Inthibal, S. Is four-week underwater treadmill exercise regimen compared to home exercise efficacious for pain relief and functional improvement in obese patients with knee osteoarthritis? A randomized controlled trial. Clin. Rehabil. 2019, 33, 85–93. [Google Scholar] [CrossRef] [PubMed]
  66. Lim, J.Y.; Tchai, E.; Jang, S.N. Effectiveness of aquatic exercise for obese patients with knee osteoarthritis: A randomized controlled trial. Pm&r 2010, 2, 723–731. [Google Scholar]
  67. López-Gómez, J.J.; Izaola-Jauregui, O.; Primo-Martín, D.; Torres-Torres, B.; Gómez-Hoyos, E.; Ortolá-Buigues, A.; Martín-Ferrero, M.A.; De Luis-Román, D.A. Effect of Two Meal Replacement strategies on Cardiovascular Risk Parameters in Advanced Age Patients with Obesity and Osteoarthritis. Nutrients 2020, 12, 976. [Google Scholar] [CrossRef] [Green Version]
  68. Magrans-Courtney, T.; Wilborn, C.; Rasmussen, C.; Ferreira, M.; Greenwood, L.; Campbell, B.; Kerksick, C.M.; Nassar, E.; Li, R.; Iosia, M.; et al. Effects of diet type and supplementation of glucosamine, chondroitin, and MSM on body composition, functional status, and markers of health in women with knee osteoarthritis initiating a resistance-based exercise and weight loss program. J. Int. Soc. Sports Nutr. 2011, 8, 8. [Google Scholar] [CrossRef] [Green Version]
  69. Mahmoud, W.S.; Elnaggar, R.K.; Ahmed, A.S. Influence of Isometric Exercise Training on Quadriceps Muscle Architecture and Strength in Obese Subjects with Knee Osteoarthritis. Int. J. Med. Res. Health Sci. 2017, 6, 1–9. [Google Scholar]
  70. Mangani, I.; Cesari, M.; Kritchevsky, S.B.; Maraldi, C.; Carter, C.S.; Atkinson, H.H.; Penninx, B.W.; Marchionni, N.; Pahor, M. Physical exercise and comorbidity. Results from the Fitness and Arthritis in Seniors Trial (FAST). Aging Clin. Exp. Res. 2006, 18, 374–380. [Google Scholar] [CrossRef]
  71. Matsuse, H.; Segal, N.A.; Rabe, K.G.; Shiba, N. The Effect of Neuromuscular Electrical Stimulation During Walking on Muscle Strength and Knee Pain in Obese Women With Knee Pain: A Randomized Controlled Trial. Am. J. Phys. Med. Rehabil. 2020, 99, 56–64. [Google Scholar] [CrossRef]
  72. McLeod, A.; Schiffer, L.; Castellanos, K.; DeMott, A.; Olender, S.; Fitzgibbon, M.; Hughes, S.; Fantuzzi, G.; Tussing-Humphreys, L. Impact of Physical Activity and Weight Loss on Fat Mass, Glucose Metabolism, and Inflammation in Older African Americans with Osteoarthritis. Nutrients 2020, 12, 3299. [Google Scholar] [CrossRef] [PubMed]
  73. Messier, S.P.; Loeser, R.F.; Mitchell, M.N.; Valle, G.; Morgan, T.P.; Rejeski, W.J.; Ettinger, W.H. Exercise and weight loss in obese older adults with knee osteoarthritis: A preliminary study. J. Am. Geriatr. Soc. 2000, 48, 1062–1072. [Google Scholar] [CrossRef]
  74. Messier, S.P.; Mihalko, S.L.; Legault, C.; Miller, G.D.; Nicklas, B.J.; DeVita, P.; Beavers, D.P.; Hunter, D.J.; Lyles, M.F.; Eckstein, F.; et al. Effects of intensive diet and exercise on knee joint loads, inflammation, and clinical outcomes among overweight and obese adults with knee osteoarthritis: The IDEA randomized clinical trial. JAMA 2013, 310, 1263–1273. [Google Scholar] [CrossRef] [PubMed]
  75. Miller, G.D.; Jenks, M.Z.; Vendela, M.; Norris, J.L.; Muday, G.K. Influence of weight loss, body composition, and lifestyle behaviors on plasma adipokines: A randomized weight loss trial in older men and women with symptomatic knee osteoarthritis. J. Obes. 2012, 2012, 708505. [Google Scholar] [CrossRef] [Green Version]
  76. Miller, G.D.; Nicklas, B.J.; Davis, C.; Loeser, R.F.; Lenchik, L.; Messier, S.P. Intensive weight loss program improves physical function in older obese adults with knee osteoarthritis. Obesity 2006, 14, 1219–1230. [Google Scholar] [CrossRef] [PubMed]
  77. Rabe, K.G.; Matsuse, H.; Jackson, A.; Segal, N.A. Evaluation of the Combined Application of Neuromuscular Electrical Stimulation and Volitional Contractions on Thigh Muscle Strength, Knee Pain, and Physical Performance in Women at Risk for Knee Osteoarthritis: A Randomized Controlled Trial. Pm&r 2018, 10, 1301–1310. [Google Scholar]
  78. Robbins, S.R.; Melo, L.R.S.; Urban, H.; Deveza, L.A.; Asher, R.; Johnson, V.L.; Hunter, D.J. Is a stepped-care intervention effective in overweight and obese people with medial tibiofemoral osteoarthritis? The STrEAMline study: A randomised controlled trial. Arthritis Care Res. 2021, 73, 520–530. [Google Scholar] [CrossRef]
  79. Rosemffet, M.G.; Schneeberger, E.E.; Citera, G.; Sgobba, M.E.; Laiz, C.; Schmulevich, H.; Artçanuturry, P.; Gagliardi, S.; Maldonado Cocco, J.A. Effects of functional electrostimulation on pain, muscular strength, and functional capacity in patients with osteoarthritis of the knee. J. Clin. Rheumatol. 2004, 10, 246–249. [Google Scholar] [CrossRef] [PubMed]
  80. Segal, N.; Davis, M.D.; Mikesky, A.E. Efficacy of Blood Flow-Restricted Low-Load Resistance Training For Quadriceps Strengthening in Men at Risk of Symptomatic Knee Osteoarthritis. Geriatr. Orthop. Surg. Rehabil. 2015, 6, 160–167. [Google Scholar] [CrossRef] [Green Version]
  81. Segal, N.A.; Williams, G.N.; Davis, M.C.; Wallace, R.B.; Mikesky, A.E. Efficacy of blood flow-restricted, low-load resistance training in women with risk factors for symptomatic knee osteoarthritis. Pm&r 2015, 7, 376–384. [Google Scholar]
  82. Skou, S.T.; Rasmussen, S.; Laursen, M.B.; Rathleff, M.S.; Arendt-Nielsen, L.; Simonsen, O.; Roos, E.M. The efficacy of 12 weeks non-surgical treatment for patients not eligible for total knee replacement: A randomized controlled trial with 1-year follow-up. Osteoarthr. Cartil. 2015, 23, 1465–1475. [Google Scholar] [CrossRef] [Green Version]
  83. Skou, S.T.; Roos, E.M.; Laursen, M.B.; Rathleff, M.S.; Arendt-Nielsen, L.; Rasmussen, S.; Simonsen, O. Total knee replacement and non-surgical treatment of knee osteoarthritis: 2-year outcome from two parallel randomized controlled trials. Osteoarthr. Cartil. 2018, 26, 1170–1180. [Google Scholar] [CrossRef] [PubMed] [Green Version]
  84. Swank, A.M.; Kachelman, J.B.; Bibeau, W.; Quesada, P.M.; Nyland, J.; Malkani, A.; Topp, R.V. Prehabilitation before total knee arthroplasty increases strength and function in older adults with severe osteoarthritis. J. Strength Cond. Res. 2011, 25, 318–325. [Google Scholar] [CrossRef] [Green Version]
  85. Tak, E.; Staats, P.; Van Hespen, A.; Hopman-Rock, M. The effects of an exercise program for older adults with osteoarthritis of the hip. J. Rheumatol. 2005, 32, 1106–1113. [Google Scholar]
  86. Talbot, L.A.; Gaines, J.M.; Huynh, T.N.; Metter, E.J. A home-based pedometer-driven walking program to increase physical activity in older adults with osteoarthritis of the knee: A preliminary study. J. Am. Geriatr. Soc. 2003, 51, 387–392. [Google Scholar] [CrossRef]
  87. Talbot, L.A.; Gaines, J.M.; Ling, S.M.; Metter, E.J. A home-based protocol of electrical muscle stimulation for quadriceps muscle strength in older adults with osteoarthritis of the knee. J. Rheumatol. 2003, 30, 1571–1578. [Google Scholar] [PubMed]
  88. Toda, Y. The effect of energy restriction, walking, and exercise on lower extremity lean body mass in obese women with osteoarthritis of the knee. J. Orthop. Sci. 2001, 6, 148–154. [Google Scholar] [CrossRef]
  89. Toda, Y.; Kobayashi, T. The usefulness of walking for preventing sarcopenia in dieting postmenopausal women complaining of knee pain. Ann. N. Y. Acad. Sci. 2000, 904, 610–613. [Google Scholar] [CrossRef]
  90. Wallis, J.A.; Webster, K.E.; Levinger, P.; Singh, P.J.; Fong, C.; Taylor, N.F. A walking program for people with severe knee osteoarthritis did not reduce pain but may have benefits for cardiovascular health: A phase II randomised controlled trial. Osteoarthr. Cartil. 2017, 25, 1969–1979. [Google Scholar] [CrossRef] [Green Version]
  91. Wang, X.; Miller, G.D.; Messier, S.P.; Nicklas, B.J. Knee strength maintained despite loss of lean body mass during weight loss in older obese adults with knee osteoarthritis. J. Gerontol. A Biol. Sci. Med. Sci. 2007, 62, 866–871. [Google Scholar] [CrossRef] [Green Version]
  92. Messier, S.P.; Legault, C.; Mihalko, S.; Miller, G.D.; Loeser, R.F.; DeVita, P.; Lyles, M.; Eckstein, F.; Hunter, D.J.; Williamson, J.D.; et al. The Intensive Diet and Exercise for Arthritis (IDEA) trial: Design and rationale. BMC Musculoskelet Disord. 2009, 10, 93. [Google Scholar] [CrossRef] [PubMed] [Green Version]
  93. Riecke, B.F.; Christensen, R.; Christensen, P.; Leeds, A.R.; Boesen, M.; Lohmander, L.S.; Astrup, A.; Bliddal, H. Comparing two low-energy diets for the treatment of knee osteoarthritis symptoms in obese patients: A pragmatic randomized clinical trial. Osteoarthr. Cartil. 2010, 18, 746–754. [Google Scholar] [CrossRef] [Green Version]
  94. Skou, S.T.; Roos, E.M.; Laursen, M.B.; Rathleff, M.S.; Arendt-Nielsen, L.; Simonsen, O.; Rasmussen, S. Efficacy of multimodal, systematic non-surgical treatment of knee osteoarthritis for patients not eligible for a total knee replacement: A study protocol of a randomised controlled trial. BMJ Open 2012, 2, e002168. [Google Scholar] [CrossRef] [PubMed] [Green Version]
  95. Messier, S.P.; Loeser, R.F.; Miller, G.D.; Morgan, T.M.; Rejeski, W.J.; Sevick, M.A.; Ettinger, W.H., Jr.; Pahor, M.; Williamson, J.D. Exercise and dietary weight loss in overweight and obese older adults with knee osteoarthritis: The Arthritis, Diet, and Activity Promotion Trial. Arthritis Rheum. 2004, 50, 1501–1510. [Google Scholar] [CrossRef] [PubMed]
  96. Schlenk, E.A.; Lias, J.L.; Sereika, S.M.; Dunbar-Jacob, J.; Kwoh, C.K. Improving physical activity and function in overweight and obese older adults with osteoarthritis of the knee: A feasibility study. Rehabil. Nurs. 2011, 36, 32–42. [Google Scholar] [CrossRef] [Green Version]
  97. Caldwell, D.M.; Welton, N.J.; Ades, A.E. Mixed treatment comparison analysis provides internally coherent treatment effect estimates based on overviews of reviews and can reveal inconsistency. J. Clin. Epidemiol. 2010, 63, 875–882. [Google Scholar] [CrossRef] [PubMed]
  98. Reken, S.; Sturtz, S.; Kiefer, C.; Böhler, Y.B.; Wieseler, B. Assumptions of Mixed Treatment Comparisons in Health Technology Assessments—Challenges and Possible Steps for Practical Application. PLoS ONE 2016, 11, e0160712. [Google Scholar] [CrossRef]
  99. Barajas-Galindo, D.E.; González Arnáiz, E.; Ferrero Vicente, P.; Ballesteros-Pomar, M.D. Effects of physical exercise in sarcopenia. A systematic review. Endocrinol. Diabetes Nutr. 2021, 68, 159–169. [Google Scholar] [CrossRef]
  100. Beckwée, D.; Delaere, A.; Aelbrecht, S.; Baert, V.; Beaudart, C.; Bruyere, O.; de Saint-Hubert, M.; Bautmans, I. Exercise Interventions for the Prevention and Treatment of Sarcopenia. A Systematic Umbrella Review. J. Nutr. Health Aging 2019, 23, 494–502. [Google Scholar] [CrossRef] [PubMed]
  101. Morze, J.; Rücker, G.; Danielewicz, A.; Przybyłowicz, K.; Neuenschwander, M.; Schlesinger, S.; Schwingshackl, L. Impact of different training modalities on anthropometric outcomes in patients with obesity: A systematic review and network meta-analysis. Obes. Rev. 2021, 3128, 1–12. [Google Scholar]
  102. Pazzianotto-Forti, E.M.; Moreno, M.A.; Plater, E.; Baruki, S.B.S.; Rasera-Junior, I.; Reid, W.D. Impact of Physical Training Programs on Physical Fitness in People With Class II and III Obesity: A Systematic Review and Meta-Analysis. Phys. Ther. 2020, 100, 963–978. [Google Scholar] [CrossRef]
  103. Wada, O.; Kurita, N.; Kamitani, T.; Mizuno, K. Implications of evaluating leg muscle mass and fat mass separately for quadriceps strength in knee osteoarthritis: The SPSS-OK study. Clin. Rheumatol. 2020, 39, 1655–1661. [Google Scholar] [CrossRef]
  104. Duchowny, K.A.; Peters, K.E.; Cummings, S.R.; Orwoll, E.S.; Hoffman, A.R.; Ensrud, K.E.; Cauley, J.A.; Evans, W.J.; Cawthon, P.M. Association of change in muscle mass assessed by D3 -creatine dilution with changes in grip strength and walking speed. J. Cachexia Sarcopenia Muscle 2020, 11, 55–61. [Google Scholar] [CrossRef] [PubMed] [Green Version]
  105. Osawa, Y.; Chiles Shaffer, N.; Shardell, M.D.; Studenski, S.A.; Ferrucci, L. Changes in knee extension peak torque and body composition and their relationship with change in gait speed. J. Cachexia Sarcopenia Muscle 2019, 10, 1000–1008. [Google Scholar] [CrossRef]
  106. Liao, C.D.; Chen, H.C.; Huang, S.W.; Liou, T.H. The Role of Muscle Mass Gain Following Protein Supplementation Plus Exercise Therapy in Older Adults with Sarcopenia and Frailty Risks: A Systematic Review and Meta-Regression Analysis of Randomized Trials. Nutrients 2019, 11, 1713. [Google Scholar] [CrossRef] [Green Version]
  107. Liao, C.D.; Wu, Y.T.; Tsauo, J.Y.; Chen, P.R.; Tu, Y.K.; Chen, H.C.; Liou, T.H. Effects of Protein Supplementation Combined with Exercise Training on Muscle Mass and Function in Older Adults with Lower-Extremity Osteoarthritis: A Systematic Review and Meta-Analysis of Randomized Trials. Nutrients 2020, 12, 2422. [Google Scholar] [CrossRef] [PubMed]
  108. Da Boit, M.; Sibson, R.; Meakin, J.R.; Aspden, R.M.; Thies, F.; Mangoni, A.A.; Gray, S.R. Sex differences in the response to resistance exercise training in older people. Physiol. Rep. 2016, 4, e12834. [Google Scholar] [CrossRef]
  109. Burd, N.A.; Tang, J.E.; Moore, D.R.; Phillips, S.M. Exercise training and protein metabolism: Influences of contraction, protein intake, and sex-based differences. J. Appl. Physiol. 2009, 106, 1692–1701. [Google Scholar] [CrossRef] [PubMed]
  110. Smith, G.I.; Villareal, D.T.; Sinacore, D.R.; Shah, K.; Mittendorfer, B. Muscle protein synthesis response to exercise training in obese, older men and women. Med. Sci. Sports Exerc. 2012, 44, 1259–1266. [Google Scholar] [CrossRef] [PubMed] [Green Version]
  111. Miller, M.S.; Callahan, D.M.; Tourville, T.W.; Slauterbeck, J.R.; Kaplan, A.; Fiske, B.R.; Savage, P.D.; Ades, P.A.; Beynnon, B.D.; Toth, M.J. Moderate-intensity resistance exercise alters skeletal muscle molecular and cellular structure and function in inactive older adults with knee osteoarthritis. J. Appl. Physiol. 2017, 122, 775–787. [Google Scholar] [CrossRef] [Green Version]
Figure 1. Flowchart of study selection.
Nutrients 13 01992 g001
Figure 2. Network plot of direct comparisons for different treatments for (A) muscle mass, (B) muscle strength, and (C) walking speed. The lines between nodes represent direct comparisons in various studies; the thickness of each line is proportional to the number of studies denoted on the line and indicates the connection between studies in terms of comparisons. The size of each node is proportional to the sample size of the participants involved in each specific treatment. AET, aerobic exercise training; AQET, aquatic exercise training; BFR, blood flow restriction; DIA, diet instruction and advisement; IMET, isometric exercise training; IMMR, intermittent multimeal replacement; MET, multicomponent exercise training; NMES, neuromuscular electric stimulation; RET, resistance exercise training; RMMR, regular multimeal replacement; RUMR, regular unimeal replacement; UC, usual care.
Nutrients 13 01992 g002
Figure 3. Forest plot summarizing the effects of diet, exercise intervention, and combined treatment on changes in muscle mass in at each follow-up time point. Each point estimate (square) in each time frame and during the overall duration presents the network combined effect (SMD) on the muscle mass relative to UC, with the 95% CI (horizontal line). The results plotted on the right-hand side indicate effects favoring the treatment approach. The blue−colored point denotes the highest rank of probability, reflecting that the treatment approach is the optimal intervention among all treatments in each time frame. 95% CI, 95% confidence interval; AET, aerobic exercise training; AQET, aquatic exercise training; BFR, blood flow restriction; DIA, diet instruction and advisement; IMET, isometric exercise training; IMMR, intermittent multimeal replacement; MET, multicomponent exercise training; RET, resistance exercise training; RMMR, regular multimeal replacement; RUMR, regular unimeal replacement; Std, standard; UC, usual care.
Nutrients 13 01992 g003
Figure 4. Forest plot summarizing the effects of diet, exercise intervention, and combined treatment on changes in muscle strength in each follow-up duration. Each point estimate (square) in each time frame and during the overall duration presents the network combined effect (SMD) on the muscle strength relative to UC, with the 95% CI (horizontal line). The results plotted on the right-hand side indicate effects favoring the treatment approach. The blue–colored point denotes the highest rank of probability, reflecting that the treatment approach is the optimal intervention among all treatments in each time frame. 95% CI, 95% confidence interval; AET, aerobic exercise training; DIA, diet instruction and advisement; MET, multicomponent exercise training; RET, resistance exercise training; RMMR, regular multimeal replacement; RUMR, regular unimeal replacement; Std, standard; UC, usual care.
Nutrients 13 01992 g004
Figure 5. Forest plot summarizing the effects of diet, exercise intervention, and combined treatment on changes in walking speed in each follow-up duration. Each point estimate (square) in each time frame and during the overall duration presents the network combined effect (SMD) on the walking speed relative to UC, with the 95% CI (horizontal line). The results plotted on the right-hand side indicate effects favoring the treatment approach. The blue-colored point denotes the highest rank of probability, reflecting that the treatment approach is the optimal intervention among all treatments in each time frame. 95% CI, 95% confidence interval; AET, aerobic exercise training; AQET, aquatic exercise training; DIA, diet instruction and advisement; IMET, isometric exercise training; MET, multicomponent exercise training; NMES, neuromuscular electric stimulation; RET, resistance exercise training; RMMR, regular multimeal replacement; RUMR, regular unimeal replacement; Std, standard; UC, usual care.
Nutrients 13 01992 g005
Publisher’s Note: MDPI stays neutral with regard to jurisdictional claims in published maps and institutional affiliations.

