Optimizing Chronic Pain Treatment with Enhanced Neuroplastic Responsiveness: A Pilot Randomized Controlled Trial

 , ,
, ,
Abstract
1. Introduction
2. Materials and Methods
2.1. Study Design and Setting
2.2. Ethics
2.3. Participants
2.4. Procedures
2.4.1. Recruitment and Screening
2.4.2. Randomization
2.4.3. Interventions
2.4.4. Sessions 2–4
2.4.5. Standardized Exposure Activity
2.5. Measures
2.5.1. Demographic and Health Information
2.5.2. Clinical Pain Measures
2.5.3. Experimental Pain Measures
2.5.4. Affect, Mood, and Stress Measures
2.5.5. Cognitive Measures
2.5.6. Biological Measures
2.5.7. EEG Measures
2.5.8. Additional Explanatory Variables
2.6. Statistical Analyses
3. Results
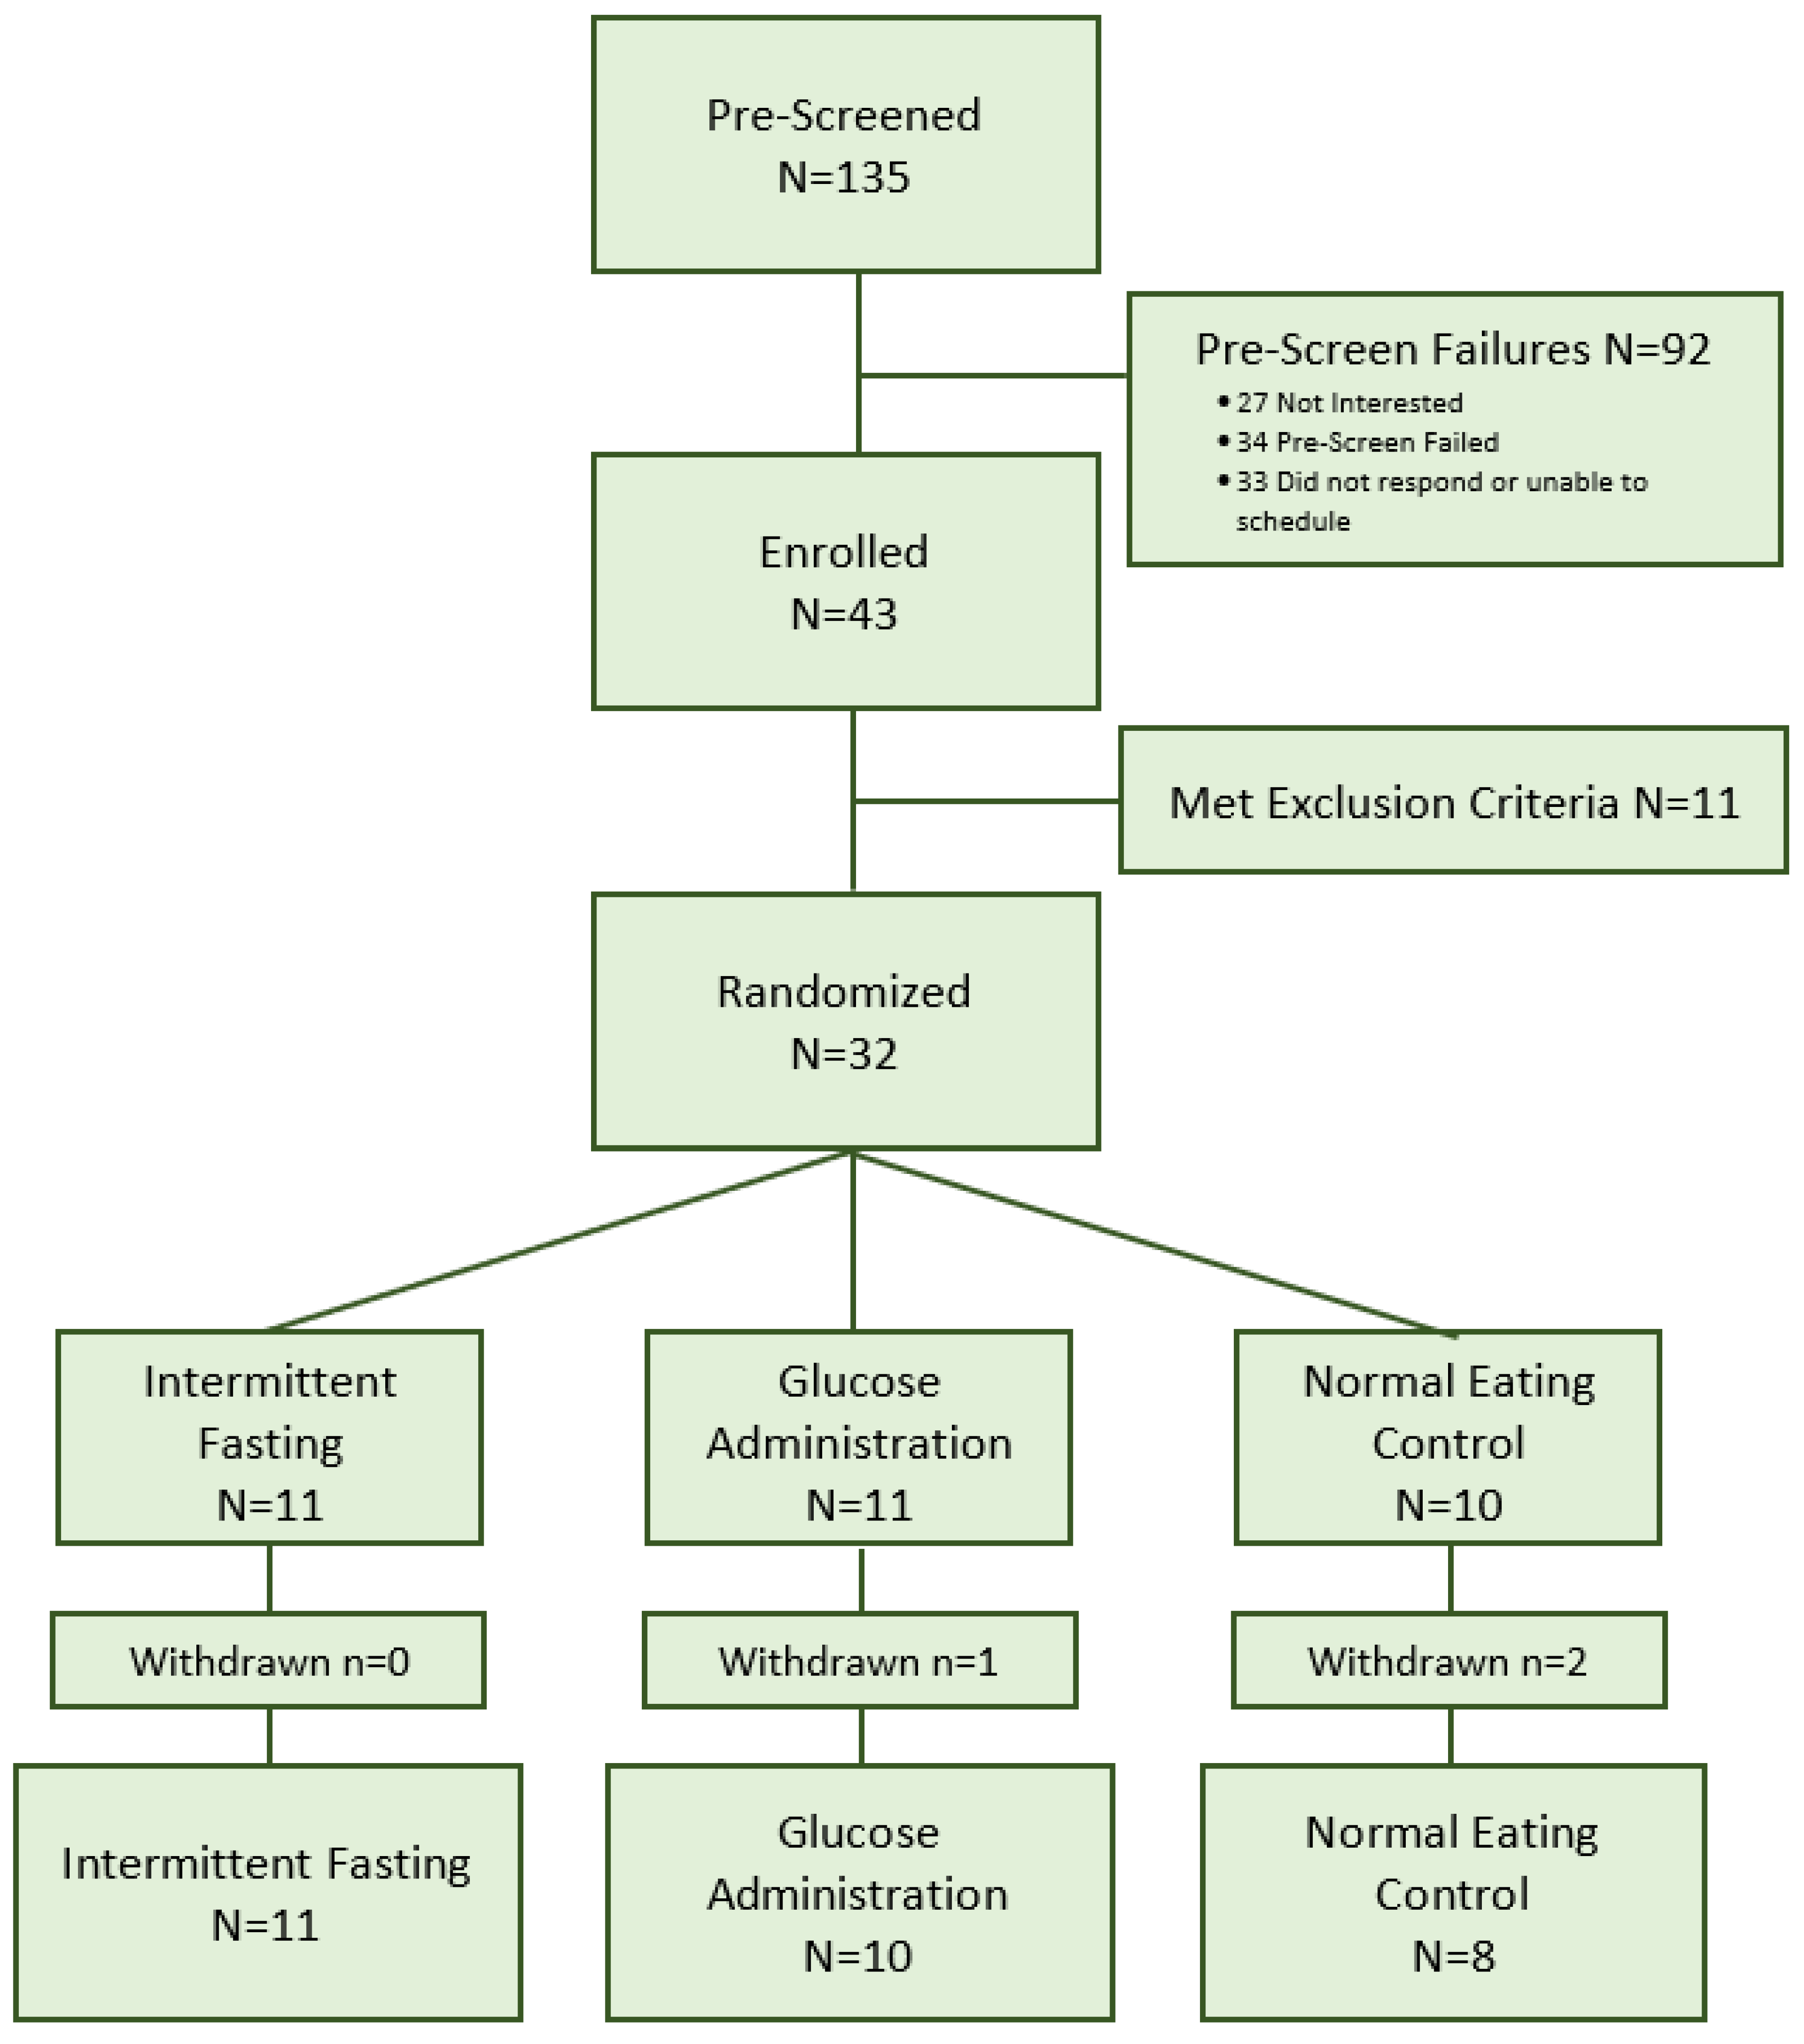
3.1. Recruitment
3.2. Randomization
3.3. Retention
3.4. Adherence
3.4.1. Adherence to Intervention
3.4.2. Adherence to Protocol
3.5. Acceptability
4. Discussion
4.1. Feasibility
4.2. Adherence
4.3. Limitations, Implications, and Future Directions
Author Contributions
Funding
Institutional Review Board Statement
Informed Consent Statement
Acknowledgments
Conflicts of Interest
References
- Dominick, C.H.; Blyth, F.M.; Nicholas, M.K. Unpacking the burden: Understanding the relationships between chronic pain and comorbidity in the general population. Pain 2012, 153, 293–304. [Google Scholar] [CrossRef]
- Gatchel, R.J. Comorbidity of Chronic Pain and Mental Health Disorders: The Biopsychosocial Perspective. Am. Psychol. 2004, 59, 795–805. [Google Scholar] [CrossRef] [PubMed]
- Van Hecke, O.; Torrance, N.; Smith, B.H. Chronic pain epidemiology and its clinical relevance. Br. J. Anaesth. 2013, 111, 13–18. [Google Scholar] [CrossRef] [PubMed]
- Macfarlane, G.J.; Barnish, M.S.; Jones, G.T. Persons with chronic widespread pain experience excess mortality: Longitudinal results from UK Biobank and meta-analysis. Ann. Rheum. Dis. 2017, 76, 1815–1822. [Google Scholar] [CrossRef] [PubMed]
- Veronese, N.; Cereda, E.; Maggi, S.; Luchini, C.; Solmi, M.; Smith, T.; Denkinger, M.; Hurley, M.; Thompson, T.; Manzato, E.; et al. Osteoarthritis and mortality: A prospective cohort study and systematic review with meta-analysis. Semin. Arthritis Rheum. 2016, 46, 160–167. [Google Scholar] [CrossRef] [PubMed]
- Larsson, C.; Hansson, E.E.; Sundquist, K.; Jakobsson, U. Chronic pain in older adults: Prevalence, incidence, and risk factors. Scand. J. Rheumatol. 2017, 46, 317–325. [Google Scholar] [CrossRef] [PubMed]
- Hunter, D.J.; March, L.; Chew, M. Osteoarthritis in 2020 and beyond: A Lancet Commission. Lancet 2020, 396, 1711–1712. [Google Scholar] [CrossRef]
- Neogi, T.; Guermazi, A.; Roemer, F.; Nevitt, M.C.; Scholz, J.; Arendt-Nielsen, L.; Woolf, C.; Niu, J.; Bradley, L.A.; Quinn, E.; et al. Association of Joint Inflammation With Pain Sensitization in Knee Osteoarthritis: The Multicenter Osteoarthritis Study. Arthritis Rheumatol. 2016, 68, 654–661. [Google Scholar] [CrossRef]
- Greene, M.A.; Loeser, R.F. Aging-related inflammation in osteoarthritis. Osteoarthr. Cartil. 2015, 23, 1966–1971. [Google Scholar] [CrossRef]
- Deshpande, B.R.; Katz, J.N.; Solomon, D.H.; Yelin, E.H.; Hunter, D.J.; Messier, S.P.; Suter, L.G.; Losina, E. Number of Persons with Symptomatic Knee Osteoarthritis in the US: Impact of Race and Ethnicity, Age, Sex, and Obesity. Arthritis Care Res. 2016, 68, 1743–1750. [Google Scholar] [CrossRef]
- Zhang, Y.; Jordan, J.M. Epidemiology of osteoarthritis. Clin. Geriatr. Med. 2010, 26, 355–369. [Google Scholar] [CrossRef] [PubMed]
- Alshelh, Z.; Marciszewski, K.K.; Akhter, R.; Di Pietro, F.; Mills, E.P.; Vickers, E.R.; Peck, C.C.; Murray, G.M.; Henderson, L.A. Disruption of default mode network dynamics in acute and chronic pain states. Neuroimage Clin. 2018, 17, 222–231. [Google Scholar] [CrossRef]
- Apkarian, A.V. The brain in chronic pain: Clinical implications. Pain Manag. 2011, 1, 577–586. [Google Scholar] [CrossRef]
- Baliki, M.N.; Apkarian, A.V. Nociception, Pain, Negative Moods, and Behavior Selection. Neuron 2015, 87, 474–491. [Google Scholar] [CrossRef] [PubMed]
- Barroso, J.; Vigotsky, A.D.; Branco, P.; Reis, A.M.; Schnitzer, T.J.; Galhardo, V.; Apkarian, A.V. Brain gray matter abnormalities in osteoarthritis pain: A cross-sectional evaluation. Pain 2020, 169, 2167–2178. [Google Scholar] [CrossRef] [PubMed]
- Huang, S.; Wakaizumi, K.; Wu, B.; Shen, B.; Wu, B.; Fan, L.; Baliki, M.N.; Zhan, G.; Apkarian, A.V.; Huang, L. Whole-brain functional network disruption in chronic pain with disk herniation. Pain 2019, 160, 2829–2840. [Google Scholar] [CrossRef] [PubMed]
- Mansour, A.; Baria, A.T.; Tetreault, P.; Vachon-Presseau, E.; Chang, P.C.; Huang, L.; Apkarian, A.V.; Baliki, M.N. Global disruption of degree rank order: A hallmark of chronic pain. Sci. Rep. 2016, 6, 1–17. [Google Scholar] [CrossRef]
- Pelletier, R.; Higgins, J.; Bourbonnais, D. Is neuroplasticity in the central nervous system the missing link to our understanding of chronic musculoskeletal disorders? BMC Musculoskelet. Disord. 2015, 16, 1–13. [Google Scholar] [CrossRef]
- Arendt-Nielsen, L.; Nie, H.; Laursen, M.B.; Laursen, B.S.; Madeleine, P.; Simonsen, O.H.; Graven-Nielsen, T. Sensitization in patients with painful knee osteoarthritis. Pain 2010, 149, 573–581. [Google Scholar] [CrossRef]
- Tatu, K.; Costa, T.; Nani, A.; Diano, M.; Quarta, D.G.; Duca, S.; Apkarian, A.V.; Fox, P.T.; Cauda, F. How do morphological alterations caused by chronic pain distribute across the brain? A meta-analytic co-alteration study. Neuroimage Clin. 2018, 18, 15–30. [Google Scholar] [CrossRef]
- Baliki, M.N.; Geha, P.Y.; Apkarian, A.V.; Chialvo, D.R. Beyond feeling: Chronic pain hurts the brain, disrupting the default-mode network dynamics. J. Neurosci. 2008, 28, 1398–1403. [Google Scholar] [CrossRef] [PubMed]
- Letzen, J.E.; Robinson, M.E. Negative mood influences default mode network functional connectivity in patients with chronic low back pain: Implications for functional neuroimaging biomarkers. Pain 2017, 158, 48–57. [Google Scholar] [CrossRef] [PubMed]
- Woolf, C.J. Central sensitization: Implications for the diagnosis and treatment of pain. Pain 2011, 152, S2–S15. [Google Scholar] [CrossRef] [PubMed]
- Davis, K.D.; Moayedi, M. Central mechanisms of pain revealed through functional and structural MRI. J. Neuroimmune Pharmacol. 2013, 8, 518–534. [Google Scholar] [CrossRef] [PubMed]
- Apkarian, A.V.; Reckziegel, D. Peripheral and central viewpoints of chronic pain, and translational implications. Neurosci. Lett. 2019, 702, 3–5. [Google Scholar] [CrossRef]
- Covey, W.C.; Ignatowski, T.A.; Knight, P.R.; Spengler, R.N. Brain-derived TNFalpha: Involvement in neuroplastic changes implicated in the conscious perception of persistent pain. Brain Res. 2000, 859, 113–122. [Google Scholar] [CrossRef]
- Seminowicz, D.A.; Shpaner, M.; Keaser, M.L.; Krauthamer, G.M.; Mantegna, J.; Dumas, J.A.; Newhouse, P.A.; Filippi, C.G.; Keefe, F.J.; Naylor, M.R. Cognitive-behavioral therapy increases prefrontal cortex gray matter in patients with chronic pain. J. Pain 2013, 14, 1573–1584. [Google Scholar] [CrossRef] [PubMed]
- Gwilym, S.E.; Filippini, N.; Douaud, G.; Carr, A.J.; Tracey, I. Thalamic atrophy associated with painful osteoarthritis of the hip is reversible after arthroplasty: A longitudinal voxel-based morphometric study. Arthritis Rheum. 2010, 62, 2930–2940. [Google Scholar] [CrossRef] [PubMed]
- Lewis, G.N.; Parker, R.S.; Sharma, S.; Rice, D.A.; McNair, P.J. Structural Brain Alterations Before and After Total Knee Arthroplasty: A Longitudinal Assessment. Pain Med. 2018, 19, 2166–2176. [Google Scholar] [CrossRef]
- Rodriguez-Raecke, R.; Niemeier, A.; Ihle, K.; Ruether, W.; May, A. Structural brain changes in chronic pain reflect probably neither damage nor atrophy. PLoS ONE 2013, 8, e54475. [Google Scholar] [CrossRef]
- Glazachev, O.S.; Zapara, M.A.; Dudnik, E.N.; Samartseva, V.G.; Susta, D. Repeated hyperthermia exposure increases circulating Brain Derived Neurotrophic Factor levels which is associated with improved quality of life, and reduced anxiety: A randomized controlled trial. J. Therm. Biol. 2020, 89, 102482. [Google Scholar] [CrossRef] [PubMed]
- Fuller, D.D.; Mitchell, G.S. Respiratory neuroplasticity—Overview, significance and future directions. Exp. Neurol. 2017, 287, 144–152. [Google Scholar] [CrossRef] [PubMed]
- Navarrete-Opazo, A.; Mitchell, G.S. Therapeutic potential of intermittent hypoxia: A matter of dose. Am. J. Physiol. Regul. Integr. Comp. Physiol. 2014, 307, R1181–R1197. [Google Scholar] [CrossRef] [PubMed]
- Mateika, J.H.; Komnenov, D. Intermittent hypoxia initiated plasticity in humans: A multipronged therapeutic approach to treat sleep apnea and overlapping co-morbidities. Exp. Neurol. 2017, 287, 113–129. [Google Scholar] [CrossRef]
- Hensch, T.K.; Bilimoria, P.M. Re-opening Windows: Manipulating Critical Periods for Brain Development. Cerebrum Dana Forum Brain Sci. 2012, 2012, 11. [Google Scholar]
- Sibille, K.T.; Bartsch, F.; Reddy, D.; Fillingim, R.B.; Keil, A. Increasing Neuroplasticity to Bolster Chronic Pain Treatment: A Role for Intermittent Fasting and Glucose Administration? J. Pain 2016, 17, 275–281. [Google Scholar] [CrossRef]
- Mattson, M.P.; Moehl, K.; Ghena, N.; Schmaedick, M.; Cheng, A. Intermittent metabolic switching, neuroplasticity and brain health. Nat. Rev. Neurosci. 2018, 19, 63–80. [Google Scholar] [CrossRef] [PubMed]
- Malinowski, B.; Zalewska, K.; Wesierska, A.; Sokolowska, M.M.; Socha, M.; Liczner, G.; Pawlak-Osinska, K.; Wicinski, M. Intermittent Fasting in Cardiovascular Disorders—An Overview. Nutrients 2019, 11, 673. [Google Scholar] [CrossRef]
- Raefsky, S.M.; Mattson, M.P. Adaptive responses of neuronal mitochondria to bioenergetic challenges: Roles in neuroplasticity and disease resistance. Free Radic. Biol. Med. 2017, 102, 203–216. [Google Scholar] [CrossRef]
- Balasubramanian, P.; DelFavero, J.; Ungvari, A.; Papp, M.; Tarantini, A.; Price, N.; de Cabo, R.; Tarantini, S. Time-restricted feeding (TRF) for prevention of age-related vascular cognitive impairment and dementia. Ageing Res. Rev. 2020, 64, 101189. [Google Scholar] [CrossRef]
- de Cabo, R.; Mattson, M.P. Effects of Intermittent Fasting on Health, Aging, and Disease. N. Engl. J. Med. 2019, 381, 2541–2551. [Google Scholar] [CrossRef]
- Patterson, R.E.; Laughlin, G.A.; LaCroix, A.Z.; Hartman, S.J.; Natarajan, L.; Senger, C.M.; Martinez, M.E.; Villasenor, A.; Sears, D.D.; Marinac, C.R.; et al. Intermittent Fasting and Human Metabolic Health. J. Acad Nutr. Diet. 2015, 115, 1203–1212. [Google Scholar] [CrossRef]
- Anton, S.D.; Moehl, K.; Donahoo, W.T.; Marosi, K.; Lee, S.A.; Mainous, A.G., 3rd.; Leeuwenburgh, C.; Mattson, M.P. Flipping the Metabolic Switch: Understanding and Applying the Health Benefits of Fasting. Obesity 2018, 26, 254–268. [Google Scholar] [CrossRef] [PubMed]
- Lee, S.A.; Sypniewski, C.; Bensadon, B.A.; McLaren, C.; Donahoo, W.T.; Sibille, K.T.; Anton, S. Determinants of Adherence in Time-Restricted Feeding in Older Adults: Lessons from a Pilot Study. Nutrients 2020, 12, 874. [Google Scholar] [CrossRef] [PubMed]
- Ooi, T.C.; Meramat, A.; Rajab, N.F.; Shahar, S.; Ismail, I.S.; Azam, A.A.; Sharif, R. Intermittent Fasting Enhanced the Cognitive Function in Older Adults with Mild Cognitive Impairment by Inducing Biochemical and Metabolic changes: A 3-Year Progressive Study. Nutrients 2020, 12, 2644. [Google Scholar] [CrossRef] [PubMed]
- Dragan, S.; Serban, M.C.; Damian, G.; Buleu, F.; Valcovici, M.; Christodorescu, R. Dietary Patterns and Interventions to Alleviate Chronic Pain. Nutrients 2020, 12, 2510. [Google Scholar] [CrossRef] [PubMed]
- Messier, S.P.; Mihalko, S.L.; Legault, C.; Miller, G.D.; Nicklas, B.J.; DeVita, P.; Beavers, D.P.; Hunter, D.J.; Lyles, M.F.; Eckstein, F.; et al. Effects of intensive diet and exercise on knee joint loads, inflammation, and clinical outcomes among overweight and obese adults with knee osteoarthritis: The IDEA randomized clinical trial. JAMA 2013, 310, 1263–1273. [Google Scholar] [CrossRef]
- Lapp, J.E. Effects of Glycemic Alterations and Noun Imagery on the Learning of Paired Associates. J. Learn. Disabil. 1981, 14, 35–38. [Google Scholar] [CrossRef]
- Messier, C. Glucose improvement of memory: A review. Eur. J. Pharmacol. 2004, 490, 33–57. [Google Scholar] [CrossRef]
- Smith, M.A.; Riby, L.M.; Eekelen, J.A.; Foster, J.K. Glucose enhancement of human memory: A comprehensive research review of the glucose memory facilitation effect. Neurosci. Biobehav. Rev. 2011, 35, 770–783. [Google Scholar] [CrossRef]
- Elbert, T.; Candia, V.; Altenmüller, E.; Rau, H.; Sterr, A.; Rockstroh, B.; Pantev, C.; Taub, E. Alteration of digital representations in somatosensory cortex in focal hand dystonia. Neuroreport 1998, 9, 3571–3575. [Google Scholar] [CrossRef]
- Kwekkeboom, K.L.; Bratzke, L.C. A Systematic Review of Relaxation, Meditation, and Guided Imagery Strategies for Symptom Management in Heart Failure. J. Cardiovasc. Nurs. 2016, 31, 457–468. [Google Scholar] [CrossRef] [PubMed]
- Case, L.K.; Jackson, P.; Kinkel, R.; Mills, P.J. Guided Imagery Improves Mood, Fatigue, and Quality of Life in Individuals with Multiple Sclerosis: An Exploratory Efficacy Trial of Healing Light Guided Imagery. J. Evid. Based Integr. Med. 2018, 23. [Google Scholar] [CrossRef]
- Berna, C.; Tracey, I.; Holmes, E.A. How a Better Understanding of Spontaneous Mental Imagery Linked to Pain Could Enhance Imagery-Based Therapy in Chronic Pain. J. Exp. Psychopathol. 2012, 3, 258–273. [Google Scholar] [CrossRef]
- Jensen, K.B.; Berna, C.; Loggia, M.L.; Wasan, A.D.; Edwards, R.R.; Gollub, R.L. The use of functional neuroimaging to evaluate psychological and other non-pharmacological treatments for clinical pain. Neurosci. Lett. 2012, 520, 156–164. [Google Scholar] [CrossRef] [PubMed]
- Pincus, D.; Sheikh, A. Imagery for Pain Relief: A Scientifically Grounded Guidebook for Clinicians; Routledge: New York, NY, USA, 2010. [Google Scholar]
- Whitehead, A.L.; Sully, B.G.; Campbell, M.J. Pilot and feasibility studies: Is there a difference from each other and from a randomised controlled trial? Contemp. Clin. Trials 2014, 38, 130–133. [Google Scholar] [CrossRef] [PubMed]
- Schulz, K.F.; Altman, D.G.; Moher, D.; The CONSORT Group. CONSORT 2010 Statement: Updated guidelines for reporting parallel group randomised trials. Trials 2010, 11, 1–8. [Google Scholar] [CrossRef]
- Horne, B.D.; Muhlestein, J.B.; Anderson, J.L. Health effects of intermittent fasting: Hormesis or harm? A systematic review. Am. J. Clin. Nutr. 2015, 102, 464–470. [Google Scholar] [CrossRef]
- Horne, B.D.; Muhlestein, J.B.; Lappé, D.L.; May, H.T.; Carlquist, J.F.; Galenko, O.; Brunisholz, K.D.; Anderson, J.L. Randomized cross-over trial of short-term water-only fasting: Metabolic and cardiovascular consequences. Nutr. Metab. Cardiovasc. Dis. 2013, 23, 1050–1057. [Google Scholar] [CrossRef]
- Riby, L.M.; Meikle, A.; Glover, C. The effects of age, glucose ingestion and gluco-regulatory control on episodic memory. Age Ageing 2004, 33, 483–487. [Google Scholar] [CrossRef]
- Parsons, M.W.; Gold, P.E. Glucose enhancement of memory in elderly humans: An inverted-U dose-response curve. Neurobiol. Aging 1992, 13, 401–404. [Google Scholar] [CrossRef]
- Turk, D.; Winter, F. The Pain Survival Guide, How to Reclaim Your Life; American Psychological Association: Washington, DC, USA, 2009. [Google Scholar]
- Bradley, M.M.; Lang, P.J. Affective Norms for English Words (ANEW): Instruction Manual and Affective Ratings; Technical Report No. C-1; University of Florida: Gainesville, FL, USA, 1999. [Google Scholar]
- Bellamy, N.; Buchanan, W.W.; Goldsmith, C.H.; Campbell, J.; Stitt, L.W. Validation study of WOMAC: A health status instrument for measuring clinically important patient relevant outcomes to antirheumatic drug therapy in patients with osteoarthritis of the hip or knee. J. Rheumatol. 1988, 15, 1833–1840. [Google Scholar]
- Von Korff, M.; Ormel, J.; Keefe, F.J.; Dworkin, S.F. Grading the severity of chronic pain. Pain 1992, 50, 133–149. [Google Scholar] [CrossRef]
- Sibille, K.T.; Chen, H.; Bartley, E.J.; Riley, J., 3rd.; Glover, T.L.; King, C.D.; Zhang, H.; Cruz-Almeida, Y.; Goodin, B.R.; Sotolongo, A.; et al. Accelerated aging in adults with knee osteoarthritis pain: Consideration for frequency, intensity, time, and total pain sites. Pain Rep. 2017, 2, e591. [Google Scholar] [CrossRef]
- Sibille, K.T.; Steingrimsdottir, O.A.; Fillingim, R.B.; Stubhaug, A.; Schirmer, H.; Chen, H.; McEwen, B.S.; Nielsen, C.S. Investigating the Burden of Chronic Pain: An Inflammatory and Metabolic Composite. Pain Res. Manag. 2016, 2016, 7657329. [Google Scholar] [CrossRef]
- Tanner, J.J.; Hanchate, S.; Price, C.; Garvan, C.; Lai, S.; Staud, R.; Deshpande, H.; Deutsch, G.; Goodin, B.; Fillingim, R.B.; et al. Relationships between chronic pain stage, cognition, temporal lobe cortex, and sociodemographic variables. J. Alzheimer’s Dis. 2021, 80, 1539–1551. [Google Scholar] [CrossRef]
- Watson, D.; Clark, L.A.; Tellegen, A. Development and validation of brief measures of positive and negative affect: The PANAS scales. J. Pers. Soc. Psychol. 1988, 54, 1063–1070. [Google Scholar] [CrossRef] [PubMed]
- Cohen, S.; Kamarck, T.; Mermelstein, R. A Global Measure of Perceived Stress. J. Health Soc. Behav. 1983, 24, 385–396. [Google Scholar] [CrossRef]
- Tanner, B.A. Validity of global physical and emotional SUDS. Appl. Psychophysiol. Biofeedback 2012, 37, 31–34. [Google Scholar] [CrossRef]
- Kim, D.; Bae, H.; Park, Y.C. Validity of the subjective units of disturbance scale in EMDR. J. EMDR Pract. Res. 2008, 2, 57–62. [Google Scholar] [CrossRef]
- Brandt, J. The Hopkins Verbal Learning Test: Development of a new memory test with six equivalent forms. Clin. Neuropsychol. 1991, 5, 125–142. [Google Scholar] [CrossRef]
- Corrigan, J.D.; Hinkeldey, N.S. Relationships between parts A and B of the Trail Making Test. J. Clin. Psychol. 1987, 43, 402–409. [Google Scholar] [CrossRef]
- Gaudino, E.A.; Geisler, M.W.; Squires, N.K. Construct validity in the Trail Making Test: What makes Part B harder? J. Clin. Exp. Neuropsychol. 1995, 17, 529–535. [Google Scholar] [CrossRef] [PubMed]
- Reitan, R.M. Validity of the Trail Making Test as an Indicator of Organic Brain Damage. Percept. Mot. Ski. 1958, 8, 271–276. [Google Scholar] [CrossRef]
- Rocha, H.A.; Marks, J.; Woods, A.J.; Staud, R.; Sibille, K.; Keil, A. Re-test reliability and internal consistency of EEG alpha-band oscillations in older adults with chronic knee pain. Clin. Neurophysiol. 2020, 131, 2630–2640. [Google Scholar] [CrossRef]
- Buysse, D.J.; Reynolds, C.F., 3rd.; Monk, T.H.; Berman, S.R.; Kupfer, D.J. The Pittsburgh Sleep Quality Index: A new instrument for psychiatric practice and research. Psychiatry Res. 1989, 28, 193–213. [Google Scholar] [CrossRef]
- Radloff, L.S. The CES-D Scale: A Self-Report Depression Scale for Research in the General Population. Appl. Psychol. Meas. 1977, 1, 385–401. [Google Scholar] [CrossRef]
- Schalet, B.D.; Pilkonis, P.A.; Yu, L.; Dodds, N.; Johnston, K.L.; Yount, S.; Riley, W.; Cella, D. Clinical validity of PROMIS Depression, Anxiety, and Anger across diverse clinical samples. J. Clin. Epidemiol. 2016, 73, 119–127. [Google Scholar] [CrossRef]
- Eldridge, S.M.; Lancaster, G.A.; Campbell, M.J.; Thabane, L.; Hopewell, S.; Coleman, C.L.; Bond, C.M. Defining Feasibility and Pilot Studies in Preparation for Randomised Controlled Trials: Development of a Conceptual Framework. PLoS ONE 2016, 11, e0150205. [Google Scholar] [CrossRef]
- Leon, A.C.; Davis, L.L.; Kraemer, H.C. The role and interpretation of pilot studies in clinical research. J. Psychiatr. Res. 2011, 45, 626–629. [Google Scholar] [CrossRef]
- National Center for Complementary and Integrative Health. Pilot Studies: Common Uses and Misuses. Available online: https://www.nccih.nih.gov/grants/pilot-studies-common-uses-and-misuses (accessed on 31 August 2020).
- Matthew, T.K.; Tadi, P. Blood Glucose Monitoring; StatPearls Publishing: Treasure Island, FL, USA, 2020. [Google Scholar]
- Heilbronn, L.K.; Smith, S.R.; Martin, C.K.; Anton, S.D.; Ravussin, E. Alternate-day fasting in nonobese subjects: Effects on body weight, body composition, and energy metabolism. Am. J. Clin. Nutr. 2005, 81, 69–73. [Google Scholar] [CrossRef]
- Stockman, M.-C.; Thomas, D.; Burke, J.; Apovian, C.M. Intermittent Fasting: Is the Wait Worth the Weight? Curr. Obes. Rep. 2018, 7, 172–185. [Google Scholar] [CrossRef] [PubMed]
- Epel, E.S. The geroscience agenda: Toxic stress, hormetic stress, and the rate of aging. Ageing Res. Rev. 2020, 63, 101167. [Google Scholar] [CrossRef] [PubMed]
- Chen, L.; Michalsen, A. Management of chronic pain using complementary and integrative medicine. BMJ 2017, 357. [Google Scholar] [CrossRef] [PubMed]


| Session 1 | Session 2 | Session 3 | Session 4 | |
|---|---|---|---|---|
| Screening and Baseline Measures | ||||
| Demographics | X | |||
| MMSE | X | |||
| Health History | X | |||
| Cardiovascular Measures | ||||
| Heart Rate | X | X | X | X |
| Mean Arterial Pressure | X | X | X | X |
| Blood Pressure | X | X | X | X |
| Anthropometric Measures | ||||
| Head Circumference (EEG) | X | |||
| Height/Weight | X | |||
| Waist/Hip Circumference | X | |||
| Clinical Pain Measures | ||||
| WOMAC | X | X | ||
| GCPS | X | |||
| Chronic Pain Stage-Knee | X | |||
| Experimental Pain Measures | ||||
| Punctate Stimuli | X | X | ||
| Pressure Stimuli | X | X | ||
| Affect, Mood, Stress Measures | ||||
| PANAS | X(Trait) | X(State) | X(State) | X(State) |
| PSS | X | X | ||
| SUDS | X | X | X | X |
| Cognitive Measures | ||||
| HVLT | X | X | ||
| Trails A and B | X | X | ||
| Biological Measures | ||||
| Glucose Blood Draw | X | X | X | |
| Glucose Finger Stick | X | |||
| EEG Measures | ||||
| Alpha power | X | X | ||
| Alpha Block | X | X | ||
| SST | X | X | ||
| Additional Explanatory Variables | ||||
| PSQI | X | |||
| CESD | X | X | ||
| PROMIS Anxiety and Depression | X | X |
| Variable | Intermittent Fasting (n = 11) | Glucose Administration (n = 11) | Normal Eating Control (n = 10) | Total (n = 32) |
|---|---|---|---|---|
| Age, years, mean (SD) | 65.15 (6.73) | 62.52 (9.04) | 63.96 (9.81) | 63.88 (8.37) |
| Sex, female n (%) | 4 (36%) | 4 (36%) | 6 (60%) | 14 (44%) |
| Ethnicity, Hispanic n (%) | 1 (9%) | 1 (9%) | 0 (0%) | 2 (6%) |
| Race, n (%) | ||||
| White | 8 (73%) | 7 (64%) | 9 (90%) | 24 (75%) |
| Non-White | 3 (27%) | 4 (45%) | 1 (10%) | 8 (25%) |
| Education, n (%) | ||||
| High school degree | 4 (36%) | 2 (18%) | 3 (30%) | 9 (28%) |
| Two-year college degree | 3 (27%) | 3 (27%) | 1 (10%) | 7 (22%) |
| Four-year college degree | 4 (36%) | 5 (45%) | 5 (50%) | 14 (44%) |
| Doctoral degree | 0 (0%) | 1 (9%) | 1 (10%) | 2 (6%) |
| Marital status, n (%) | ||||
| Married | 4 (36%) | 3 (27%) | 5 (50%) | 12 (38%) |
| Widowed | 0 (0%) | 1 (9%) | 0 (0%) | 1 (3%) |
| Divorced | 2 (18%) | 3 (27%) | 3 (30%) | 8 (25%) |
| Never married | 5 (45%) | 2 (18%) | 2 (20%) | 9 (28%) |
| Living with partner | 0 (0%) | 2 (18%) | 0 (0%) | 2 (6%) |
| Body mass index (BMI), kg/m2, mean (SD) | 30.58 (5.61) | 32.37 (11.78) | 33.40 (11.93) | 32.08 (9.88) |
| Baseline glucose level, mean (SD) | 86.91 (6.85) | 88.36 (8.35) | 88.80 (4.32) | 88.00 (6.61) |
| Session 2 | Session 3 | Session 4 | ||||
|---|---|---|---|---|---|---|
| Session Mean (SD) | T1 | T2 | T1 | T2 | T1 | T2 |
| Intermittent Fasting | 87.5 (4.9) | 85.6 (7.1) | 93.1 (11.2) | 95.6 (11.6) | 87.7 (7.6) | 86.2 (7.3) |
| Glucose Administration | 86.2 (9.7) | 132.7 (23.1) | 95.1 (11.3) | 161.5 (25.2) | 87.2 (12.1) | 146.3 (22.8) |
| Normal Eating Control | 87.7 (14.4) | 90.1 (8.0) | 112.2 (24.7) | 107.3 (9.5) | 91.0 (10.2) | 86.5 (11.8) |
| Variable | Intermittent Fasting (n = 11) Mean (SD) | Glucose Administration (n = 11) Mean (SD) | Normal Eating Control (n = 10) Mean (SD) | Total (n = 32) | p-Value |
|---|---|---|---|---|---|
| Clinical Pain | |||||
| WOMAC Pain | 4.91 (2.21) | 8.09 (2.12) | 6.60 (4.06) | 6.53 (3.10) | 0.046 |
| WOMAC Stiffness | 2.55 (1.37) | 3.64 (1.21) | 3.30 (2.06) | 3.16 (1.59) | 0.28 |
| WOMAC Physical Function | 17.27 (7.76) | 27.73 (9.63) | 21.50 (14.66) | 22.19 (11.46) | 0.049 |
| WOMAC Total | 24.73 (9.98) | 39.45 (12.31) | 31.40 (19.60) | 31.87 (15.20) | 0.047 |
| GCPS Intensity | 50.30 (16.50) | 55.45 (15.93) | 45.67 (24.09) | 50.63 (18.83) | 0.65 |
| GCPS Disability | 40.61 (24.53) | 43.64 (25.19) | 48.67 (34.51) | 44.17 (37.49) | 0.87 |
| Chronic Pain Stage | 1.64 (1.36) | 2.45 (1.13) | 1.70 (0.95) | 1.94 (1.19) | 0.16 |
| Experimental Pain | |||||
| Pressure Pain Threshold (kg) | |||||
| Forearm | 2.99 (1.28) | 3.03 (1.05) | 2.70 (0.76) | 2.91 (1.04) | 0.86 |
| Lateral Knee | 4.42 (1.18) | 4.58 (1.20) | 4.29 (1.32) | 4.44 (1.20) | 0.76 |
| Medial Knee | 4.09 (1.45) | 4.58 (1.20) | 4.16 (1.45) | 4.10 (1.39) | 0.99 |
| Trapezius | 4.76 (1.51) | 4.59 (1.19) | 3.54 (0.71) | 4.32 (1.28) | 0.08 |
| Mechanical/Punctate Pain Rating (0–100 scale) | |||||
| Hand Single | 7.23 (8.98) | 9.27 (5.41) | 6.85 (6.03) | 7.81 (6.87) | 0.35 |
| Hand Series | 12.82 (13.01) | 24.90 (18.43) | 12.6 (11.73) | 16.9 (15.45) | 0.13 |
| Knee Single | 11.41 (13.08) | 24.32 (19.75) | 17.35 (17.51) | 17.7 (17.31) | 0.17 |
| Knee Series | 21.86 (15.67) | 42.18 (26.36) | 32.85 (20.99) | 32.28 (22.47) | 0.10 |
| Affect and Stress | |||||
| Positive Affect | 38.04 (5.20) | 37.82 (5.74) | 37.10 (5.04) | 37.69 (5.20) | 0.96 |
| Negative Affect | 12.46 (3.42) | 13.00 (2.49) | 13.40 (4.70) | 13.25 (3.42) | 0.92 |
| PSS | 12.55 (3.93) | 11.82 (4.73) | 11.50 (6.10) | 11.97 (4.82) | 0.78 |
| Cognitive | |||||
| HVLT Delayed | 47.55 (12.01) | 46.73 (7.67) | 52.78 (7.10) | 48.77 (9.42) | 0.35 |
| HVLT Discrimination | 48.73 (9.52) | 44.36 (10.86) | 54.11 (8.34) | 48.74 (10.18) | 0.07 |
| HVLT Recall | 49.55 (13.03) | 45.73 (9.33) | 49.67 (16.10) | 48.23 (12.58) | 0.55 |
| HVLT Retention | 46.91 (13.16) | 51.45 (9.03) | 52.11 (11.61) | 50.03 (11.25) | 0.73 |
| Trials A | 32.8 (11.07) | 30.82 (8.28) | 27.8 (6.70) | 30.56 (8.89) | 0.40 |
| Trails B | 91.18 (31.03) | 76.82 (26.99) | 63.0 (26.95) | 77.44 (29.85) | 0.09 |
| EEG | |||||
| Resting Alpha-Eyes Closed (SNR) | 1.65 (0.92) a | 2.26 (1.12) a | 1.68 (0.71) a | 1.87 (0.97) a | 0.13 |
| Resting Alpha-Eyes Open (SNR) | 1.31 (0.58) a | 1.62 (0.93) a | 1.25 (0.36) a | 1.40 (0.68) a | 0.34 |
| Open–Closed Alpha Blocking (difference SNR) | −0.34 (0.95) a | −0.63 (2.26) a | −0.44 (0.86) a | −0.47 (0.88) a | 0.60 |
| Somatosensory potentials (SNR; knees) | 2.23 (0.85) | 2.27 (0.87) | 2.36 (0.93) | 2.32 (0.86) | 0.97 |
| Additional Explanatory Variables | |||||
| PSQI | 10.73 (4.27) | 12.00 (2.87) a | 11.89 (3.37) a | 11.50 (3.51) | 0.70 |
| CES-D | 7.36 (4.27) | 6.27 (8.46) | 7.20 (5.87) | 6.94 (6.26) | 0.37 |
| PROMIS Depression | 12.00 (3.41) | 11.09 (3.83) | 10.50 (3.95) | 11.22 (3.66) | 0.37 |
| PROMIS Anxiety | 13.53 (2.95) | 13.64 (4.59) | 13.20 (2.82) | 13.46 (3.46) | 0.99 |
| Session 2 | Session 3 | Session 4 | ||||
|---|---|---|---|---|---|---|
| Mean (SD) | T1 | T2 | T1 | T2 | T1 | T2 |
| Intermittent Fasting | 1.45 (0.82) | 0.73 (0.65) | 1.27 (0.79) | 0.73 (0.79) | 2.36 (1.50) | 1.45 (1.44) |
| Glucose Administration | 1.30 (0.82) | 0.80 (0.92) | 1.50 (0.71) | 0.30 (0.48) | 1.10 (0.32) | 0.70 (0.48) |
| Normal Eating Control | 1.44 (0.73) | 0.44 (0.73) | 1.67 (0.71) | 0.38 (0.52) | 1.25 (0.46) | 1.13 (0.64) |
| Intermittent Fasting | ||
| Mean (SD) 1 = Strongly Disagree, 3 = Neither, 5 = Strongly Agree | Median (Minimum–Maximum) | |
| Completing the 16 h fast was difficult for me | 2.45 (1.29) | 3.00 (1–4) |
| I would complete a 16 h fast at least two days a week if it improved my overall health | 4.27 (1.27) | 5.00 (1–5) |
| I noticed I had less pain when I fasted | 2.64 (0.51) | 3.00 (2–3) |
| I noticed that I was less irritable when I fasted | 2.82 (0.87) | 3.00 (1–4) |
| Fasting made tasks at my work, school or at home more difficult | 2.27 (1.01) | 2.00 (1–4) |
| I had more energy than normal on fasting days | 2.64 (0.92) | 3.00 (1–4) |
| I had difficulty falling asleep, staying asleep, or waking up on nights following a fasting day | 2.18 (1.08) | 2.00 (1–5) |
| Glucose Administration | ||
| Mean (SD) 1 = Strongly Disagree, 3 = Neither, 5 = Strongly Agree | Median (Minimum–Maximum) | |
| Fasting for two hours and consuming glucose was difficult for me | 1.80 (1.03) | 1.50 (1–4) |
| I would consume glucose and complete a two hour fast once a week if it improved my overall health | 4.60 (0.52) | 5.00 (4–5) |
| I noticed I had less pain while participating in this study | 2.50 (0.85) | 2.50 (1–4) |
| I noticed that I was less irritable over the last week | 3.30 (0.82) | 3.00 (2–5) |
| Participating in this study improved my ability to function better at work, school or at home | 3.30 (0.95) | 3.00 (2–5) |
| I had more energy than normal over the past week | 2.90 (0.74) | 3.00 (2–4) |
| I had difficulty falling asleep, staying asleep, or waking up on nights over the past week | 2.50 (1.27) | 2.00 (1–5) |
Publisher’s Note: MDPI stays neutral with regard to jurisdictional claims in published maps and institutional affiliations. |
© 2021 by the authors. Licensee MDPI, Basel, Switzerland. This article is an open access article distributed under the terms and conditions of the Creative Commons Attribution (CC BY) license (https://creativecommons.org/licenses/by/4.0/).
Share and Cite
Pratscher, S.; Mickle, A.M.; Marks, J.G.; Rocha, H.; Bartsch, F.; Schmidt, J.; Tejera, L.; Garcia, S.; Custodero, C.; Jean, F.; et al. Optimizing Chronic Pain Treatment with Enhanced Neuroplastic Responsiveness: A Pilot Randomized Controlled Trial. Nutrients 2021, 13, 1556. https://doi.org/10.3390/nu13051556
Pratscher S, Mickle AM, Marks JG, Rocha H, Bartsch F, Schmidt J, Tejera L, Garcia S, Custodero C, Jean F, et al. Optimizing Chronic Pain Treatment with Enhanced Neuroplastic Responsiveness: A Pilot Randomized Controlled Trial. Nutrients. 2021; 13(5):1556. https://doi.org/10.3390/nu13051556
Chicago/Turabian StylePratscher, Steven, Angela M. Mickle, John G. Marks, Harold Rocha, Felix Bartsch, Jeffrey Schmidt, Lazaro Tejera, Steven Garcia, Carlo Custodero, Federlin Jean, and et al. 2021. "Optimizing Chronic Pain Treatment with Enhanced Neuroplastic Responsiveness: A Pilot Randomized Controlled Trial" Nutrients 13, no. 5: 1556. https://doi.org/10.3390/nu13051556
APA StylePratscher, S., Mickle, A. M., Marks, J. G., Rocha, H., Bartsch, F., Schmidt, J., Tejera, L., Garcia, S., Custodero, C., Jean, F., Garvan, C., Johnson, A. J., Pop, R., Greene, A., Woods, A. J., Staud, R., Fillingim, R. B., Keil, A., & Sibille, K. T. (2021). Optimizing Chronic Pain Treatment with Enhanced Neuroplastic Responsiveness: A Pilot Randomized Controlled Trial. Nutrients, 13(5), 1556. https://doi.org/10.3390/nu13051556