Abstract
Although lifestyle-based interventions are the most effective to prevent metabolic syndrome (MetS), there is no definitive agreement on which nutritional approach is the best. The aim of the present retrospective analysis was to identify a multivariate model linking energy and macronutrient intake to the clinical features of MetS. Volunteers at risk of MetS (F = 77, M = 80) were recruited in four European centres and finally eligible for analysis. For each subject, the daily energy and nutrient intake was estimated using the EPIC questionnaire and a 24-h dietary recall, and it was compared with the dietary reference values. Then we built a predictive model for a set of clinical outcomes computing shifts from recommended intake thresholds. The use of the ridge regression, which optimises prediction performances while retaining information about the role of all the nutritional variables, allowed us to assess if a clinical outcome was manly dependent on a single nutritional variable, or if its prediction was characterised by more complex interactions between the variables. The model appeared suitable for shedding light on the complexity of nutritional variables, which effects could be not evident with univariate analysis and must be considered in the framework of the reciprocal influence of the other variables.
1. Introduction
Metabolic syndrome (MetS) is a pathologic condition including a cluster of components such as hypertension, dyslipidaemia, insulin resistance, hyperinsulinemia, glucose intolerance, and obesity, in particular central obesity [1]. MetS represents an epidemic clinical condition in countries where obesity and Western, unhealthy dietary patterns prevail, and its development is associated with both non-modifiable and modifiable risk factors as low physical activity and a poor-quality diet [2].
Currently, lifestyle-based interventions aimed at normalising body weight (BW) and controlling lipid levels, glucose sensitivity, and blood pressure are the most effective preventive approaches to MetS. Although available evidence suggests certain nutrients, foods, and dietary patterns have beneficial effects on MetS, there is no definitive agreement on which nutritional strategy is the most effective [3,4]. The association between different eating patterns and the MetS components has been evaluated in several studies [5,6]; in general, adherence to the Mediterranean or Nordic diets is associated with a lower prevalence of MetS or reduction in its components [7], while a Western dietary pattern is positively correlated with greater odds of MetS [8]. Conversely, the association between the individual macronutrient intake and the components of the MetS has been analysed in a few studies [9,10] and controversy still exists about the optimal amount and source of dietary macronutrients and their relative proportions to counteract MetS risk.
Over the past decades, an impressive body of quantitative knowledge regarding how dietary changes impact various aspects of BW and metabolism has been accumulated. Integrating this knowledge to make quantitative predictions is a formidable task given the multiple nonlinear interactions between various organ systems. Such an integrative approach is required to better connect energy and nutrient intake to normal physiology as well as to derangements that underlie conditions such as obesity, diabetes, and MetS.
To our knowledge, there are no available reports demonstrating the predictive role of the energy/macronutrient intake gaps, as assessed by the difference with the dietary reference values, on the clinical parameters related to MetS. In the present retrospective study, we correlated energy and macronutrient intake to the clinical features of MetS, with the final aim to provide an additional indication about the most important dietary contributors to clinical abnormalities related to an increased risk of MetS.
To grasp the role of each nutritional variable in the general frame of MetS pathological conditions, a model selection for various regression models between nutritional variables and clinical outcomes was performed. The analysis was inherently multivariate and allowed for the unveiling of how inadequate energy/macronutrient intake can predict clinical alterations leading to the MetS onset in a group of subjects at risk of the disease.
2. Materials and Methods
2.1. Participants
The subjects involved in the study were men and women (age 18–80 years) at risk for MetS enrolled in the randomised, double-blind, placebo-controlled, parallel intervention trial performed in the framework of the EU project PATHWAY-27. Eligible volunteers had two to four of the MetS diagnostic criteria [11], with at least one of them being elevated fasting triglycerides (TG) or low high-density lipoprotein cholesterol (HDL-C). Exclusion criteria are reported in Table S1. Volunteers were recruited in four European centres: Human Nutrition Research Centre of Auvergne (Clermont-Ferrand, France), Max Rubner-Institut (Karlsruhe, Germany), University of Leeds (Leeds, UK), and St. Orsola-Malpighi Hospital (Bologna, Italy).
The study was performed in full accordance with the ethical principles stated in the Declaration of Helsinki 1964, as revised in 2013 (Fortaleza, Brazil) [12]. Approval was obtained from the relevant local research ethics committees and additional regulatory bodies of the participating countries. All participants gave their written informed consent freely. Personal data were treated as strictly confidential by all persons involved in the trial. All data were collected and managed in a pseudonymised form, as previously reported [13]. Access to data was restricted to project partners, who receive only coded data for analysis.
At recruitment, blood pressure and anthropometric measurements (height, weight, and waist circumference, WC) were taken by trained staff as described in Bub et al. (2019) [13]. Blood was collected and analysed, as previously reported [14]. The present study addressed the intake of energy and macronutrients at baseline as possible dietary predictors of the onset of MetS. Clinical results of the intervention trial, as well as the possible predictive role of micronutrient intake, will be reported elsewhere.
2.2. Dietary Assessment
At recruitment, participants were asked to complete a validated semiquantitative food frequency questionnaire (FFQ) that was developed in the European Prospective Investigation into Cancer and Nutrition (EPIC) study [15], and a 24-h dietary recall (24hR), which is designed to assess energy and nutrient intake. The FFQ (covering a 12-month period) and the 24hR were administered by trained personnel.
Both FFQ and 24hR were completed by 281 participants (125 females and 156 males). Of the 281 dietary assessments, 66 with missing clinical information were excluded from the analysis and 215 subjects (94 females, aged 23–77 years, and 121 males, aged 24–78 years) having a complete dataset of both dietary assessment and clinical parameters were considered. After misreporting evaluation (see Section 2.2.1), 157 subjects were included in the analysis.
2.2.1. Energy and Nutrient Intake and Misreporting
Energy and nutrient intakes from all foods and beverages were calculated using national and international databases and literature information. Dietary information by 24hR was used to corroborate energy and food intakes provided by the FFQ.
Daily energy intake was derived for each subject. Daily intake of total available carbohydrates, sugars, total fat, saturated fat, and unsaturated fat was expressed as percentage of daily energy intake (%EI). Intake of protein, dietary fibre, and alcohol was reported as g per day.
Based on the protocol developed by the European Food Safety Authority (EFSA) [16], energy misreporting was assessed as the ratio of reported energy intake (EI) to estimated basal metabolic rate (EI:BMR) according to the Goldberg method [17] modified by Black [18]. The FFQs were used to estimate reported EI and BMR was calculated using the validated sex- and age-specific Oxford equations suitable for use in populations with a range of weight statuses [19]. A moderately-active physical activity level (PAL) of 1.6 was assumed for all participants [20]. Misreporters of dietary intake were identified by EI:BMR ratios <0.901 (underreporters) or >2.841 (overreporters). Fifty-eight participants were classified as misreporters (17 females and 41 males), and further statistical analysis was performed on a total of 157 subjects (77 females, aged 23–77 years, and 80 males, aged 25–76 years).
2.2.2. Comparison with Dietary Reference Values
In each subject, adequacy was assessed by comparing energy and nutrient intakes with age-/sex-specific EFSA dietary reference values (DRVs) [21] or nutrient requirements and dietary guidelines of WHO/FAO [22,23] if the former were not available. Specifically, the following daily intakes were considered adequate:
- Energy ranging between EFSA DRVs for energy calculated according to age using PAL values of 1.4 and 1.8, which approximately reflect low active (sedentary) and active lifestyles (6.8–10.1 MJ/day and 8.3–12.6 MJ/day ranges for females and males, respectively);
- Total carbohydrates ranging from 45 to 60% energy (%EI);
- Sugars (monosaccharides and disaccharides) <10%EI based on the WHO/FAO dietary recommendations;
- Dietary fibre intake ≥25 g/day;
- Protein between the average requirement (AR) and the population reference intake (PRI) of EFSA DRVs;
- Total fat ranging from 20 to 35%EI;
- Saturated fatty acid (SFAs) <10%EI according to FAO;
- Total unsaturated fatty acids (UFAs), i.e., monounsaturated fatty acids (MUFAs) plus polyunsaturated fatty acids (PUFAs) ranging from 15 to 20%EI, as calculated by difference according to FAO;
- PUFAs ranging from 6 to 11%EI according to FAO.
In addition, a moderate alcohol consumption (up to one serving per day for women and up to two servings per day for men) [24] was considered acceptable.
Differences between current intake and corresponding recommended intake (mean value of recommended range for energy, total carbohydrates, protein, total fat, and total UFAs and PUFAs; limit of adequate intake for sugars, dietary fibre, SFAs, and alcohol) were calculated. The resulting delta values were then used for elaborating on the predictive model.
2.3. Statistical Analysis
Data were stratified by gender. All clinical parameters were classified as normal (1) or abnormal (2) according to their overlap with the recognised normal ranges (Table S2). The distribution of clinical parameters was evaluated using the D’Agostino–Pearson test. Student’s t-test for normally distributed data and Mann–Whitney U test for non-normally distributed data were used to compare the general characteristics of the study population grouped by gender.
All statistical analyses were conducted using the Python programming language, using custom scripts and the sklearn package [25]. A predictive model for each clinical parameter was computed using all dietary variables via a ridge regression framework [26].
To simultaneously reach the best prediction performances while learning which sets of dietary macronutrient intakes (variables) were the most important for each predicted clinical outcome (target), a multivariate model was applied. To this end, a model selection was performed in order to find the best regression model. Since no univariate effect of a single nutritional variable on the clinical targets emerged (data not shown), we assumed that multivariate techniques were the most promising methods as they are capable of simultaneously reaching the best prediction performances while learning which sets of variables are the most important for each prediction task. Indeed, penalised maximum likelihood methods (LASSO regression, ridge regression) outperformed other classes of regression models as previously shown in other nutritional studies [27,28]. In particular, the ridge regression yielded the best fit on the data under study. The ridge regression belongs to the wider class of penalised linear regressions. These types of models allow computing a regression while shrinking the coefficients of uninformative variables. The linear ridge regression minimises the function:
RSS = residual sum of squares, with i = index of summation for observations, n = number of observations (1 to 77 for women, 1 to 80 for men), j = index of summation for variables, p = number of variables (1 to 10).
The penalty coefficient α can be tuned to optimise the bias-variance trade-off of the model, leading to a maximisation of the predictive performance as a function of the smallest set of the descriptive variables necessary to achieve said performance. The penalty term introduced by the ridge regression is useful to deal with multicollinearity and prevent overfitting; for the present case, it translated to the shrinkage of coefficients of dietary variables strongly correlated among themselves and weakly correlated to a given clinical marker. The absolute value of the regression coefficients β is related to the univariate effect of a given dietary variable (x)j on a given clinical marker (y), while the sign of coefficients is not directly interpretable as it would have been in a normal ordinary least squares (OLS) solution.
Before regression, data were standard scaled. All the ridge models computed were cross-validated to optimise the parameter α through 5-fold cross-validation. Train and test subsets were extracted to maintain the proportion between recruiting centres to minimise the possible confusion factor tied to dietary habits of the country of origin.
To represent the statistical dependence between the rankings of dietary variables and clinical outcomes, correlation heatmaps were also computed using the Spearman rank correlation coefficient [29], which measures how well the relationship between two variables or targets can be described using a monotonic function. The Spearman rank correlation coefficient allows for nonlinear relationships to be detected, providing a good description of the relationships between features and targets.
3. Results and Discussion
Table 1 summarises the characteristics of volunteers included in the study. As expected, a significant heterogeneity was evidenced between men and women, possibly due to different hormonal profiles and body fat distribution [30,31].

Table 1.
General characteristics of the study population grouped by gender (medians and interquartile ranges, IQR).
Ridge-type penalisation was obtained retaining all predictors and minimising collinearity amongst variables; it performed better than LASSO probably due to the complexity of interactions of all the dietary variables in defining the overall clinical picture in the subjects at risk of MetS. Indeed, ridge regression performs better when many predictors have coefficients of roughly equal size [32]. The Pearson correlation coefficients of determination (R2) for the clinical outcomes according to the ridge regression are reported in Table 2.
Table 2.
Pearson correlation coefficients of determination (R2) for the clinical outcomes according to the ridge regression. R2 > 0.4 are in bold.
To visualize the overall complexity of the relationships between clinical parameters and nutritional variables, we computed the heatmap of correlations between them (Figure 1). The topology of the heatmaps for male and female study participants was slightly different, highlighting the gender-related differences in clinical and nutritional characteristics associated with MetS. Within these premises, the linear ridge regression has been chosen as the best trade-off between predictive performances and interpretability of results.
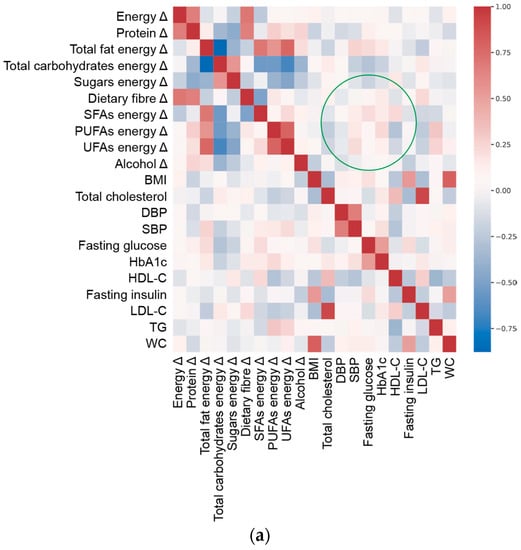
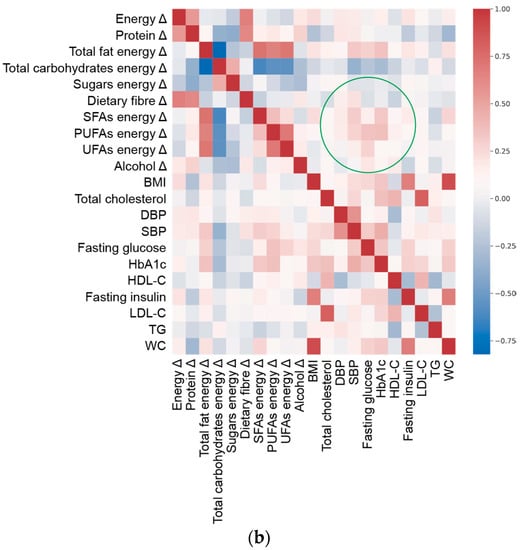
Figure 1.
Spearman’s correlation heat map of adequacy of energy/macronutrient intake (Δ, delta value calculated as difference between current intake and corresponding recommended intake of each variable) and clinical parameters at enrolment (Table 1) in (a) females and (b) males. Green circle marks an example of a different pattern in correlation between variables and targets in males and females.
Based on the results of the predictive model (Table 2 and Figure 1), we focused on clinical features that were better estimated by the adequacy/inadequacy of dietary intakes (R2 > 0.4, as a generally accepted standard [33]), highlighting the variables characterising the prediction. To this aim, ridge regression performance (Figure S1) and the magnitude of regression coefficients (Figure S2) were plotted per individual clinical outcome.
According to the ridge regression results, inadequate dietary intakes better predicted BMI in males (R = 0.78) than in females (R = 0.43). In both genders, exceeding energy intake was the key predictor of a high BMI, especially for obese subjects, confirming that BW changes are associated with an imbalance between energy intake and expenditure [23]. Based on our predictive model, overweight and obesity were also predicted by elevated intake of total fat (>35%EI) in males and of SFAs (>10%EI) in both genders. This is in accordance with outcomes from epidemiologic studies and clinical trials, which suggest that total fat [34] and SFA intake [35] are strongly linked to BW. Excessive intake of SFAs was also a characterising predictor variable of high WC, which was well estimated by inadequate dietary intakes in males (R = 0.79). In males, low consumption of protein was a good indicator of both elevated BMI and WC.
Our results suggest that consumption of high-energy, low-protein, and high-fat diets, particularly when including excessive SFAs, strongly relates to the development of obesity in men and to a lesser extent in women. This gender-related difference confirms results from long-term prospective studies evidencing a significant positive connection between weight gain and dietary fat in a cohort including males and females [36], while energy content from fat was weakly correlated with weight gain in The Nurses’ Health Study, including only women [37].
Interestingly, neither total carbohydrate nor sugar intake were predictors of overweight/obesity. Epidemiological evidence and results from diet intervention trials suggest that protein and carbohydrate intakes are inversely related to BMI, while excessive intake of sugars contributes to obesity [38]. Although the plausibility of the mechanisms provides support for a role of sugar consumption in the epidemics of overweight/obesity, definitive studies are missing [39]. In our group of subjects at risk of MetS, the predictivity of sugar intake on BMI was low and supported the conclusion that there is no clear or convincing evidence that any dietary or added sugars have a unique or detrimental impact relative to any other source of calories on the development of obesity [40].
Results from the ridge regression indicated that blood TG were better predicted by the dietary variables in women (R = 0.46) than in men (R = 0.22). In the female subjects, correct (6–11%E) or slightly low PUFA intake and correct fibre intake (25 g/day) had a good predictive value of normal TG level, confirming the importance of dietary fibre in the maintenance of normal blood TG [41]. Although the total PUFA intake must be considered first when examining dietary habits affecting lipemia [42], it is documented that high n-3 PUFA intake favourably impacts on blood TG [43], while excessive consumption of n-6 PUFAs may lead to negative effects [44]. In this study, it was not possible to accurately discriminate between n-6 and n-3 PUFA intake and it could explain why high PUFA intake did not predict normal TG level.
In females, inadequate dietary intakes, mainly high consumption of available carbohydrates and fats, predicted high LDL-C, and adequate total PUFA intake was a predictive variable of normal LDL-C (R = 0.42). In women, low HDL-C was well predicted by inadequate intakes (R = 0.44), mainly excessive energy, SFA, and available carbohydrates. Although the magnitude scale of the ridge coefficient was generally low for HDL-C prediction (Figure S2), denoting a prediction characterised by the combined effect of nutrients rather than a single dietary variable, overall, our data confirmed evidence in the literature about the negative effect of excessive carbohydrate intake on dyslipidaemia [45,46]. Total cholesterol was not well predicted by any dietary intake both in females (R = 0.35) and males (R = 0.25).
Clinical features related to glucose metabolism and insulin sensitivity were better predicted in men than in women. In males, fasting glucose was well predicted (R = 0.44), and elevated total fat and SFA intakes were slightly associated with moderate fasting hyperglycaemia. These results are consistent with evidence demonstrating that excessive consumption of total fat [47] and SFAs [48,49] favour the onset of insulin resistance. Although no univariate effect of any specific dietary variable was evidenced, fasting insulin and glycated haemoglobin (HbA1c) were moderately predicted by the combined effect of all dietary nutrients in the male group (R = 0.49 and R = 0.52, respectively).
DBP was not well predicted by the examined dietary variables either in women (R = 0.27) or men (R = 0.40). Conversely, inadequate dietary intakes well predicted high SBP in males (R = 0.52), and excessive total fat intake concomitant to low PUFA intake was a good predictor of moderate hypertension (140–159 mmHg) (Figure S1). Again, our results confirmed evidence from observational and epidemiological studies [50,51,52].
Although several studies found an association between alcohol drinking and the prevalence of MetS and most of its components, in our study, alcohol consumption was not predictive of any clinical outcome. We speculate that this was related to the very low percentage of enrolled volunteers exceeding the acceptable consumption of alcoholic beverages (6.5% of females and 16.5% of males), which did not allow any stratification based on alcohol intake.
In summary, in the herein reported retrospective analysis, we focused on the predictive effect of energy/macronutrient intake on the clinical features related to the risk of MetS. We did not focus on food intake and/or dietary pattern, of which their contribution to the risk of MetS has already been addressed by several studies (see [53] for a comprehensive review). Although this approach has limitations since components other than energy and macronutrients are provided by food/diet, our results suggest that predictivity of inadequate intake of energy/macronutrients is independent of dietary patterns. Indeed, we evaluated four different cohorts with different dietary habits tied to the geographical origins of the volunteers, and train and test batches of the cross-validation were stratified with respect to the nationality of each subject to avoid biases derived from different eating habits.
Overall, energy/macronutrient intake had a strong predictivity. We speculate that this relies on the intimate relationship between MetS and obesity, which is in turn strongly dependent on the unbalance of energy/macronutrients in the diet. Of note, not all clinical outcomes were predicted with the same accuracy, and the predictivity was overall higher in men than in women. Furthermore, inadequate intake of specific nutrients was associated to abnormality of specific clinical parameters. Most of the observed intake/clinical outcome associations were consistent with previous evidence. This does not mean that our results are trivial and simply confirmatory, but rather it confirms that the proposed model is suitable for shedding light on the complexity of nutritional variables that, although responsible for impacting on clinical outcomes and, therefore, for influencing the pathological condition, have an effect that is not evident with univariate analysis and must be considered in the framework of the reciprocal influence of the other variables.
The impact of physical activity and smoking was not considered in our model, and this is a limitation since they are both included among lifestyle factors predictive for MetS [54]. Of note, none of the enrolled volunteers was a heavy smoker (≥5 cigarettes per day); this minimising the confounding effect and making a stratification based on these lifestyle characteristics impossible. As well, based on exclusion criteria, none of enrolled subjects had a high level of physical activity (≥5 h of physical activity per week). Specific information on physical activity was collected using the international physical activity questionnaire (IPAQ) only for volunteers who accepted to participate in the sub-study of the trial, so we could not use those data in the regression model. Anyway, collected IPAQ confirmed that physical activity was low-moderate.
4. Conclusions
In this retrospective study, the energy and macronutrient intake of 157 (80 males and 77 females) adult volunteers at risk of MetS from four different countries was evaluated using a validated standardised protocol to measure dietary intakes. The use of the ridge regression, which optimises prediction performances while retaining information about the role of all the nutritional variables, allowed us to assess if a clinical outcome is strongly dependent on a single nutritional variable, or if its prediction is characterised by more complex interactions between the variables. The approach appeared robust, and although our results cannot be applied to the general population, they allowed for the linking of energy/macronutrient intake to the clinical features of MetS, thus providing additional indications about the most important dietary contributors to the risk of the disease.
Methods in prediction modelling have been recently growing and are becoming more relevant in the nutrition field [55]. In the near future, they could be useful to healthcare professionals and policymakers to effectively counteract the risk of MetS and other diet-related diseases.
Supplementary Materials
The following are available online at https://www.mdpi.com/article/10.3390/nu13041377/s1, Table S1: Exclusion criteria of the study, Table S2: Cut-off target ranges of the clinical and metabolic parameters, Figure S1: Scatterplots of ridge regression performance per clinical outcome in females and males, Figure S2: Magnitude of regression coefficients.
Author Contributions
Conceptualisation, A.B. (Alessandra Bordoni) and F.C.; investigation, A.B. (Achim Bub), F.D., C.M.-B., E.M., C.M., C.O., L.R., R.R., S.S. (Stephanie Seifert), S.S. (Samantha Sutulic), and S.V.; resources, A.B. (Alessandra Bordoni); data curation, F.D., C.M., and S.V.; writing—original draft preparation, A.B. (Alessandra Bordoni), F.D., and C.M.; writing—review and editing, A.B. (Alessandra Bordoni), F.D., and C.M. All authors have read and agreed to the published version of the manuscript.
Funding
This research was funded by the European Union Seventh Framework Program (FP7/2007–2013) under grant agreement number 311876: PATHWAY-27.
Institutional Review Board Statement
The study was conducted according to the guidelines of the Declaration of Helsinki, and ethical approval for the study was obtained from the local responsible authorities: State Medical Chamber of Baden-Württemberg, Stuttgart (F-2015-115-RS) and Federal Office for Radiation Protection (Z5–22462/2–2016-019) for Max Rubner-Institut (Germany); Ethical Committee 2016/02/17 (22015-A01825-44) and Agence nationale de sécurité du médicament et des produits de santé ANSM (2016/02/01) for Human Nutrition Research Centre of Auvergne (France); Faculty (MEEC 15-015), National Health Service (16/YH/0091), and Health Research Authority (2016/08/22) for University of Leeds (UK); University of Bologna (193001) for St. Orsola-Malpighi Hospital (Italy).
Informed Consent Statement
Informed consent was obtained from all subjects involved in the study.
Data Availability Statement
The data presented in this study are available on request from the corresponding author.
Acknowledgments
The authors wish to thank all the enrolled volunteers and all staff involved in this study.
Conflicts of Interest
The authors declare no conflict of interest. The funders had no role in the design of the study, in the collection, analyses, or interpretation of data, in the writing of the manuscript, or in the decision to publish the results.
Availability of Supporting Data
The Python source code for analysis and plotting is available at https://github.com/CarloMengucci/Model-selection-and-learning-for-nutritional-data (accessed on 15 April 2021).
References
- Hanson, R.L.; Imperatore, G.; Bennett, P.H.; Knowler, W.C. Components of the “metabolic syndrome” and incidence of type 2 diabetes. Diabetes 2002, 51, 3120–3127. [Google Scholar] [CrossRef]
- Rochlani, Y.; Pothineni, N.V.; Kovelamudi, S.; Mehta, J.L. Metabolic syndrome: Pathophysiology, management, and modulation by natural compounds. Ther. Adv. Cardiovasc. Dis. 2017, 11, 215–225. [Google Scholar] [CrossRef] [PubMed]
- Keane, D.; Kelly, S.; Healy, N.P.; McArdle, M.A.; Holohan, K.; Roche, H.M. Diet and metabolic syndrome: An overview. Curr. Vasc. Pharmacol. 2013, 11, 842–857. [Google Scholar] [CrossRef] [PubMed]
- Warburton, D.E.; Nicol, C.W.; Bredin, S.S. Health benefits of physical activity: The evidence. CMAJ 2006, 174, 801–809. [Google Scholar] [CrossRef] [PubMed]
- Rodríguez-Monforte, M.; Sánchez, E.; Barrio, F.; Costa, B.; Flores-Mateo, G. Metabolic syndrome and dietary patterns: A systematic review and meta-analysis of observational studies. Eur. J. Nutr. 2017, 56, 925–947. [Google Scholar] [CrossRef]
- Vajdi, M.; Farhangi, M.A.; Nikniaz, L. Diet-derived nutrient patterns and components of metabolic syndrome: A cross-sectional community-based study. BMC Endocr. Disord. 2020, 20, 69. [Google Scholar] [CrossRef]
- Calton, E.K.; James, A.P.; Pannu, P.K.; Soares, M.J. Certain dietary patterns are beneficial for the metabolic syndrome: Reviewing the evidence. Nutr. Res. 2014, 34, 559–568. [Google Scholar] [CrossRef]
- Drake, I.; Sonestedt, E.; Ericson, U.; Wallström, P.; Orho-Melander, M. A Western dietary pattern is prospectively associated with cardio-metabolic traits and incidence of the metabolic syndrome. Br. J. Nutr. 2018, 119, 1168–1176. [Google Scholar] [CrossRef]
- Ahola, A.J.; Harjutsalo, V.; Thorn, L.M.; Freese, R.; Forsblom, C.; Mäkimattila, S.; Groop, P.H. The association between macronutrient intake and the metabolic syndrome and its components in type 1 diabetes. Br. J. Nutr. 2017, 117, 450–456. [Google Scholar] [CrossRef]
- Skilton, M.R.; Laville, M.; Cust, A.E.; Moulin, P.; Bonnet, F. The association between dietary macronutrient intake and the prevalence of the metabolic syndrome. Br. J. Nutr. 2008, 100, 400–407. [Google Scholar] [CrossRef]
- Alberti, K.G.; Eckel, R.H.; Grundy, S.M.; Zimmet, P.Z.; Cleeman, J.I.; Donato, K.A.; Fruchart, J.C.; James, W.P.; Loria, C.M.; Smith, S.C.J.; et al. Harmonizing the metabolic syndrome: A joint interim statement of the international diabetes federation task force on epidemiology and prevention; national heart, lung, and blood institute; American heart association; world heart federation; international atherosclerosis society; and international association for the study of obesity. Circulation 2009, 120, 1640–1645. [Google Scholar]
- World Medical Association. World medical association declaration of Helsinki: Ethical principles for medical research involving human subjects. JAMA 2013, 310, 2191–2194. [Google Scholar] [CrossRef]
- Bub, A.; Malpuech-Brugère, C.; Orfila, C.; Amat, J.; Arianna, A.; Blot, A.; Di Nunzio, M.; Holmes, M.; Kertész, Z.; Marshall, L.; et al. A dietary intervention of bioactive enriched foods aimed at adults at risk of metabolic syndrome: Protocol and results from PATHWAY-27 pilot study. Nutrients 2019, 11, 1814. [Google Scholar] [CrossRef] [PubMed]
- Sutulic, S.; Amat, J.; Blot, A.; Nemeth, I.; Kertész, Z.; Marshall, L.; Seifert, S.; Ricciardiello, L.; Malpuech-Brugère, C.; Bordoni, A.; et al. Protocol for pilot studies: Effectiveness of bioactive enriched foods (BEF) on markers of metabolic syndrome. In White Rose Research Online; University of Leeds: Leeds, UK, 2019; pp. 1–70. [Google Scholar]
- Bingham, S.A.; Welch, A.A.; McTaggart, A.; Mulligan, A.A.; Runswick, S.A.; Luben, R.; Oakes, S.; Khaw, K.T.; Wareham, N.; Day, N.E. Nutritional methods in the European Prospective Investigation of Cancer in Norfolk. Public Health Nutr. 2001, 4, 847–858. [Google Scholar] [CrossRef]
- Ambrus, Á.; Horváth, Z.; Farkas, Z.; Dorogházi, E.; Cseh, J.; Petrova, S.; Dimitrov, P.; Duleva, V.; Rangelova, L.; Chikova-Iscener, E.; et al. Pilot study in the view of a Pan-European dietary survey—adolescents, adults and elderly. EFSA Support. Publ. 2013, 10, 508E. [Google Scholar] [CrossRef]
- Goldberg, G.R.; Black, A.E.; Jebb, S.A.; Cole, T.J.; Murgatroyd, P.R.; Coward, W.A.; Prentice, A.M. Critical evaluation of energy intake data using fundamental principles of energy physiology: 1. Derivation of cut-off limits to identify under-recording. Eur. J. Clin. Nutr. 1991, 45, 569–581. [Google Scholar] [PubMed]
- Black, A.E. Critical evaluation of energy intake using the Goldberg cut-off for energy intake: Basal metabolic rate. A practical guide to its calculation, use and limitations. Int. J. Obes. Relat. Metab. Disord. 2000, 24, 1119–1130. [Google Scholar] [CrossRef] [PubMed]
- Henry, C.J. Basal metabolic rate studies in humans: Measurement and development of new equations. Public Health Nutr. 2005, 8, 1133–1152. [Google Scholar] [CrossRef] [PubMed]
- EFSA. Scientific opinion on dietary reference values for energy. EFSA J. 2013, 11, 3005. [Google Scholar] [CrossRef]
- EFSA. Dietary reference values for nutrients summary report. EFSA Support. Publ. 2017, 14, e15121E. [Google Scholar]
- FAO. Fats and fatty acids in human nutrition. Report of an expert consultation. FAO Food Nutr. Pap. 2010, 91, 1–166. [Google Scholar]
- WHO/FAO. Diet, Nutrition and the Prevention of Chronic Diseases: Report of a Joint WHO/FAO Expert Consultation; World Health Organization: Geneva, Switzerland, 2003; Volume 916. [Google Scholar]
- USDA. 2015–2020 Dietary Guidelines for Americans, 8th ed.; U.S. Department of Health and Human Services and U.S. Department of Agriculture: Washington, WA, USA, 2015. [Google Scholar]
- Pedregosa, F.; Varoquaux, G.; Gramfort, A.; Michel, V.; Thirion, B.; Grisel, O.; Blondel, M.; Prettenhofer, P.; Weiss, R.; Dubourg, V.; et al. Scikit-learn: Machine learning in Python. J. Mach. Learn. Res. 2011, 12, 2825–2830. [Google Scholar]
- Gruber, M. Improving Efficiency by Shrinkage: The James-Stein and Ridge Regression Estimators; Taylor & Francis: Abingdon, UK, 1998. [Google Scholar]
- Zhang, F.; Tapera, T.M.; Gou, J. Application of a new dietary pattern analysis method in nutritional epidemiology. BMC Med. Res. Methodol. 2018, 18, 119. [Google Scholar] [CrossRef] [PubMed]
- Garcia-Carretero, R.; Vigil-Medina, L.; Barquero-Perez, O.; Mora-Jimenez, I.; Soguero-Ruiz, C.; Goya-Esteban, R.; Ramos-Lopez, J. Logistic LASSO and Elastic Net to characterize vitamin D deficiency in a hypertensive obese population. Metab. Syndr. Relat. Disord. 2020, 18, 79–85. [Google Scholar] [CrossRef] [PubMed]
- Daniel, W.W. Spearman rank correlation coefficient. In Applied Nonparametric Statistics, 2nd ed.; PWS-KENT Pub.: Boston, MA, USA, 1990; pp. 358–365. [Google Scholar]
- Pradhan, A.D. Sex differences in the metabolic syndrome: Implications for cardiovascular health in women. Clin. Chem. 2014, 60, 44–52. [Google Scholar] [CrossRef]
- Yang, Y.M.; Shin, B.C.; Son, C.; Ha, I.H. An analysis of the associations between gender and metabolic syndrome components in Korean adults: A national cross-sectional study. BMC Endocr. Disord. 2019, 19, 67. [Google Scholar] [CrossRef]
- Steyerberg, E.W. Clinical Prediction Models; Springer Nature: Cham, Switzerland, 2019. [Google Scholar]
- Moore, D.S.; Notz, W.I.; Flinger, M.A. The Basic Practice of Statistics, 6th ed.; W. H. Freeman and Company: New York, NY, USA, 2013. [Google Scholar]
- Hooper, L.; Abdelhamid, A.; Bunn, D.; Brown, T.; Summerbell, C.D.; Skeaff, C.M. Effects of total fat intake on body weight. Cochrane Database Syst. Rev. 2015, CD011834. [Google Scholar] [CrossRef] [PubMed]
- Aranceta, J.; Pérez-Rodrigo, C. Recommended dietary reference intakes, nutritional goals and dietary guidelines for fat and fatty acids: A systematic review. Br. J. Nutr. 2012, 107, S8–S22. [Google Scholar] [CrossRef]
- Mosca, C.L.; Marshall, J.A.; Grunwald, G.K.; Cornier, M.A.; Baxter, J. Insulin resistance as a modifier of the relationship between dietary fat intake and weight gain. Int. J. Obes. Relat. Metab. Disord. 2004, 28, 803–812. [Google Scholar] [CrossRef][Green Version]
- Field, A.E.; Willett, W.C.; Lissner, L.; Colditz, G.A. Dietary fat and weight gain among women in the Nurses′ Health Study. Obesity 2007, 15, 967–976. [Google Scholar] [CrossRef]
- Yancy, W.S., Jr.; Wang, C.C.; Maciejewski, M.L. Trends in energy and macronutrient intakes by weight status over four decades. Public Health Nutr. 2014, 17, 256–265. [Google Scholar] [CrossRef]
- Stanhope, K.L. Sugar consumption, metabolic disease and obesity: The state of the controversy. Crit. Rev. Clin. Lab. Sci. 2016, 53, 52–67. [Google Scholar] [CrossRef]
- Bray, G.A.; Popkin, B.M. Dietary sugar and body weight: Have we reached a crisis in the epidemic of obesity and diabetes? Health be damned! Pour on the sugar. Diabetes Care 2014, 37, 950–956. [Google Scholar] [CrossRef]
- Hannon, B.A.; Thompson, S.V.; Edwards, C.G.; Skinner, S.K.; Niemiro, G.M.; Burd, N.A.; Holscher, H.D.; Teran-Garcia, M.; Khan, N.A. Dietary fiber is independently related to blood triglycerides among adults with overweight and obesity. Curr. Dev. Nutr. 2019, 3, nzy094. [Google Scholar] [CrossRef]
- Wijendran, V.; Hayes, K.C. Dietary n-6 and n-3 fatty acid balance and cardiovascular health. Ann. Rev. Nutr. 2004, 24, 597–615. [Google Scholar] [CrossRef] [PubMed]
- Abdelhamid, A.S.; Brown, T.J.; Brainard, J.S.; Biswas, P.; Thorpe, G.C.; Moore, H.J.; Deane, K.H.; AlAbdulghafoor, F.K.; Summerbell, C.D.; Worthington, H.V.; et al. Omega-3 fatty acids for the primary and secondary prevention of cardiovascular disease. Cochrane Database Syst. Rev. 2018, 7, CD003177. [Google Scholar] [PubMed]
- Lai, C.Q.; Corella, D.; Demissie, S.; Cupples, L.A.; Adiconis, X.; Zhu, Y.; Parnell, L.D.; Tucker, K.L.; Ordovas, J.M. Dietary intake of n-6 fatty acids modulates effect of apolipoprotein A5 gene on plasma fasting triglycerides, remnant lipoprotein concentrations, and lipoprotein particle size: The Framingham Heart Study. Circulation 2006, 113, 2062–2070. [Google Scholar] [CrossRef] [PubMed]
- Sacks, F.M.; Katan, M. Randomized clinical trials on the effects of dietary fat and carbohydrate on plasma lipoproteins and cardiovascular disease. Am. J. Med. 2002, 113 (Suppl. 9B), 13S–24S. [Google Scholar] [CrossRef]
- Siri-Tarino, P.W.; Sun, Q.; Hu, F.B.; Krauss, R.M. Saturated fat, carbohydrate, and cardiovascular disease. Am. J. Clin. Nutr. 2010, 91, 502–509. [Google Scholar] [CrossRef] [PubMed]
- McAuley, K.; Mann, J. Thematic review series: Patient-oriented research. Nutritional determinants of insulin resistance. J. Lipid. Res. 2006, 47, 1668–1676. [Google Scholar] [CrossRef] [PubMed]
- Feskens, E.J.; Loeber, J.G.; Kromhout, D. Diet and physical activity as determinants of hyperinsulinemia: The Zutphen Elderly Study. Am. J. Epidemiol. 1994, 140, 350–360. [Google Scholar] [CrossRef] [PubMed]
- Ebbesson, S.O.; Tejero, M.E.; López-Alvarenga, J.C.; Harris, W.S.; Ebbesson, L.O.; Devereux, R.B.; MacCluer, J.W.; Wenger, C.; Laston, S.; Fabsitz, R.R.; et al. Individual saturated fatty acids are associated with different components of insulin resistance and glucose metabolism: The GOCADAN study. Int. J. Circumpolar Health 2010, 69, 344–351. [Google Scholar] [CrossRef]
- Freire, R.D.; Cardoso, M.A.; Gimeno, S.G.; Ferreira, S.R.; Japanese-Brazilian Diabetes Study Group. Dietary fat is associated with metabolic syndrome in Japanese Brazilians. Diabetes Care 2005, 28, 1779–1785. [Google Scholar] [CrossRef] [PubMed]
- Reddy, K.S.; Katan, M.B. Diet, nutrition and the prevention of hypertension and cardiovascular diseases. Public Health Nutr. 2004, 7, 167–186. [Google Scholar] [CrossRef]
- Grynberg, A. Hypertension prevention: From nutrients to (fortified) foods to dietary patterns. Focus on fatty acids. J. Hum. Hypertens. 2005, 19 (Suppl. 3), S25–S33. [Google Scholar] [CrossRef]
- Pérez-Martínez, P.; Mikhailidis, D.P.; Athyros, V.G.; Bullo, M.; Couture, P.; Covas, M.I.; de Koning, L.; Delgado-Lista, J.; Díaz-López, A.; Drevon, C.A.; et al. Lifestyle recommendations for the prevention and management of metabolic syndrome: An international panel recommendation. Nutr. Rev. 2017, 75, 307–326. [Google Scholar] [CrossRef] [PubMed]
- Sun, K.; Liu, J.; Ning, G. Active smoking and risk of metabolic syndrome: A meta-analysis of prospective studies. PLoS ONE 2012, 7, e47791. [Google Scholar] [CrossRef]
- Ivanescu, A.E.; Li, P.; George, B.; Brown, A.W.; Keith, S.W.; Raju, D.; Allison, D.B. The importance of prediction model validation and assessment in obesity and nutrition research. Int. J. Obes. 2016, 40, 887–894. [Google Scholar] [CrossRef]
Publisher’s Note: MDPI stays neutral with regard to jurisdictional claims in published maps and institutional affiliations. |
© 2021 by the authors. Licensee MDPI, Basel, Switzerland. This article is an open access article distributed under the terms and conditions of the Creative Commons Attribution (CC BY) license (https://creativecommons.org/licenses/by/4.0/).