Abstract
Out-of-home eating is increasing, but evidence about its healthiness is limited. The present systematic review and meta-analysis aimed to elucidate the effectiveness of full-service restaurant and canteen-based interventions in increasing the dietary intake, food availability, and food purchase of healthy meals. Studies from 2000–2020 were searched in Medline, Scopus, and Cochrane Library using the PRISMA checklist. A total of 35 randomized controlled trials (RCTs) and 6 non-RCTs were included in the systematic review and analyzed by outcome, intervention strategies, and settings (school, community, workplace). The meta-analysis included 16 RCTs (excluding non-RCTs for higher quality). For dietary intake, the included RCTs increased healthy foods (+0.20 servings/day; 0.12 to 0.29; p < 0.001) and decreased fat intake (−9.90 g/day; −12.61 to −7.19; p < 0.001), favoring the intervention group. For food availability, intervention schools reduced the risk of offering unhealthy menu items by 47% (RR 0.53; 0.34 to 0.85; p = 0.008). For food purchases, a systematic review showed that interventions could be partially effective in improving healthy foods. Lastly, restaurant- and canteen-based interventions improved the dietary intake of healthy foods, reduced fat intake, and increased the availability of healthy menus, mainly in schools. Higher-quality RCTs are needed to strengthen the results. Moreover, from our results, intervention strategy recommendations are provided.
1. Introduction
The change in modern living due to urbanization and globalization [1] and the lack of sufficient free time to dedicate to home cooking have increased families’ consumption of daily meals out of the home [2]. Restaurants, schools, workplace canteens and food stores providing prepared meals are the preferred food services by both children and adult populations [3,4].
Consequently, eating out of home is associated with a unhealthy diet [5] due to the lower consumption of fruits and vegetables [6]. Furthermore, comparisons of the nutritional profile of foods have shown that meals prepared out of the home are higher in energy density, fat and sodium and lower in calcium and fiber than foods prepared at home [7]. Thus, consumers of out-of-home meals may report important long-term health implications, such as obesity [8] and related chronic diseases [9]. In this regard, people are paying more attention to the healthiness of food when eating out of home [10], demanding higher-quality meals from food businesses that have the responsibility to provide them according to consumers’ necessities [11].
For instance, potential strategies for the promotion of healthier meals could be the improvement of the nutritional quality of food in terms of energy, fat and sodium [12], the reduction of portion sizes in meals [13] and the provision of nutritional labels [14]. The lack of nutritional information on menus, known as the consumer “nutritional knowledge gap”, could hinder people’s healthy eating intentions when they are eating out of home [15].
However, the literature on the most effective interventions to improve consumers’ diet when they are eating out of home is still scarce. Moreover, most nutrition interventions are set in fast-food and chain restaurants mainly placed in urban areas [16], leaving little evidence about independent restaurants and potential intervention strategies [17,18].
Another aspect is identifying suitable solutions for different population targets [19], such as children, adolescents and adults, and in different environments, such as restaurants [18], schools [20] and workplace canteens [21].
Thus, the aim of the present systematic review and meta-analysis is to elucidate the effectiveness of full-service restaurant- and canteen-based interventions targeting children, adolescents and adults in increasing the availability, purchase and intake of healthy meals.
2. Materials and Methods
This systematic review has been registered in the International Prospective Register of Systematic Reviews (PROSPERO) with the registration number CRD42019117411. The results of the included articles are reported according to the Preferred Reporting Items for Systematic Reviews and Meta-Analysis (PRISMA) guidelines [22]. The PRISMA 2009 checklist is presented in Table S1.
2.1. Search Strategy
Three electronic databases were searched: Medline, Scopus, and Cochrane Library. Search filters were used in all three databases to limit the results to the “2000–2020” publication time range and English, Spanish, and Italian language articles. For the abstract and full-text screening of the articles, the Rayyan QCRI web-based software platform [23] was used to better manage the high volume of retrieved articles. Searches were conducted using the following keywords: “intervention” AND “controlled” AND “restaurant” OR “canteen” OR “food-service” AND “meal” OR “dietary intake” OR “food availability” OR “food purchase” OR “menu”.
The Population, Intervention, Comparison and Outcomes (PICOS) criteria (Table 1) were used to define the research question of the present systematic review [24].

Table 1.
PICOS criteria used to define the research question.
2.2. Screening
Initial screening of the title, abstract, keywords and publication type was conducted by two reviewers independently (F.M.; L.T.). Full-text screening of potentially relevant studies was independently performed by the same two reviewers (F.M.; L.T.) based on the inclusion and exclusion criteria, and disagreements were resolved by a third reviewer (E.L.). Final doubts about the eligibility of a particular study were resolved through discussion between the three reviewers for further confirmation and consensus.
2.3. Inclusion and Exclusion Criteria
The inclusion criteria used for the selection of eligible articles in this review were (a) controlled trials, with or without random assignment, published from 2000 to 2020 to focus the search on healthy eating interventions in full-service restaurants and canteens, conducted in contemporary circumstances; (b) English, Spanish or Italian language articles; (c) articles describing full-service restaurant and canteen-based interventions aimed at improving menu offerings and increasing the offerings and demand for healthier meals as the primary or secondary outcome; (d) trials that included a control group (CG) that did not receive the intervention; and (e) trials that presented both pre- and postintervention measurements of the intervention group (IG) and the CG and the p-values of the difference between groups.
Articles were excluded when (1) they did not fulfill the abovementioned criteria; (2) they used the pretest condition as the CG; or (3) the authors of the article were not able to give further details about the intervention results when personally asked by the authors of the present paper.
2.4. Data Extraction and Management
The following data were extracted from the included intervention studies: (1) study design and type of intervention; (2) setting; (3) country; (4) population; (5) population age; (6) duration of the intervention; (7) outcome; (8) measurement tool; (9) results; and (10) intervention strategies.
If necessary, further information about the results was collected by emailing the corresponding authors [25,26,27,28,29], especially when it was not possible to deduce the information directly from tables and figures.
The extracted results included mean changes from baseline to postintervention or follow-up and significant differences between groups in changes from pre- to postintervention. For each variable examined in between-group comparisons, differences were considered significant at p-values ≤0.05.
2.5. Data Synthesis
For a better evaluation of intervention effectiveness, the included interventions were divided according to the following: (1) outcome category (dietary intake, food availability and food purchase); (2) strategies applied (consumer- and/or establishment-based); and (3) intervention setting (school, community, and workplace) reflecting the age of the target population, i.e., children and/or adults.
Moreover, the included interventions were classified similarly to previous studies as follows [30,31]: (1) effective, when all the measured variables indicated a statistically significant change from baseline to post assessment in favor of the IG compared to the CG; (2) partially effective, when some variables included in the study changed significantly favoring the IG and any variable changed favoring the CG; and (3) not effective, when any significant changes occurred or when a change favoring the CG occurred. For the interpretation of the final effectiveness of the systematic review, an intervention was considered effective when the corresponding study reported it to be totally and/or partially effective.
2.6. Outcomes
The included studies focused on different outcomes, which were grouped into three major categories, as described previously. Specifically, (1) the dietary intake outcome category referred to the increase in the study population’s consumption of healthier meals, which, according to the World Health Organization (WHO) recommendations, requires the consumption of more fruits and vegetables, the limitation of the consumption of saturated and trans fats and sugar and salt, and a balanced energy intake [32]; (2) the food availability outcome category referred to the change in the offerings of healthy and/or unhealthy food items (in terms of quality and quantity) in restaurants and canteens, which represents one of the highest-impact interventions for changing the population’s dietary behavior [33]; and (3) the food purchase outcome category referred to the change in consumers’ food selection towards the selection of healthier food options offered in restaurants and canteens, which is directly related to the increase in the availability of such options to satisfy consumers’ demands [34].
2.7. Data Analysis
The meta-analysis was performed with Review Manager 5.4.1 and STATA 16.1 (StataCorp. 2019. Stata Statistical Software: Release 16. StataCorp LLC, College Station, TX, USA) when at least three of the included intervention studies presented similar outcome variables and units of measure. Meta-analysis was performed including both RCTs and non-RCTs, and then it was repeated by excluding non-RCTs to assure higher quality results. Studies were analyzed with a random effect model when the heterogeneity of the studies was evaluated over 75% by the I2 statistic, with the results expressed as odds ratios (ORs). When the heterogeneity was <75%, the fixed effects model was used, and the results were expressed as the risk ratio (RR) [35]. Intervention studies that presented the same measurement units and outcomes were analyzed in subgroups of studies. If the SD, SE or 95% CI values were not available in the original articles, the intervention studies were not included in the meta-analysis. A p-value of ≤0.05 was considered statistically significant.
2.8. Risk of Bias and Quality Criteria
The risk of bias and quality assessment of the included intervention studies was performed using the standardized framework of the Quality Assessment Tool for Quantitative Studies Dictionary developed for the Effective Public Health Practice Project [36]. Each included intervention study was evaluated as weak, moderate or strong for six of the eight specific categories: selection bias, study design, confounders, blinding, data collection methods, and withdrawals and dropouts. Then, the overall quality of the studies was appraised based on a 3-point rating scale including strong (no weak ratings), moderate (one weak rating) or weak (two or more weak ratings).
3. Results
3.1. Results of the Search
A total of 8537 articles were retrieved from the search of the Medline, Cochrane Library and Scopus databases (Figure 1). A total of 731 duplicates were removed, resulting in 7806 articles for title and abstract screening. Of these, 7653 were excluded because they were irrelevant for the present review by title and abstract screening. The remaining 153 articles were selected for further full-text screening according to the inclusion criteria. Following the screening, an additional 114 articles were excluded for not fulfilling the inclusion criteria. A total of 39 English-language articles were evaluated as eligible for inclusion, together with 2 articles resulting from cross-reference searching, for a total of 41 articles finally included in the present systematic review. The detailed general characteristics of the included studies are shown in Table 2, and the results on the mean pre–post intervention changes in the IG and CG are shown in Table S2.
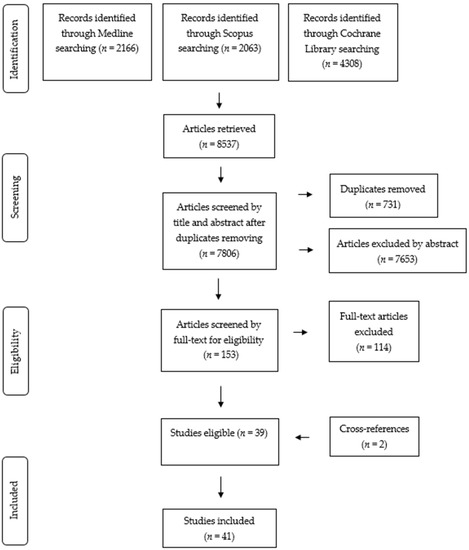
Figure 1.
Preferred Reporting Items for Systematic Reviews and Meta-Analyses (PRISMA) 2009 flow diagram for the systematic review of the article selection process.
Table 2.
Characteristics of the included intervention studies in restaurants and food service establishments.
3.2. General Characteristics of the Included Intervention Studies
The 41 included interventions (Table 2) were based on different study designs: 35 were RCTs [25,26,27,28,29,37,38,39,40,41,42,43,44,45,46,47,48,49,50,51,52,53,54,55,56,57,58,59,60,61], and 6 were non-RCTs [62,63,64,65,66,67]. A total of 3 studies consisted of 4-arm parallel-group conditions [27,57,64] and 4 studies had a 3-arm parallel-group intervention [26,28,49,67].
The included interventions were set in 12 different countries. Most of them were performed in the United States (n = 20) [26,27,28,37,38,40,48,51,52,55,56,60,61,63,65,66,67,68,69,70] and Australia (n = 11) [25,39,41,43,45,46,47,58,59,62,71], while the other studies were conducted in Lebanon [29], Brazil [44], Denmark [50], Malaysia [42], Scotland [53], Belgium [49], Mexico [72], Ecuador [54], Ireland [64], and the UK [57].
3.3. Settings of the Included Studies
The included studies took place in different settings. Twenty-four RCT and 5 non-RCT studies were applied in school settings, specifically in primary and secondary schools [25,27,29,38,41,42,44,46,47,48,49,53,54,55,57,60,63,65,66,68,69,71] or in a childcare service center [39,43,58,59,62,67,72]. Then, 8 RCTs were conducted in community settings, including 1 intervention in sporting clubs [45]; 2 interventions in restaurants [26] and/or food stores [40]; 4 interventions in after-school programs in churches, communities and schools [37,51,52,70]; and 1 intervention in recreation centers, including corner stores, wholesalers and carry-out restaurants [56]. Four interventions, including 3 RCTs and 1 non-RCT, were conducted in workplace settings [28,50,61,64] (Table 2).
3.4. Samples of the Included Studies
The total sample size of the 41 included studies was 35,638 participants (IG: 18,988; CG: 16,650) (Table 2). In particular, there were 16,824 participants in dietary intake interventions (children, school chefs and employees), 9361 participants in food availability interventions (children, school chefs, customers and club members), and 20,019 participants in food purchase interventions (children, employees, club members and customers). The study samples were varied and stratified in terms of sample size (from 28 to 3908 people) and age (children and adults, as reflected by the different settings).
3.5. Intervention Duration
The applied interventions lasted from 1 week to 3 years (Table 2). In particular, in the dietary intake outcome category, 16 interventions lasted less than one year [27,29,43,44,50,51,52,53,57,58,63,64,65,66,68,69] and 6 interventions lasted up to one year [49,54,55,56,59,67]. In the food availability outcome category, 6 interventions lasted less than one year [38,40,41,42,43,44] and 8 interventions lasted up to one year [37,39,45,46,47,48,62,72]. In the food purchase outcome category, 13 interventions lasted less than one year, [25,26,27,28,29,40,60,61,65,66,69,70,71] and 3 interventions lasted up to one year [45,46,56].
3.6. Intervention Type
The intervention type was based on the strategies used. Each intervention applied different consumer-based and establishment-based strategies to achieve the evaluated outcome (Table 3). In particular, 3 consumer-based strategies were used to provide support, information and education (defined as a, b, and c) to consumers to improve their healthy food choices. Nine establishment-based strategies (defined as d to l) were applied for the improvement of the nutrition environment, including implementing menus offering healthier options and increasing the knowledge of restaurants and food service staff about healthy nutrition. Based on the strategies used in effective interventions, strategy recommendations were derived according to the outcome and setting applied (Table 4).
Table 3.
Effectiveness of the strategies used in the included intervention studies.
Table 4.
Strategy recommendations derived from effective interventions included in the systematic review.
3.7. Outcomes
The 41 included interventions were analyzed for one or more of the three outcomes identified and mentioned above: (1) 22 interventions (17 RCTs and 5 non-RCTs) aimed to improve customers’ dietary intake regarding the consumed food and beverage items and the nutritional composition of food in terms of micro- and macronutrients [27,29,43,44,49,50,51,52,53,54,55,56,57,58,59,63,64,65,66,67,68,69]; (2) 14 interventions (13 RCTs and 1 non-RCT) aimed to increase healthy food offerings on menus [37,38,39,40,41,42,43,44,45,46,47,48,62,72]; and (3) 16 interventions (14 RCTs and 2 non-RCTs) aimed to increase the population’s healthy food purchases [25,26,27,28,29,40,45,46,56,60,61,65,66,69,70,71] (Table 2).
3.8. Dietary Intake Outcome Category
A total of 11 of the 22 interventions targeting dietary intake outcome [27,29,43,52,57,58,59,65,66,68,69] presented results on the population’s food and beverage intake. On the other hand, 2 interventions [64,67] presented results on the population’s nutrient intake, and 9 interventions assessed both food and beverage intake and nutrient intake [44,49,50,51,53,54,55,56,63] (Table S2).
Among these 22 interventions focused on dietary intake, (a) 1 intervention effectively improved children’s dietary intake for all the measured variables by increasing healthy food items and decreasing unhealthy ones [52]; (b) 17 interventions were partially effective in changing the population’s dietary intake of some of the evaluated healthy or unhealthy menu items and nutrients (sugar, fat, saturated fat, energy and sodium) [27,29,43,49,50,51,53,56,58,59,63,64,67,68,69], of which 2 studies were partially effective only in some of the evaluated IGs [27,49]; and (c) 4 interventions reported no effectiveness for any of the evaluated variables [44,57,65,66] (Table 2).
One effective intervention was set in a community setting as an after-school program and lasted 9 months [52]. Among the 17 partially effective interventions, 2 were implemented in workplace settings, 2 in community settings and 13 were implemented in school settings, and they lasted from 3 weeks to 30 months [27,29,43,49,50,51,53,56,58,59,63,64,67,68,69].
3.9. Food Availability Outcome Category
A total of 3 RCTs of the 14 interventions that targeted food availability outcome [41,46,47] presented results of the analysis of menu offerings in school canteens (no “red” or banned food items and >50% “green” food items). The other 11 interventions (10 RCTs and 1 non-RCT) [37,38,39,40,42,43,44,45,48,62,72] presented food availability results in relation to the increase or decrease in healthy items (fruits and vegetables, unsweetened beverages, water, whole grains, etc.) or unhealthy items (high-fat, high-energy, high-sugar and high-sodium foods) on the menus of restaurants and canteens, and 3 of these studies also evaluated changes in the availability of nutrients [42,44,48] (Table S2).
Among these 14 interventions focused on food availability, 3 interventions effectively improved food availability for all the measured variables by increasing menu offerings of healthy food and beverage items and decreasing the offerings of unhealthy ones in the IG compared to the CG [41,43,46].
On the other hand, 7 interventions were partially effective by significantly changing the availability of only some of the evaluated variables, which were healthy/unhealthy food items offered on the menu, in favor of the IG [38,39,42,45,47,48,72]. Furthermore, 4 intervention studies reported no positive changes for any of the evaluated variables or reported negative changes for some variables in favor of the IG [37,40,44,62] (Table 2).
The 3 food availability interventions that were totally effective [41,43,46] were conducted in school settings, namely primary and secondary schools, and lasted from 6 to 14 months. On the other hand, among the 7 partially effective interventions, 1 was implemented in the community and 6 were implemented in schools, and they lasted from 1 week to 3 years [38,39,42,45,47,48,72].
3.10. Food Purchase Outcome Category
Among the 16 interventions targeting food purchase outcomes [25,26,27,28,29,40,45,46,56,60,61,65,66,69,70,71], (a) 13 presented results on food and beverage items purchased in restaurants and food service establishments by customers [26,27,28,29,40,45,56,60,61,65,66,69,71], (b) 1 intervention [46] presented results on healthy purchases in terms of food nutrient content, and (c) 2 interventions presented results on both food items and nutrient content [25,70] (Table S2).
Among these 16 interventions focused on food purchases, 3 were totally effective: 2 interventions effectively improved the population’s purchase of healthy food items and beverages [45,66], and the other 3-arm intervention reported an increase in “green” food items purchased in only one of the IGs [28]. Another 9 interventions were partially effective in changing the population’s food purchase of some of the evaluated healthy or unhealthy menu items, also according to their nutrient content (sodium, sugar, energy) [25,27,29,46,56,60,61,65,70], and the other 4 interventions reported no effectiveness for any of the evaluated variables [26,40,69,71] (Table 2).
Between the 3 totally effective interventions, 1 was implemented in a workplace setting, namely, hospital canteens [28], 1 in the school [66] and 1 a community setting, namely, sporting club canteens [45]; they lasted from 5 weeks to 2.5 years.
On the other hand, of the 9 partially effective interventions, 6 were conducted in school settings, 2 in community settings and 1 in a workplace setting, and they lasted from 5 weeks to 14 months [25,27,29,46,56,60,61,65,70].
3.11. Results of the Meta-Analysis
A total of 16 RCTs [27,41,43,44,46,47,49,50,51,52,53,55,56,58,59,69] and 3 non-RCTs [63,64,67] comprising 20,897 participants in total were included in the meta-analysis for the evaluation of dietary intake and food availability outcomes. For dietary intake outcome, 9 studies (8 RCTs and 1 non-RCT) were included to analyze the increase in servings/day of healthy food items [27,43,51,52,56,58,59,63,69], 5 studies (3 RCTs and 2 non-RCTs) for the increase in the intake of fiber g/day [50,51,55,64,67], 5 studies (3 RCTs and 2 non-RCTs) for the decrease of nutrients g/day [49,50,51,64,67], 5 studies (3 RCTs and 2 non-RCTs) for the decrease in energy percentage (%E) deriving from fat [49,50,53,64,67], and 7 studies (4 RCTs and 3 non-RCTs) for the decrease of daily caloric intake [44,51,55,56,63,64,67]. For food availability outcomes, 3 RCT studies were included to evaluate the proportion of school canteen menus offering healthier food items by reducing unhealthy items (red or banned items) [41,46,47]. Any intervention study for the food purchase outcome could be included in the present meta-analysis because of the lack of data to be compared. With the exception of food availability, where the studies included presented similar interventions (I2 statistic = 43%), the forest plots of dietary intake outcome presented high heterogeneity (I2 statistic ≥ 90%). Thus, for dietary intake outcome, the analysis was conducted with randomized and nonfixed effect models, and the results are expressed as weighted mean differences with 95% CIs between the pre- and postintervention values of both the IG and CG. For food availability outcomes, meta-analysis was performed by pooling risk ratios (RRs) using the Mantel–Haenszel method.
3.11.1. Dietary Intake Meta-Analysis
For the dietary intake outcome, the included intervention studies (RCTs and non-RCTs) were effective in increasing +0.24 servings/day of healthy food groups in favor of the IG (95% CI, 0.16 to 0.32; p < 0.001; Figure 2), including fruit, vegetables, whole grains, lean meat, and alternatives (poultry, fish, eggs, tofu, seeds, and legumes), dairy food items and alternatives (milk, yogurt, cheese). Specifically, +0.60 servings/day of whole grain (95% CI, 0.30 to 0.90; p < 0.001; Figure 2) and +0.21 servings/day of dairy food items and alternatives (95% CI, 0.01 to 0.40; p = 0.04; Figure 2) significantly increased in favor of the IG. Moreover, when non-RCTs were excluded from the meta-analysis, the effectiveness was also confirmed (Figure S1). An increase of +0.50 g/day of fiber was also observed in favor of the IG for the analyzed intervention studies (95% CI, 0.08 to 0.92; p = 0.02; Figure S1). However, when non-RCTs were excluded from the meta-analysis, the effectiveness was not confirmed (Figure S1). Furthermore, a positive decrease of −4.17 g/day of nutrients such as saturated fat, fat and added sugar (95% CI, −5.43 to −2.92; p < 0.001; Figure 3) occurred, favoring the IG. Specifically, −4.64 g/day saturated fat (95% CI, −7.21 to −2.08; p < 0.001; Figure 3) and −8.95 g/day fat (95% CI, −14.56 to −3.34; p = 0.002; Figure 3) significantly decreased in favor of the IG. However, when non-RCTs were excluded from the meta-analysis, only fat intake could be assessed since at least 3 studies were included and the effectiveness was confirmed (Figure S1).
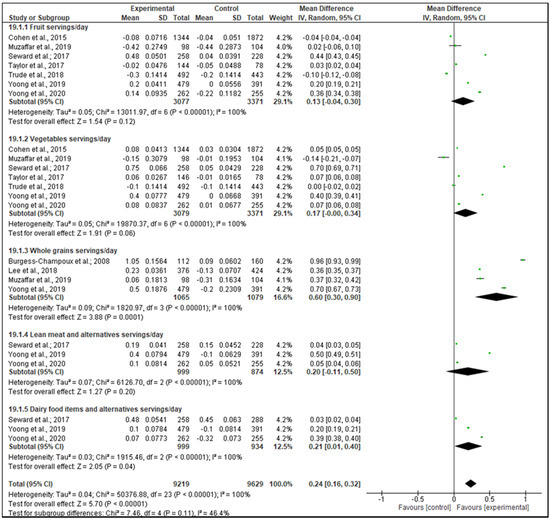
Figure 2.
Forest plot of the effectiveness of increasing the dietary intake of healthy food items (servings/day), according to the included intervention studies (RCTs and non-RCTs).
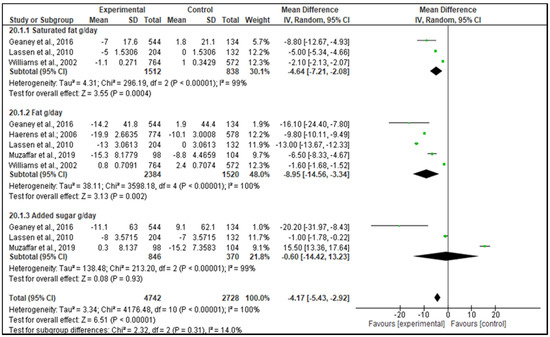
Figure 3.
Forest plot of the effectiveness of decreasing the dietary intake of saturated fat, fat and added sugar nutrients (g/day) according to the included intervention studies (RCTs and non-RCTs).
On the other hand, no effectiveness was observed in the overall effect size for the intervention studies aimed at reducing the percentage of caloric intake derived from fat (%E/day) (dietary intake, −3.50; 95% CI, −7.24 to 0.24; p = 0.07; Figure S1). Moreover, these results were confirmed when excluding non-RCTs from the meta-analysis (Figure S1).
3.11.2. Food Availability Meta-Analysis
Regarding the food availability outcome, the included interventions effectively reduced the risk of intervention schools offering unhealthy items on canteen menus by 47%, labeled red or banned food items and beverages (RR 0.53; 95% CI, 0.34 to 0.85; p = 0.008; I2 = 43%; Figure 4).
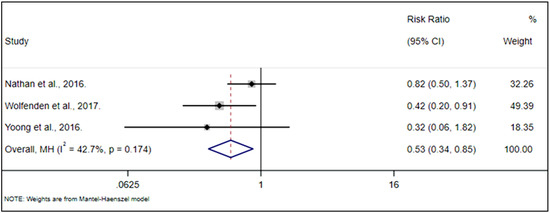
Figure 4.
Forest plot of the relationship between the effectiveness of the included interventions (RCTs) and the risk for schools to offer unhealthy items on canteen menus.
3.12. Quality Assessment Results
Based on the risk of bias and quality assessment of the included studies, all of the studies were of weak quality, and blinding was not used in any study due to the nature of the intervention (Table S3). Although all 41 studies presented a strong study design, the majority of them had weak selection bias [25,26,27,28,37,40,41,42,45,48,49,51,53,54,56,61,63,66,67,69,71,72], weak confounders [25,26,27,28,29,38,39,40,41,42,43,45,48,51,53,57,58,59,60,61,63,64,66,67,68,69,71], and weak data collection methods [25,26,27,28,29,37,38,39,40,42,44,45,46,47,48,50,51,52,53,54,55,56,59,60,61,62,66,67,68,69,70,71,72]. Additionally, regarding withdrawals and dropouts, studies presented mixed results with 16 weak [26,27,37,38,40,42,48,50,51,53,55,61,62,65,67,72], 12 moderate [43,47,49,52,54,56,58,59,60,64,66,69], and 13 strong [25,28,29,39,41,44,45,46,57,63,68,70,71] (Table S3).
Since all the studies included in the systematic review had weak quality, the meta-analysis was performed considering RCT and non-RCT intervention studies together, and it was repeated by excluding non-RCTs to assure results with higher quality.
4. Discussion
The present systematic review included 41 interventions, 35 RCTs and 6 non-RCTs, and of these, 16 RCTs and 3 non-RCTs were included in the meta-analysis. Eligible interventions were full-service restaurants and canteen-based interventions aimed at increasing dietary intake, food availability, and food purchases in different settings, such as schools, workplaces, and communities. The results from the present systematic review showed that restaurant- and canteen-based interventions are effective in improving healthy dietary intake and food availability, mainly in the school setting, with a beneficial impact on children. However, there is partial evidence for the improvement of food purchases, and more evidence is needed about workplaces and community settings as full-service restaurants. Moreover, when the meta-analysis was performed without considering non-RCT studies, the results were confirmed in dietary intake for increasing healthy food intake and in the reduction of fat intake.
The results are discussed considering systematic review and meta-analysis outcomes because meta-analysis contributes to evaluating the effectiveness of this type of intervention, and systematic review allows us to review the characteristics of interventions with effective results.
The included interventions in the meta-analysis demonstrated effectiveness in increasing the intake of healthy food items (whole grains, dairy products and alternatives) and nutrients such as fiber [27,43,50,51,52,55,56,58,59,63,64,67,69] mainly in children, demonstrating that schools are a favorable environment for the promotion of healthy dietary intake. Furthermore, an increase in daily caloric intake occurred in favor of the CG [44,51,55,56,63,64,67], and effectiveness was observed for decreasing the consumption of other nutrients such as saturated fat and fat in the IG [49,50,51,64,67]. For food availability outcome, the intervention studies included in the meta-analysis were also demonstrated to be effective in reducing the risk, for the intervention schools, of offering unhealthy foods and beverages on canteen menus [41,46,47].
For interventions in the dietary intake outcome category, the present results showed effectiveness mainly in school settings, which was the preferred setting for interventions targeting these outcomes. When targeting children, an important factor to be considered in nutrition interventions is food presentation in terms of color and smell, which should be appetized to trigger food selection and consumption. Thus, repeated exposure to healthier foods presented in attractive ways could help children become more accustomed to and consume it [73]. Focusing on adults, changing dietary habits to achieve a healthier lifestyle is made more difficult by the perceived barriers, such as: lack of cooking skills and willpower; time scarcity; the need to give up one’s favorite foods [74]; and social, cultural and economic conditions [75]. However, although the evidence about workplace settings is very limited in the present review, workplace interventions have the potential to change consumers’ dietary behavior through the working lifespan [76]. Long-term workplace interventions for approximately one year evidenced an improvement in dietary change among the participants [77], while the included studies in this systematic review lasted less than one year. However, it is important to highlight that published evidence and its quality in workplace programs are suboptimal; thus, this conclusion needs to be verified with high-quality interventions [77].
From the present results, regarding the intervention strategies applied to improve dietary intake, the implementation of establishment-based interventions is different in the three evaluated settings. Specifically, the strategies that showed higher effectiveness in schools were the addition of healthier menu options combined with on-site support, training for the school canteen staff, performance monitoring and feedback reports (Table 4). However, in the community setting, including after school programs and recreation centers, the provision of monetary incentives, rewards, and recognition for the participating food service are effective, while these methodologies are ineffective in schools.
According to the interventions in the food availability outcome category, none of them were set in workplaces, and little evidence resulted in the community setting [45], whereas effectiveness was reported in the school setting [38,39,41,42,43,45,46,47,48,72]. In schools, regarding the intervention strategies applied for food availability outcomes, the involvement of the participants’ families, namely students and their parents in school-based interventions, through invitations to meetings, activities and the distribution of information letters, was the most effective consumer-based strategy [41,46,72]. Similarly, in a recent review focusing on family-based interventions to improve children’s diets, the family involvement strategy through the provision of information, advice and monitoring was also reported to be effective in improving the food environment of school canteens, demonstrating that parents are an important component when children are targeted [78].
Children’s improvements in food availability are important because their adherence persists in adulthood, whereas unhealthy food availability reinforces children’s preference for nutrient-poor and ultra-processed foods [79]. The increase in healthy food availability in school settings is directly correlated with healthy food purchases, with the final aim of changing children’s dietary intake [80].
On the other hand, the implementation of healthier food availability in the community setting is more difficult due to the barriers stakeholders encounter, such as the lack of demand by customers and the increased cost associated with healthy fresh foods with a short shelf life [81,82,83], but financial support and resources such as guidelines and training from established associations could help achieve such improvements [81]. Thus, future interventions aimed at increasing the availability of healthier food options in community settings should also target an increase in consumers’ demands for healthy meals, as well as assure food services of the low risk of changes in their profits [84].
For the interventions in the food purchase outcome category, partial effectiveness was reported mainly in schools through the implementation of multiple consumer- and establishment-based strategies, including the involvement of participants’ families [25,27,29,46,60,65,66]; thus, family certainly has a good influence on children’s food selection [85].
On the other hand, little evidence about effective strategies in community and workplace settings was apparent in the present systematic review; however, in community settings such as restaurants and food stores, the provision of information and communication to consumers may not be enough to achieve behavior changes such as the selection of healthier food options [26,40], whereas multiple strategies targeting changes in the food environment could be fundamental for improving customers’ food purchases [45].
Moreover, effective consumer- and establishment-based strategies were derived from the included interventions to develop methodological recommendations, by outcome and setting, for the implementation of future restaurant and canteen-based interventions (Table 4). There were some limitations in the present systematic review and meta-analysis. First, the lack of randomized controlled studies in workplace and community settings, such as full-service restaurants, limited the evidence about the adult population and the evaluation of the interventions’ effectiveness. Second, the exclusion of fast-foods and chain restaurants in this systematic review and meta-analysis limited the generalizability of the results to other out-of-home settings, but it allowed us to provide specific recommendations for full-service restaurants and canteens. Third, the lack of enough evidence for the different community settings included, such as after-school programs, restaurants, sporting clubs, and recreation centers, made it difficult to detect differences in intervention strategies. Fourth, none of the included studies were set in low-income countries because of the intervention gap in the literature about middle- and low-income countries [86], limiting the inclusivity of a wider target population. Fifth, in the meta-analysis, the wide heterogeneity of the included studies in terms of outcomes and units of measure, and the huge quantity of different outcomes included, as well as the lack of specific numerical data in the articles, made it difficult to compare interventions and reduced the interventions included. Finally, the quality of most of the included studies was assessed to be of weak quality since the majority had no blinding, poor data collection methods, selection bias or confounders.
5. Conclusions
In conclusion, restaurant- and canteen-based interventions demonstrated effectiveness in the improvement of healthy food intake and in the reduction of fat intake and in increasing healthy menu availability, mainly in school settings. For food purchases, a systematic review showed that interventions could be partially effective in improving healthy foods. However, higher-quality RCTs are needed to strengthen the results. Moreover, intervention strategy recommendations were provided for each outcome assessed to increase the effectiveness of restaurant-based interventions implemented.
Supplementary Materials
The following are available online at https://www.mdpi.com/article/10.3390/nu13041350/s1, Table S1: PRISMA 2009 Checklist; Table S2: Included intervention study results; Table S3: Quality of the included intervention studies; Figure S1: Forest plots of the included intervention meta-analysis.
Author Contributions
Each author has made substantial contributions to the conception or design of the work (F.M., E.L., L.T., R.M.V., R.S.); the acquisition, analysis, or interpretation of data (F.M., E.L., L.T., R.M.V., R.S.); the creation of new software used in the work or has drafted the work or substantively revised it (F.M., E.L., L.T., R.M.V., R.S.). Each author has approved the submitted version (and a version substantially edited by journal staff that involves the author’s contribution to the study) and agrees to be personally accountable for the author’s own contributions and for ensuring that questions related to the accuracy or integrity of any part of the work, even ones in which the author was not personally involved, are appropriately investigated, resolved, and documented in the literature. All authors have read and agreed to the published version of the manuscript.
Funding
This publication has received funding from the European Union’s Horizon 2020 research and innovation program under the Marie Skłodowska-Curie grant agreement No. 713679. This publication has been possible with the support of the Universitat Rovira i Virgili (URV) and Banco Santander.
Acknowledgments
This publication is co-funded by the European Regional Development Fund (ERDF) of the European Union within the framework of the ERDF operative program of Catalonia 2014–2020 aimed at an objective of investment in growth and employment. This publication is framed within the initiative of coordinated PECT TurisTIC en familia, Operation 12: “Healthy Meals”. NFOC-Salut group is a consolidated research group of Generalitat de Catalunya, Spain (2017 SGR522).
Conflicts of Interest
The authors declare no conflict of interest. The funders had no role in the design of the study; in the collection, analyses, or interpretation of data; in the writing of the manuscript, or in the decision to publish the results.
Abbreviations
CG: Control Group; F&V: Fruit and Vegetable; IG: Intervention Group; N/A: Not Available; RCT: Randomized Controlled Trials; RG: Refined Grain; WG: Whole Grain.
References
- Jia, X.; Liu, J.; Chen, B.; Jin, D.; Fu, Z.; Liu, H.; Du, S.; Popkin, B.M.; Mendez, M.A. Differences in nutrient and energy contents of commonly consumed dishes prepared in restaurants v. at home in Hunan Province, China. Public Health Nutr. 2018, 21, 1307–1318. [Google Scholar] [CrossRef]
- Jabs, J.; Devine, C.M. Time scarcity and food choices: An overview. Appetite 2006, 47, 196–204. [Google Scholar] [CrossRef]
- Myhre, J.B.; Loken, E.B.; Wandel, M.; Andersen, L.F. Eating location is associated with the nutritional quality of the diet in Norwegian adults. Public Health Nutr. 2014, 17, 915–923. [Google Scholar] [CrossRef] [PubMed]
- Lake, A.A.; Burgoine, T.; Stamp, E.; Grieve, R. The foodscape: Classification and field validation of secondary data sources across urban/rural and socio-economic classifications in England. Int. J. Behav. Nutr. Phys. Act. 2012, 9, 37. [Google Scholar] [CrossRef] [PubMed]
- Suggs, L.S.; Della Bella, S.; Rangelov, N.; Marques-Vidal, P. Is it better at home with my family? The effects of people and place on children’s eating behavior. Appetite 2018, 121, 111–118. [Google Scholar] [CrossRef]
- Fulkerson, J.A.; Larson, N.; Horning, M.; Neumark-Sztainer, D. A review of associations between family or shared meal frequency and dietary and weight status outcomes across the lifespan. J. Nutr. Educ. Behav. 2014, 46, 2–19. [Google Scholar] [CrossRef] [PubMed]
- Lin, B.; Guthrie, J. Nutritional Quality of Food Prepared at Home and Away from Home, 1977–2008, EIB-105; U.S. Department of Agriculture, Economic Research Service: Washington, DC, USA, 2012.
- Swinburn, B.; Caterson, I.; Seidell, J.; James, W. Diet, nutrition and the prevention of excess weight gain and obesity. Public Health Nutr. 2004, 7, 123–146. [Google Scholar] [CrossRef]
- WHO and FAO Diet, Nutrition, and the Prevention of Chronic Diseases (Report of a joint WHO and FAO Expert Consulation). WHO Tech. Rep. Ser. 2003, 916, 1–160.
- Zang, J.; Luo, B.; Wang, Y.; Zhu, Z.; Wang, Z.; He, X.; Wang, W.; Guo, Y.; Chen, X.; Wang, C.; et al. Eating Out-of-Home in Adult Residents in Shanghai and the Nutritional Differences among Dining Places. Nutrients 2018, 10, 951. [Google Scholar] [CrossRef] [PubMed]
- Penney, T.; Burgoine, T.; Monsivais, P. Relative Density of Away from Home Food Establishments and Food Spend for 24,047 Households in England: A Cross-Sectional Study. Int. J. Environ. Res. Public Health 2018, 15, 2821. [Google Scholar] [CrossRef] [PubMed]
- Patel, A.A.; Lopez, N.V.; Lawless, H.T.; Njike, V.; Beleche, M.; Katz, D.L. Reducing calories, fat, saturated fat, and sodium in restaurant menu items: Effects on consumer acceptance. Obesity 2016, 24, 2497–2508. [Google Scholar] [CrossRef] [PubMed]
- Freedman, M.R.; Brochado, C. Reducing Portion Size Reduces Food Intake and Plate Waste. Obesity 2010, 18, 1864–1866. [Google Scholar] [CrossRef]
- Kerins, C.; McSharry, J.; Hayes, C.; Perry, I.J.; Geaney, F.; Kelly, C. Barriers and facilitators to implementation of menu labelling interventions to support healthy food choices: A mixed methods systematic review protocol. Syst. Rev. 2018, 7, 1–8. [Google Scholar] [CrossRef] [PubMed]
- Unilever Food Solutions World Report Menu: Seductive Nutrition; Unilever Food Solutions: London, UK, 2012; pp. 1–16.
- Hillier-Brown, F.C.; Summerbell, C.D.; Moore, H.J.; Routen, A.; Lake, A.A.; Adams, J.; White, M.; Araujo-Soares, V.; Abraham, C.; Adamson, A.J.; et al. The impact of interventions to promote healthier ready-to-eat meals (to eat in, to take away or to be delivered) sold by specific food outlets open to the general public: A systematic review. Obes. Rev. 2017, 18, 227–246. [Google Scholar] [CrossRef]
- Wright, B.; Bragge, P. Interventions to promote healthy eating choices when dining out: A systematic review of reviews. Br. J. Health Psychol. 2018, 23, 278–295. [Google Scholar] [CrossRef]
- Valdivia Espino, J.N.; Guerrero, N.; Rhoads, N.; Simon, N.-J.; Escaron, A.L.; Meinen, A.; Nieto, F.J.; Martinez-Donate, A.P. Community-Based Restaurant Interventions to Promote Healthy Eating: A Systematic Review. Prev. Chronic Dis. 2015, 12. [Google Scholar] [CrossRef] [PubMed]
- Public Health England. Strategies for Encouraging Healthier ‘O ut of Home’ Food Provision A Toolkit for Local Councils Working with Small Food Businesses; Public Health England: London, UK, 2017.
- Pérez-Rodrigo, C.; Klepp, K.-I.; Yngve, A.; Sjöström, M.; Stockley, L.; Aranceta, J. The school setting: An opportunity for the implementation of dietary guidelines. Public Health Nutr. 2001, 4, 717–724. [Google Scholar] [CrossRef] [PubMed]
- Smith, S.A.; Lake, A.A.; Summerbell, C.; Araujo-Soares, V.; Hillier-Brown, F. The effectiveness of workplace dietary interventions: Protocol for a systematic review and meta-analysis. Syst. Rev. 2016, 5, 1–6. [Google Scholar] [CrossRef] [PubMed]
- Moher, D.; Liberati, A.; Tetzlaff, J.; Altman, D.G.; Altman, D.; Antes, G.; Atkins, D.; Barbour, V.; Barrowman, N.; Berlin, J.A.; et al. Preferred reporting items for systematic reviews and meta-analyses: The PRISMA statement (Chinese edition). J. Chin. Integr. Med. 2009, 7, 889–896. [Google Scholar] [CrossRef]
- Ouzzani, M.; Hammady, H.; Fedorowicz, Z.; Elmagarmid, A. Rayyan QCRI. Available online: Rayyan.ai (accessed on 3 November 2020).
- Methley, A.M.; Campbell, S.; Chew-Graham, C.; McNally, R.; Cheraghi-Sohi, S. PICO, PICOS and SPIDER: A comparison study of specificity and sensitivity in three search tools for qualitative systematic reviews. BMC Health Serv. Res. 2014, 14. [Google Scholar] [CrossRef]
- Delaney, T.; Wyse, R.; Yoong, S.L.; Sutherland, R.; Wiggers, J.; Ball, K.; Campbell, K.; Rissel, C.; Lecathelinais, C.; Wolfenden, L. Cluster randomized controlled trial of a consumer behavior intervention to improve healthy food purchases from online canteens. Am. J. Clin. Nutr. 2017, 106, 1311–1320. [Google Scholar] [CrossRef] [PubMed]
- Ayala, G.X.; Castro, I.A.; Pickrel, J.L.; Lin, S.-F.; Williams, C.B.; Madanat, H.; Jun, H.-J.; Zive, M. A Cluster Randomized Trial to Promote Healthy Menu Items for Children: The Kids’ Choice Restaurant Program. Int. J. Environ. Res. Public Health 2017, 14, 1494. [Google Scholar] [CrossRef] [PubMed]
- Cohen, J.F.W.; Richardson, S.A.; Cluggish, S.A.; Parker, E.; Catalano, P.J.; Rimm, E.B. Effects of Choice Architecture and Chef-Enhanced Meals on the Selection and Consumption of Healthier School Foods. JAMA Pediatr. 2015, 169, 431. [Google Scholar] [CrossRef]
- Thorndike, A.N.; Riis, J.; Levy, D.E. Social norms and financial incentives to promote employees’ healthy food choices: A randomized controlled trial. Prev. Med. 2016, 86, 12–18. [Google Scholar] [CrossRef]
- Habib-Mourad, C.; Ghandour, L.A.; Moore, H.J.; Nabhani-Zeidan, M.; Adetayo, K.; Hwalla, N.; Summerbell, C. Promoting healthy eating and physical activity among school children: Findings from Health-E-PALS, the first pilot intervention from Lebanon. BMC Public Health 2014, 14, 1–11. [Google Scholar] [CrossRef] [PubMed]
- Lugtenberg, M.; Burgers, J.S.; Westert, G.P. Effects of evidence-based clinical practice guidelines on quality of care: A systematic review. Qual. Saf. Health Care 2009, 18, 385–392. [Google Scholar] [CrossRef]
- Yamada, J.; Shorkey, A.; Barwick, M.; Widger, K.; Stevens, B.J. The effectiveness of toolkits as knowledge translation strategies for integrating evidence into clinical care: A systematic review. BMJ Open 2015, 5. [Google Scholar] [CrossRef] [PubMed]
- World Health Organization. Healthy Diet; World Health Organization: Geneva, Switzerland, 2015.
- Dobbs, R.; Sawers, C.; Thompson, F.; Manyika, J.; Woetzel, J.; Child, P.; McKenna, S.; Spatharou, A. Overcoming obesity: An initial economic analysis Discussion paper. McKinsey Glob. Inst. 2014, 1–71. [Google Scholar]
- Chernev, A. Product assortment and consumer choice: An interdisciplinary review. Found. Trends Mark. 2011, 6, 1–61. [Google Scholar] [CrossRef]
- Grant, J.; Hunter, A. Measuring inconsistency in knowledgebases. J. Intell. Inf. Syst. 2006, 27, 159–184. [Google Scholar] [CrossRef]
- Effective Public Health Practice Project. Quality Assessment Tool for Quantitative Studies Component Ratings; Effective Public Health Practice Project: Hamilton, ON, Canada, 1998; pp. 2–5. [Google Scholar]
- Beets, M.W.; Weaver, R.G.; Turner-McGrievy, G.; Huberty, J.; Ward, D.S.; Freedman, D.; Hutto, B.; Moore, J.B.; Beighle, A. Making Healthy Eating Policy Practice: A Group Randomized Controlled Trial on Changes in Snack Quality, Costs, and Consumption in After-School Programs. Am. J. Health Promot. 2016, 30, 521–531. [Google Scholar] [CrossRef] [PubMed]
- Cohen, J.F.W.; Rimm, E.B.; Bryn Austin, S.; Hyatt, R.R.; Kraak, V.I.; Economos, C.D. A food service intervention improves whole grain access at lunch in rural elementary schools. J. Sch. Health 2014, 84, 212–219. [Google Scholar] [CrossRef] [PubMed]
- Grady, A.; Wolfenden, L.; Wiggers, J.; Rissel, C.; Finch, M.; Flood, V.; Salajan, D.; O’Rourke, R.; Stacey, F.; Wyse, R.; et al. Effectiveness of a web-based menu-planning intervention to improve childcare service compliance with dietary guidelines: Randomized controlled trial. J. Med. Internet Res. 2020, 22, 1–16. [Google Scholar] [CrossRef]
- Martínez-Donate, A.P.; Riggall, A.J.; Meinen, A.M.; Malecki, K.; Escaron, A.L.; Hall, B.; Menzies, A.; Garske, G.; Nieto, F.J.; Nitzke, S. Evaluation of a pilot healthy eating intervention in restaurants and food stores of a rural community: A randomized community trial. BMC Public Health 2015, 15. [Google Scholar] [CrossRef] [PubMed]
- Nathan, N.; Yoong, S.L.; Sutherland, R.; Reilly, K.; Delaney, T.; Janssen, L.; Robertson, K.; Reynolds, R.; Chai, L.K.; Lecathelinais, C.; et al. Effectiveness of a multicomponent intervention to enhance implementation of a healthy canteen policy in Australian primary schools: A randomised controlled trial. Int. J. Behav. Nutr. Phys. Act. 2016, 13, 1–9. [Google Scholar] [CrossRef] [PubMed]
- Nik Rosmawati, N.H.; Wan Manan, W.M.; Noor Izani, N.J.; Nik Nurain, N.H.; Razlina, A.R. Impact of food nutrition intervention on food handlers’ knowledge and competitive food serving: A randomized controlled trial. Int. Food Res. J. 2017, 24, 1046–1056. [Google Scholar]
- Seward, K.; Wolfenden, L.; Finch, M.; Wiggers, J.; Wyse, R.; Jones, J.; Yoong, S.L. Improving the implementation of nutrition guidelines in childcare centres improves child dietary intake: Findings of a randomised trial of an implementation intervention. Public Health Nutr. 2018, 21, 607–617. [Google Scholar] [CrossRef]
- De Souza, R.A.G.; Mediano, M.F.F.; de Moura Souza, A.; Sichieri, R. Reducing the use of sugar in public schools: A randomized cluster trial. Rev. Saude Publica 2013, 47. [Google Scholar] [CrossRef]
- Wolfenden, L.; Kingsland, M.; Rowland, B.C.; Dodds, P.; Gillham, K.; Yoong, S.L.; Sidey, M.; Wiggers, J. Improving availability, promotion and purchase of fruit and vegetable and non sugar-sweetened drink products at community sporting clubs: A randomised trial. Int. J. Behav. Nutr. Phys. Act. 2015, 12, 35. [Google Scholar] [CrossRef] [PubMed]
- Wolfenden, L.; Nathan, N.; Janssen, L.M.; Wiggers, J.; Reilly, K.; Delaney, T.; Williams, C.M.; Bell, C.; Wyse, R.; Sutherland, R.; et al. Multi-strategic intervention to enhance implementation of healthy canteen policy: A randomised controlled trial. Implement. Sci. 2017, 12, 6. [Google Scholar] [CrossRef]
- Yoong, S.L.; Nathan, N.; Wolfenden, L.; Reilly, K.; Janssen, L.; Preece, S.; Butler, P.; Wiggers, J.; Sutherland, R.; Delaney, T.; et al. CAFÉ: A multicomponent audit and feedback intervention to improve implementation of healthy food policy in primary school canteens: A randomised controlled trial. Int. J. Behav. Nutr. Phys. Act. 2016, 13, 1–11. [Google Scholar] [CrossRef] [PubMed]
- Story, M.; Snyder, M.P.; Anliker, J.; Weber, J.L.; Cunningham-Sabo, L.; Stone, E.J.; Chamberlain, A.; Ethelbah, B.; Suchindran, C.; Ring, K. Changes in the nutrient content of school lunches: Results from the Pathways study. Prev. Med. 2003, 37, S35–S45. [Google Scholar] [CrossRef]
- Haerens, L.; Deforche, B.; Maes, L.; Cardon, G.; Stevens, V.; De Bourdeaudhuij, I. Evaluation of a 2-year physical activity and healthy eating intervention in middle school children. Health Educ. Res. 2006, 21, 911–921. [Google Scholar] [CrossRef] [PubMed]
- Lassen, A.D.; Thorsen, A.V.; Sommer, H.M.; Fagt, S.; Trolle, E.; Biltoft-Jensen, A.; Tetens, I. Improving the diet of employees at blue-collar worksites: Results from the Food at Work intervention study. Public Health Nutr. 2010, 14, 965–974. [Google Scholar] [CrossRef]
- Muzaffar, H.; Nikolaus, C.J.; Ogolsky, B.G.; Lane, A.; Liguori, C.; Nickols-Richardson, S.M. Promoting Cooking, Nutrition, and Physical Activity in Afterschool Settings. Am. J. Health Behav. 2019, 43, 1050–1063. [Google Scholar] [CrossRef]
- Lee, R.M.; Giles, C.M.; Cradock, A.L.; Emmons, K.M.; Okechukwu, C.; Kenney, E.L.; Thayer, J.; Gortmaker, S.L. Impact of the Out-of-School Nutrition and Physical Activity (OSNAP) Group Randomized Controlled Trial on Children’s Food, Beverage, and Calorie Consumption among Snacks Served. J. Acad. Nutr. Diet. 2018, 118, 1425–1437. [Google Scholar] [CrossRef] [PubMed]
- Anderson, A.S.; Porteous, L.E.G.; Foster, E.; Higgins, C.; Stead, M.; Hetherington, M.; Ha, M.-A.; Adamson, A.J. The impact of a school-based nutrition education intervention on dietary intake and cognitive and attitudinal variables relating to fruits and vegetables. Public Health Nutr. 2005, 8, 650–656. [Google Scholar] [CrossRef]
- Ochoa-Avilés, A.; Verstraeten, R.; Huybregts, L.; Andrade, S.; Van Camp, J.; Donoso, S.; Ramírez, P.L.; Lachat, C.; Maes, L.; Kolsteren, P. A school-based intervention improved dietary intake outcomes and reduced waist circumference in adolescents: A cluster randomized controlled trial. Nutr. J. 2017, 16, 1–12. [Google Scholar] [CrossRef]
- Siega-Riz, A.M.; El Ghormli, L.; Mobley, C.; Gillis, B.; Stadler, D.; Hartstein, J.; Volpe, S.L.; Virus, A.; Bridgman, J. The effects of the HEALTHY study intervention on middle school student dietary intakes. Int. J. Behav. Nutr. Phys. Act. 2011, 8. [Google Scholar] [CrossRef] [PubMed]
- Trude, A.C.B.; Surkan, P.J.; Cheskin, L.J.; Gittelsohn, J. A multilevel, multicomponent childhood obesity prevention group-randomized controlled trial improves healthier food purchasing and reduces sweet-snack consumption among low-income African-American youth. Nutr. J. 2018, 17, 96. [Google Scholar] [CrossRef]
- Warren, J.M.; Henry, C.J.K.; Lightowler, H.J.; Bradshaw, S.M.; Perwaiz, S. Evaluation of a pilot school programme aimed at the prevention of obesity in children. Health Promot. Int. 2003, 18, 287–296. [Google Scholar] [CrossRef] [PubMed]
- Yoong, S.L.; Grady, A.; Seward, K.; Finch, M.; Wiggers, J.; Lecathelinais, C.; Wedesweiler, T.; Wolfenden, L. The Impact of a Childcare Food Service Intervention on Child Dietary Intake in Care: An Exploratory Cluster Randomized Controlled Trial. Am. J. Health Promot. 2019, 33, 991–1001. [Google Scholar] [CrossRef] [PubMed]
- Yoong, S.L.; Grady, A.; Wiggers, J.H.; Stacey, F.G.; Rissel, C.; Flood, V.; Finch, M.; Wyse, R.; Sutherland, R.; Salajan, D.; et al. Child-level evaluation of a web-based intervention to improve dietary guideline implementation in childcare centers: A cluster-randomized controlled trial. Am. J. Clin. Nutr. 2020, 111, 854–863. [Google Scholar] [CrossRef]
- Bogart, L.M.; Cowgill, B.O.; Elliott, M.N.; Klein, D.J.; Hawes-Dawson, J.; Uyeda, K.; Elijah, J.; Binkle, D.G.; Schuster, M.A. A randomized controlled trial of Students for Nutrition and exercise: A community-based participatory research study. J. Adolesc. Health 2014, 55, 415–422. [Google Scholar] [CrossRef]
- Webb, K.L.; Solomon, L.S.; Sanders, J.; Akiyama, C.; Crawford, P.B. Menu labeling responsive to consumer concerns and shows promise for changing patron purchases. J. Hunger Environ. Nutr. 2011, 6, 166–178. [Google Scholar] [CrossRef]
- Bell, A.C.; Davies, L.; Francis, J.L.; Finch, M.; Wiggers, J.; Sutherland, R.; Wolfenden, L. An implementation intervention to encourage healthy eating in centre-based child-care services: Impact of the Good for Kids Good for Life programme. Public Health Nutr. 2014, 18, 1610–1619. [Google Scholar] [CrossRef] [PubMed]
- Burgess-Champoux, T.L.; Chan, H.W.; Rosen, R.; Marquart, L.; Reicks, M. Healthy whole-grain choices for children and parents: A multi-component school-based pilot intervention. Public Health Nutr. 2008, 11, 849–859. [Google Scholar] [CrossRef] [PubMed]
- Geaney, F.; Kelly, C.; Di Marrazzo, J.S.; Harrington, J.M.; Fitzgerald, A.P.; Greiner, B.A.; Perry, I.J. The effect of complex workplace dietary interventions on employees’ dietary intakes, nutrition knowledge and health status: A cluster controlled trial. Prev. Med. 2016, 89, 76–83. [Google Scholar] [CrossRef] [PubMed]
- Quinn, E.L.; Johnson, D.B.; Podrabsky, M.; Saelens, B.E.; Bignell, W.; Krieger, J. Effects of a behavioral economics intervention on food choice and food consumption in middle-school and high- school cafeterias. Prev. Chronic Dis. 2018, 15. [Google Scholar] [CrossRef]
- Bogart, L.M.; Elliott, M.N.; Uyeda, K.; Hawes-Dawson, J.; Klein, D.J.; Schuster, M.A. Preliminary healthy eating outcomes of SNaX, a pilot community-based intervention for adolescents. J. Adolesc. Health 2011, 48, 196–202. [Google Scholar] [CrossRef] [PubMed]
- Williams, C.L.; Bollella, M.C.; Strobino, B.A.; Spark, A.; Nicklas, T.A.; Tolosi, L.B.; Pittman, B.P. “Healthy-start”: Outcome of an intervention to promote a heart healthy diet in preschool children. J. Am. Coll. Nutr. 2002, 21, 62–71. [Google Scholar] [CrossRef] [PubMed]
- Kenney, E.L.; Gortmaker, S.L.; Carter, J.E.; Howe, M.C.W.; Reiner, J.F.; Cradock, A.L. Grab a cup, fill it up! An intervention to promote the 1 of drinking water and increase student water consumption during school lunch. Am. J. Public Health 2015, 105, 1777–1783. [Google Scholar] [CrossRef]
- Taylor, J.C.; Zidenberg-Cherr, S.; Linnell, J.D.; Feenstra, G.; Scherr, R.E. Impact of a multicomponent, school-based nutrition intervention on students’ lunchtime fruit and vegetable availability and intake: A pilot study evaluating the Shaping Healthy Choices Program. J. Hunger Environ. Nutr. 2018, 13, 415–428. [Google Scholar] [CrossRef]
- Giles, C.M.; Kenney, E.L.; Gortmaker, S.L.; Lee, R.M.; Thayer, J.C.; Mont-Ferguson, H.; Cradock, A.L. Increasing water availability during afterschool snack: Evidence, strategies, and partnerships from a group randomized trial. Am. J. Prev. Med. 2012, 43, S136–S142. [Google Scholar] [CrossRef] [PubMed]
- Wyse, R.; Gabrielyan, G.; Wolfenden, L.; Yoong, S.; Swigert, J.; Delaney, T.; Lecathelinais, C.; Ooi, J.Y.; Pinfold, J.; Just, D. Can changing the position of online menu items increase selection of fruit and vegetable snacks? A cluster randomized trial within an online canteen ordering system in Australian primary schools. Am. J. Clin. Nutr. 2019, 109, 1422–1430. [Google Scholar] [CrossRef] [PubMed]
- Morshed, A.B.; Davis, S.M.; Keane, P.C.; Myers, O.B.; Mishra, S.I. The Impact of the CHILE Intervention on the Food Served in Head Start Centers in Rural New Mexico. J. Sch. Health 2016, 86, 414–423. [Google Scholar] [CrossRef] [PubMed][Green Version]
- Stroebele, N.; De Castro, J.M. Effect of ambience on food intake and food choice. Nutrition 2004, 20, 821–838. [Google Scholar] [CrossRef] [PubMed]
- McMorrow, L.; Ludbrook, A.; Macdiarmid, J.I.; Olajide, D. Perceived barriers towards healthy eating and their association with fruit and vegetable consumption. J. Public Health 2017, 39, 330–338. [Google Scholar] [CrossRef]
- Amore, L.; Buchthal, O.V.; Banna, J.C. Identifying perceived barriers and enablers of healthy eating in college students in Hawai’i: A qualitative study using focus groups. BMC Nutr. 2019, 5, 1–11. [Google Scholar] [CrossRef] [PubMed]
- Amine, E.K.; Baba, N.H.; Belhadj, M.; Deurenberg-Yap, M.; Djazayery, A.; Forrestre, T.; Galuska, D.A.; Herman, S.; James, W.P.T.; M’Buyamba Kabangu, J.R.; et al. Diet, nutrition and the prevention of chronic diseases. World Health Organ. Tech. Rep. Ser. 2003. [Google Scholar] [CrossRef]
- Ni Mhurchu, C.; Aston, L.; Jebb, S. Effects of worksite health promotion interventions on employee diets: A systematic review. BMC Public Health 2010, 10, 62. [Google Scholar] [CrossRef] [PubMed]
- Black, A.P.; D’Onise, K.; McDermott, R.; Vally, H.; O’Dea, K. How effective are family-based and institutional nutrition interventions in improving children’s diet and health? A systematic review. BMC Public Health 2017, 17, 1–19. [Google Scholar] [CrossRef]
- Baker, P.; Friel, S. Food systems transformations, ultra-processed food markets and the nutrition transition in Asia. Global. Health 2016, 12. [Google Scholar] [CrossRef]
- Clinton-McHarg, T.; Janssen, L.; Delaney, T.; Reilly, K.; Regan, T.; Nathan, N.; Wiggers, J.; Yoong, S.L.; Wyse, R.; Grady, A.; et al. Availability of food and beverage items on school canteen menus and association with items purchased by children of primary-school age. Public Health Nutr. 2018, 21, 2907–2914. [Google Scholar] [CrossRef]
- Young, K.; Kennedy, V.; Kingsland, M.; Sawyer, A.; Rowland, B.; Wiggers, J.; Wolfenden, L. Healthy food and beverages in senior community football club canteens in New South Wales, Australia. Health Promot. J. Aust. 2012, 23, 149–152. [Google Scholar] [CrossRef] [PubMed]
- Economos, C.D.; Folta, S.C.; Goldberg, J.; Hudson, D.; Collins, J.; Baker, Z.; Lawson, E.; Nelson, M. A community-based restaurant initiative to increase availability of healthy menu options in somerville, Massachusetts: Shape up somerville. Prev. Chronic Dis. 2009, 6, 1–8. [Google Scholar]
- Kim, M.; Budd, N.; Batorsky, B.; Krubiner, C.; Manchikanti, S.; Waldrop, G.; Trude, A.; Gittelsohn, J. Barriers to and Facilitators of Stocking Healthy Food Options: Viewpoints of Baltimore City Small Storeowners. Ecol. Food Nutr. 2017, 56, 17–30. [Google Scholar] [CrossRef] [PubMed]
- Boelsen-Robinson, T.; Blake, M.R.; Backholer, K.; Hettiarachchi, J.; Palermo, C.; Peeters, A. Implementing healthy food policies in health services: A qualitative study. Nutr. Diet. 2019, 76, 336–343. [Google Scholar] [CrossRef] [PubMed]
- Taylor, J.P.; Evers, S.; McKenna, M. Determinants of Healthy Eating in Children and Youth. Can. J. Public Health 2005, 96 (Suppl. 3), S22–S29. [Google Scholar] [CrossRef]
- Mendes, L.L.; Pessoa, M.C.; Duarte, C.K. Comments on the Article: “Food Environment Research in Low- and Middle-Income Countries: A Systematic Scoping Review”. Adv. Nutr. 2020, 11, 1044–1045. [Google Scholar] [CrossRef]


Publisher’s Note: MDPI stays neutral with regard to jurisdictional claims in published maps and institutional affiliations. |
© 2021 by the authors. Licensee MDPI, Basel, Switzerland. This article is an open access article distributed under the terms and conditions of the Creative Commons Attribution (CC BY) license (https://creativecommons.org/licenses/by/4.0/).