
Association of Protein Intake during the Second Year of Life with Weight Gain-Related Outcomes in Childhood: A Systematic Review

 , , ,
, , ,
Abstract
1. Introduction
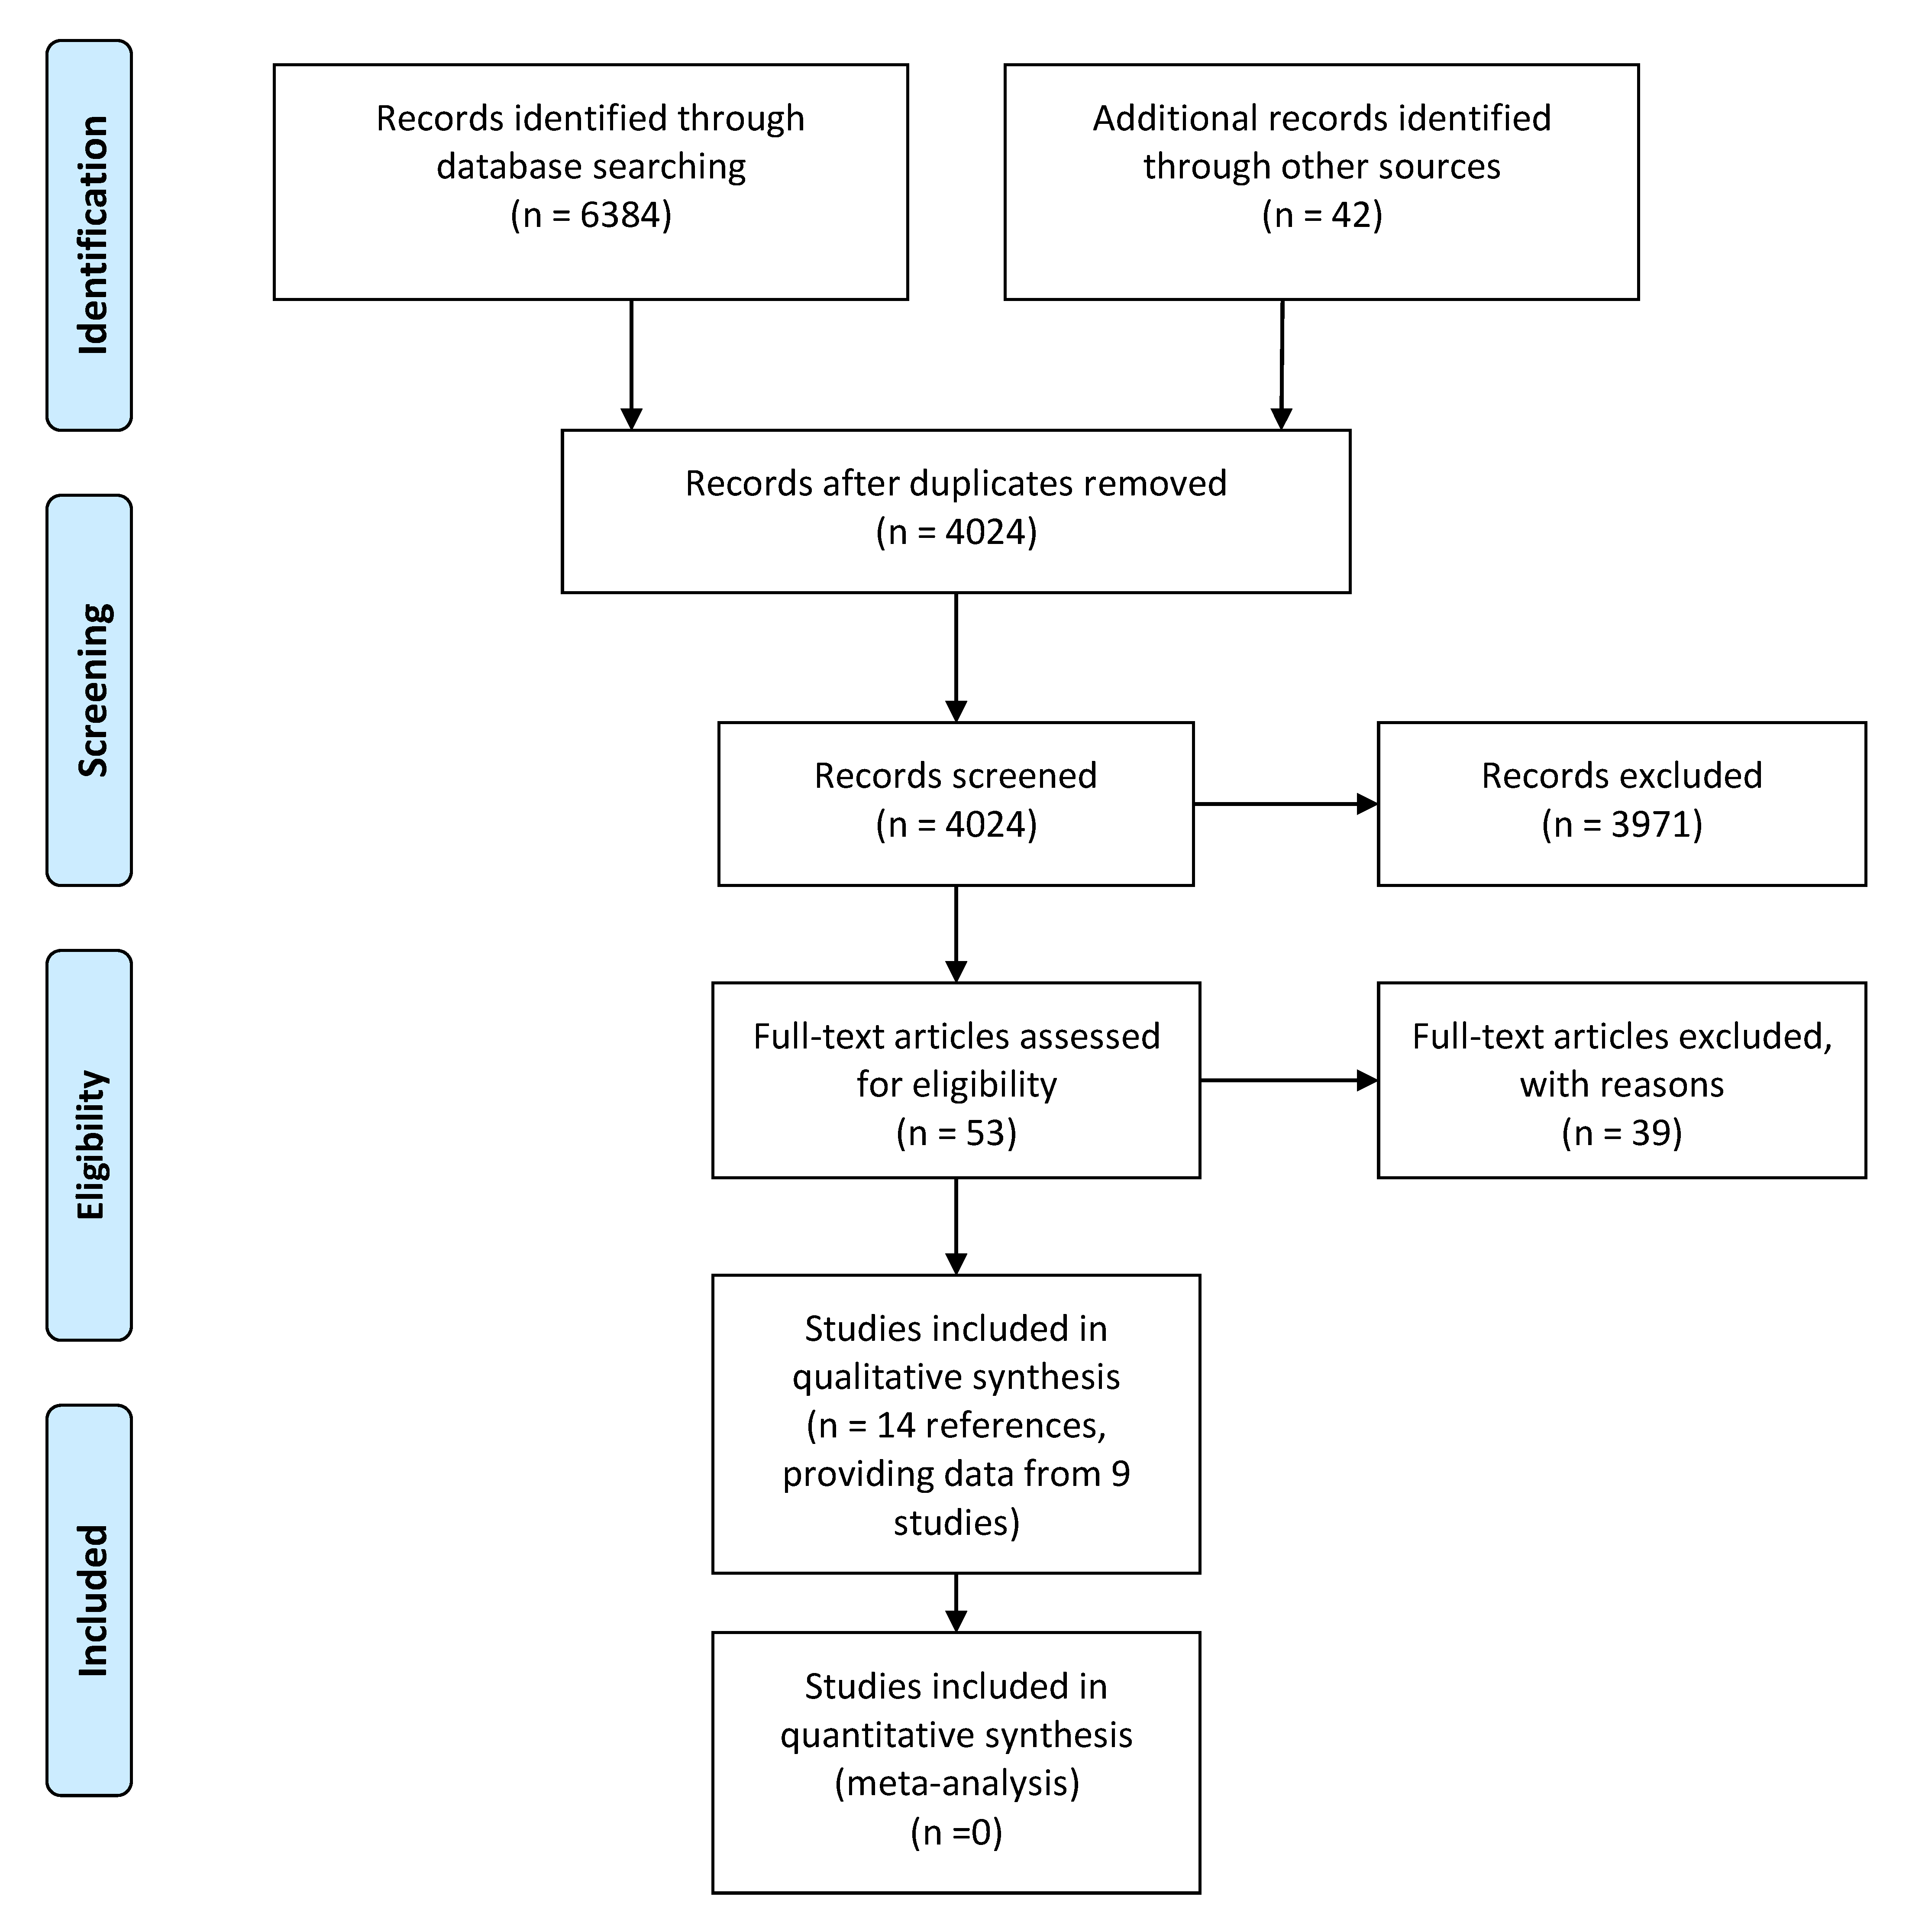
2. Materials and Methods
- All the fatness measurement approaches (like subcutaneous skinfolds (millimeters), % body fat (%BF), fat mass (FM) (kilograms), or fat mass index (FMI) (kilograms/meter2),
- Body mass index (BMI) (kilograms/meter2 or z-score), and
- Risk of excessive weight (overweight and obesity risks) (RR, OR, or frequency).
- Weight gain velocity (grams/month, z-scores or those that classified as rapid or normal growth), and
- Adiposity rebound (age in months or BMI at the adiposity rebound onset).
3. Results
3.1. Effects of Protein Intake on Fatness
3.1.1. Included Studies
3.1.2. Results
3.1.3. Conclusions
3.2. Effects of Total Protein Intake on BMI
3.2.1. Included Studies
3.2.2. Results
3.2.3. Conclusions
3.3. Effects of Total Protein Intake on Later Obesity Risk
3.3.1. Included Studies
3.3.2. Results
3.3.3. Conclusions
3.4. Effects of Protein Intake on Rapid Weight Gain (Secondary Outcome)
3.4.1. Included Studies
3.4.2. Results
3.4.3. Conclusions
3.5. Effects of Total Protein Intake on Adiposity Rebound (Secondary Outcome)
3.5.1. Included Studies
3.5.2. Results
3.5.3. Conclusions
4. Discussion
4.1. Effect of Protein Intake during the Second Year of Life on Body Composition
4.2. Effect of Protein Intake during the Second Year of Life on Body Mass Index
4.3. Effect of Protein Intake during the Second Year of Life on Later Obesity Risk
4.4. Effect of Protein Intake during the Second Year of Life: Outcomes Potentially Related with the Mechanism Inducing Increased Obesity Risk
4.5. Limitations for the Present Systematic Review
4.6. “Importance for Public Health: A Window for Prevention”
Author Contributions
Funding
Conflicts of Interest
Appendix A
- Search: early protein intake Filters: Clinical Trial, Review, English, Spanish, from 1000/1/1-2020/5/31(“early”[All Fields] AND (“protein s”[All Fields] OR “proteinous”[All Fields] OR “proteins”[MeSH Terms] OR “proteins”[All Fields] OR “protein”[All Fields]) AND (“intake”[All Fields] OR “intake s”[All Fields] OR “intakes”[All Fields])
- Search: protein intake Filters: Clinical Trial, Review, English, Spanish, Child: birth−18 years, from 1000/1/1-2020/5/31(“protein s”[All Fields] OR “proteinous”[All Fields] OR “proteins”[MeSH Terms] OR “proteins”[All Fields] OR “protein”[All Fields]) AND (“intake”[All Fields] OR “intake s”[All Fields] OR “intakes”[All Fields])
- EARLY PROTEIN INTAKE (12 Cochrane reviews + 776 trials)
- PROTEIN INTAKE (51 Cochrane reviews + 10891 trials)AND [children OR child OR infancy] (18 Cochrane reviews + 1161 trials)

| Reference | Reasons for the Exclusion |
|---|---|
| Abrams 2015 [11] | Not focused on protein intake during the second year of life |
| Agostoni 2005 [21] | Narrative review |
| Agostoni 2013 [55] | Narrative review |
| Alles 2014 [56] | Narrative review |
| Andersen 1979 [57] | Health outcomes associated to protein intake at the same timepoint (beyond 2 years) |
| Atkin 2000 [58] | Age of the assessed population is from 1.5 to 4.5 years. Data specifically from the second year of life was not reported. Outcomes related with current intake. |
| Berkey 2000 [59] | Not focused in any of the analyzed outcomes |
| Boulton 1995 [60] | Protein intake not assessed before 8 years |
| Bute 2000 [61] | Protein intake was only measured at 12 and 24 months, not during the second year of life. Health outcomes associated to protein intake at the same timepoint (beyond 2 years) |
| Campbell 2013 [62] | No data about protein intake (only specific food items) |
| Deheeger 1996 [63] | They did not report any association between protein intake and the health outcomes |
| Grote 2014 [64] | Narrative review |
| Guardamagna 2012 [65] | Narrative review |
| Gunther 2010 [66] | Not focused in any of the analyzed outcomes |
| Haschke 2019 [67] | Narrative review |
| Hoppu 2013 [68] | Health outcomes associated to protein intake at the same timepoint (beyond 2 years) |
| Hörnell 2013 [14] | Not focused on protein intake during the second year of life |
| Kourlaba 2008 [69] | Health outcomes associated to protein intake at the same timepoint (beyond 2 years) |
| Larnkjaer 2012 [15] | Narrative review |
| Lind 2016 [70] | Narrative review |
| Manios 2008 [71] | Health outcomes associated to protein intake at the same timepoint (beyond 2 years) |
| Michaelsen 2012 [72] | Narrative review |
| Michaelsen 2014 [73] | Narrative review |
| Morgan 2004 [74] | They did not evaluate the effect of protein intake beyond the 12 months of life on the assessed outcomes |
| O’Sullivan 2016 [75] | No data about protein intake (only specific food items) |
| Patro-Golab 2016A [53] | Not focused on protein intake during the second year of life |
| Patro-Golab 2016B [76] | Not focused on protein intake during the second year of life |
| Pearce 2013 [55] | Not focused on protein intake during the second year of life |
| Redsell 2015 [77] | Not focused on protein intake during the second year of life |
| Rolland-Cachera 2013 [78] | Outcomes measured only in adulthood (20 years of age) |
| Rolland-Cachera 2016 [79] | Narrative review |
| Ruel 1995 [80] | No data about protein intake reported |
| Santos 2015 [81] | No data about protein intake reported |
| Switkowski 2019 [82] | Protein intake assessed at a mean age of 3 years. Data specifically from the second year of life was not reported. |
| Tang 2018 [9] | Narrative review |
| Van Vught 2009 [83] | Health outcomes associated to protein intake at the same timepoint (beyond 2 years) |
| Voortman 2015 [84] | Not focused on protein intake during the second year of life |
| Weker 2019 [85] | They did not report any association between protein intake and the health outcomes |
| Yang 2013 [86] | Narrative review |
Appendix B
| Reference/Type of Bias | Selection Bias | Information Bias | Follow-up Bias | Confusion Bias | Evidence |
|---|---|---|---|---|---|
| Gunther 2007A [32] | low | low | moderate | low | 2+ |
| Gunther 2007B [33] | low | low | moderate | low | 2+ |
| Karaolis-Danckert 2007 [34] | low | low | moderate | low | 2+ |
| Rolland-Cachera 1995 [31] | moderate | low | high | unknown | 2- |
| Cowin 2001 [35] | moderate | low | high | 2- | |
| Garden 2011 [36] | low | low | moderate | low | 2+ |
| Garden 2012 [37] | low | low | high | moderate | 2- |
| Ohlund 2010 [38] | low | low | high | low | 2+ |
| Morgen 2018 [41] | low | high | high | low | 2- |
| Dorosty 2000 [44] | low | low | low | high | 2+ |
| Gunther 2006 [45] | moderate | low | unknown | low | 2+ |
| Pimpin 2016 [39] | low | low | low | low | 2++ |
| Beyerlein 2017 [42] | low | low | moderate | low | 2+ |
| Reference/Type of Bias | Selection Bias | Performance Bias | Detection Bias | Attrition Bias | Reporting Bias | Evidence |
|---|---|---|---|---|---|---|
| Wall 2019 [30] | low | low | low | low | low | 1+ |
References
- World Health Organization. The Optimal Duration of Exclusive Breastfeeding: Report of an Expert Consultation; WHO: Geneva, Switzerland, 2001. [Google Scholar]
- Alexy, U.; Kersting, M.; Sichert-Hellert, W.; Manz, F.; Schöch, G. Macronutrient Intake of 3- to 36-Month-Old German Infants and Children: Results of the DONALD Study. Ann. Nutr. Metab. 1999, 43, 14–22. [Google Scholar] [CrossRef]
- Koletzko, B. Early nutrition and its later consequences: New opportunities. Perinatal nutrition programmes adult health. In Advances in Experimental Medicine and Biology; Springer Science and Business Media: Berlin/Heidelberg, Germany, 2005; pp. 1–12. [Google Scholar]
- Melnik, B.C. Milk—A Nutrient System of Mammalian Evolution Promoting mTORC1-Dependent Translation. Int. J. Mol. Sci. 2015, 16, 17048–17087. [Google Scholar] [CrossRef] [PubMed]
- Koletzko, B.; Demmelmair, H.; Grote, V.; Totzauer, M. Optimized protein intakes in term infants support physiological growth and promote long-term health. Semin. Perinatol. 2019, 43, 151153. [Google Scholar] [CrossRef] [PubMed]
- Harder, T.; Bergmann, R.; Kallischnigg, G.; Plagemann, A. Duration of Breastfeeding and Risk of Overweight: A Meta-Analysis. Am. J. Epidemiol. 2005, 162, 397–403. [Google Scholar] [CrossRef] [PubMed]
- Arenz, S.; Rückerl, R.; Koletzko, B.; Von Kries, R. Breast-feeding and childhood obesity—a systematic review. Int. J. Obes. 2004, 28, 1247–1256. [Google Scholar] [CrossRef]
- Koletzko, B.; Von Kries, R.; Closa, R.; Escribano, J.; Scaglioni, S.; Giovannini, M.; Beyer, J.; Demmelmair, H.; Gruszfeld, D.; Dobrzanska, A.; et al. Lower protein in infant formula is associated with lower weight up to age 2 y: A randomized clinical trial. Am. J. Clin. Nutr. 2009, 89, 1836–1845. [Google Scholar] [CrossRef]
- Tang, M. Protein Intake during the First Two Years of Life and Its Association with Growth and Risk of Overweight. Int. J. Environ. Res. Public Health 2018, 15, 1742. [Google Scholar] [CrossRef]
- Totzauer, M.; Luque, V.; Escribano, J.; Closa-Monasterolo, R.; Verduci, E.; ReDionigi, A.; Hoyos, J.; Langhendries, J.; Gruszfeld, D.; Socha, P.; et al. Effect of Lower Versus Higher Protein Content in Infant Formula through the First Year on Body Composition from 1 to 6 Years: Follow-Up of a Randomized Clinical Trial. Obesity 2018, 26, 1203–1210. [Google Scholar] [CrossRef] [PubMed]
- Abrams, S.A.; Hawthorne, K.M.; Pammi, M. A systematic review of controlled trials of lower-protein or energy-containing infant formulas for use by healthy full-term infants. Adv. Nutr. 2015, 6, 178–188. [Google Scholar] [CrossRef]
- Inostroza, J.; Haschke, F.; Steenhout, P.; Grathwohl, D.; Nelson, S.E.; Ziegler, E.E. Low-Protein Formula Slows Weight Gain in Infants of Overweight Mothers. J. Pediatr. Gastroenterol. Nutr. 2014, 59, 70–77. [Google Scholar] [CrossRef]
- Weber, M.; Grote, V.; Closa-Monasterolo, R.; Escribano, J.; Langhendries, J.-P.; Dain, E.; Giovannini, M.; Verduci, E.; Gruszfeld, D.; Socha, P.; et al. Lower protein content in infant formula reduces BMI and obesity risk at school age: Follow-up of a randomized trial. Am. J. Clin. Nutr. 2014, 99, 1041–1051. [Google Scholar] [CrossRef] [PubMed]
- Hörnell, A.; Lagström, H.; Lande, B.; Thorsdottir, I. Protein intake from 0 to 18 years of age and its relation to health: A systematic literature review for the 5th Nordic Nutrition Recommendations. Food Nutr. Res. 2013, 57, 14. [Google Scholar] [CrossRef] [PubMed]
- Larnkjær, A.; Mølgaard, C.; Michaelsen, K.F. Early nutrition impact on the insulin-like growth factor axis and later health consequences. Curr. Opin. Clin. Nutr. Metab. Care 2012, 15, 285–292. [Google Scholar] [CrossRef] [PubMed]
- Grenov, B.; Larnkjaer, A.; Lee, R.; Serena, A.; Molgaard, C.; Michaelsen, K.F.; Manary, M.J. Circulating insulin-like growth factor-1 is positively associated with growth and cognition in 6- to 9-year-old school children from Ghana. J. Nutr. 2020, 50, 1405–1412. [Google Scholar] [CrossRef]
- Koletzko, B.; Beyer, J.; Brands, B.; Demmelmair, H.; Grote, V.; Haile, G.; Gruszfeld, D.; Rzehak, P.; Socha, P.; Weber, M.M. Early Influences of Nutrition on Postnatal Growth. Issues Complementary Feed. 2013, 71, 12–27. [Google Scholar] [CrossRef]
- Kirchberg, F.F.; Harder, U.U.; Weber, M.; Grote, V.; Demmelmair, H.; Peissner, W.W.; Rzehak, P.; Xhonneux, A.; Carlier, C.C.; Ferre, N.N.; et al. Dietary Protein Intake Affects Amino Acid and Acylcarnitine Metabolism in Infants Aged 6 Months. J. Clin. Endocrinol. Metab. 2015, 100, 149–158. [Google Scholar] [CrossRef] [PubMed]
- Socha, P.; Grote, V.; Gruszfeld, D.; Janas, R.; Demmelmair, H.; Closa-Monasterolo, R.; Subías, J.E.; Scaglioni, S.; Verduci, E.; Dain, E.; et al. Milk protein intake, the metabolic-endocrine response, and growth in infancy: Data from a randomized clinical trial. Am. J. Clin. Nutr. 2011, 94, 1776S–1784S. [Google Scholar] [CrossRef]
- Agostoni, C.; Riva, E.; Giovannini, M. Complementary Food: International Comparison on Protein and Energy Requirement/Intakes. Protein Energy Requir. Infancy Child. 2006, 58, 147–159. [Google Scholar]
- Agostoni, C.; Scaglioni, S.; Ghisleni, D.; Verduci, E.; Giovannini, M.; Riva, E. How much protein is safe? Int. J. Obes. 2005, 29, S8–S13. [Google Scholar] [CrossRef]
- Damianidi, L.; Gruszfeld, D.; Verduci, E.; Vecchi, F.; Xhonneux, A.; Langhendries, J.P.; Luque, V.; Theurich, M.A.; Zaragoza-Jordana, M.; Koletzko, B.; et al. Protein intake and source during complementary feeding and growth up to 6 years of age, secondary data evaluation from the European Childhood Obesity Project. J. Pediatr. Gastroenterol. Nutr. 2016, 62, 693–694. [Google Scholar]
- Suthutvoravut, U.; Abiodun, P.O.; Chomtho, S.; Chongviriyaphan, N.; Cruchet, S.; Davies, P.S.; Fuchs, G.J.; Gopalan, S.; Van Goudoever, J.B.; Nel, E.D.L.R.; et al. Composition of Follow-Up Formula for Young Children Aged 12-36 Months: Recommendations of an International Expert Group Coordinated by the Nutrition Association of Thailand and the Early Nutrition Academy. Ann. Nutr. Metab. 2015, 67, 119–132. [Google Scholar] [CrossRef]
- Koletzko, B.; Demmelmair, H.; Grote, V.; Prell, C.; Weber, M. High protein intake in young children and increased weight gain and obesity risk. Am. J. Clin. Nutr. 2016, 103, 303–304. [Google Scholar] [CrossRef]
- Skouteris, H.; Nagle, C.; Fowler, M.; Kent, B.; Sahota, P.; Morris, H. Interventions Designed to Promote Exclusive Breastfeeding in High-Income Countries: A Systematic Review. Breastfeed. Med. 2014, 9, 113–127. [Google Scholar] [CrossRef]
- Johnston, M.L.; Esposito, N. Barriers and Facilitators for Breastfeeding Among Working Women in the United States. J. Obstet. Gynecol. Neonatal Nurs. 2007, 36, 9–20. [Google Scholar] [CrossRef]
- Abbott, J.; Carty, J.; Batig, A.L. Infant Feeding Practices, Workplace Breastfeeding/Lactation Practices, and Perception of Unit/Service Support Among Primiparous Active Duty Servicewomen. Mil. Med. 2019, 184, e315–e320. [Google Scholar] [CrossRef] [PubMed]
- Theurich, M.A.; Davanzo, R.; Busck-Rasmussen, M.; Díaz-Gómez, N.M.; Brennan, C.; Kylberg, E.; Bærug, A.; McHugh, L.; Weikert, C.; Abraham, K.; et al. Breastfeeding rates and programs in europe: A survey of 11 national breastfeeding committees and representatives. J. Pediatr. Gastroenterol. Nutr. 2019, 68, 400–407. [Google Scholar] [CrossRef]
- Harbour, R.; Miller, J. A new system for grading recommendations in evidence based guidelines. BMJ 2001, 323, 334–336. [Google Scholar] [CrossRef] [PubMed]
- Wall, C.R.; Hill, R.J.; Lovell, A.L.; Matsuyama, M.; Milne, T.; Grant, C.C.; Jiang, Y.; Chen, R.; Wouldes, T.A.; Davies, P.S.W. A multicenter, double-blind, randomized, placebo-controlled trial to evaluate the effect of consuming Growing Up Milk “Lite” on body composition in children aged 12–23 mo. Am. J. Clin. Nutr. 2019, 109, 576–585. [Google Scholar] [CrossRef]
- Rolland-Cachera, M.F.; Deheeger, M.; Akrout, M.; Bellisle, F. Influence of macronutrients on adiposity development: A follow up study of nutrition and growth from 10 months to 8 years of age. Int. J. Obes. Relat. Metab. Disord. J. Int. Assoc. Study Obes. 1995, 19, 573–578. [Google Scholar]
- Günther, A.L.B.; Buyken, A.E.; Kroke, A. Protein intake during the period of complementary feeding and early childhood and the association with body mass index and percentage body fat at 7 y of age. Am. J. Clin. Nutr. 2007, 85, 1626–1633. [Google Scholar] [CrossRef]
- Günther, A.L.B.; Remer, T.; Kroke, A.; Buyken, A.E. Early protein intake and later obesity risk: Which protein sources at which time points throughout infancy and childhood are important for body mass index and body fat percentage at 7 y of age? Am. J. Clin. Nutr. 2007, 86, 1765–1772. [Google Scholar] [CrossRef]
- Karaolis-Danckert, N.; Günther, A.L.B.; Kroke, A.; Hornberg, C.E.; Buyken, A. How early dietary factors modify the effect of rapid weight gain in infancy on subsequent body-composition development in term children whose birth weight was appropriate for gestational age. Am. J. Clin. Nutr. 2007, 86, 1700–1708. [Google Scholar] [CrossRef] [PubMed]
- Cowin, I.S.; the ALSPAC Study Team; Emmett, P.M. Associations between dietary intakes and blood cholesterol concentrations at 31 months. Eur. J. Clin. Nutr. 2001, 55, 39–49. [Google Scholar] [CrossRef] [PubMed][Green Version]
- Garden, F.L.; Marks, G.B.; Almqvist, C.; Simpson, J.M.; Webb, K.L. Infant and early childhood dietary predictors of overweight at age 8 years in the CAPS population. Eur. J. Clin. Nutr. 2011, 65, 454–462. [Google Scholar] [CrossRef] [PubMed]
- Garden, F.L.; Marks, G.B.; Simpson, J.M.; Webb, K.L. Body Mass Index (BMI) Trajectories from Birth to 11.5 Years: Relation to Early Life Food Intake. Nutrients 2012, 4, 1382–1398. [Google Scholar] [CrossRef] [PubMed]
- Öhlund, I.; Hernell, O.; Hörnell, A.; Stenlund, H.; Lind, T. BMI at 4 years of age is associated with previous and current protein intake and with paternal BMI. Eur. J. Clin. Nutr. 2009, 64, 138–145. [Google Scholar] [CrossRef] [PubMed]
- Pimpin, L.; Jebb, S.; Johnson, L.; Wardle, J.; Ambrosini, G.L. Dietary protein intake is associated with body mass index and weight up to 5 y of age in a prospective cohort of twins1. Am. J. Clin. Nutr. 2015, 103, 389–397. [Google Scholar] [CrossRef]
- Van Jaarsveld, C.H.M.; Johnson, L.; Llewellyn, C.; Wardle, J. Gemini: A UK Twin Birth Cohort with a Focus on Early Childhood Weight Trajectories, Appetite and the Family Environment. Twin Res. Hum. Genet. 2010, 13, 72–78. [Google Scholar] [CrossRef]
- Morgen, C.S.; Ängquist, L.; Baker, J.L.; Andersen, A.-M.N.; Sørensen, T.I.A.; Michaelsen, K.F. Breastfeeding and complementary feeding in relation to body mass index and overweight at ages 7 and 11 y: A path analysis within the Danish National Birth Cohort. Am. J. Clin. Nutr. 2018, 107, 313–322. [Google Scholar] [CrossRef]
- Beyerlein, A.; Uusitalo, U.M.; Virtanen, S.M.; Vehik, K.; Yang, J.; Winkler, C.; Kersting, M.; Koletzko, S.; Schatz, D.; Aronsson, C.A.; et al. Intake of Energy and Protein is Associated with Overweight Risk at Age 5.5 Years: Results from the Prospective TEDDY Study. Obesity 2017, 25, 1435–1441. [Google Scholar] [CrossRef] [PubMed]
- Beyerlein, A.; Liu, X.; Uusitalo, U.M.; Harsunen, M.; Norris, J.M.; Foterek, K.; Virtanen, S.M.; Rewers, M.J.; She, J.-X.; Simell, O.; et al. Dietary intake of soluble fiber and risk of islet autoimmunity by 5 y of age: Results from the TEDDY study. Am. J. Clin. Nutr. 2015, 102, 345–352. [Google Scholar] [CrossRef] [PubMed]
- Dorosty, A.R.; Emmett, P.M.; Reilly, J.J.; ALSPAC Study Team. Factors Associated with Early Adiposity Rebound. Paediatrica 2000, 105, 1115–1118. [Google Scholar] [CrossRef]
- Günther, A.L.B.; Buyken, A.E.; Kroke, A.; Günther, A.L.B. The influence of habitual protein intake in early childhood on BMI and age at adiposity rebound: Results from the DONALD Study. Int. J. Obes. 2006, 30, 1072–1079. [Google Scholar] [CrossRef] [PubMed]
- Ong, K.K.; Loos, R.J.F. Rapid infancy weight gain and subsequent obesity: Systematic reviews and hopeful suggestions. Acta Paediatr. 2006, 95, 904–908. [Google Scholar] [CrossRef]
- Monteiro, P.O.A.; Victora, C.G. Rapid growth in infancy and childhood and obesity in later life-A systematic review. Obes. Rev. 2005, 6, 143–154. [Google Scholar] [CrossRef]
- Baird, J.; Fisher, D.; Lucas, P.; Kleijnen, J.; Roberts, H.; Law, C. Being big or growing fast: Systematic review of size and growth in infancy and later obesity. BMJ 2005, 331, 929. [Google Scholar] [CrossRef]
- Weber, M.; Luque, V.; Escribano, J.; Closa, R.; Verduci, E.; ReDionigi, A.; Hoyos, J.; Langhendries, J.P.; Gruszfeld, D.; Socha, P.; et al. Effect of early protein supply on body fat deposition during infancy and childhood: A randomized trial. J. Pediatr. Gastroenterol. Nutr. 2016, 62, 668–669. [Google Scholar]
- Escribano, J.; for the European Childhood Obesity Trial Study Group; Luque, V.; Ferré, N.; Mendez-Riera, G.; Koletzko, B.; Grote, V.; Demmelmair, H.; Bluck, L.; Wright, A.; et al. Effect of protein intake and weight gain velocity on body fat mass at 6 months of age: The EU Childhood Obesity Programme. Int. J. Obes. 2012, 36, 548–553. [Google Scholar] [CrossRef]
- Villamor, E.; Jansen, E.C. Nutritional Determinants of the Timing of Puberty. Annu. Rev. Public Health 2016, 37, 33–46. [Google Scholar] [CrossRef] [PubMed]
- Closa-Monasterolo, R.; Ferré, N.; Luque, V.; Zaragoza-Jordana, M.; Grote, V.; Weber, M.; Koletzko, B.; Socha, P.; Gruszfeld, D.; Janas, R.; et al. Sex differences in the endocrine system in response to protein intake early in life. Am. J. Clin. Nutr. 2011, 94, 1920S–1927S. [Google Scholar] [CrossRef]
- Patro-Gołąb, B.; Zalewski, B.M.; Kouwenhoven, S.M.P.; Karaś, J.; Koletzko, B.; Van Goudoever, J.B.; Szajewska, H. Protein Concentration in Milk Formula, Growth, and Later Risk of Obesity: A Systematic Review. J. Nutr. 2016, 146, 551–564. [Google Scholar] [CrossRef] [PubMed]
- Pearce, J.; Langley-Evans, S.C. The types of food introduced during complementary feeding and risk of childhood obesity: A systematic review. Int. J. Obes. 2013, 37, 477–485. [Google Scholar] [CrossRef]
- Agostoni, C.; Baselli, L.; Mazzoni, M.B. Early nutrition patterns and diseases of adulthood: A plausible link? Eur. J. Intern. Med. 2013, 24, 5–10. [Google Scholar] [CrossRef] [PubMed]
- Alles, M.; Eussen, S.R.; Van Der Beek, E.M. Nutritional Challenges and Opportunities during the Weaning Period and in Young Childhood. Ann. Nutr. Metab. 2014, 64, 284–293. [Google Scholar] [CrossRef] [PubMed]
- Andersen, E.; Lifschitz, C. Dietary habits and serum lipids during first 4 years of life: A study of 95 Danish children. Acta Paediatr. Scand. 1979, 68, 165–170. [Google Scholar] [CrossRef]
- Atkin, L.-M.; Davies, P.S. Diet composition and body composition in preschool children. Am. J. Clin. Nutr. 2000, 72, 15–21. [Google Scholar] [CrossRef]
- Berkey, C.S.; Gardner, J.D.; Frazier, A.L.; Colditz, G.A. Relation of Childhood Diet and Body Size to Menarche and Adolescent Growth in Girls. Am. J. Epidemiol. 2000, 152, 446–452. [Google Scholar] [CrossRef]
- Boulton, T.; Magarey, A.M.; Cockington, R.A. Serum lipids and apolipoproteins from 1 to 15 years: Changes with age and puberty, and relationships with diet, parental cholesterol and family history of ischaemic heart disease. Acta Paediatr. 1995, 84, 1113–1118. [Google Scholar] [CrossRef]
- Butte, N.F.; Wong, W.W.; Hopkinson, J.M.; Smith, E.O.; Ellis, K.J. Infant Feeding Mode Affects Early Growth and Body Composition. Pediatrics 2000, 106, 1355–1366. [Google Scholar] [CrossRef]
- Campbell, K.J.; Lioret, S.; McNaughton, S.A.; Crawford, D.A.; Salmon, J.; Ball, K.; McCallum, Z.; Gerner, B.E.; Spence, A.C.; Cameron, A.J.; et al. A parent-focused intervention to reduce infant obesity risk behaviors: A randomized trial. Pediatrics 2013, 131, 652–660. [Google Scholar] [CrossRef]
- Deheeger, M.; Akrout, M.; Bellisle, F.; Rossignol, C.; Rolland-Cachera, M.-F. Individual patterns of food intake development in children: A 10 months to 8 years of age follow-up study of nutrition and growth. Physiol. Behav. 1996, 59, 403–407. [Google Scholar] [CrossRef]
- Grote, V.; Theurich, M. Complementary feeding and obesity risk. Curr. Opin. Clin. Nutr. Metab. Care 2014, 17, 273–277. [Google Scholar] [CrossRef] [PubMed]
- Guardamagna, O.; Abello, F.; Cagliero, P.; Iughetti, L. Impact of nutrition since early life on cardiovascular prevention. Ital. J. Pediatr. 2012, 38, 73. [Google Scholar] [CrossRef] [PubMed]
- Günther, A.L.B.; Karaolis-Danckert, N.; Kroke, A.; Remer, T.; Buyken, A.E. Dietary Protein Intake throughout Childhood Is Associated with the Timing of Puberty. J. Nutr. 2009, 140, 565–571. [Google Scholar] [CrossRef] [PubMed]
- Haschke, F.; Binder, C.; Huber-Dangl, M.; Haiden, N. Early-Life Nutrition, Growth Trajectories, and Long-Term Outcome. Nestle Nutr. Inst. Workshop Ser. 2019, 90, 107–120. [Google Scholar] [CrossRef] [PubMed]
- Hoppu, U.; Isolauri, E.; Koskinen, P.; Laitinen, K. Diet and blood lipids in 1–4 year-old children. Nutr. Metab. Cardiovasc. Dis. 2013, 23, 980–986. [Google Scholar] [CrossRef]
- Kourlaba, G.; Pitsiladis, Y.P.; Lagou, V.; Grammatikaki, E.; Moran, C.N.; Kondaki, K.; Roma-Giannikou, E.; Manios, Y. Interaction effects between total energy and macronutrient intakes and angiotensin-converting enzyme 1 (ACE) I/D polymorphism on adiposity-related phenotypes in toddlers and preschoolers: The Growth, Exercise and Nutrition Epidemiological Study in preSchoolers (GENESIS). Br. J. Nutr. 2008, 100, 1333–1340. [Google Scholar] [CrossRef]
- Lind, M.V.; Larnkjær, A.; Mølgaard, C.; Michaelsen, K.F. Dietary protein intake and quality in early life: Impact on growth and obesity. Curr. Opin. Clin. Nutr. Metab. Care. 2017, 20, 71–76. [Google Scholar] [CrossRef] [PubMed]
- Manios, Y.; Grammatikaki, E.; Papoutsou, S.; Liarigkovinos, T.; Kondakis, K.; Moschonis, G. Nutrient Intakes of Toddlers and Preschoolers in Greece: The GENESIS Study. J. Am. Diet. Assoc. 2008, 108, 357–361. [Google Scholar] [CrossRef]
- Michaelsen, K.F.; Larnkjær, A.; Mølgaard, C. Amount and quality of dietary proteins during the first two years of life in relation to NCD risk in adulthood. Nutr. Metab. Cardiovasc. Dis. 2012, 22, 781–786. [Google Scholar] [CrossRef]
- Michaelsen, K.F.; Greer, F.R. Protein needs early in life and long-term health. Am. J. Clin. Nutr. 2014, 99, 718S–722S. [Google Scholar] [CrossRef]
- Morgan, J.; Taylor, A.; Fewtrell, M. Meat Consumption is Positively Associated with Psychomotor Outcome in Children up to 24 Months of Age. J. Pediatr. Gastroenterol. Nutr. 2004, 39, 493–498. [Google Scholar] [CrossRef]
- O’Sullivan, A.; Fitzpatrick, N.; Doyle, O. Effects of early intervention on dietary intake and its mediating role on cognitive functioning: A randomised controlled trial. Public Health Nutr. 2016, 20, 154–164. [Google Scholar] [CrossRef]
- Patro-Gołąb, B.; Zalewski, B.M.; Kołodziej, M.; Kouwenhoven, S.; Poston, L.; Godfrey, K.M.; Koletzko, B.; Van Goudoever, J.B.; Szajewska, H. Nutritional interventions or exposures in infants and children aged up to 3 years and their effects on subsequent risk of overweight, obesity and body fat: A systematic review of systematic reviews. Obes. Rev. 2016, 17, 1245–1257. [Google Scholar] [CrossRef] [PubMed]
- Redsell, S.A.; Edmonds, B.; Swift, J.A.; Siriwardena, A.N.; Weng, S.; Nathan, D.; Glazebrook, C. Systematic review of randomised controlled trials of interventions that aim to reduce the risk, either directly or indirectly, of overweight and obesity in infancy and early childhood. Matern. Child Nutr. 2016, 12, 24–38. [Google Scholar] [CrossRef]
- Rolland-Cachera, M.F.; Maillot, M.; Deheeger, M.; Souberbielle, J.C.; Péneau, S.; Hercberg, S. Association of nutrition in early life with body fat and serum leptin at adult age. Int. J. Obes. 2012, 37, 1116–1122. [Google Scholar] [CrossRef]
- Rolland-Cachera, M.F.; Akrout, M.; Péneau, S. Nutrient Intakes in Early Life and Risk of Obesity. Int. J. Environ. Res. Public Health 2016, 13, 564. [Google Scholar] [CrossRef]
- Ruel, M.T.; Rivera, J.; Habicht, J.P.; Martorell, R. Differential response to early nutrition supplementation: Long-term effects on height at adolescence. Int. J. Epidemiol. 1995, 24, 404–412. [Google Scholar] [CrossRef] [PubMed]
- Santos, I.S.; Matijasevich, A.; Assunção, M.C.F.; Valle, N.C.; Horta, B.L.; Gonçalves, H.D.; Gigante, D.P.; Martines, J.C.; Pelto, G.; Victora, C.G.; et al. Promotion of weight gain in early childhood does not increase metabolic risk in adolescents: A 15-year follow-up of a cluster-randomized controlled trial. J. Nutr. 2015, 145, 2749–2755. [Google Scholar] [CrossRef] [PubMed]
- Switkowski, K.M.; Jacques, P.F.; Must, A.; Fleisch, A.; Oken, E. Associations of protein intake in early childhood with body composition, height, and insulin-like growth factor I in mid-childhood and early adolescence. Am. J. Clin. Nutr. 2019, 109, 1154–1163. [Google Scholar] [CrossRef]
- Van Vught, A.J.; Heitmann, B.L.; Nieuwenhuizen, A.G.; Veldhorst, M.A.; Brummer, R.-J.M.; Westerterp-Plantenga, M.S. Association between dietary protein and change in body composition among children (EYHS). Clin. Nutr. 2009, 28, 684–688. [Google Scholar] [CrossRef]
- Voortman, T.; Vitezova, A.; Bramer, W.M.; Ars, C.L.; Bautista-Niño, P.K.; Buitrago-López, A.; Felix, J.F.; Leermakers, E.T.M.; Sajjad, A.; Sedaghat, S.; et al. Effects of protein intake on blood pressure, insulin sensitivity and blood lipids in children: A systematic review. Br. J. Nutr. 2015, 113, 383–402. [Google Scholar] [CrossRef] [PubMed]
- Weker, H.; Brudnicka, E.; Barańska, M.; Rowicka, G.; Strucińska, M.; Więch, M.; Dyląg, H.; Klemarczyk, W.; Socha, P.; Mazur, J. Dietary Patterns of Children Aged 1-3 Years in Poland in Two Population Studies. Ann. Nutr. Metab. 2019, 75, 66–76. [Google Scholar] [CrossRef] [PubMed]
- Yang, Z.; Huffman, S.L. Nutrition in pregnancy and early childhood and associations with obesity in developing countries. Matern. Child Nutr. 2013, 9, 105–119. [Google Scholar] [CrossRef] [PubMed]

| Studies Assessing the Effect of Protein Intake during the Second Year of Life on Later Fatness in Childhood | ||||||
|---|---|---|---|---|---|---|
| Reference | Study Design | Sample Population | Protein Intake Assessment | Assessed Outcomes | Effects and Comments | Study Quality |
| Wall 2019 [30] | RCT Gumli (NewZeland) Control: Cow’s milk (3.1 g protein/100 mL) Intervention: Growing up formula (1.7 g protein/100 mL) During second year of life | 1 year ± 2 weeks healthy infants (>32S G) n = 160 allocated n = 134 analyzed | Total protein from 24 h recall and FFQ at 19, 20, 22, and 23 months. Mean of the protein intake from the four assessments |
| After one year of intervention consuming a Growing up milk formula with lower protein content, the intervention group showed a reduction in FMI = 0.45 kg/m2 (p = 0.026) and a reduction in fat mass = 2.1% (p = 0.047) compared to the control group (cow’s milk) at 2 years of age. | 1+ 17% drop-outs rate Low biases |
| Rolland-Cachera 1995 [31] | Cohort ELANCE Study (France) | Healthy infants recruited at 10 months of life n = 278 recruited n = 112 analyzed at 8 years | Total protein from interview (dietary history method) and 24 h recall at 2 years Protein intakes classified as high (H) (highest quartile), low (L) (lowest quartile), or medium (M) (second and third). |
| Protein intake (% energy from proteins) at 2 years of age was directly correlated with subscapular skinfold at 8 years (r = 0.20, p = 0.04). | 2− High drop-outs rate (59%), lack of information about inclusion and exclusion criteria or sample characteristics |
| Gunther 2007A [32] | Cohort DONALD (Germany) | Healthy infants (3–6 months at recruitment) n > 1100 recruited; n = 322 followed until the age of 7 years (singleton, term, and birth weight > 2500 g); n = 203 analyzed (all data available) | Total protein from 3-day weighed food diaries at 6, 12, 18, and 24 months. Protein intakes classified as high (H, highest 2 quartiles) or low (L, lowest 2 quartiles) in the first year (6 and 12 months) and then during the second year (12 plus 18–24 months). Comparison: H-L vs. H-H groups (high protein intakes sustained during 2 years vs. only the first year). |
| The group with sustained higher protein intake during the first 2 years of life (H-H group) had 16% higher body fat at 7 years of age compared with the group with higher protein intake only during the first year (H-L group). The OR for overfatness at 7 years was 2.28 (95% CI: 1.06, 4.88; p = 0.03) in the H-H compared to the H-L group | 2+ Low biases except for a moderate risk of follow-up bias |
| Gunther 2007B [33] | Cohort DONALD (Germany) | Healthy infants (3–6 months at recruitment) n > 1100 recruited; n = 322 followed until the age of 7 years (singleton, term, and birth weight >2500 g); n = 203 analyzed (all data available) | Total, animal, plant, and dairy protein intake from 3-day weighed food diaries at 6, 12, 18–24 months, 3–4 years, 5–6 years |
| Protein intake (total, animal, plant, or dairy protein) (% energy from proteins) during the second year of life was not associated with %BF at 7 years. | 2+ Low biases except for a moderate risk of follow-up bias |
| Karolis-Danckert 2007 [34] | Cohort DONALD (Germany) | Healthy infants (3–6 months at recruitment) n > 1100 recruited; n = 408 followed until the age of 5 years (singleton, term, and birth weight >2500 g); n = 249 analyzed (all data available) | Total protein from 3-day food diaries at 12, 18, and 24 months. Protein intakes classified as high (H, highest 2 quartiles) or low (L, lowest 2 quartiles) for first year (12 months) and during the second year (12 plus 18–24 months). Comparison: L-L, L-H, H-L, and H-H (2 years of sustained high intakes vs. 2 years of low intakes vs. high intakes either the first or second year) groups. |
| Protein intake during the 2nd year of life modulated BF% at 2 years (β = 0.67 ± 0.31, p = 0.03 for the H-H group compared to the H-L) but had no effect on the longitudinal change of %BF between 2 and 5 years. Children with rapid growth (0–2 years) exhibited thicker skinfolds, higher %BF (16.7% vs. 18.0%, p = 0.02), and higher overfatness risk at 5 years (17% vs. 7%, p = 0.02). However, linear mixed models showed that the association between rapid weight gain and %BF trajectories from 2 to 5 years was influenced by exclusive breastfeeding or %fat intake but not by protein intake during the second year of life. | 2+ Low biases except for a moderate risk of follow-up bias |
| Studies Assessing the Effect of Protein Intake during the Second Year of Life on Later BMI z-Score | ||||||
| Reference | Study Design | Sample Population | Protein Intake Assessment | Assessed Outcomes | Effects and Comments | Study Quality |
| Gunther 2007A [32] | Cohort DONALD (Germany) | Healthy infants (3–6 months at recruitment) n > 1100 recruited; n = 322 followed until the age of 7 years (singleton, term, and birth weight >2500 g); n = 203 analyzed (all data available) | Total protein from 3-day weighed food diaries at 6, 12, 18, and 24 months. Protein intakes classified as high (H, highest 2 quartiles) or low (L, lowest 2 quartiles) for first year (6 and 12 months) and during the second year (12 plus 18–24). Comparison: H-L vs. H-H groups. |
| Sustained high protein intake during the first 2 years of life (H-H group) was associated with an increase of BMI z-score at 7 years (β = 0.37; p = 0.04) compared to having high protein intake only during the first year (H-L group). | 2+ Low biases except for a moderate risk of follow-up bias |
| Gunther 2007B [33] | Cohort DONALD (Germany) | Healthy infants (3–6 months at recruitment) n > 1100 recruited; n = 322 followed until the age of 7 years (singleton, term, and birth weight >2500 g); n = 203 analyzed (all data available) | Total, animal, plant, and dairy protein intake from 3-day weighed food diaries at 6, 12, 18–24 months, 3–4 y, and 5–6 y |
| Protein intake (total, animal, plant, or dairy protein) (% energy from proteins) during the second year of life did not affect BMI-z-score at 7 years. | 2+ Low biases except for a moderate risk of follow-up bias |
| Karolis-Danckert 2007 [34] | Cohort DONALD (Germany) | Healthy infants (3–6 months at recruitment) n > 1100 recruited; n = 408 followed until the age of 5 years (singleton, term, and birth weight >2500 g); n = 249 analzsed (all data available) | Total protein from 3-day weighed food diaries at 12, 18, and 24 months. Protein intakes classified as high (H, highest 2 quartiles) or low (L, lowest 2 quartiles) for first year (12 months) and during the second year (12 plus 18–24 months). Comparison: L-L, L-H, H-L, and H-H (2 years of sustained high intakes vs. 2 years of low intakes vs. high intakes either the first or second year) groups. |
| Children with rapid growth (0–2 years) exhibited higher BMI z-score (−0.016 ± 0.99 vs. 0.41 ± 0.90, p < 0.001) at 5 years. However, the distribution of children with rapid growth was similar between groups of sustained or not high protein intakes during the first 2 years (H-H vs. H-L). Sustained higher protein intake during the first 2 years of life was modulating BMI z-score at 2 years (β = 0.36 ± 0.13, p = 0.005 for the H-H group compared to the H-L) but had no effect on the longitudinal change of BMI z-score between 2 and 5 years. | 2+ Low biases except for a moderate risk of follow-up bias |
| Cowin 2001 [35] | Cohort ALSPAC (UK) | General population (recruited during pregnancy) n = 889 (≈10% randomly selected subsample from total sample); n = 389 analyzed (all data available) | Total protein from 3-day food diaries at 18 months |
| Protein intake at 18 months of age was not associated with changes in BMI z-score at 31 months but was associated with height (r = 0.176) | 2− High drop-out rates (56%), adjustment for confounding factors not done. |
| Garden 2011 [36] | Cohort CAPS (Australia) Secondary analysis of an RCT (intervention: dust mite avoidance and omega-3 fatty acids supplementation) | Infants with asthma risk due to 1st degree relative’s affectation, recruited during pregnancy n = 362 (from total sample, n = 616) | Total protein from 3-day weighed food diaries at 18 months |
| Protein intake (g/day) at 18 months of age was associated with higher BMI z-score at 8 years (10 g/day of protein intake was associated to a BMI z-score increase in BMI ≈ 0.47 SD. Meat intake was also associated with BMI z-score and waist circumference at 8 years. | 2+ Moderate risk of follow up bias |
| Garden 2012 [37] | Cohort CAPS (Australia) Secondary analysis of an RCT (intervention: dust mite avoidance and omega-3 fatty acid supplementation) | Infants with asthma risk due to 1st degree relative’s affectation, recruited during pregnancy n = 616 recruited n = 370 analyzed | Total protein from 3-day weighed food diaries at 18 months |
| Different BMI sex-specific growth trajectories (normal, early persistent increase, and late increase) till the age of 11.5 years were not associated with different protein intakes at 18 months of age. | 2− High risk of follow-up bias (drop-outs = 52%), adjustment for some relevant confounders not done (i.e., smoking). |
| Ohlund 2010 [38] | Cohort Sweden | Healthy infants (6–18 months at recruitment) n = 300 recruited n = 127 analyzed at age 4 years | Total protein from 5-day food diaries at 12, 17–18 months, and 4 years |
| Protein intake at age 17–18 months (gr/day and % from energy) was associated with changes in BMI z-score at 4 years (β = 0.05, p = 0.001 per each gr/day of protein intake or β = 0.14, p = 0.029 per 1% energy from protein intake). | 2+ Low biases except for a high risk of follow-up bias (drop-outs = 66%) |
| Pimpin 2016 [39] | Cohort Gemini (twins, UK) | Twins cohort (recruited at 8.0 ± 2.2 months) n = 2435 recruited; n = 2154 analyzed The cohort included a 43.5% of preterms [40] | Total protein from 3-day food diaries between 17 and 34 months (mean 21 ± 1.2 months) |
| Protein intake at age 21 months was associated with higher later BMI z-score (1% of energy from protein associated with BMI = 0.04 SD increase) between 3 and 5 years. Protein intake at 21 months in the top 2 quintiles (>16.3% from energy) was associated with increased BMI z-score between 3 and 5 years, compared with the lowest quintile (β = 0.323, 95%CI 0.115–0.531). | 2++ Relative high cohort sample with low biases |
| Rolland-Cachera 1995 [31] | Cohort ELANCE Study (France) | Healthy infants Healthy infants recruited at 10 months of life n = 278 recruited; n = 222 followed until 4 years; n = 112 = analyzed at 8 years | Total protein from interview (dietary history method) at 2 years Protein intakes classified as high (H) (highest quartile), low (L) (lowest quartile), or medium (M) (second and third). |
| Protein intake (% energy from proteins) at age 2 years was directly correlated with BMI at 8 years (r = 0.22, p = 0.03). Infants in the highest quintile of protein intake at 2 years showed an earlier AR and higher increase of BMI after 4 years, showing higher BMI at 8 years | 2− High drop-outs rate (59%), lack of information about inclusion and exclusion criteria or sample characteristics |
| Morgen 2018 [41] | Cohort Danish National birth Cohort (DNBC) (Denmark) | General population (recruited during pregnancy) n = 36481 at 7 years n = 22047 at 11 years (from a total sample of 77,251) | Total, meat/fish and dairy protein from interview at 18 months |
| Protein intake from dairy products at 18 months (per 5 g/day) increased BMI z-score at 7 years (β: 0.012, 95% CI: 0.003,0.021; p = 0.007) Protein intake from meat and fish at 18 months (per 2 g/day) increased BMI = 0.010SD (95% CI: 0.004, 0.017; p = 0.003) or 0.013 (95% CI: 0.005, 0.020; p = 0.002) at 7 and 11 years, respectively. | 2− High drop-outs rate (72%). Very little information about dietary recording. Anthropometric data at 7 and 11 years reported by parents. |
| Studies Assessing the Effect of Protein Intake during the Second Year of Life on Later Excessive Weight Risk | ||||||
| Reference | Study Design | Sample Population | Protein Intake Assessment | Assessed Outcomes | Effects and Comments | Study Quality |
| Gunther 2007A [32] | Cohort DONALD (Germany) | Healthy infants (3–6 months at recruitment) n > 1100 recruited; n = 322 followed until the age of 7 years (singleton, term, and birth weight >2500 g); n = 203 analyzed (all data available) | Total protein from 3-day weighed food diaries at 6, 12, 18, and 24 months. Protein intakes classified as high (H, highest 2 quartiles) or low (L, lowest 2 quartiles) for first year (6 and 12 months) and during the second year (12 plus 18–24). Comparison: H-L vs. H-H groups. |
| Sustained high protein intake during the first 2 years of life (H-H group) was associated with a twofold increase of excessive weight at 7 years of age compared with having high intake only during the first year (H-L group). Overweight risk at 7 years, OR: 2.39 (95% CI: 1.14, 4.99; p = 0.02) in the H-H group compared to H-L | 2+ Low biases except for a moderate risk of follow-up bias |
| Karolis-Danckert 2007 [34] | Cohort DONALD (Germany) | Healthy infants (3–6 months at recruitment) n > 1100 recruited; n = 408 followed until the age of 5 years (singleton, term, and birth weight >2500 g); n = 249 analyzed (all data available) | Total protein from 3-day weighed food diaries at 12, 18, and 24 months. Protein intakes classified as high (H, highest 2 quartiles) or low (L, lowest 2 quartiles) for first year (12 months) and during the second year (12 plus 18–24 months). Comparison: L-L, L-H, H-L, and H-H (2 years of sustained high intakes vs. 2 years of low intakes vs. high intakes in either the first or second year) groups. |
| Children with rapid growth (0–2 years) had increased overweight risk (27% vs. 15%, p = 0.003) at 5 years compared to children without rapid growth. | 2+ Low biases except for a moderate risk of follow-up bias |
| Pimpin 2016 [39] | Cohort Gemini (twins, UK) | Twins cohort (recruited at 8.0 ± 2.2 months) n = 2435 recruited; n = 2154 analyzed The cohort included 43.5% preterms [40] | Total protein from 3-day food diaries assessed at an age range between 17 and 34 months (mean 21 ± 1.2 months) |
| Protein intake at 21 ± 1.2 months was associated with a trend of increased risk of overweight or obesity at 3 years (OR: 1.10, 95%CI 0.99–1.22, p = 0.075) that was not present at 5 years of age. | 2++ Relative high cohort sample with low biases |
| Beyerlein 2017 [42] | Cohort TEDDY Study (Multicentric: USA, Germany, Finland, Sweden) | Healthy newborns with diabetes genetic risk by HLA screening n = 5563 (from a total n = 8676 enrolled) As described in bibliography, at 5 years a total of 80 children developed diabetes [43] | Total protein from 24 h recalls at 3 months or 3-day food diaries twice per year onwards (12, 18, 24, 30, 36 months, etc.) |
| Protein intake during the second year of life (1–2 years) was not associated with changes in overweight or obesity risk at 5.5 years. | 2+ Moderate risk due to 35% drop-outs rate |
| Studies Assessing the Effect of Protein Intake during the Second Year of Life on Adiposity Rebound (Age and BMI in the Onset) (Secondary Outcome) | ||||||
| Reference | Study Design | Sample Population | Protein Intake Assessment | Assessed Outcomes | Effects and Comments | Study Quality |
| Rolland-Cachera 1995 [31] | Cohort ELANCE Study (France) | Healthy infants n = 278 recruited; n = 222 followed until 4 years; n = 112 analyzed at 8 years (from n = 222) | Total protein from interview (dietary history method) at 2 years Protein intakes classified as high (H) (highest quartile), low (L) (lowest quartile), or medium (M) (second and third). |
| Protein intake (% energy from proteins) at 2 years of age was inversely correlated with age at the AR onset (r = −0.2, p = 0.02). Children with an early AR (before 4 years) had higher protein intake at 2 years compared with those children showing a late AR (after 8 years) (16.6 ± 2.1% vs. 14.9 ± 2.1%, p < 0.01). Infants in the highest quintile of protein intake at 2 years showed an earlier AR and higher increase of BMI after 4 years, showing higher BMI at 8 years | 2- High drop-out rates (59%), lack of information about inclusion and exclusion criteria or sample characteristics |
| Dorosty 2000 [44] | Cohort ALSPAC (UK) | General population (recruited during pregnancy) n = 889 (randomly selected 10% subsample from total) | Total protein from 3-day food diaries at 8 and 18 months |
| Protein intake at 18 months was not significantly different in children classified in the different AR groups (according to age at AR onset). BMI before AR onset was similar in all the groups. These results suggested no effect of protein intake on age at AR onset or final BMI. | 2+ Dietary recording plausibility assessment, adjustment for confounders and power calculation not done |
| Gunther 2006 [45] | Cohort DONALD (Germany) | Healthy infant (3–6 months at recruitment) n > 1100 recruited; n = 313 analyzed at 8 years (all data available) | Total protein from 3-day weighed food diaries at 12, 18, and 24 months |
| Higher protein intake at 12–18 months was associated with higher BMI z-score at AR onset only in females. BMI z-score (internal z-score) was −0.11 and –0.66 in the upper and lowest terciles of protein intake at 12–18 months of age, respectively. Age at AR onset was independent of protein intake at 12–18 months in both genders. | 2+ Unknown risk of follow-up bias because dropouts are not reported |
| Studies Assessing the Effect of Protein Intake during the Second Year of Life on Weight Gain (Secondary Outcome) | ||||||
| Reference | Study Design | Sample Population | Protein Intake Assessment | Assessed Outcomes | Effects and Comments | Study Quality |
| Karolis-Danckert 2007 [34] | Cohort DONALD (Germany) | Healthy infants (3–6 months at recruitment) n = >1100 recruited; n = 408 (followed until the age of 5 years (singleton, term, and birth weight >2500 g); n = 249 analyzed at 5 years (dietary information available) | Total protein from 3-day food diaries at 12, 18, and 24 months. Protein intake classified as high (H, highest 2 quartiles) or low (L, lowest 2 quartiles) for first year (12 months) and then until the second year (12 plus 18–24 months). Results compared L-L, L-H, H-L, and H-H (2 years sustained high intake) groups. |
| Distribution of children with rapid growth was similar in those infants consuming sustained higher protein intakes during the first 2 years (H-H) compared to those that did not (H-L). Linear mixed models analyses showed that the association between rapid weight gain and %BF trajectories up to 5 years was influenced by exclusive breastfeeding or %fat intake but not by protein intake during the second year of life. Protein intake during the second year of life was modulating %BF at 2 years (β = 0.67 ± 0.31, p = 0.03 for being from the H-H group compared to the H-L) but had no effect on the longitudinal change of %BF between 2 and 5 years. | 2+ Low biases except for a moderate risk of follow-up bias |
| Pimpin 2016 [39] | Cohort Gemini (twins, UK) | Twins cohort (recruited at 8.0 ± 2.2 months) n = 2435 recruited; n = 2154 analyzed The cohort included a 43.5% of preterms [40] | Total protein from 3-day food diaries assessed at a range age between 17 and 34 months (mean 21 ± 1.2 months) |
| Protein intake at 21 ± 1.2 months over 16.3% of total energy intake (in the top of the 2 quintiles) was associated with a greater weight gain up to 5 years of age (β = 0.330 kg, 95%CI 0.182–0.478 for the highest quintile vs. the lowest). | 2++ Relative high cohort sample with low biases |
Publisher’s Note: MDPI stays neutral with regard to jurisdictional claims in published maps and institutional affiliations. |
© 2021 by the authors. Licensee MDPI, Basel, Switzerland. This article is an open access article distributed under the terms and conditions of the Creative Commons Attribution (CC BY) license (http://creativecommons.org/licenses/by/4.0/).
Share and Cite
Ferré, N.; Luque, V.; Closa-Monasterolo, R.; Zaragoza-Jordana, M.; Gispert-Llauradó, M.; Grote, V.; Koletzko, B.; Escribano, J. Association of Protein Intake during the Second Year of Life with Weight Gain-Related Outcomes in Childhood: A Systematic Review. Nutrients 2021, 13, 583. https://doi.org/10.3390/nu13020583
Ferré N, Luque V, Closa-Monasterolo R, Zaragoza-Jordana M, Gispert-Llauradó M, Grote V, Koletzko B, Escribano J. Association of Protein Intake during the Second Year of Life with Weight Gain-Related Outcomes in Childhood: A Systematic Review. Nutrients. 2021; 13(2):583. https://doi.org/10.3390/nu13020583
Chicago/Turabian StyleFerré, Natalia, Verónica Luque, Ricardo Closa-Monasterolo, Marta Zaragoza-Jordana, Mariona Gispert-Llauradó, Veit Grote, Berthold Koletzko, and Joaquín Escribano. 2021. "Association of Protein Intake during the Second Year of Life with Weight Gain-Related Outcomes in Childhood: A Systematic Review" Nutrients 13, no. 2: 583. https://doi.org/10.3390/nu13020583
APA StyleFerré, N., Luque, V., Closa-Monasterolo, R., Zaragoza-Jordana, M., Gispert-Llauradó, M., Grote, V., Koletzko, B., & Escribano, J. (2021). Association of Protein Intake during the Second Year of Life with Weight Gain-Related Outcomes in Childhood: A Systematic Review. Nutrients, 13(2), 583. https://doi.org/10.3390/nu13020583