Clinical Significance of Analysis of Vitamin D Status in Various Diseases


Abstract
1. Introduction
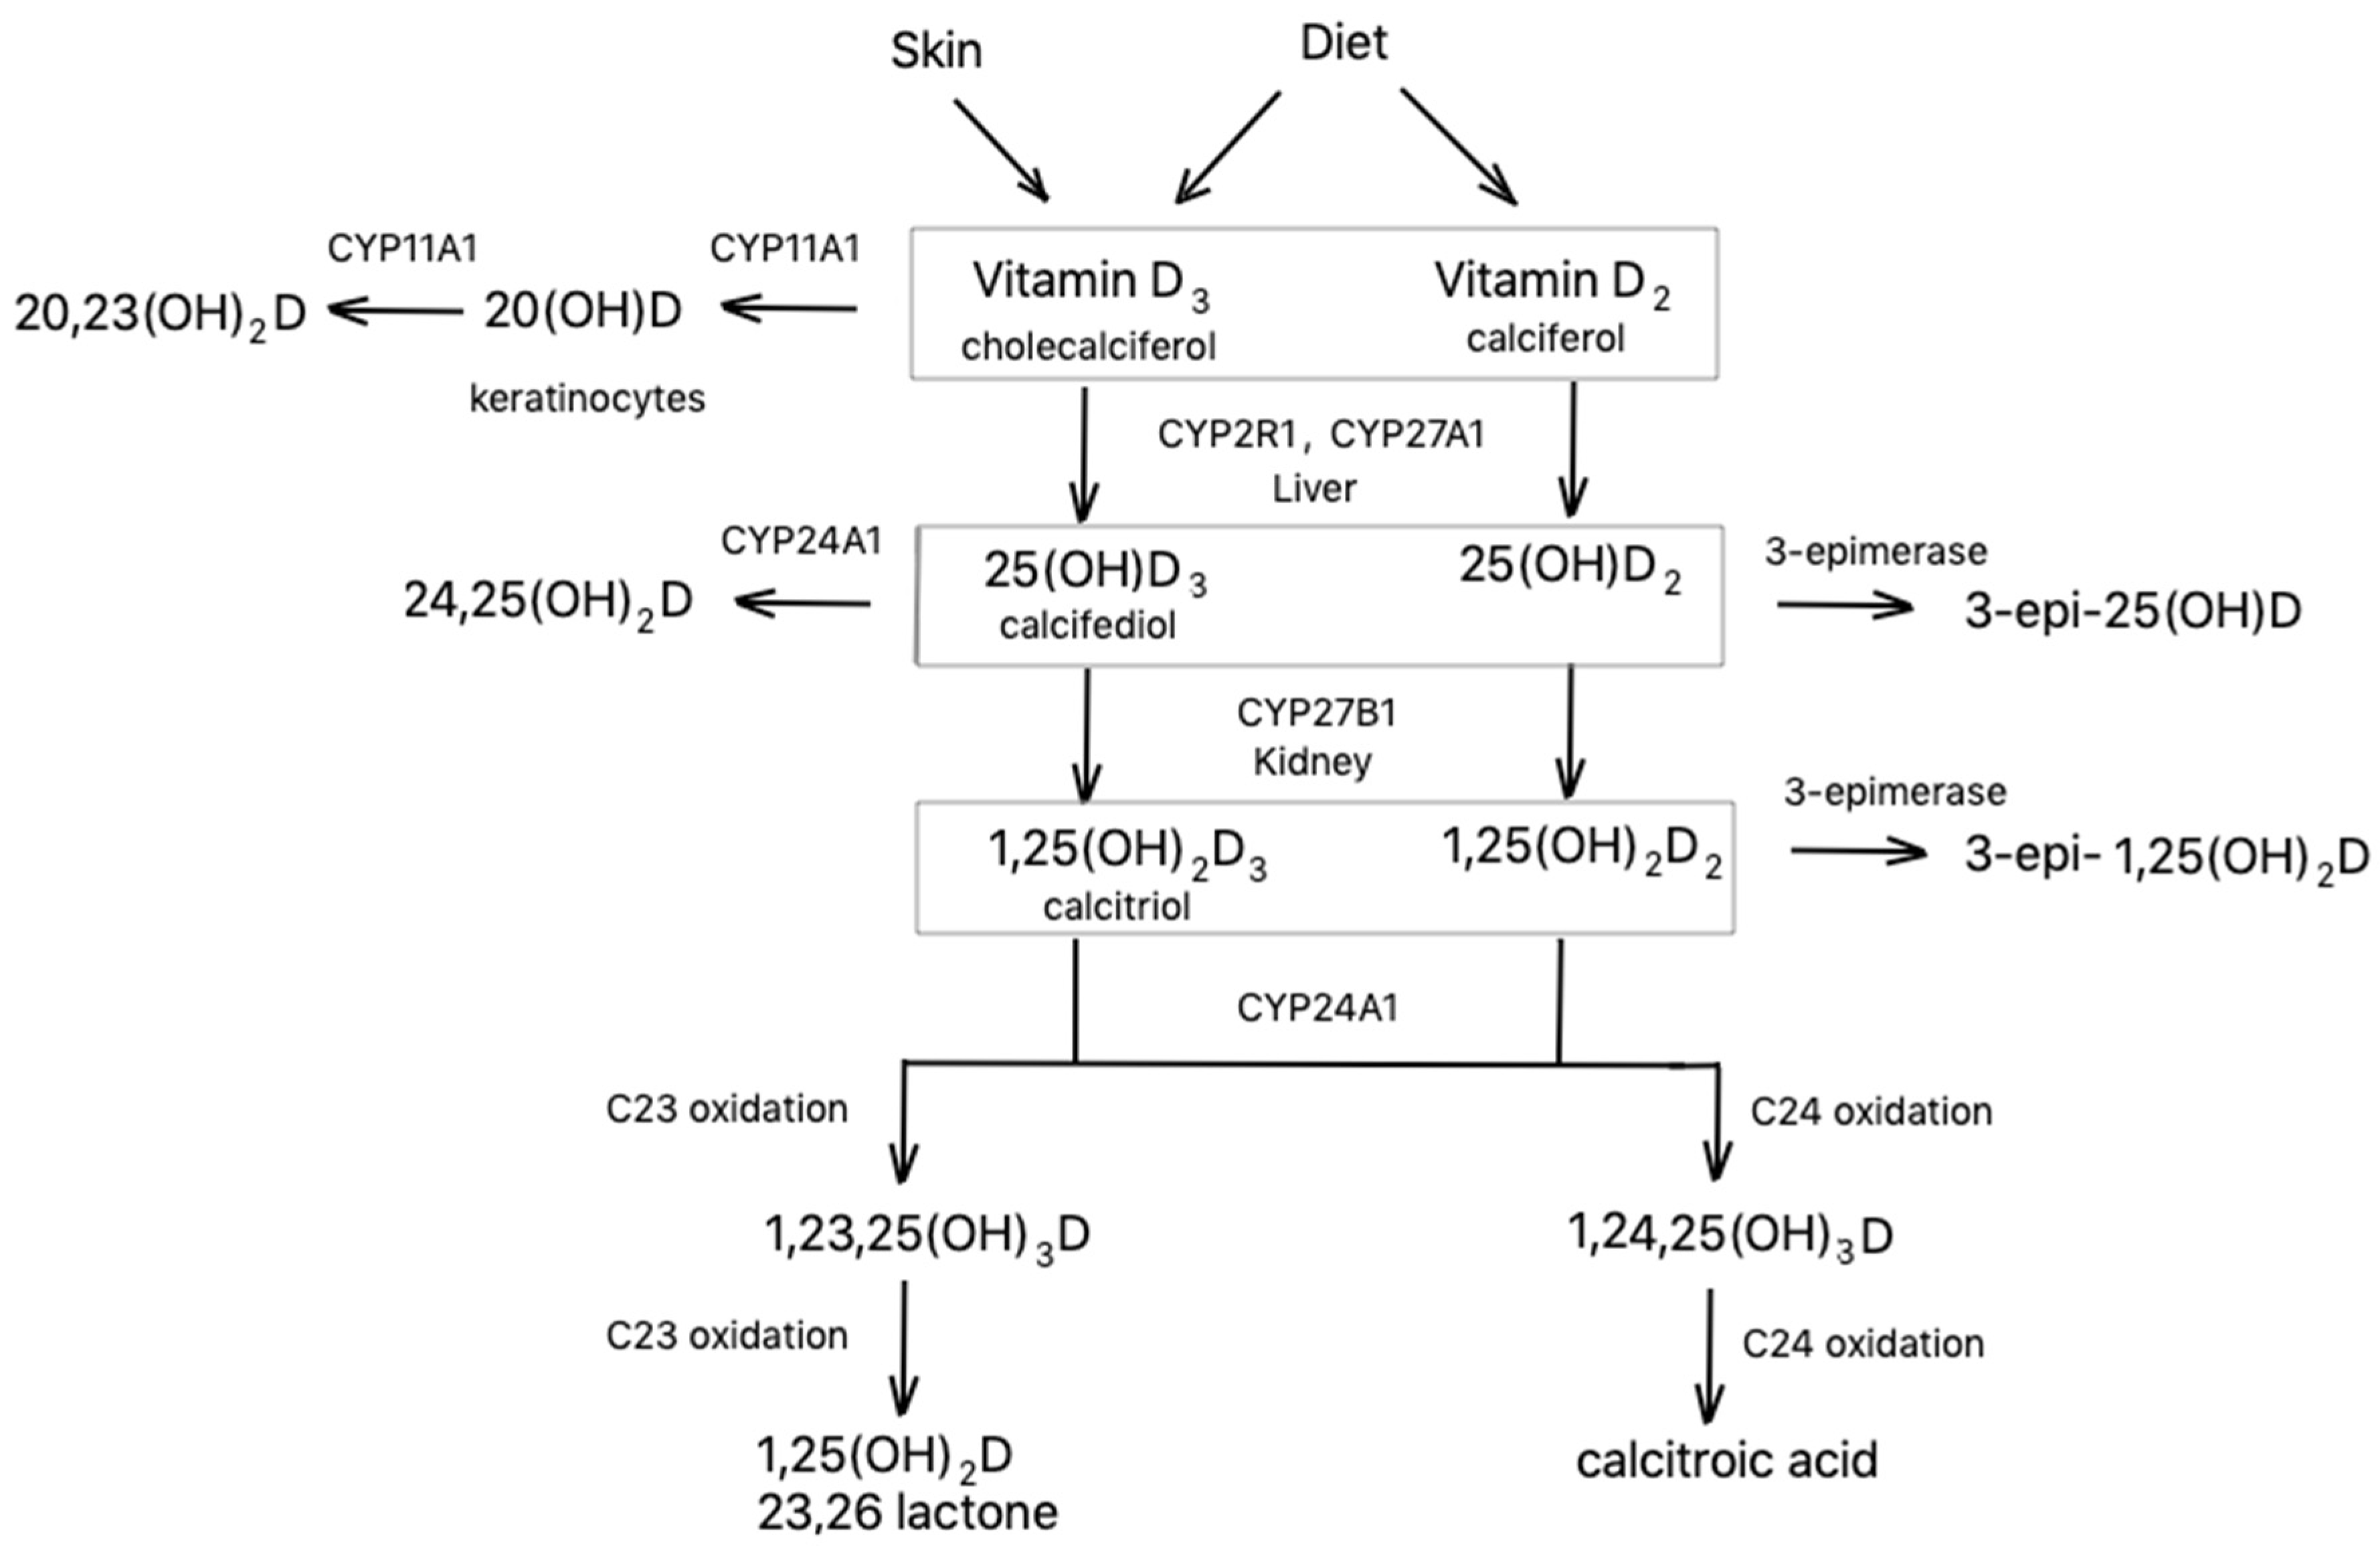
2. Synthesis and Metabolism
3. Mechanism of Action
4. Methods of Analysis of Vitamin D in Biological Fluids
4.1. Immunoassay Techniques
4.2. HPLC-MS/MS
5. Analysis of Vitamin D in Various Diseases
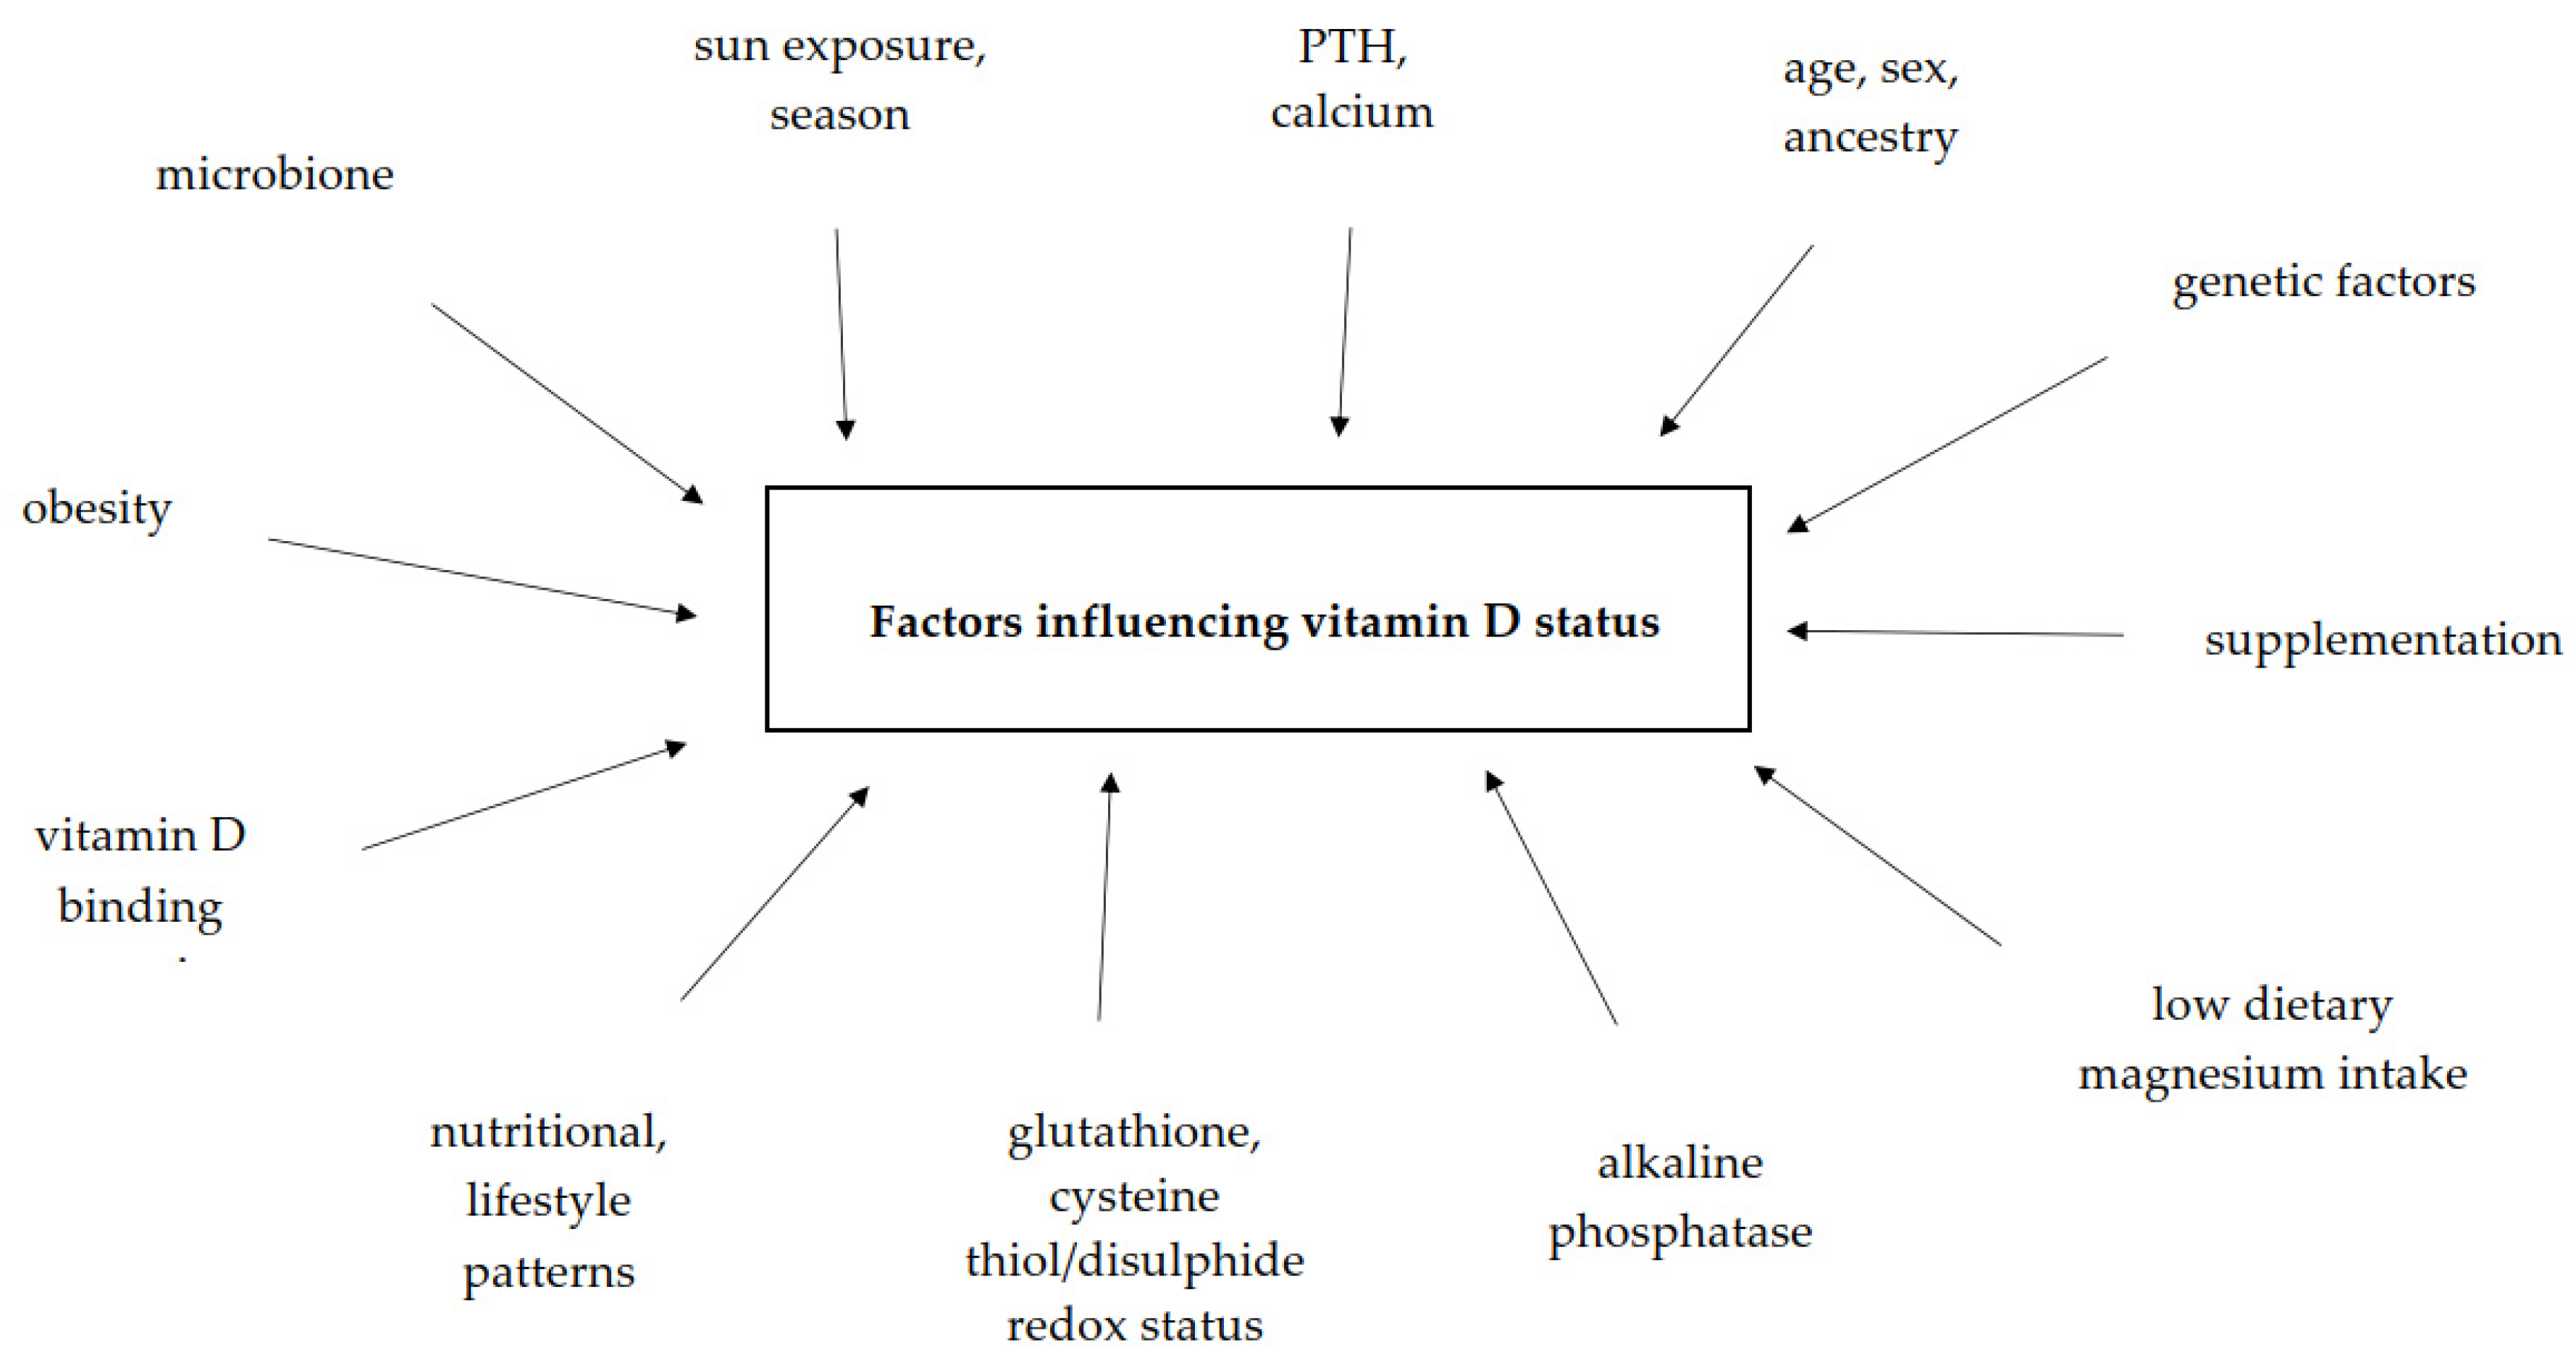
6. Factors Influencing Vitamin D Status in Human Body
7. Conclusions
Author Contributions
Funding
Conflicts of Interest
References
- Demer, L.L.; Hsu, J.J.; Tintut, Y. Steroid hormone vitamin D: Implications for cardiovascular disease. Circ. Res. 2018, 122, 1576–1585. [Google Scholar] [CrossRef] [PubMed]
- Bikle, D.D. Vitamin D metabolism, mechanism of action, and clinical applications. Chem. Biol. 2014, 21, 319–329. [Google Scholar] [CrossRef] [PubMed]
- Gil, Á.; Plaza-Diaz, J.; Mesa, M.D. Vitamin D: Classic and novel actions. Ann. Nutr. Metab. 2018, 72, 87–95. [Google Scholar] [CrossRef] [PubMed]
- Christakos, S.; Dhawan, P.; Verstuyf, A.; Verlinden, L.; Carmeliet, G. Vitamin D: Metabolism, molecular mechanism of action, and pleiotropic effects. Physiol. Rev. 2016, 96, 365–408. [Google Scholar] [CrossRef]
- Kennel, K.A.; Drake, M.T.; Hurley, D.L. Vitamin D deficiency in adults: When to test and how to treat. Mayo Clin. Proc. 2010, 85, 752–757. [Google Scholar] [CrossRef]
- Arneson, W.L.; Arneson, D.L. Current methods for routine clinical laboratory testing of vitamin D levels. Lab. Med. 2013, 44, e38–e42. [Google Scholar] [CrossRef]
- Shah, I.; James, R.; Barker, J.; Petroczi, A.; Naughton, D.P. Misleading measures in Vitamin D analysis: A novel LC-MS/MS assay to account for epimers and isobars. Nutr. J. 2011, 10, 46. [Google Scholar] [CrossRef]
- Tsiaras, W.; Weinstock, M. Factors Influencing Vitamin D Status. Acta Derm. Venerol. 2011, 91, 115–124. [Google Scholar] [CrossRef]
- Bahrami, A.; Sadeghnia, H.R.; Tabatabaeizadeh, S.-A.; Bahrami-Taghanaki, H.; Behboodi, N.; Esmaeili, H.; Ferns, G.A.; Mobarhan, M.G.; Avan, A. Genetic and epigenetic factors influencing vitamin D status. J. Cell Physiol. 2018, 233, 4033–4043. [Google Scholar] [CrossRef]
- Chen, T.C.; Chimeh, F.; Lu, Z.; Mathieu, J.; Person, K.S.; Zhang, A.; Kohn, N.; Martinello, S.; Berkowitz, R.; Holick, M.F. Factors that influence the cutaneous synthesis and dietary sources of vitamin D. Arch. Biochem. Biophys. 2007, 460, 213–217. [Google Scholar] [CrossRef]
- Lamberg-Allardt, C. Vitamin D in foods and as supplements. Progress Biophys. Mol. Biol. 2006, 92, 33–38. [Google Scholar] [CrossRef] [PubMed]
- Holick, M.F. Sunlight and vitamin D for bone health and prevention of autoimmune diseases, cancers, and cardiovascular disease. Am. J. Clin. Nutr. 2004, 80, 1678S–1688S. [Google Scholar] [CrossRef] [PubMed]
- Jumaah, F.; Larsson, S.; Essén, S.; Cunico, L.P.; Holm, C.; Turner, C.; Sandahl, M. A rapid method for the separation of vitamin D and its metabolites by ultra-high performance supercritical fluid chromatography–mass spectrometry. J. Chromatogr. A 2016, 1440, 191–200. [Google Scholar] [CrossRef] [PubMed]
- Cashman, K.D.; van den Heuvel, E.G.; Schoemaker, R.J.; Prévéraud, D.P.; Macdonald, H.M.; Arcot, J. 25-hydroxyvitamin D as a biomarker of vitamin D status and its modeling to inform strategies for prevention of vitamin D deficiency within the population. Adv. Nutr. 2017, 8, 947–957. [Google Scholar] [CrossRef]
- Dietary Reference Intakes for Calcium and Vitamin D; National Academies Press: Washington, DC, USA, 2011; p. 13050. ISBN 978-0-309-16394-1.
- Jenkinson, C.; Taylor, A.E.; Hassan-Smith, Z.K.; Adams, J.S.; Stewart, P.M.; Hewison, M.; Keevil, B.G. High throughput LC–MS/MS method for the simultaneous analysis of multiple vitamin D analytes in serum. J. Chromatogr. B 2016, 1014, 56–63. [Google Scholar] [CrossRef]
- Ferrone, F.; Pepe, J.; Danese, V.C.; Fassino, V.; Cecchetti, V.; De Lucia, F.; Biamonte, F.; Colangelo, L.; Ferrazza, G.; Panzini, E.; et al. The relative influence of serum ionized calcium and 25-hydroxyvitamin D in regulating PTH secretion in healthy subjects. Bone 2019, 125, 200–206. [Google Scholar] [CrossRef]
- Heaney, R.P.; Recker, R.R.; Grote, J.; Horst, R.L.; Armas, L.A.G. Vitamin D3 is more potent than vitamin D2 in humans. J. Clin. Endocrinol. Metab. 2011, 96, E447–E452. [Google Scholar] [CrossRef]
- Dirks, N.F.; Martens, F.; Vanderschueren, D.; Billen, J.; Pauwels, S.; Ackermans, M.T.; Endert, E.; den Heijer, M.; Blankenstein, M.A.; Heijboer, A.C. Determination of human reference values for serum total 1,25-dihydroxyvitamin D using an extensively validated 2D ID-UPLC–MS/MS method. J. Steroid Biochem. Mol. Biol. 2016, 164, 127–133. [Google Scholar] [CrossRef]
- St-Arnaud, R.; Naja, R.P. Vitamin D metabolism, cartilage and bone fracture repair. Mol. Cell. Endocrinol. 2011, 347, 48–54. [Google Scholar] [CrossRef]
- Bosworth, C.R.; Levin, G.; Robinson-Cohen, C.; Hoofnagle, A.N.; Ruzinski, J.; Young, B.; Schwartz, S.M.; Himmelfarb, J.; Kestenbaum, B.; de Boer, I.H. The serum 24,25-dihydroxyvitamin D concentration, a marker of vitamin D catabolism, is reduced in chronic kidney disease. Kidney Int. 2012, 82, 693–700. [Google Scholar] [CrossRef]
- Schlingmann, K.P.; Kaufmann, M.; Weber, S.; Irwin, A.; Goos, C.; John, U.; Misselwitz, J.; Klaus, G.; Kuwertz-Bröking, E.; Fehrenbach, H.; et al. Mutations in CYP24A1 and idiopathic infantile hypercalcemia. N. Engl. J. Med. 2011, 365, 410–421. [Google Scholar] [CrossRef]
- Al-Zohily, B.; Al-Menhali, A.; Gariballa, S.; Haq, A.; Shah, I. Epimers of vitamin D: A review. Int. J. Mol. Sci. 2020, 21, 470. [Google Scholar] [CrossRef] [PubMed]
- Zbytek, B.; Janjetovic, Z.; Tuckey, R.C.; Zmijewski, M.A.; Sweatman, T.W.; Jones, E.; Nguyen, M.N.; Slominski, A.T. 20-Hydroxyvitamin D3, a product of vitamin D3 hydroxylation by cytochrome P450scc, stimulates keratinocyte differentiation. J. Investig. Dermatol. 2008, 128, 2271–2280. [Google Scholar] [CrossRef] [PubMed]
- Slominski, A.T.; Kim, T.-K.; Janjetovic, Z.; Tuckey, R.C.; Bieniek, R.; Yue, J.; Li, W.; Chen, J.; Nguyen, M.N.; Tang, E.K.Y.; et al. 20-Hydroxyvitamin D2 is a noncalcemic analog of vitamin D with potent antiproliferative and prodifferentiation activities in normal and malignant cells. Am. J. Physiol. Cell Physiol. 2011, 300, C526–C541. [Google Scholar] [CrossRef]
- Chakraborti, C. Vitamin D as a promising anticancer agent. Ind. J Pharmacol. 2011, 43, 113. [Google Scholar] [CrossRef] [PubMed]
- Sassi, F.; Tamone, C.; D’Amelio, P. Vitamin D: Nutrient, Hormone, and Immunomodulator. Nutrients 2018, 10, 1656. [Google Scholar] [CrossRef] [PubMed]
- Holick, M.F. Vitamin D Status: Measurement, Interpretation, and Clinical Application. Ann. Epidemiol. 2009, 19, 73–78. [Google Scholar] [CrossRef] [PubMed]
- Skender, S.; Böhm, J.; Schrotz-King, P.; Chang-Claude, J.; Siegel, E.M.; Steindorf, K.; Owen, R.W.; Ose, J.; Hoffmeister, M.; Brenner, H.; et al. Plasma 25-hydroxyvitamin D3 levels in colorectal cancer patients and associations with physical activity. Nutr. Cancer 2017, 69, 229–237. [Google Scholar] [CrossRef]
- Zoppini, G.; Galletti, A.; Targher, G.; Brangani, C.; Pichiri, I.; Trombetta, M.; Negri, C.; De Santi, F.; Stoico, V.; Cacciatori, V.; et al. Lower levels of 25-hydroxyvitamin D3 are associated with a higher prevalence of microvascular complications in patients with type 2 diabetes. BMJ Open Diab. Res. Care 2015, 3, e000058. [Google Scholar] [CrossRef]
- Lippi, G.; Salvagno, G.L.; Fortunato, A.; Dipalo, M.; Aloe, R.; Rin, G.D.; Giavarina, D. Multicenter Comparison of Seven 25Oh Vitamin D Automated Immunoassays/Multicentrično Poređenje Sedam Automatizovanih Imunoeseja Za 25Oh Vitamin D. J. Med. Biochem. 2015, 34, 344–350. [Google Scholar] [CrossRef]
- Vemulapati, S.; Rey, E.; O’Dell, D.; Mehta, S.; Erickson, D. A quantitative point-of-need assay for the assessment of vitamin D3 deficiency. Sci. Rep. 2017, 7, 14142. [Google Scholar] [CrossRef] [PubMed]
- Zittermann, A.; Ernst, J.B.; Becker, T.; Dreier, J.; Knabbe, C.; Gummert, J.F.; Kuhn, J. Measurement of circulating 1,25-dihydroxyvitamin D: Comparison of an automated method with a liquid chromatography tandem mass spectrometry method. Int. J. Analyt. Chem. 2016, 2016, 1–6. [Google Scholar] [CrossRef] [PubMed]
- Hollis, B.W. Comparison of Commercially Available 125I-based RIA Methods for the Determination of Circulating 25-Hydroxyvitamin D. Clin. Chem. 2000, 46, 1657–1661. [Google Scholar] [CrossRef] [PubMed]
- Lee, J.H.; Choi, J.-H.; Kweon, O.J.; Park, A.J. Discrepancy between Vitamin D Total Immunoassays due to various cross-reactivities. J. Bone Metab. 2015, 22, 107–112. [Google Scholar] [CrossRef] [PubMed]
- Abouzid, M.; Karaźniewicz-Łada, M.; Pawlak, K.; Burchardt, P.; Kruszyna, Ł.; Główka, F. Measurement of plasma 25-hydroxyvitamin D2, 25-hydroxyvitamin D3 and 3-epi-25-hydroxyvitamin D3 in population of patients with cardiovascular disease by UPLC-MS/MS method. J. Chromatogr. B 2020, 122350. [Google Scholar] [CrossRef]
- Lensmeyer, G.; Poquette, M.; Wiebe, D.; Binkley, N. The C-3 Epimer of 25-Hydroxyvitamin D 3 Is Present in Adult Serum. J. Clin. Endocrinol. Metab. 2012, 97, 163–168. [Google Scholar] [CrossRef]
- Bailey, D.; Veljkovic, K.; Yazdanpanah, M.; Adeli, K. Analytical measurement and clinical relevance of vitamin D3 C3-epimer. Clin. Biochem. 2013, 46, 190–196. [Google Scholar] [CrossRef]
- Narayanaswamy, R.; Iyer, V.; Khare, P.; Bodziak, M.L.; Badgett, D.; Zivadinov, R.; Weinstock-Guttman, B.; Rideout, T.C.; Ramanathan, M.; Browne, R.W. Simultaneous determination of oxysterols, cholesterol and 25-hydroxy-vitamin D3 in human plasma by LC-UV-MS. PLoS ONE 2015, 10, e0123771. [Google Scholar] [CrossRef]
- Newman, M.S.; Brandon, T.R.; Groves, M.N.; Gregory, W.L.; Kapur, S.; Zava, D.T. A liquid chromatography/tandem mass spectrometry method for determination of 25-hydroxy vitamin D2 and 25-hydroxy vitamin D3 in dried blood spots: A potential adjunct to diabetes and cardiometabolic risk screening. J. Diabet. Sci. Technol. 2009, 3, 156–162. [Google Scholar] [CrossRef]
- Wang, S.; Wang, S.; Yang, R.; Zhou, W.; Li, H.; Dong, J.; Chen, W. A simple and precise LC-MS/MS method for the simultaneous determination of serum 25-hydroxyvitamin D3 and D2 without interference from the C3 epimer. Anal. Methods 2015, 7, 5254–5261. [Google Scholar] [CrossRef]
- Müller, M.J.; Stokes, C.S.; Volmer, D.A. Quantification of the 3α and 3β epimers of 25-hydroxyvitamin D3 in dried blood spots by LC-MS/MS using artificial whole blood calibration and chemical derivatization. Talanta 2017, 165, 398–404. [Google Scholar] [CrossRef]
- Teegarden, M.D.; Riedl, K.M.; Schwartz, S.J. Chromatographic separation of PTAD-derivatized 25-hydroxyvitamin D3 and its C-3 epimer from human serum and murine skin. J. Chromatogr. B 2015, 991, 118–121. [Google Scholar] [CrossRef] [PubMed]
- Albarhani, A.A.; Collier, F.; Greaves, R.F.; Ponsonby, A.-L.; Allen, K.J.; Vuillermin, P.J.; Roche, P.; Clarke, M.W. Vitamins D and A can be successfully measured by LC–MS/MS in cord blood diluted plasma. Clin. Biochem. 2015, 48, 1105–1112. [Google Scholar] [CrossRef] [PubMed]
- Kmieć, P.; Minkiewicz, I.; Rola, R.; Sworczak, K.; Żmijewski, M.A.; Kowalski, K. Vitamin D status including 3-epi-25(OH)D3 among adult patients with thyroid disorders during summer months. Endokrynol. Pol. 2018, 69, 653–660. [Google Scholar] [CrossRef]
- Dowling, K.G.; Hull, G.; Sundvall, J.; Lamberg-Allardt, C.; Cashman, K.D. Improved accuracy of an tandem liquid chromatography–mass spectrometry method measuring 24R,25-dihydroxyvitamin D3 and 25-hydroxyvitamin D metabolites in serum using unspiked controls and its application to determining cross-reactivity of a chemiluminescent microparticle immunoassay. J. Chromatogr. A 2017, 1497, 102–109. [Google Scholar] [CrossRef]
- Gomes, F.P.; Shaw, P.N.; Hewavitharana, A.K. Determination of four sulfated vitamin D compounds in human biological fluids by liquid chromatography–tandem mass spectrometry. J. Chromatogr. B 2016, 1009–1010, 80–86. [Google Scholar] [CrossRef]
- Gao, C.; Bergagnini-Kolev, M.C.; Liao, M.Z.; Wang, Z.; Wong, T.; Calamia, J.C.; Lin, Y.S.; Mao, Q.; Thummel, K.E. Simultaneous quantification of 25-hydroxyvitamin D3-3-sulfate and 25-hydroxyvitamin D3-3-glucuronide in human serum and plasma using liquid chromatography–tandem mass spectrometry coupled with DAPTAD-derivatization. J. Chromatogr. B 2017, 1060, 158–165. [Google Scholar] [CrossRef]
- Wang, Z.; Senn, T.; Kalhorn, T.; Zheng, X.E.; Zheng, S.; Davis, C.L.; Hebert, M.F.; Lin, Y.S.; Thummel, K.E. Simultaneous measurement of plasma vitamin D3 metabolites, including 4β,25-dihydroxyvitamin D3, using liquid chromatography–tandem mass spectrometry. Analyt. Biochem. 2011, 418, 126–133. [Google Scholar] [CrossRef]
- Fabregat-Cabello, N.; Farre-Segura, J.; Huyghebaert, L.; Peeters, S.; Le Goff, C.; Souberbielle, J.-C.; Cavalier, É. A fast and simple method for simultaneous measurements of 25(OH)D, 24,25(OH) 2 D and the Vitamin D Metabolite Ratio (VMR) in serum samples by LC-MS/MS. Clin. Chim. Acta 2017, 473, 116–123. [Google Scholar] [CrossRef]
- Tang, J.C.Y.; Nicholls, H.; Piec, I.; Washbourne, C.J.; Dutton, J.J.; Jackson, S.; Greeves, J.; Fraser, W.D. Reference intervals for serum 24,25-dihydroxyvitamin D and the ratio with 25-hydroxyvitamin D established using a newly developed LC–MS/MS method. J. Nutr. Biochem. 2017, 46, 21–29. [Google Scholar] [CrossRef]
- Mena-Bravo, A.; Priego-Capote, F.; Luque de Castro, M.D. Two-dimensional liquid chromatography coupled to tandem mass spectrometry for vitamin D metabolite profiling including the C3-epimer-25-monohydroxyvitamin D3. J. Chromatogr. A 2016, 1451, 50–57. [Google Scholar] [CrossRef] [PubMed]
- Jenkinson, C.; Taylor, A.; Storbeck, K.-H.; Hewison, M. Analysis of multiple vitamin D metabolites by ultra-performance supercritical fluid chromatography-tandem mass spectrometry (UPSFC-MS/MS). J. Chromatogr. B 2018, 1087–1088, 43–48. [Google Scholar] [CrossRef] [PubMed]
- Elbossaty, W.F. Mineralization of bones in osteoporosis and osteomalacia. Ann. Clin. Lab. Res. 2017, 5. [Google Scholar] [CrossRef]
- Zhu, K.; Lewis, J.R.; Sim, M.; Prince, R.L. Low vitamin D status is associated with impaired bone quality and increased risk of fracture-related hospitalization in older australian women. J. Bone Miner. Res. 2019, 34, 2019–2027. [Google Scholar] [CrossRef]
- Pelajo, C.F.; Lopez-Benitez, J.M.; Miller, L.C. Vitamin D and autoimmune rheumatologic disorders. Autoimmun. Rev. 2010, 9, 507–510. [Google Scholar] [CrossRef]
- Li, D.; Jeffery, L.E.; Jenkinson, C.; Harrison, S.R.; Chun, R.F.; Adams, J.S.; Raza, K.; Hewison, M. Serum and synovial fluid vitamin D metabolites and rheumatoid arthritis. J. Steroid Biochem. Mol. Biol. 2019, 187, 1–8. [Google Scholar] [CrossRef]
- Harrison, S.R.; Li, D.; Jeffery, L.E.; Raza, K.; Hewison, M. Vitamin D, autoimmune disease and rheumatoid arthritis. Calcif. Tissue Int. 2020, 106, 58–75. [Google Scholar] [CrossRef]
- Chandrashekara, S.; Patted, A. Role of vitamin D supplementation in improving disease activity in rheumatoid arthritis: An exploratory study. Int. J. Rheum. Dis. 2017, 20, 825–831. [Google Scholar] [CrossRef]
- Mackawy, A.M.H.; Al-Ayed, B.M.; Al-Rashidi, B.M. Vitamin D deficiency and its association with thyroid disease. IJHS 2013, 7, 267–275. [Google Scholar] [CrossRef]
- Playford, M.P.; Dey, A.K.; Zierold, C.; Joshi, A.A.; Blocki, F.; Bonelli, F.; Rodante, J.A.; Harrington, C.L.; Rivers, J.P.; Elnabawi, Y.A.; et al. Serum active 1,25(OH)2D, but not inactive 25(OH)D vitamin D levels are associated with cardiometabolic and cardiovascular disease risk in psoriasis. Atherosclerosis 2019, 289, 44–50. [Google Scholar] [CrossRef]
- Szymczak-Pajor, I.; Śliwińska, A. Analysis of association between vitamin D deficiency and insulin resistance. Nutrients 2019, 11, 794. [Google Scholar] [CrossRef] [PubMed]
- Ormazabal, V.; Nair, S.; Elfeky, O.; Aguayo, C.; Salomon, C.; Zuñiga, F.A. Association between insulin resistance and the development of cardiovascular disease. Cardiovasc. Diabetol. 2018, 17, 122. [Google Scholar] [CrossRef] [PubMed]
- Wenclewska, S.; Szymczak-Pajor, I.; Drzewoski, J.; Bunk, M.; Śliwińska, A. Vitamin D supplementation reduces both oxidative DNA damage and insulin resistance in the elderly with metabolic disorders. Int. J. Mol. Sci. 2019, 20, 2891. [Google Scholar] [CrossRef] [PubMed]
- Mozos, I.; Marginean, O. Links between Vitamin D deficiency and cardiovascular diseases. BioMed. Res. Int. 2015, 2015, 1–12. [Google Scholar] [CrossRef] [PubMed]
- Wang, J.; Zhou, J.; Robertson, G.; Lee, V. Vitamin D in Vascular Calcification: A Double-Edged Sword? Nutrients 2018, 10, 652. [Google Scholar] [CrossRef] [PubMed]
- Maj, E.; Filip-Psurska, B.; Milczarek, M.; Psurski, M.; Kutner, A.; Wietrzyk, J. Vitamin D derivatives potentiate the anticancer and anti-angiogenic activity of tyrosine kinase inhibitors in combination with cytostatic drugs in an A549 non-small cell lung cancer model. Int. J. Oncol. 2017, 52, 337–366. [Google Scholar] [CrossRef] [PubMed]
- Zhang, R.; Naughton, D.P. Vitamin D in health and disease: Current perspectives. Nutr. J. 2010, 9, 65. [Google Scholar] [CrossRef]
- Jiang, X.; Dimou, N.L.; Al-Dabhani, K.; Lewis, S.J.; Martin, R.M.; Haycock, P.C.; Gunter, M.J.; Key, T.J.; Eeles, R.A.; Muir, K.; et al. Circulating vitamin D concentrations and risk of breast and prostate cancer: A Mendelian randomization study. Int. J. Epidemiol. 2019, 48, 1416–1424. [Google Scholar] [CrossRef]
- McCullough, M.L.; Zoltick, E.S.; Weinstein, S.J.; Fedirko, V.; Wang, M.; Cook, N.R.; Eliassen, A.H.; Zeleniuch-Jacquotte, A.; Agnoli, C.; Albanes, D.; et al. Circulating vitamin D and colorectal cancer risk: An international pooling project of 17 cohorts. JNCI J. Nat. Cancer Inst. 2019, 111, 158–169. [Google Scholar] [CrossRef]
- Manson, J.E.; Cook, N.R.; Lee, I.-M.; Christen, W.; Bassuk, S.S.; Mora, S.; Gibson, H.; Gordon, D.; Copeland, T.; D’Agostino, D.; et al. Vitamin D supplements and prevention of cancer and cardiovascular disease. N. Engl. J. Med. 2019, 380, 33–44. [Google Scholar] [CrossRef]
- Aksoy, H.; Akçay, F.; Kurtul, N.; Baykal, O.; Avci, B. Serum 1,25 dihydroxy vitamin D (1,25(OH)2D3), 25 hydroxy vitamin D (25(OH)D) and parathormone levels in diabetic retinopathy. Clin. Biochem. 2000, 33, 47–51. [Google Scholar] [CrossRef]
- Jolliffe, D.A.; James, W.Y.; Hooper, R.L.; Barnes, N.C.; Greiller, C.L.; Islam, K.; Bhowmik, A.; Timms, P.M.; Rajakulasingam, R.K.; Choudhury, A.B.; et al. Prevalence, determinants and clinical correlates of vitamin D deficiency in patients with chronic obstructive pulmonary disease in London, UK. J. Steroid Biochem. Mol. Biol. 2018, 175, 138–145. [Google Scholar] [CrossRef]
- Fu, J.; Han, L.; Zhao, Y.; Li, G.; Zhu, Y.; Li, Y.; Li, M.; Gao, S.; Willi, S.M. Vitamin D levels are associated with metabolic syndrome in adolescents and young adults: The BCAMS study. Clin. Nutr. 2019, 38, 2161–2167. [Google Scholar] [CrossRef] [PubMed]
- Nielsen, N.M.; Munger, K.L.; Koch-Henriksen, N.; Hougaard, D.M.; Magyari, M.; Jorgensen, K.T.; Lundqvist, M.; Simonsen, J.; Jess, T.; Cohen, A.; et al. Neonatal vitamin D status and risk of multiple sclerosis: A population-based case-control study. Neurology 2017, 88, 44–51. [Google Scholar] [CrossRef]
- Hassanein, B.E.D.M.; Soliman, D.R.; Fayed, S.M.A.E.; Suleiman, M.M.M. Serum levels of 25(OH) vitamin D and immunoglobulin E in infants with bronchiolitis. Egypt. Pediatr. Assoc. Gaz. 2016, 64, 86–90. [Google Scholar] [CrossRef]
- Koplin, J.J.; Suaini, N.H.A.; Vuillermin, P.; Ellis, J.A.; Panjari, M.; Ponsonby, A.-L.; Peters, R.L.; Matheson, M.C.; Martino, D.; Dang, T.; et al. Polymorphisms affecting vitamin D–binding protein modify the relationship between serum vitamin D (25[OH]D3) and food allergy. J. Allergy Clin. Immunol. 2016, 137, 500–506. [Google Scholar] [CrossRef]
- Jhee, J.H.; Kim, H.; Park, S.; Yun, H.-R.; Jung, S.-Y.; Kee, Y.K.; Yoon, C.-Y.; Park, J.T.; Han, S.H.; Kang, S.-W.; et al. Vitamin D deficiency is significantly associated with depression in patients with chronic kidney disease. PLoS ONE 2017, 12, e0171009. [Google Scholar] [CrossRef]
- Imai, C.M.; Halldorsson, T.I.; Eiriksdottir, G.; Cotch, M.F.; Steingrimsdottir, L.; Thorsdottir, I.; Launer, L.J.; Harris, T.; Gudnason, V.; Gunnarsdottir, I. Depression and serum 25-hydroxyvitamin D in older adults living at northern latitudes–AGES-Reykjavik study. J. Nutr. Sci. 2015, 4, e37. [Google Scholar] [CrossRef]
- Terock, J.; Hannemann, A.; Van der Auwera, S.; Janowitz, D.; Spitzer, C.; Bonk, S.; Völzke, H.; Grabe, H.J. Posttraumatic stress disorder is associated with reduced vitamin D levels and functional polymorphisms of the vitamin D binding-protein in a population-based sample. Progress Neuro Psychopharmacol. Biol. Psychiatr. 2020, 96, 109760. [Google Scholar] [CrossRef]
- Moretti, R.; Morelli, M.E.; Caruso, P. Vitamin D in neurological diseases: A rationale for a pathogenic impact. Int. J. Mol. Sci. 2018, 19, 2245. [Google Scholar] [CrossRef]
- Yavuz, Y.C.; Biyik, Z.; Ozkul, D.; Abusoglu, S.; Eryavuz, D.; Dag, M.; Korez, M.K.; Guney, I.; Altintepe, L. Association of depressive symptoms with 25(OH) vitamin D in hemodialysis patients and effect of gender. Clin. Exp. Nephrol. 2020, 24, 63–72. [Google Scholar] [CrossRef]
- Parker, G.B.; Brotchie, H.; Graham, R.K. Vitamin D and depression. J. Affect. Dis. 2017, 208, 56–61. [Google Scholar] [CrossRef]
- Martineau, A.R.; Jolliffe, D.A.; Hooper, R.L.; Greenberg, L.; Aloia, J.F.; Bergman, P.; Dubnov-Raz, G.; Esposito, S.; Ganmaa, D.; Ginde, A.A.; et al. Vitamin D supplementation to prevent acute respiratory tract infections: Systematic review and meta-analysis of individual participant data. BMJ 2017, 356, i6583. [Google Scholar] [CrossRef]
- Arboleda, J.F.; Urcuqui-Inchima, S. Vitamin D supplementation: A potential approach for Coronavirus/COVID-19 therapeutics? Front. Immunol. 2020, 11, 1523. [Google Scholar] [CrossRef] [PubMed]
- Grant, W.B.; Lahore, H.; McDonnell, S.L.; Baggerly, C.A.; French, C.B.; Aliano, J.L.; Bhattoa, H.P. Evidence that vitamin D supplementation could reduce risk of influenza and COVID-19 infections and deaths. Nutrients 2020, 12, 988. [Google Scholar] [CrossRef] [PubMed]
- Fukumoto, S. Phosphate metabolism and vitamin D. BoneKEy Rep. 2014, 3. [Google Scholar] [CrossRef] [PubMed]
- Heaney, R.P.; Davies, K.M.; Chen, T.C.; Holick, M.F.; Barger-Lux, M.J. Human serum 25-hydroxycholecalciferol response to extended oral dosing with cholecalciferol. Am. J. Clin. Nutr. 2003, 77, 204–210. [Google Scholar] [CrossRef] [PubMed]
- Holick, M.F. Vitamin D deficiency. N. Engl. J. Med. 2007, 357, 266–281. [Google Scholar] [CrossRef] [PubMed]
- Bueno, A.L.; Czepielewski, M.A.; Raimundo, F.V. Calcium and vitamin D intake and biochemical tests in short-stature children and adolescents. Eur. J. Clin. Nutr. 2010, 64, 1296–1301. [Google Scholar] [CrossRef] [PubMed]
- Hernando, V.-U.; Andry, M.-M.; María Virginia, P.-F.; Valentina, A. Vitamin D nutritional status in the adult population in Colombia—An analytical cross-sectional study. Heliyon 2020, 6, e03479. [Google Scholar] [CrossRef]
- Alvarez, J.A.; Chowdhury, R.; Jones, D.P.; Martin, G.S.; Brigham, K.L.; Binongo, J.N.; Ziegler, T.R.; Tangpricha, V. Vitamin D status is independently associated with plasma glutathione and cysteine thiol/disulphide redox status in adults. Clin. Endocrinol. 2014, 81, 458–466. [Google Scholar] [CrossRef] [PubMed]
- Rosanoff, A.; Dai, Q.; Shapses, S.A. Essential nutrient interactions: Does low or suboptimal magnesium status interact with vitamin D and/or calcium status? Adv. Nutr. 2016, 7, 25–43. [Google Scholar] [CrossRef] [PubMed]
- Cheung, M.M.; DeLuccia, R.; Ramadoss, R.K.; Aljahdali, A.; Volpe, S.L.; Shewokis, P.A.; Sukumar, D. Low dietary magnesium intake alters vitamin D—parathyroid hormone relationship in adults who are overweight or obese. Nutr. Res. 2019, 69, 82–93. [Google Scholar] [CrossRef] [PubMed]
- Mousa, A.; de Courten, M.P.J.; Forbes, J.; de Courten, B. Serum 25-hydroxyvitamin D concentrations are associated with nuclear factor kappa-B activity but not with inflammatory markers in healthy normoglycemic adults. J. Steroid Biochem. Mol. Biol. 2018, 177, 216–222. [Google Scholar] [CrossRef]
- Wacker, M.; Holick, M.F. Sunlight and Vitamin D: A global perspective for health. Derm. Endocrinol. 2013, 5, 51–108. [Google Scholar] [CrossRef]
- Matsuoka, L.Y.; Wortsman, J.; Dannenberg, M.J.; Hollis, B.W.; Lu, Z.; Holick, M.F. Clothing prevents ultraviolet-B radiation-dependent photosynthesis of vitamin D3. J. Clin. Endocrinol. Metab. 1992, 75, 1099–1103. [Google Scholar] [CrossRef]
- Chakhtoura, M.; Rahme, M.; Chamoun, N.; El-Hajj Fuleihan, G. Vitamin D in the middle east and north Africa. Bone Rep. 2018, 8, 135–146. [Google Scholar] [CrossRef]
- Griffin, T.P.; Wall, D.; Blake, L.; Griffin, D.G.; Robinson, S.; Bell, M.; Mulkerrin, E.C.; O’Shea, P.M. Higher risk of vitamin D insufficiency/deficiency for rural than urban dwellers. J. Steroid Biochem. Mol. Biol. 2020, 197, 105547. [Google Scholar] [CrossRef]
- Carpenter, T.O.; Zhang, J.H.; Parra, E.; Ellis, B.K.; Simpson, C.; Lee, W.M.; Balko, J.; Fu, L.; Wong, B.Y.-L.; Cole, D.E. Vitamin D binding protein is a key determinant of 25-hydroxyvitamin D levels in infants and toddlers. J. Bone Miner. Res. 2013, 28, 213–221. [Google Scholar] [CrossRef]
- Bikle, D. Nonclassic Actions of Vitamin D. J. Clin. Endocrinol. Metab. 2009, 94, 26–34. [Google Scholar] [CrossRef]
- Joh, H.-K.; Hwang, S.; Cho, B.; Lim, C.S.; Jung, S.-E. Effect of sun exposure versus oral vitamin D supplementation on serum 25-hydroxyvitamin D concentrations in young adults: A randomized clinical trial. Clin. Nutr. 2020, 39, 727–736. [Google Scholar] [CrossRef]
- Dimakopoulos, I.; Magriplis, E.; Mitsopoulou, A.-V.; Karageorgou, D.; Bakogianni, I.; Micha, R.; Michas, G.; Chourdakis, M.; Ntouroupi, T.; Tsaniklidou, S.-M.; et al. Association of serum vitamin D status with dietary intake and sun exposure in adults. Clin. Nutr. ESPEN 2019, 34, 23–31. [Google Scholar] [CrossRef] [PubMed]
- Matsuoka, L.Y.; Wortsman, J.; Haddad, J.G.; Hollis, B.W. In vivo threshold for cutaneous synthesis of vitamin D3. J. Lab. Clin. Med. 1989, 114, 301–305. [Google Scholar] [PubMed]
- Touvier, M.; Deschasaux, M.; Montourcy, M.; Sutton, A.; Charnaux, N.; Kesse-Guyot, E.; Assmann, K.E.; Fezeu, L.; Latino-Martel, P.; Druesne-Pecollo, N.; et al. Determinants of vitamin D status in caucasian adults: Influence of Sun exposure, dietary intake, sociodemographic, lifestyle, anthropometric, and genetic factors. J. Investig. Dermatol. 2015, 135, 378–388. [Google Scholar] [CrossRef]
- Holick, M.F. The vitamin D deficiency pandemic and consequences for nonskeletal health: Mechanisms of action. Mol. Asp. Med. 2008, 29, 361–368. [Google Scholar] [CrossRef]
- Mateo-Pascual, C.; Julián-Viñals, R.; Alarcón-Alarcón, T.; Castell-Alcalá, M.V.; Iturzaeta-Sánchez, J.M.; Otero-Piume, A. Déficit de vitamina D en una cohorte de mayores de 65 años: Prevalencia y asociación con factores sociodemográficos y de salud. Rev. Esp. Geriatr. Gerontol. 2014, 49, 210–216. [Google Scholar] [CrossRef] [PubMed]
- Azzam, E.; Elsabbagh, N.; Elgayar, N.; Younan, D. Relation between vitamin D and geriatric syndrome. Clin. Nutr. ESPEN 2020, 35, 123–127. [Google Scholar] [CrossRef]
- Li, H.; Huang, T.; Xiao, P.; Zhao, X.; Liu, J.; Cheng, H.; Dong, H.; Morris, H.A.; Mi, J. Widespread vitamin D deficiency and its sex-specific association with adiposity in Chinese children and adolescents. Nutrition 2020, 71, 110646. [Google Scholar] [CrossRef] [PubMed]
- Shantavasinkul, P.C.; Phanachet, P.; Puchaiwattananon, O.; Chailurkit, L.; Lepananon, T.; Chanprasertyotin, S.; Ongphiphadhanakul, B.; Warodomwichit, D. Vitamin D status is a determinant of skeletal muscle mass in obesity according to body fat percentage. Nutrition 2015, 31, 801–806. [Google Scholar] [CrossRef] [PubMed]
- González, L.; Ramos-Trautmann, G.; Díaz-Luquis, G.M.; Pérez, C.M.; Palacios, C. Vitamin D status is inversely associated with obesity in a clinic-based sample in Puerto Rico. Nutr. Res. 2015, 35, 287–293. [Google Scholar] [CrossRef] [PubMed]
- Delle Monache, S.; Di Fulvio, P.; Iannetti, E.; Valerii, L.; Capone, L.; Nespoli, M.G.; Bologna, M.; Angelucci, A. Body mass index represents a good predictor of vitamin D status in women independently from age. Clin. Nutr. 2019, 38, 829–834. [Google Scholar] [CrossRef] [PubMed]
- Moreira, J.S.R.; de Paula, T.P.; Sperb, L.F.; Miller, M.E.P.; Azevedo, M.J.; Viana, L.V. Association of plasma vitamin D status with lifestyle patterns and ambulatory blood pressure monitoring parameters in patients with type 2 diabetes and hypertension. Diabet. Res. Clin. Pract. 2018, 139, 139–146. [Google Scholar] [CrossRef] [PubMed]
- Płudowski, P.; Karczmarewicz, E.; Bayer, M.; Carter, G.; Chlebna-Sokół, D.; Czech-Kowalska, J.; Dębski, R.; Decsi, T.; Dobrzańska, A.; Franek, E.; et al. Practical guidelines for the supplementation of vitamin D and the treatment of deficits in Central Europe-recommended vitamin D intakes in the general population and groups at risk of vitamin D deficiency. Endokrynol. Pol. 2013, 64, 319–327. [Google Scholar] [CrossRef]
- Alpert, P.T.; Shaikh, U. The Effects of Vitamin D Deficiency and Insufficiency on the Endocrine and Paracrine Systems. Biol. Res. Nurs. 2007, 9, 117–129. [Google Scholar] [CrossRef] [PubMed]
- Tabatabaeizadeh, S.-A.; Fazeli, M.; Meshkat, Z.; Khodashenas, E.; Esmaeili, H.; Mazloum, S.; Ferns, G.A.; Abdizadeh, M.F.; Ghayour-Mobarhan, M. The effects of high doses of vitamin D on the composition of the gut microbiome of adolescent girls. Clin. Nutr. ESPEN 2020, 35, 103–108. [Google Scholar] [CrossRef]
- McCarroll, K.; Beirne, A.; Casey, M.; McNulty, H.; Ward, M.; Hoey, L.; Molloy, A.; Laird, E.; Healy, M.; Strain, J.J.; et al. Determinants of 25-hydroxyvitamin D in older Irish adults. Age Ageing 2015, 44, 847–853. [Google Scholar] [CrossRef]
- Mehramiz, M.; Khayyatzadeh, S.S.; Esmaily, H.; Ghasemi, F.; Sadeghi-Ardekani, K.; Tayefi, M.; Mirmousavi, S.J.; Hanachi, P.; Bahrami-Taghanaki, H.; Eslami, S.; et al. Associations of vitamin D binding protein variants with the vitamin D-induced increase in serum 25-hydroxyvitamin D. Clin. Nutr. ESPEN 2019, 29, 59–64. [Google Scholar] [CrossRef]
- Surve, S.; Begum, S.; Joshi, B.; Khatkhatay, M.I.; Kadam, S.; Chauhan, S. Significance of vitamin D binding protein in assessing vitamin D status among under-five children. Ind. J. Clin. Biochem. 2020. [Google Scholar] [CrossRef]
- Tsuprykov, O.; Buse, C.; Skoblo, R.; Haq, A.; Hocher, B. Reference intervals for measured and calculated free 25-hydroxyvitamin D in normal pregnancy. J. Steroid Biochem. Mol. Biol. 2018, 181, 80–87. [Google Scholar] [CrossRef]
- Schwartz, J.B.; Gallagher, J.C.; Jorde, R.; Berg, V.; Walsh, J.; Eastell, R.; Evans, A.L.; Bowles, S.; Naylor, K.E.; Jones, K.S.; et al. Determination of Free 25(OH)D concentrations and their relationships to total 25(OH)D in multiple clinical populations. J. Clin. Endocrinol. Metab. 2018, 103, 3278–3288. [Google Scholar] [CrossRef]
- Bikle, D.D.; Schwartz, J. Vitamin D binding protein, total and free vitamin D levels in different physiological and pathophysiological conditions. Front. Endocrinol. 2019, 10, 317. [Google Scholar] [CrossRef] [PubMed]
- Pronicka, E.; Ciara, E.; Halat, P.; Janiec, A.; Wójcik, M.; Rowińska, E.; Rokicki, D.; Płudowski, P.; Wojciechowska, E.; Wierzbicka, A.; et al. Biallelic mutations in CYP24A1 or SLC34A1 as a cause of infantile idiopathic hypercalcemia (IIH) with vitamin D hypersensitivity: Molecular study of 11 historical IIH cases. J. Appl. Genet. 2017, 58, 349–353. [Google Scholar] [CrossRef]
- Normando, P.; Santos-Rebouças, C.; Leung, C.; Epel, E.; da Fonseca, A.C.; Zembrzuski, V.; Faerstein, E.; Bezerra, F.F. Variants in gene encoding for vitamin D binding protein were associated with leukocyte telomere length: The Pró-Saúde study. Nutrition 2020, 71, 110618. [Google Scholar] [CrossRef] [PubMed]
- Ahn, J.; Yu, K.; Stolzenberg-Solomon, R.; Simon, K.C.; McCullough, M.L.; Gallicchio, L.; Jacobs, E.J.; Ascherio, A.; Helzlsouer, K.; Jacobs, K.B.; et al. Genome-wide association study of circulating vitamin D levels. Hum. Mol. Genet. 2010, 19, 2739–2745. [Google Scholar] [CrossRef] [PubMed]
- Sangkaew, B.; Nuinoon, M.; Jeenduang, N. Association of vitamin D receptor gene polymorphisms with serum 25(OH)D levels and metabolic syndrome in Thai population. Gene 2018, 659, 59–66. [Google Scholar] [CrossRef]
- Zaki, M.; Kamal, S.; Basha, W.A.; Youness, E.; Ezzat, W.; El-Bassyouni, H.; Amr, K. Association of vitamin D receptor gene polymorphism (VDR) with vitamin D deficiency, metabolic and inflammatory markers in Egyptian obese women. Genes Dis. 2017, 4, 176–182. [Google Scholar] [CrossRef]
- Elzehery, R.R.; Baiomy, A.A.; Hegazy, M.A.-F.; Fares, R.; El-Gilany, A.-H.; Hegazi, R. Vitamin D status, receptor gene BsmI (A/G) polymorphism and breast cancer in a group of Egyptian females. Egypt. J. Med. Hum. Genet. 2017, 18, 269–273. [Google Scholar] [CrossRef]
- De Medeiros Cavalcante, I.G.; Silva, A.S.; Calvalho Costa, M.J.; Persuhn, D.C.; Ibrahim Issa, C.T.M.; de Luna Freire, T.L.; Rodrigues Gonçalves, M.C. Effect of vitamin D3 supplementation and influence of BsmI polymorphism of the VDR gene of the inflammatory profile and oxidative stress in elderly women with vitamin D insufficiency. Exp. Gerontol. 2015, 66, 10–16. [Google Scholar] [CrossRef]
- Thacher, T.D.; Levine, M.A. CYP2R1 mutations causing vitamin D-deficiency rickets. J. Steroid Biochem. Mol. Biol. 2017, 173, 333–336. [Google Scholar] [CrossRef]
- Bahrami, A.; Mehramiz, M.; Ghayour-Mobarhan, M.; Bahrami-Taghanaki, H.; Sadeghi Ardekani, K.; Tayefi, M.; Sadeghzade, M.; Rashidmayvan, M.; Safari Ghalezou, M.; Ferns, G.A.; et al. A genetic variant in the cytochrome P450 family 2 subfamily R member 1 determines response to vitamin D supplementation. Clin. Nutr. 2019, 38, 676–681. [Google Scholar] [CrossRef]
- Zhou, Y.; Zhao, L.-J.; Xu, X.; Ye, A.; Travers-Gustafson, D.; Zhou, B.; Wang, H.-W.; Zhang, W.; Lee Hamm, L.; Deng, H.-W.; et al. DNA methylation levels of CYP2R1 and CYP24A1 predict vitamin D response variation. J. Steroid Biochem. Mol. Biol. 2014, 144, 207–214. [Google Scholar] [CrossRef] [PubMed]


| Analyzed Compounds | Matrix | Method | Sample Preparation | Chromatographic Conditions | LOQ (ng/mL) | Ref. |
|---|---|---|---|---|---|---|
| 25(OH)D3, 25(OH)D2 | Plasma | LC-MS/MS | alkaline hydrolysis of lipid esters followed by SPE | Column: Supelcosil LC-18-S (250 × 4.6 mm, 5 µm) Mobile phase: 0.1% formic acid in methanol, 0.1% formic acid in methanol/water (50:50, v/v), gradient elution. | 25(OH)D3: 3.2 25-OH-D2: 3.4 | [39] |
| 25(OH)D2, 25(OH)D3 | Dried blood spots serum | LC-MS/MS | protein precipitation with methanol, LLE with hexane | Column: Varian Pursuit 3u PFP (50 × 2.0 mm, 3 µm). Mobile phase: 0.1% formic acid and 2 mM ammonium acetate, isocratic elution. | n.a. | [40] |
| 25(OH)D2, 25(OH)D3 | Serum | LC-MS/MS | Protein precipitation with methanol and ZnSO4 | Column: PFP (150 × 2.1 mm, 2.5 µm). Mobile phase: 0.1% formic acid in water and methanol, gradient elution. | 25(OH)D3: 0.9 25(OH)D2: 1.03 | [41] |
| 3α-25(OH)D3, 3β-25(OH)D3 | Dried blood spots serum | LC-MS/MS | 1. Dried blood spots: extraction 2. serum: SLE | Kinetex PFP F5 100A column (100 × 2.1 mm, 2.6 µm). Mobile phases: (A) water 0.1% formic acid and (B) methanol 0.1% formic acid, gradient elution. | 3α-25(OH)D3: 0.1 3β-25(OH)D3: 1.0 | [42] |
| 25(OH)D3, 3-epi-25(OH)D3 | Serum | LC-MS/MS | protein precipitation with acetonitrile | Column: Luna C18 (250 × 4.6 mm, 2.3 µm) Mobile phase: 0.1% formic acid in water and in acetonitrile, isocratic flow | n.a. | [43] |
| 25(OH)D3, 3-epi-25(OH)D3 | Plasma (cord blood) | LC-MS/MS | LLE with hexane | Column: PFP (150 × 2 mm, 3 µm). | 25(OH)D3: 1.4 3-epi-25(OH)D3: 1.4 | [44] |
| 25(OH)D2 25(OH)D3, 24,25(OH)2D3, 3-epi-25(OH)D3 | Serum | LC-MS/MS | LLE with hexane | Column: Kinetex F5 (50 × 2.1 mm, 1.7 µm). Mobile phase: water and acetonitrile with 0.1% formic acid, isocratic elution. | n.a. | [45] |
| 24,25(OH)2D3 25(OH)D3 3-epi-25(OH)D3 25(OH)D2 | Serum | LC-MS/MS | 0.2 mM aqueous zinc sulfate, methanol. LLE with ethyl acetate and hexane | Column: F5 (100 mm × 2.1 mm, 2.7 µm). Mobile phase: 0.1% formic acid, 2 mM ammonium acetate in water, and 0.1% formic acid, 2 mM ammonium acetate in methanol, gradient elution | n.a. | [46] |
| D2-S, D3-S 25(OH)D2-S 25(OH)D3-S | Serum, breast milk | LC-MS/MS | Sample precipitation with acetonitrile | Column: EC-C18 (15 × 2.1mm, 2.7 µm), Mobile phase: water with 10mM ammonium formate and methanol with 10mM ammonium formate, gradient elution. | Milk/serum D2-S: 0.002/0.003 D3-S: 0.003/0.003 25(OH)D2-S: 0.003/0.004 25(OH)D3-S: 0.003/0.004 | [47] |
| 25(OH)D3-S, 25(OH)D3-G | Serum, plasma | LC-MS/MS | SPE, derivatization with DAPTAD | Column: Hypersil Gold (2.1 × 100 mm, 1.9 μm) Mobile phase: 5 mM ammonium acetate, acetonitrile, gradient elution. | 25(OH)D3-S: 2.5 25(OH)D3-G: 1.73 | [48] |
| 25(OH)D3, 25(OH)D2, 3-epi-25(OH)D3, 1α,25(OH)2D3, 23,25(OH)2D3, 24,25(OH)2D3, 3-epi-25(OH)D2, 1α,25(OH)2D2, 1α,24(OH)2D2, D2, D3 | Serum | LC-MS/MS | SLE | Column: Lux Cellulose- 3 chiral column (100 × 2 mm, 3 µm). Mobile phase: methanol/water/0.1% formic acid, gradient elution | n.a. | [16] |
| D3, 25(OH)D3, 24R,25(OH)2 D3, 1α,25(OH)2 D3, 4β,25(OH)2 D3 | Plasma | LC-MS/MS | LLE with ethyl acetate | Column: Hypersil Gold (2.1 × 100 mm, 1.9 µm). Mobile phase: acetonitrile/water (0.1% formic acid) | 1a,25(OH)2D3: 0.025 24R,25(OH)2D3: 0.05 25OHD3: 0.05 | [49] |
| 25(OH)D2, 25(OH)D3, 3-epi-25(OH)D3, 24,25(OH)2D3 | Serum | LC-MS/MS | protein precipitation with acetonitrile and ZnSO4 | Column: Kinetex PFP 100 Å (100 × 2.1 mm, 2.6 μm). Mobile phase: water and methanol, both with 0.1% formic acid, gradient elution. | 24,25(OH)2D3: 0.5 25(OH)D3: 1.1 epi-25(OH)D3: 1.1 25(OH)D2: 1.7 | [50] |
| 24,25(OH)2D3, 24,25(OH)2D2, 25(OH)D3, 25(OH)D2 | Serum | LC-MS/MS | SLE | Column: core-shell C18 (50 × 2.1 mm, 2.6 μm). Mobile phase: water and methanol, both with 0.2 mM methylamine in 0.1% formic acid, gradient elution. | 24,25(OH)2D3, 25(OH)D3, 25(OH)D2: 0.04 24,25(OH)2D2: 0.34 | [51] |
| 24,25(OH)2D3, 24,25(OH)2D2, 1,25(OH)2D2, 25(OH)D3, 3-epi-25(OH)D3, 25(OH)D2, D2, D3 | Serum | 2D-LC-MS-MS | SPE | Columns: Poroshel 120 EC-C18 (50 × 4.6 mm, 2.7 µm), Pursuit PFP (100 × 4,6 mm, 3 µm). Mobile phase: water and methanol, both with 5 mM ammonium formate, 20:80, gradient elution. | 24,25(OH)2D3, 24,25(OH)2D2: 0.03 1,25(OH)2D2: 0.05 25(OH)D3, 25(OH)D2: 0.25 3-epi-25(OH)D3: 0.3 D2, D3: 0.1 | [52] |
| 1,25(OH)2D2, 1,25(OH)2D3 | Serum | 2D ID-UPLC-MS/MS | Immuno-extraction | Column 1: C4 BEH300 (50 × 2.1 mm, 1.7 µm) Mobile phase 1: water/water with 0.2%. formic acid/acetonitrile, 75:20:5 (v/v/v), gradient elution. Column 2: C18 BEH (100 × 2.1 mm, 1.7 µm) Mobile phase 2: 60:40 (v/v) water with 0.2% formic acid/acetonitrile, gradient elution. | 1,25(OH)2D2: 0.0015 1,25(OH)2D3: 0.0014 | [19] |
| D3, D2, 25(OH)D3, 1(OH)D3, 1(OH)D2, 24,25(OH)2D3, 1,25(OH)2D2, 1,25(OH)2D3 | Plasma | UPSFC-MS | LLE with acetonitrile | Columns: Torus 2-picolylamine, Torus diethylamine, Torus high density diol, Torus 1-aminoanthracene, fluorophenyl (each column: 100 × 3 mm, 1.7 µm), HSS C18SB (100mm × 3mm, 1.8 µm) Mobile Phase: CO2, methanol, gradient elution. | D3: 5.43, D2: 7.25 25(OH)D2: 17.22 25(OH)D3: 6.56 1(OH)D3: 7.75 1(OH)D2: 18.11 24,25(OH)2D3: 1.19 1,25(OH)2D2: 6.18 1,25(OH)2D3: 7.57 | [13] |
| 25(OH)D3, 25(OH)D2, 24(OH)D2, D2, D3, 3-epi-25(OH)D3, 1α,25(OH)2D3, 24R,25(OH)2D3, 23R,25(OH)2D3, 1α,25(OH)2D3-PTAD, 24,25(OH)2D3-PTAD | Serum | UPSFC- MS/MS | SLE | Column: Lux cellulose-3 chiral column (150 × 3 mm, 3 μm) and UPC2 BEH column (100 × 3 mm, 1.7 μm). Mobile phase: CO2 and 0.1% formic acid in methanol with a make-up solvent of 0.1% formic acid, gradient elution | 1α,25(OH)2D3: 0.08 | [53] |
| Analyzed Compounds | Matrix | Disease | Studied Group (N) | Conclusions | Ref. |
|---|---|---|---|---|---|
| 25(OH)D3 3-Epi-25(OH)D3, 25(OH)D2, 24,25(OH)2D3, 1,25(OH)2D3 | Synovial fluid serum | RA | 20 patients with rheumatoid arthritis (RA), 7 patients with resolving reactive arthritis (ReA), 23 healthy controls |
| [57] |
| vitamin D | serum | RA | 149 patients with RA |
| [59] |
| 1,25(OH)2D 25(OH)D | serum | psoriasis | 122 patients with psoriasis | Inverse relationship found between 1,25(OH)2D and:
| [61] |
| 25(OH)D3 | serum | metabolic disorders | 92 subjects deficient in vitamin D; 48 with vitamin D supplementation and 44 without supplementation |
| [64] |
| 25(OH)D | serum | breast and prostate cancer | 15.748 breast cancer cases, 22.898 prostate cancer cases |
| [69] |
| 25(OH)D | blood * | colorectal cancer | 5706 colorectal cancer participants, 7107 controls |
| [70] |
| Vitamin D | serum | Cancer cardiovascular disease | 25,871 (12,927 after supplementation, 12,944 after placebo) | After 1-year supplementation of 2 000 IU vitamin D:
| [71] |
| 1,25(OH)2D3 | serum | Diabetic Retinopathy | 66 diabetic patients, 20 nondiabetic healthy patients |
| [72] |
| 25(OH)D | serum | chronic obstructive pulmonary disease | 278 | Association of vitamin D deficiency (<50 nmol/L) with:
| [73] |
| 25(OH)D | serum | metabolic syndrome | 559 Chinese subjects at elevated risk of metabolic syndrome |
| [74] |
| 25(OH)D | Dried blood spots | multiple sclerosis | 521 patients with multiple sclerosis, 972 controls |
| [75] |
| 25(OH)D | serum | Bronchiolitis | 50 infants with bronchiolitis, 31 controls |
| [76] |
| 25[OH]D3 | serum | food allergy | 5276, 269 nonallergic at age 1 y, 338 food allergic at age 1 y, 50 egg tolerant at age 2 y, 55 egg allergic at age 2 y | Association of low serum 25(OH)D3 level (≤50 nM/L) at age 1 years with:
| [77] |
| 25(OH)D3 | serum | chronic kidney disease, depression | 533 Koreans participants |
| [78] |
| Vitamin D | serum | Depression | 5006 |
| [79] |
| 25(OH)D | serum | Post-Traumatic Stress Disorder (PTSD) | 1653 |
| [80] |
| Factors | Studied Group (N) | Conclusions | Ref. |
|---|---|---|---|
| Parathyroid hormone (PTH), calcium | 2259 adults (18–68 years old). | Significant correlations between Ca2+ and PTH (r = −0.223, p < 0.001), 25(OH)D and PTH (r = −0.178, p < 0.001) and between PTH and age (r = 0.322, p < 0.001) were found. | [17] |
| calcium, PTH, alkaline phosphatase | 58 children and adolescents | A positive and significant correlation was found between dietary calcium and vitamin D (r = 0.77, p < 0.001). | [90] |
| sun exposure (<30 min and ≥30 min per week) PTH ionized calcium | 1339 ≥18 years old | The median of 25(OH)D <10 ng/mL associated with hypercalcemia. The levels of 25(OH)D were higher in women who received >30 min of sun exposure per week, and who claimed to use sunscreen <3 times/week (p ≤ 0.001). | [91] |
| glutathione and cysteine thiol/di-sulfide redox status | 693 adults (449 females, 244 males) | Serum 25(OH)D was positively associated with plasma GSH and negatively associated with plasma redox potentials—Eh GSSG and Cys (p < 0.001 for all). | [92] |
| low dietary magnesium intake | 57 (22–65 years old, BMI 25–45 kg/m2) | Higher serum levels of 25(OH)D were negatively associated with lower PTH in the high magnesium intake group (p = 0.041). A positive relationship between 25(OH)D and serum adiponectin concentrations was observed in the high magnesium intake group (r = 0.532, r = 0.022). Serum interleukin-6 concentrations were negatively associated with 25(OH)D levels (r = −0.316, p = 0.017). | [94] |
| nuclear factor kappa-B activity | 49 | In healthy adults, 25(OH)D concentrations were positively associated with NFκB activity in peripheral blood mononuclear cells (r = 0.48, p = 0.0008). | [95] |
| place of residence: urban area, rural area, season, sex | 17,590 (urban n = 4824; rural n = 12,766) | Serum 25(OH)D concentrations were lower among rural compared to urban dwellers and depend on sex (p < 0.001) and age (for urban p < 0.001, for rural p < 0.001). | [99] |
| Ancestry, vitamin D binding protein | 750 healthy children (6–36 months old) | 25(OH)D levels are positively correlated with circulating DBP (R = 0.25, p < 0.001). Circulating 25(OH)D was positively correlated with European ancestry (p < 0.001), and negatively correlated with African ancestry (R = −0.09, p = 0.016). | [100] |
| vitamin D supplementation, sun exposure (>20 min/day during summer, and >30 min/day during fall) | 50: sun 50: oral vitamin D3 50: placebo | Increases in serum 25(OH)D were greater with oral vitamin D3 than with sun exposure (difference in changes = 6.3 ng/mL, 95% CI: 4.3, 8.3). 54.2% participants in the oral vitamin D3, 12.2% in the sun exposure and 4.3% controls achieved serum 25(OH)D concentrations ≥20 ng/mL | [102] |
| sun exposure (0–1 h/day, 1–3 h/day, and >3 h/day), dietary intake | 1084 adults | The odds of having 25(OH)D <20 ng/mL significantly decreased with being very active (OR 0.55), increasing length of sun exposure (1–3 h/day (OR 0.59), >3 h/day (OR 0.36)), and skin color (light to medium skin (OR 0.47), fairly dark skin color (OR 0.34) and dark or very dark skin color (OR 0.34)), compared to respective baseline levels. | [103] |
| sex | 50 > 65 years old | Significant association between low vitamin D level and female gender (p = 0.024), advanced age (p = 0.026), no-sun exposure jobs (p = 0.001) and nursing home residency. | [108] |
| adiposity, age sex | 10,696 at 6–18 years old | The prevalence rates of vitamin D deficiency and insufficiency were higher in girls (31% and 83.4%, respectively) than in boys (22.8% and 78.7%, respectively). Fat mass index and fat mass percentage were inversely associated with 25(OH)D concentrations, particularly in boys (p < 0.05). The association of age with vitamin D had L-shape with a threshold age of 14. | [109] |
| adiposity | 163 obese | Serum 25(OH)D concentrations were negatively associated with percent body fat (%BF) (p = 0.003), positively associated with skeletal muscle mass (SMM) (p = 0.03). | [110] |
| adiposity | 797 | Mean 25(OH)D levels were significantly higher in normal weight and overweight males compared to obese males (p < 0.05) and in overweight females compared to obese females (p < 0.05). BMI, waist circumference, and waist-to-height ratio were inversely correlated with 25(OH)D levels (p < 0.001). | [111] |
| BMI, adiposity | women with age 19–80 | 25(OH)D concentration was dependent on season. BMI demonstrated the highest significant inverse correlation with serum 25(OH)D values (p < 0.001), independently from season and age. | [112] |
| age, sex, obesity, season, latitudes, lifetime sun exposure (scores: 1–10), physical activity, ancestry | 1828 Caucasian middle-aged men and women | Vitamin D status was lower among women (p < 0.0001), older subjects (p = 0.04), obese or underweight subjects (p < 0.0001), subjects who lived at higher latitudes (p < 0.0001), and those whose blood draw occurred in early spring (p < 0.0001). Vitamin D status was higher among subjects who were more physically active (p < 0.0001), who had higher scores of usual sun exposure (p < 0.0001), those with higher Fitzpatrick photo-type (p = 0.03). | [105] |
| nutritional and lifestyle patterns | 116 | Vitamin D deficiency was associated with higher systolic ambulatory and daytime blood pressure monitoring (p = 0.01 and p = 0.02, respectively), lower step counts, lower urinary calcium, and higher fat mass. Milk intake (p = 0.009) and fish (p < 0.001) were lower in the deficient. | [113] |
| vitamin D supplementation, microbiome | 50 adolescent girls before and after vitamin D supplementation | The mean (±SD) of serum vitamin D level at baseline was 11 ± 9 ng/mL and after high dose vitamin D supplementation it increases to 40 ± 17 ng/mL (p < 0.001). A high dose supplementation of vitamin D alter the human gut microbiome composition: Bacteroidetes and Lactobacillus fell by 72% and 24% respectively, whilst Firmicutes and Bifidobacterium were increased by1.5 and 1.2 fold after supplementation. | [116] |
| Vitamin D binding protein | 210 children (1–5 years old) | 25(OH)D levels correlated positively with DBP (r = 0.298, p = 0.0001). 52.7% of children with vitamin D deficiency had low DBP (p = 0.015). Despite adequate sun exposure, 43% of children showed vitamin D deficiency and 56.6% had low DBP levels. | [119] |
| Vitamin D binding protein | 368 pregnant women | Free 25(OH)D lowers by 12% in the 3rd trimester comparing to the 1st trimester (p < 0.05) whereas total 25(OH)D was not decreased. DBP rises with gestational age. | [120] |
| Vitamin D binding protein, race | 1661 adults (healthy, prediabetic, pregnant, cirrhotic, nursing home residents) | Levels of free 25(OH)D were higher in patients with cirrhosis (p < 0.0033) while DBP concentrations were lower than in other groups and differed between whites and blacks (p < 0.0033) and between DBP haplotypes (p < 0.0001). | [121] |
| rs12785878, rs10741657, rs6013897, rs2282679 | 461 (33–79 years old) | Participants with CC genotype (rs2282679) had shorter age- and sex-adjusted mean leukocyte telomere length (LTL) than those with AC and AA genotypes (p < 0.05). Serum 25(OH)D concentrations were not associated with LTL. | [124] |
| FokI BsmI TaqI Cdx2 | 237 participants with metabolic syndrome (MetS), 376 controls | VDR TaqI TT, and BsmI BB + Bb genotypes were associated with lower 25(OH)D levels (p < 0.05) in comparison to TaqI Tt, and BsmI bb genotypes in the MetS group. Cdx2 GG genotype was associated with higher waist circumference compared with the AG genotype in all subjects (p < 0.05). BB + Bb genotypes of the VDR BsmI had significantly increased the odds ratio of hypertriglyceridemia when compared with the bb genotype (OR 1.87, p = 0.022). | [126] |
| BsmI Apa-I TaqI obesity | 201 obese women with vitamin D deficiency; 249 controls | In obese with vitamin D deficiency, carriers of polymorphic alleles showed significant lower levels of serum 25(OH)D and higher HOMA-IR (the homeostasis model assessment of insulin resistance; p = 0.04), blood pressure levels (p < 0.001) and lipid parameters compared to those with the wild type homozygotes (p = 0.02). | [127] |
| receptor gene BsmI (A/G) polymorphism | 60 females with breast cancer (BC) | 25(OH) vitamin D levels were significantly lower in the patients with BC compared to controls (p ≤ 0.001). Carriers of Bb genotype had 4.6 times increased risk of developing breast cancer when compared to other genotypes. | [128] |
| BsmI polymorphism of the VDR gene, supplementation | 40 elderly women with vitamin D insufficiency | Supplementation with a vitamin D3 megadose reduced inflammatory markers and increased the total antioxidant capacity in elderly women with vitamin D insufficiency (p = 0.03). The 25(OH)D (p = 0.0001), PTH (p = 0.009), us-CRP (p = 0.007) and α1-acid glycoprotein (p = 0.005) levels of elderly patients with the BB/Bb genotype were more responsive to supplementation compared with those with the bb genotype. | [129] |
| CYP2R1 | 27 children with rickets, 50 unrelated subjects | After supplementation with 50,000 IU of vitamin D2 or vitamin D3, heterozygous subjects for the L99P and K242N mutations had lower increases in serum 25(OH)D than control subjects. | [130] |
| rs4588, supplementation | 619 healthy adolescent girls | Polymorphism of rs4588 was associated with serum 25(OH)D both at baseline (p = 0.03) and after supplementation (p = 0.008). The subjects with common AA genotype were a better responder to vitamin D supplementation than GG. | [118] |
| CYP2R1 (rs10766197), supplementation | 253 healthy girls | Subjects who had homozygous major allele GG showed two-fold higher response in serum 25(OH)D than carriers of the uncommon allele A (OR = 2.1, p = 0.03). | [131] |
| DNA methylation levels of CYP2R1, CYP24A1, CYP27A1, CYP27B1 | 446 women supplemented with calcium and vitamin D | For CYP2R1, baseline DNA methylation levels at eight CpG sites were negatively associated with the 12-month increase in serum 25(OH)D (p < 0.05). For CYP24A1, baseline DNA methylation levels at −342C and −293C were negatively associated with vitamin D response variation (p = 0.011, p = 0.025, respectively). | [132] |
© 2020 by the authors. Licensee MDPI, Basel, Switzerland. This article is an open access article distributed under the terms and conditions of the Creative Commons Attribution (CC BY) license (http://creativecommons.org/licenses/by/4.0/).
Share and Cite
Kowalówka, M.; Główka, A.K.; Karaźniewicz-Łada, M.; Kosewski, G. Clinical Significance of Analysis of Vitamin D Status in Various Diseases. Nutrients 2020, 12, 2788. https://doi.org/10.3390/nu12092788
Kowalówka M, Główka AK, Karaźniewicz-Łada M, Kosewski G. Clinical Significance of Analysis of Vitamin D Status in Various Diseases. Nutrients. 2020; 12(9):2788. https://doi.org/10.3390/nu12092788
Chicago/Turabian StyleKowalówka, Magdalena, Anna K. Główka, Marta Karaźniewicz-Łada, and Grzegorz Kosewski. 2020. "Clinical Significance of Analysis of Vitamin D Status in Various Diseases" Nutrients 12, no. 9: 2788. https://doi.org/10.3390/nu12092788
APA StyleKowalówka, M., Główka, A. K., Karaźniewicz-Łada, M., & Kosewski, G. (2020). Clinical Significance of Analysis of Vitamin D Status in Various Diseases. Nutrients, 12(9), 2788. https://doi.org/10.3390/nu12092788