The Cost of Diets According to Their Caloric Share of Ultraprocessed and Minimally Processed Foods in Belgium


Abstract
1. Introduction
2. Materials and Methods
2.1. Food Consumption Survey (FCS)
2.2. Covariates
2.3. GfK Consumer Panel
2.4. Food Classification
- (1)
- Unprocessed or minimally processed foods (MPF) (for example: fresh, chilled, frozen, vacuum-packed vegetables and fruits; unsalted nuts and seeds; fresh, dried, chilled, frozen meats, poultry, fish, seafood).
- (2)
- Processed culinary ingredients (for example: plant oils; animal fats; sugar, and salt; starches).
- (3)
- Processed foods (for example: canned vegetables and legumes (pulses) preserved in brine; tinned whole or pieces of fish preserved in oil; salted nuts; breads when made from flour, water, ferments and salt).
- (4)
- Ultraprocessed foods (UPF) (for example: chips; many types of sweet, fatty or salty snack products; ice-cream; chocolates; candies; margarines; soft, carbonated, cola, energy drinks).
2.5. Data Analysis
3. Results
4. Discussion
5. Conclusion
Author Contributions
Funding
Acknowledgments
Conflicts of Interest
Abbreviations
| BMI | Body Mass Index |
| FCS | Food Consumption Survey |
| MPF | Minimally Processed Foods |
| UPF | Ultraprocessed Food Products |
| NCDs | Noncommunicable diseases |
| SPADE | Statistical Program to Assess Dietary Exposure |
Appendix A

| %E from UPF | %E from MPF | ||||||||
|---|---|---|---|---|---|---|---|---|---|
| Population Group | N | Mean | 95%CI | P75 | P95 | Mean | 95%CI | P75 | P95 |
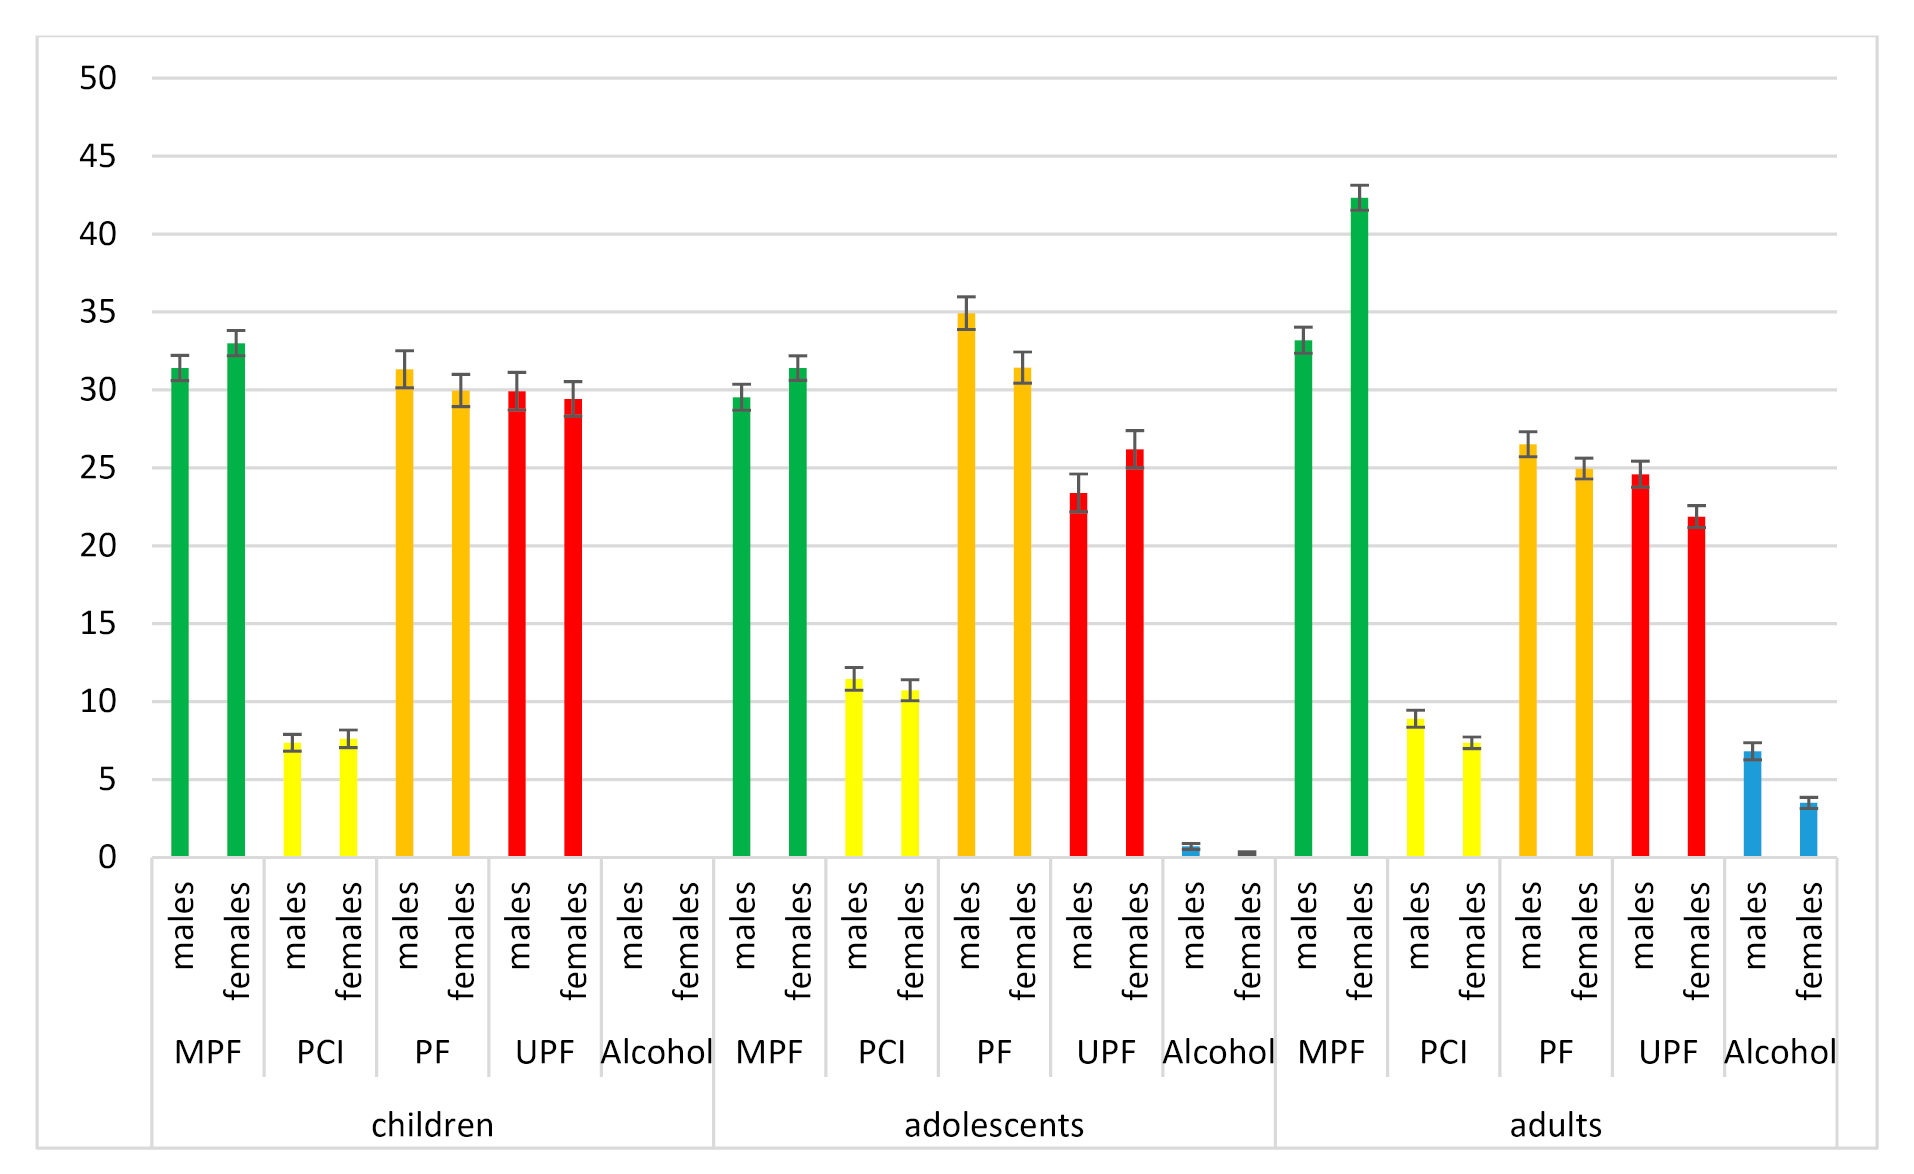
| All | 3146 | 29.9 | 29.0–30.8 | 38.9 | 53.3 | 21.3 | 20.7–21.9 | 26.9 | 38.7 |
| Sex | |||||||||
| Females | 1598 | 29.7 | 28.7–31.2 | 38.0 | 51.5 | 22.9 | 22.2–23.7 | 28.6 | 40.2 |
| Males | 1548 | 29.9 | 28.6–31.2 | 39.5 | 54.6 | 19.6 | 18.8–20.4 | 24.9 | 36.4 |
| Age category | |||||||||
| 3–9 years | 992 | 33.3 | 32.1–35.0 | 44.4 | 60.3 | 20.1 | 19.3–20.7 | 25.4 | 36.8 |
| 10–17 years | 928 | 29.2 | 27.7–30.3 | 39.3 | 54.7 | 17.9 | 17.4–18.7 | 22.8 | 33.2 |
| 18–64 years | 1226 | 29.6 | 28.5–30.7 | 38.2 | 51.8 | 22.0 | 21.2–22.7 | 27.7 | 39.5 |
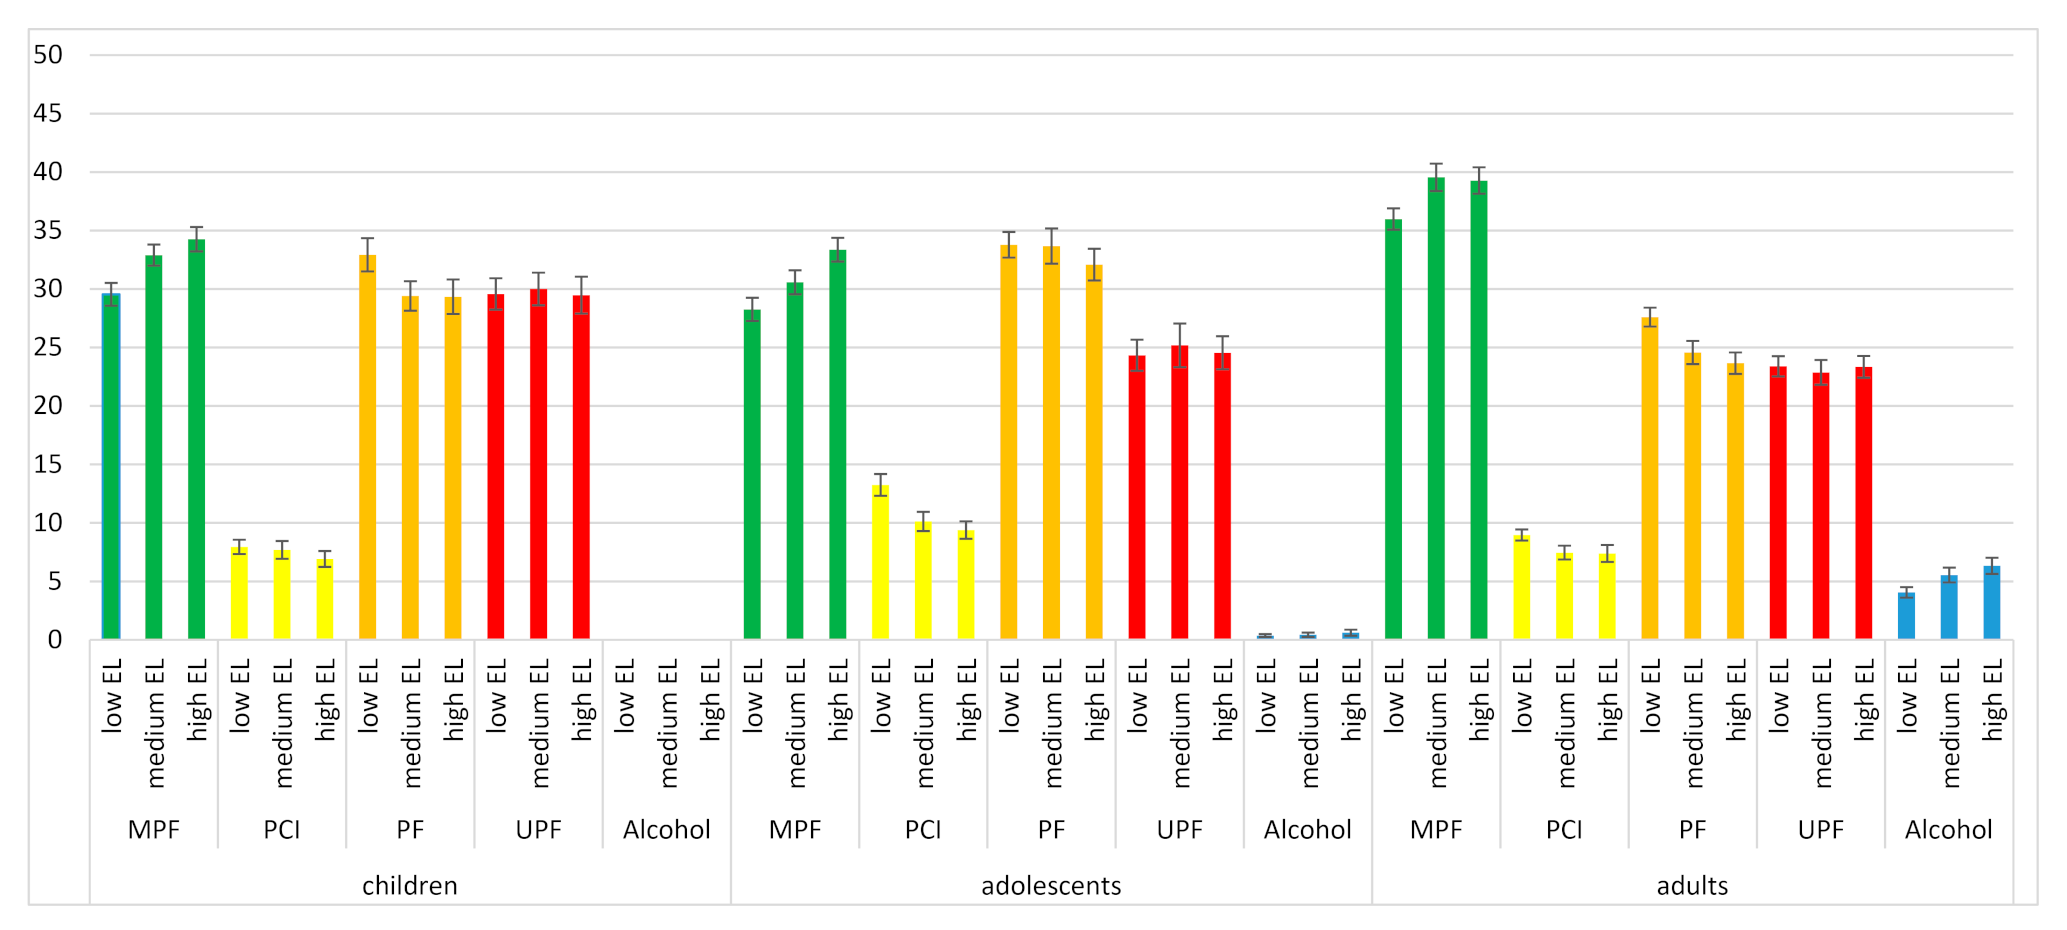
| Education level | |||||||||
| Low | 1290 | 30.5 | 28.6–31.5 | 39.0 | 52.0 | 19.9 | 19.2–20.9 | 25.4 | 37.9 |
| Medium | 885 | 29.9 | 28.0–31.4 | 40.2 | 56.4 | 21.4 | 20.2–22.5 | 27.1 | 39.1 |
| High | 916 | 30.5 | 28.9–31.9 | 38.8 | 52.0 | 22.8 | 21.8–23.8 | 28.1 | 38.2 |
| Sex | Age Category | EL | n | Average Cost | 95% CI | |
|---|---|---|---|---|---|---|
| Males | Children (3–9 years; n = 509) | low | 180 | EUR/day | 4.09 | 3.79–4.40 |
| EUR/2000 kcal | 5.31 | 5.05–5.58 | ||||
| medium | 155 | EUR/day | 4.27 | 3.97–4.58 | ||
| EUR/2000 kcal | 5.37 | 5.16–5.57 | ||||
| High | 162 | EUR/day | 4.34 | 4.10–4.57 | ||
| EUR/2000 kcal | 5.50 | 5.26–5.74 | ||||
| Adolescents * (10–17 years; n = 450) | Low | 192 | EUR/day | 5.30 | 5.00–5.58 | |
| EUR/2000 kcal | 5.25 | 5.08–5.42 | ||||
| Medium | 114 | EUR/day | 5.43 | 5.00–5.87 | ||
| EUR/2000 kcal | 5.31 | 5.13–5.49 | ||||
| high | 133 | EUR/day | 5.67 | 5.30–6.04 | ||
| EUR/2000 kcal | 5.54 | 5.32–5.75 | ||||
| Adults * (18–64 years; n = 589) | Low | 270 | EUR/day | 7.25 | 6.84–7.66 | |
| EUR/2000 kcal | 6.35 | 6.12–6.58 | ||||
| medium | 167 | EUR/day | 7.60 | 7.09–8.12 | ||
| EUR/2000 kcal | 6.75 | 6.46–7.03 | ||||
| high | 145 | EUR/day | 7.43 | 6.91–7.94 | ||
| EUR/2000 kcal | 6.75 | 6.39–7.11 | ||||
| Females | Children *** (3–9 years; n = 483) | low | 176 | EUR/day | 3.81 | 3.59–4.03 |
| EUR/2000 kcal | 5.24 | 5.07–5.42 | ||||
| Medium | 146 | EUR/day | 3.96 | 3.72–4.20 | ||
| EUR/2000 kcal | 5.66 | 5.27–6.05 | ||||
| high | 156 | EUR/day | 3.96 | 3.69–4.23 | ||
| EUR/2000 kcal | 5.62 | 5.39–5.85 | ||||
| Adolescents ** (10–17 years; n = 478) | Low | 192 | EUR/day | 4.27 | 4.07–4.48 | |
| EUR/2000 kcal | 5.34 | 5.14–5.53 | ||||
| medium | 132 | EUR/day | 4.77 | 4.46–5.09 | ||
| EUR/2000 kcal | 5.52 | 5.29–5.74 | ||||
| high | 143 | EUR/day | 4.79 | 4.51–5.06 | ||
| EUR/2000 kcal | 5.81 | 5.53–6.08 | ||||
| Adults * (18–64 years; n = 637) | low | 280 | EUR/day | 5.25 | 5.00–5.50 | |
| EUR/2000 kcal | 6.95 | 6.67–7.23 | ||||
| Medium | 171 | EUR/day | 5.84 | 5.54–6.14 | ||
| EUR/2000 kcal | 7.27 | 6.97–7.7 | ||||
| high | 177 | EUR/day | 6.17 | 5.83–6.50 | ||
| EUR/2000 kcal | 7.32 | 6.95–7.69 |
References
- Monteiro, C.A. Nutrition and health. The issue is not food, nor nutrients, so much as processing. Public Health Nutr. 2009, 12, 729–731. [Google Scholar]
- Monteiro, C.A.; Cannon, G.; Levy, R.B.; Moubarac, J.C.; Louzada, M.L.; Rauber, F.; Khandpur, N.; Cediel, G.; Neri, D.; Martinez-Steele, E.; et al. Ultra-processed foods: What they are and how to identify them. Public Health Nutr. 2019, 22, 936–941. [Google Scholar]
- Adams, J.; White, M. Characterisation of UK diets according to degree of food processing and associations with socio-demographics and obesity: Cross-sectional analysis of UK National Diet and Nutrition Survey (2008-12). Int. J. Behav. Nutr. Phys. Act. 2015, 12, 160. [Google Scholar]
- Batal, M.; Johnson-Down, L.; Moubarac, J.C.; Ing, A.; Fediuk, K.; Sadik, T.; Tikhonov, C.; Chan, H.M.; Willows, N. Quantifying associations of the dietary share of ultra-processed foods with overall diet quality in First Nations peoples in the Canadian provinces of British Columbia, Alberta, Manitoba and Ontario. Public Health Nutr. 2018, 21, 103–113. [Google Scholar]
- Cediel, G.; Reyes, M.; da Costa Louzada, M.L.; Steele, E.M.; A Monteiro, C.; Corvalán, C.; Uauy, R. Ultra-processed foods and added sugars in the Chilean diet (2010). Public Health Nutr. 2018, 21, 125–133. [Google Scholar]
- Juul, F.; Martinez-Steele, E.; Parekh, N.; Monteiro, C.A.; Chang, V.W. Ultra-processed food consumption and excess weight among US adults. Br. J. Nutr. 2018, 120, 90–100. [Google Scholar]
- Nardocci, M.; Leclerc, B.S.; Louzada, M.L.; Monteiro, C.A.; Batal, M.; Moubarac, J.-C. Consumption of ultra-processed foods and obesity in Canada. Can. J. Public Health 2018, 110, 4–14. [Google Scholar]
- Julia, C.; Martinez, L.; Alles, B.; Touvier, M.; Hercberg, S.; Méjean, C.; Kesse-Guyot, E. Contribution of ultra-processed foods in the diet of adults from the French NutriNet-Sante study. Public Health Nutr. 2018, 21, 27–37. [Google Scholar]
- Monteiro CA, Moubarac JC, Levy RB, Canella DS, Louzada MLDC, Cannon G. Household availability of ultra-processed foods and obesity in nineteen European countries. Public Health Nutr. 2018, 21, 18–26.
- Mendonca, R.D.; Pimenta, A.M.; Gea, A.; De La Fuente-Arrillaga, C.; Martínez-González, M.A.; Lopes, A.C.S.; Bes-Rastrollo, M. Ultraprocessed food consumption and risk of overweight and obesity: The University of Navarra Follow-Up (SUN) cohort study. Am. J. Clin. Nutr. 2016, 104, 1433–1440. [Google Scholar]
- Mendonca, R.D.; Lopes, A.C.; Pimenta, A.M.; Gea, A.; Martínez-González, M.A.; Bes-Rastrollo, M. Ultra-Processed Food Consumption and the Incidence of Hypertension in a Mediterranean Cohort: The Seguimiento Universidad de Navarra Project. Am. J. Hypertens. 2017, 30, 358–366. [Google Scholar]
- Fiolet, T.; Srour, B.; Sellem, L.; Kesse-Guyot, E.; Allès, B.; Méjean, C.; Deschasaux, M.; Fassier, P.; Latino-Martel, P.; Beslay, M.; et al. Consumption of ultra-processed foods and cancer risk: Results from NutriNet-Santé prospective cohort. Br. Med. J. 2018, 360, k322. [Google Scholar]
- Rico-Campà, A.; Martínez-González, M.A.; Alvarez-Alvarez, I.; Mendonça, R.D.; de la Fuente-Arrillaga, C.; Gómez-Donoso, C.; Bes-Rastrollo, M. Association between consumption of ultra-processed foods and all-cause mortality: SUN prospective cohort study. BMJ 2019, 365, l1949. [Google Scholar] [CrossRef]
- Monteiro, C.A.; Cannon, G.; Moubarac, J.C.; Levy, R.; Louzada, M.L.C.; Jaime, P.C. The UN Decade of Nutrition, the NOVA food classification and the trouble with ultra-processing. Public Health Nutr. 2018, 21, 5–17. [Google Scholar]
- Martinez, S.E.; Baraldi, L.G.; Louzada, M.L.; Moubarac, J.-C.; Mozaffarian, D.; Monteiro, C.A. Ultra-processed foods and added sugars in the US diet: Evidence from a nationally representative cross-sectional study. BMJ Open 2016, 6, e009892. [Google Scholar]
- Poti, J.M.; Mendez, M.A.; Ng, S.W.; Popkin, B.M. Is the degree of food processing and convenience linked with the nutritional quality of foods purchased by US households? Am. J. Clin. Nutr. 2015, 101, 1251–1262. [Google Scholar]
- Moubarac, J.C.; Martins, A.P.; Claro, R.M.; Levy, R.B.; Cannon, G.; Monteiro, C.A. Consumption of ultra-processed foods and likely impact on human health. Evidence from Canada. Public Health Nutr. 2013, 16, 2240–2248. [Google Scholar]
- Vandevijvere, S.; De Ridder, K.; Fiolet, T.; Bel, S.; Tafforeau, J. Consumption of ultra-processed food products and diet quality among children, adolescents and adults in Belgium. Eur. J. Nutr. 2019, 58, 3267–3278. [Google Scholar]
- Darmon, N.; Drewnowski, A. Contribution of food prices and diet cost to socioeconomic disparities in diet quality and health: A systematic review and analysis. Nutr. Rev. 2015, 73, 643–660. [Google Scholar]
- Gupta, S.; Hawk, T.; Aggarwal, A.; Drewnowski, A. Characterizing Ultra-Processed Foods by Energy Density, Nutrient Density, and Cost. Front. Nutr. 2019, 6, 70. [Google Scholar]
- Maia, E.G.; Dos Passos, C.M.; Levy, R.B.; Bortoletto Martins, A.P.; Mais, L.A.; Claro, R.M. What to expect from the price of healthy and unhealthy foods over time? The case from Brazil. Public Health Nutr. 2020, 23, 579–588. [Google Scholar]
- Machado, P.P.; Claro, R.M.; Canella, D.S.; Sarti, F.M.; Levy, R.B. Price and convenience: The influence of supermarkets on consumption of ultra-processed foods and beverages in Brazil. Appetite 2017, 116, 381–388. [Google Scholar] [CrossRef]
- Passos, C.M.D.; Maia, E.G.; Levy, R.B.; Martins, A.P.B.; Claro, R.M. Association between the price of ultra-processed foods and obesity in Brazil. Nutr. Metab. Cardiovasc. Dis. 2020, 30, 589–598. [Google Scholar] [CrossRef]
- Moubarac, J.C.; Claro, R.M.; Baraldi, L.G.; Levy, R.B.; Martins, A.P.; Cannon, G.; Monteiro, C.A. International differences in cost and consumption of ready-to-consume food and drink products: United Kingdom and Brazil, 2008–2009. Glob. Public Health 2013, 8, 845–856. [Google Scholar] [CrossRef]
- European Food Safety Authority. General principles for the collection of national food consumption data in the view of a pan-European dietary survey. EFSA J. 2009, 17, 1435.
- Bel, S.; Van den Abeele, S.; Lebacq, T.; Ost, C.; Brocatus, L.; Stiévenart, C.; Teppers, E.; Tafforeau, J.; Cuypers, K. Protocol of the Belgian food consumption survey 2014: Objectives, design and methods. Arch. Public Health 2016, 74, 20. [Google Scholar]
- De Ridder, K.; Bel, S.; Brocatus, L.; Lebacq, T.; Moyersoen, I.; Ost, C.; Teppers, E. De consumptie van voedingsmiddelen en de inname van voedingsstoffen. In Voedselconsumptiepeiling 2014–2015; Bel, S., Tafforeau, J., Eds.; Rapport 4; Wetenschappenlijk Instituut voor Volksgezondheid: Brussels, Belgium, 2016. [Google Scholar]
- Park, M.K.; Freisling, H.; Huseinovic, E.; Winkvist, A.; Huybrechts, I.; Crispim, S.P.; De Vries, J.H.M.; Geelen, A.; Niekerk, M.; van Rossum, C.; et al. Comparison of meal patterns across five European countries using standardized 24-h recall (GloboDiet) data from the EFCOVAL project. Eur. J. Nutr. 2018, 57, 1045–1057. [Google Scholar]
- Monteiro, C.A.; Levy, R.B.; Claro, R.M.; Castro, I.R.; Cannon, G. A new classification of foods based on the extent and purpose of their processing. Cad. Saude Publ. 2010, 26, 2039–2049. [Google Scholar]
- Lennernäs, M.; Fjellström, C.; Becker, W.; Giachetti, I.; Schmitt, A.; de Remaut Winter, A.M.; Kearney, M. Influences on food choice perceived to be important by nationally-representative samples of adults in the European Union. Eur. J. Clin. Nutr. 1997, 51 (Suppl. S2), 8. [Google Scholar]
- Glanz, K.; Basil, M.D.; Maibach, E.W.; Goldberg, J.; Snyder, D. Why Americans eat what they do: Taste, nutrition, cost, convenience, and weight control concerns as influences on food consumption. J. Am. Diet. Assoc. 1998, 98, 9. [Google Scholar]
- Djupegot, I.; Nenseth, C.B.; Bere, E.; Torgeirsdotter Bjørnarå, H.B.; Helland, S.H.; Øverby, N.C.; Torstveit, M.; Holte Stea, T. The association between time scarcity, sociodemographic correlates and consumption of ultra-processed foods among parents in Norway: A cross-sectional study. BMC Public Health 2017, 17, 447. [Google Scholar]
- Schnabel, L.; Kesse-Guyot, E.; Allès, B.; Touvier, M.; Srour, B.; Hercberg, S.; Buscail, C.; Julia, C. Association Between Ultraprocessed Food Consumption and Risk of Mortality Among Middle-aged Adults in France. JAMA Intern. Med. 2019, 179, 490–498. [Google Scholar]
- Baker, P.; Machado, P.; Santos, T.; Sievert, K.; Backholer, K.; Hadjikakou, M.; Russell, C.; Huse, O.; Bell, C.; Scrinis, G.; et al. Ultra-processed foods and the nutrition transition: Global, regional and national trends, food systems transformations and political economy drivers. Obes. Rev. 2020. [CrossRef]
- Ministry of Health Brazil. Dietary Guidelines for the Brazilian Population, 2nd ed.; Ministry of Health Brazil: Brasilia, Brazil, 2014; Available online: https://www.paho.org/hq/dmdocuments/2015/dietary-guides-brazil-eng.pdf (accessed on 1 September 2020).
- Monteiro, C.A.; Cannon, G.; Moubarac, J.C.; Martins, A.P.B.; Martins, C.A.; Garzillo, J.; Canella, D.S.; Baraldi, L.G.; Barciotte, M.; da Costa Louzada, M.L.; et al. Dietary guidelines to nourish humanity and the planet in the twenty-first century. A blueprint from Brazil. Public Health Nutr. 2015, 18, 2311–2322. [Google Scholar]
- Ministerio de Salud, M.; Guia Alimentaria Para la Poblacion Uruguaya. Para una Alimentacion Saludable, Compartida y Placentera. 2016. Available online: http://msp.gub.uy/sites/default/files/archivos_adjuntos/MS_guia_web.pdf (accessed on 10 October 2018).
- Biblioteco del Congreso, de Chile, N. Ley 20606 Sobre Composicion Nutritcional de los Alimentos y su Publicidad. 2012. Available online: https://extranet.who.int/nutrition/gina/sites/default/files/CHL%202012%20Sobre%20composicion%20nutricional%20de%20los%20alimentos%20y%20su%20publicidad.pdf (accessed on 1 September 2020).
- Batis, C.; Rivera, J.A.; Popkin, B.M.; Taillie, L.S. First-Year Evaluation of Mexico’s Tax on Nonessential Energy-Dense Foods: An Observational Study. PLoS Med. 2016, 13, e1002057. [Google Scholar]
- Hernandez, F.; Batis, C.; Rivera, J.A.; Colchero, M.A. Reduction in purchases of energy-dense nutrient-poor foods in Mexico associated with the introduction of a tax in 2014. Prev. Med. 2018, 118, 16–22. [Google Scholar]
- Biro, A. Did the junk food tax make the Hungarians eat healthier? Food Policy 2015, 54, 107–115. [Google Scholar]
- Adams, J.; Hofman, K.; Moubarac, J.-C.; Thow, A.M. Public health response to ultra-processed food and drinks. BMJ 2020, 369, m2391. [Google Scholar]
- Dekkers, A.L.; Verkaik-Kloosterman, J.; van Rossum, C.T.; Ocke, M.C. SPADE, a new statistical program to estimate habitual dietary intake from multiple food sources and dietary supplements. J. Nutr. 2014, 144, 2083–2091. [Google Scholar]


| Age Group | Sex | Average Cost | 95% CI | |
|---|---|---|---|---|
| Children (3–9 years, n = 992) | Males | EUR/day | 4.24 * | 4.08–4.41 |
| EUR/2000 kcal | 5.41 | 5.27–5.54 | ||
| Females | EUR/day | 3.90 | 3.77–4.04 | |
| EUR/2000 kcal | 5.51 | 5.35–5.66 | ||
| Adolescents (10–17 years, n = 928) | Males | EUR/day | 5.43 * | 5.23–5.64 |
| EUR/2000 kcal | 5.35 | 5.24–5.45 | ||
| Females | EUR/day | 4.57 | 4.42–4.72 | |
| EUR/2000 kcal | 5.53 | 5.40–5.66 | ||
| Adults (18–64 years, n = 1226) | Males | EUR/day | 7.40 * | 7.13–7.67 |
| EUR/2000 kcal | 6.58 * | 6.42–6.74 | ||
| Females | EUR/day | 5.67 | 5.50–5.84 | |
| EUR/2000 kcal | 7.15 | 6.97–7.33 |
| Ultraprocessed Food Products | Unprocessed/Minimally Processed Foods | ||||||
|---|---|---|---|---|---|---|---|
| Parameter | Estimate | SE | p | Parameter | Estimate | SE | p |
| UPF 2 medium %E | 0.12 | 0.13 | 0.33 | MPF 2 medium %E | 0.61 | 0.11 | <0.0001 |
| UPF 3 highest %E | −0.37 | 0.13 | 0.006 | MPF 3 highest %E | 1.18 | 0.12 | <0.0001 |
| UPF 1 lowest %E | (ref) | MPF 1 lowest %E | (ref) | ||||
| Sex: female | 0.43 | 0.09 | <0.0001 | Sex: female | 0.46 | 0.09 | <0.0001 |
| Sex: male | (ref) | Sex: male | (ref) | ||||
| Age group: children | −1.47 | 0.08 | <0.0001 | Age group:children | −1.43 | 0.08 | <0.0001 |
| Age group: adolescents | −1.46 | 0.08 | <0.0001 | Age group:adolescents | −1.44 | 0.08 | <0.0001 |
| Age group: adults | (ref) | Age group:adults | (ref) | ||||
| Household EL: medium | 0.30 | 0.11 | 0.005 | Household EL: medium | 0.27 | 0.10 | 0.009 |
| Household EL: high | 0.34 | 0.12 | 0.0006 | Household EL: high | 0.26 | 0.12 | 0.030 |
| Household EL: low | (ref) | Household EL: low | (ref) | ||||
| region 2: Brussels | 0.18 | 0.16 | 0.27 | region 2: Brussels | 0.09 | 0.1 | 0.55 |
| region 3: Wallonia | −0.06 | 0.09 | 0.53 | region 3: Wallonia | −0.08 | 0.09 | 0.39 |
| region 1: Flanders | (ref) | region 1: Flanders | (ref) | ||||
© 2020 by the authors. Licensee MDPI, Basel, Switzerland. This article is an open access article distributed under the terms and conditions of the Creative Commons Attribution (CC BY) license (http://creativecommons.org/licenses/by/4.0/).
Share and Cite
Vandevijvere, S.; Pedroni, C.; De Ridder, K.; Castetbon, K. The Cost of Diets According to Their Caloric Share of Ultraprocessed and Minimally Processed Foods in Belgium. Nutrients 2020, 12, 2787. https://doi.org/10.3390/nu12092787
Vandevijvere S, Pedroni C, De Ridder K, Castetbon K. The Cost of Diets According to Their Caloric Share of Ultraprocessed and Minimally Processed Foods in Belgium. Nutrients. 2020; 12(9):2787. https://doi.org/10.3390/nu12092787
Chicago/Turabian StyleVandevijvere, Stefanie, Camille Pedroni, Karin De Ridder, and Katia Castetbon. 2020. "The Cost of Diets According to Their Caloric Share of Ultraprocessed and Minimally Processed Foods in Belgium" Nutrients 12, no. 9: 2787. https://doi.org/10.3390/nu12092787
APA StyleVandevijvere, S., Pedroni, C., De Ridder, K., & Castetbon, K. (2020). The Cost of Diets According to Their Caloric Share of Ultraprocessed and Minimally Processed Foods in Belgium. Nutrients, 12(9), 2787. https://doi.org/10.3390/nu12092787