Effects of Nutrition/Diet on Brown Adipose Tissue in Humans: A Systematic Review and Meta-Analysis


Abstract
1. Introduction
2. Materials and Methods
2.1. Search Strategy and Selection Criteria
2.2. Data Extraction and Quality Assessment
2.3. Data Synthesis and Meta-Analysis Methods
3. Results
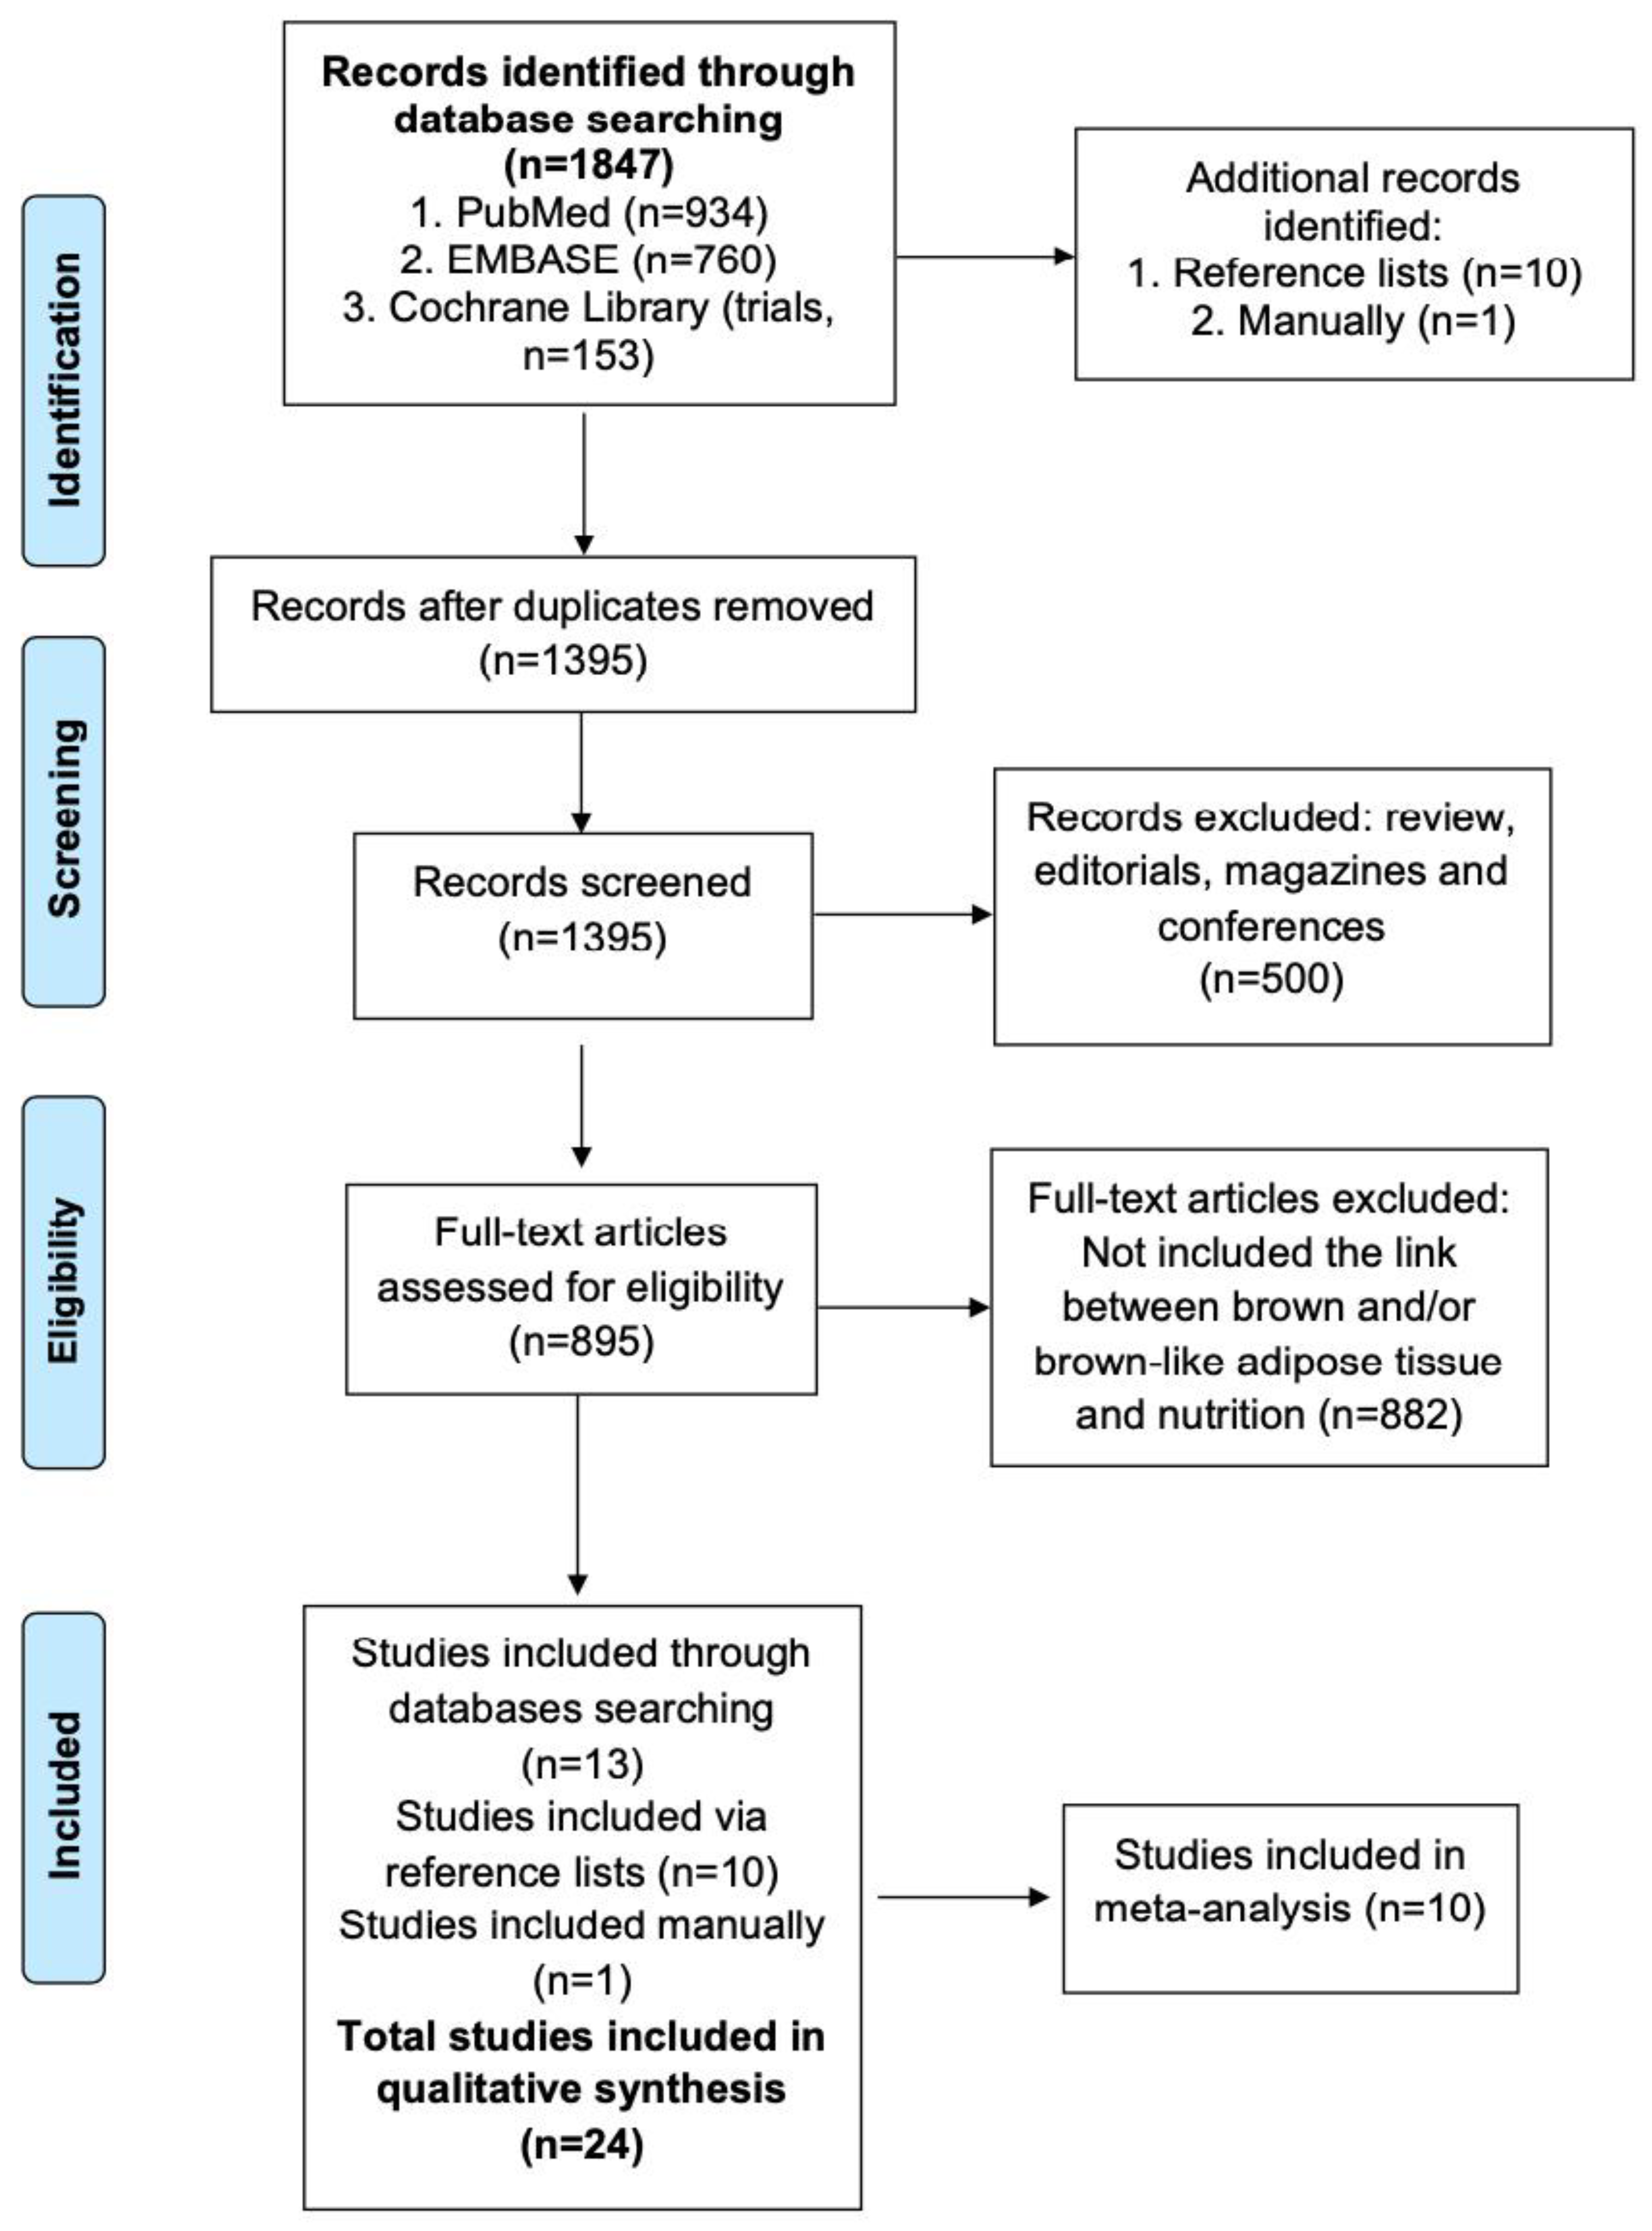
3.1. Searching and Selection Procedure Results
3.2. Characteristics of the Included Studies
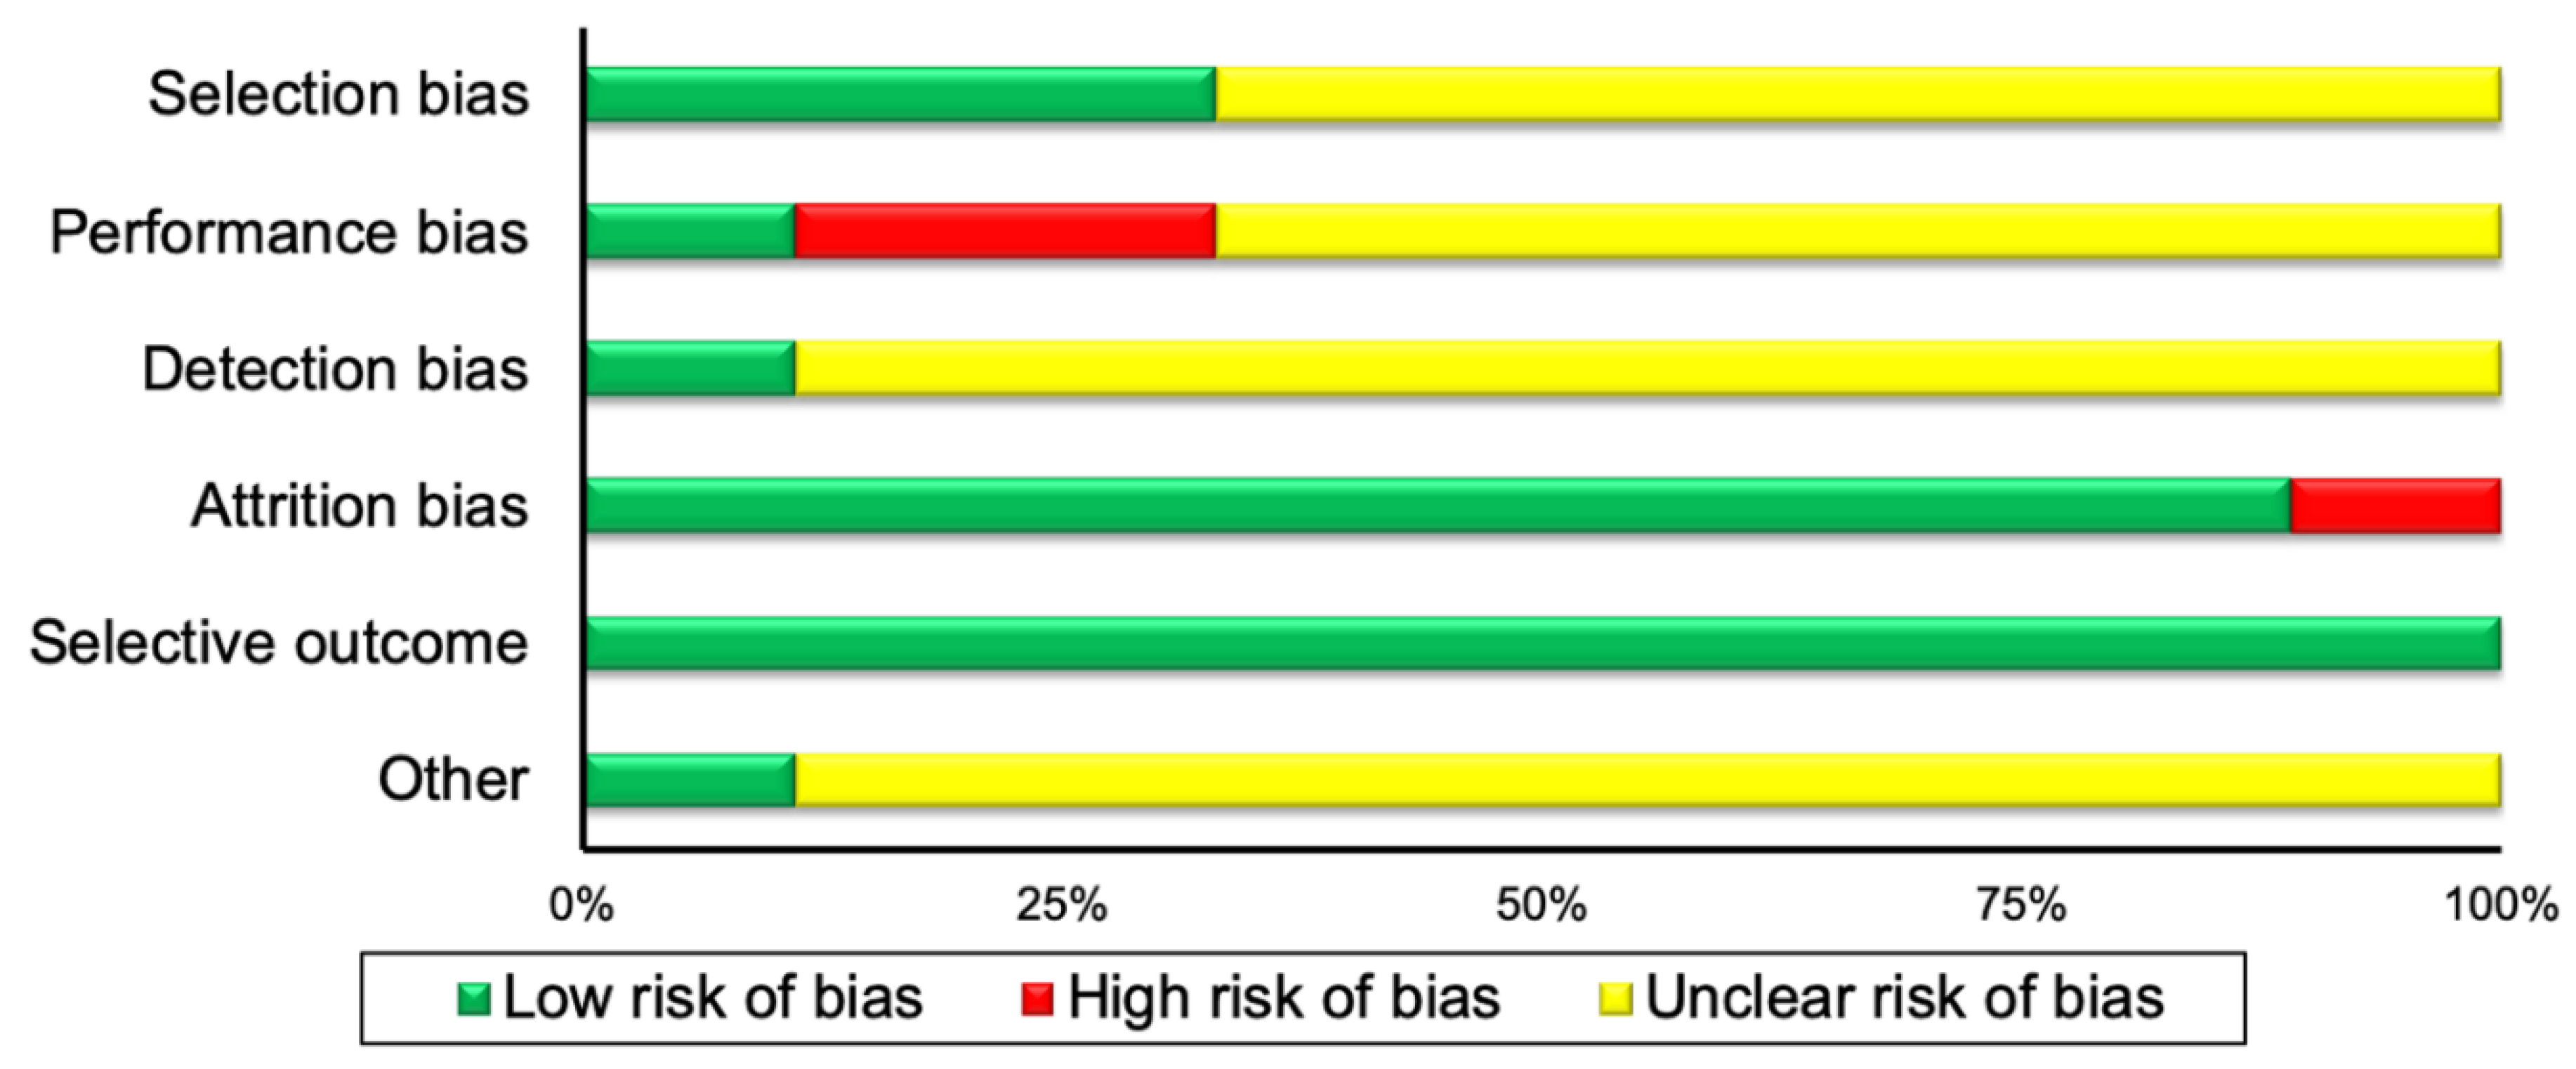
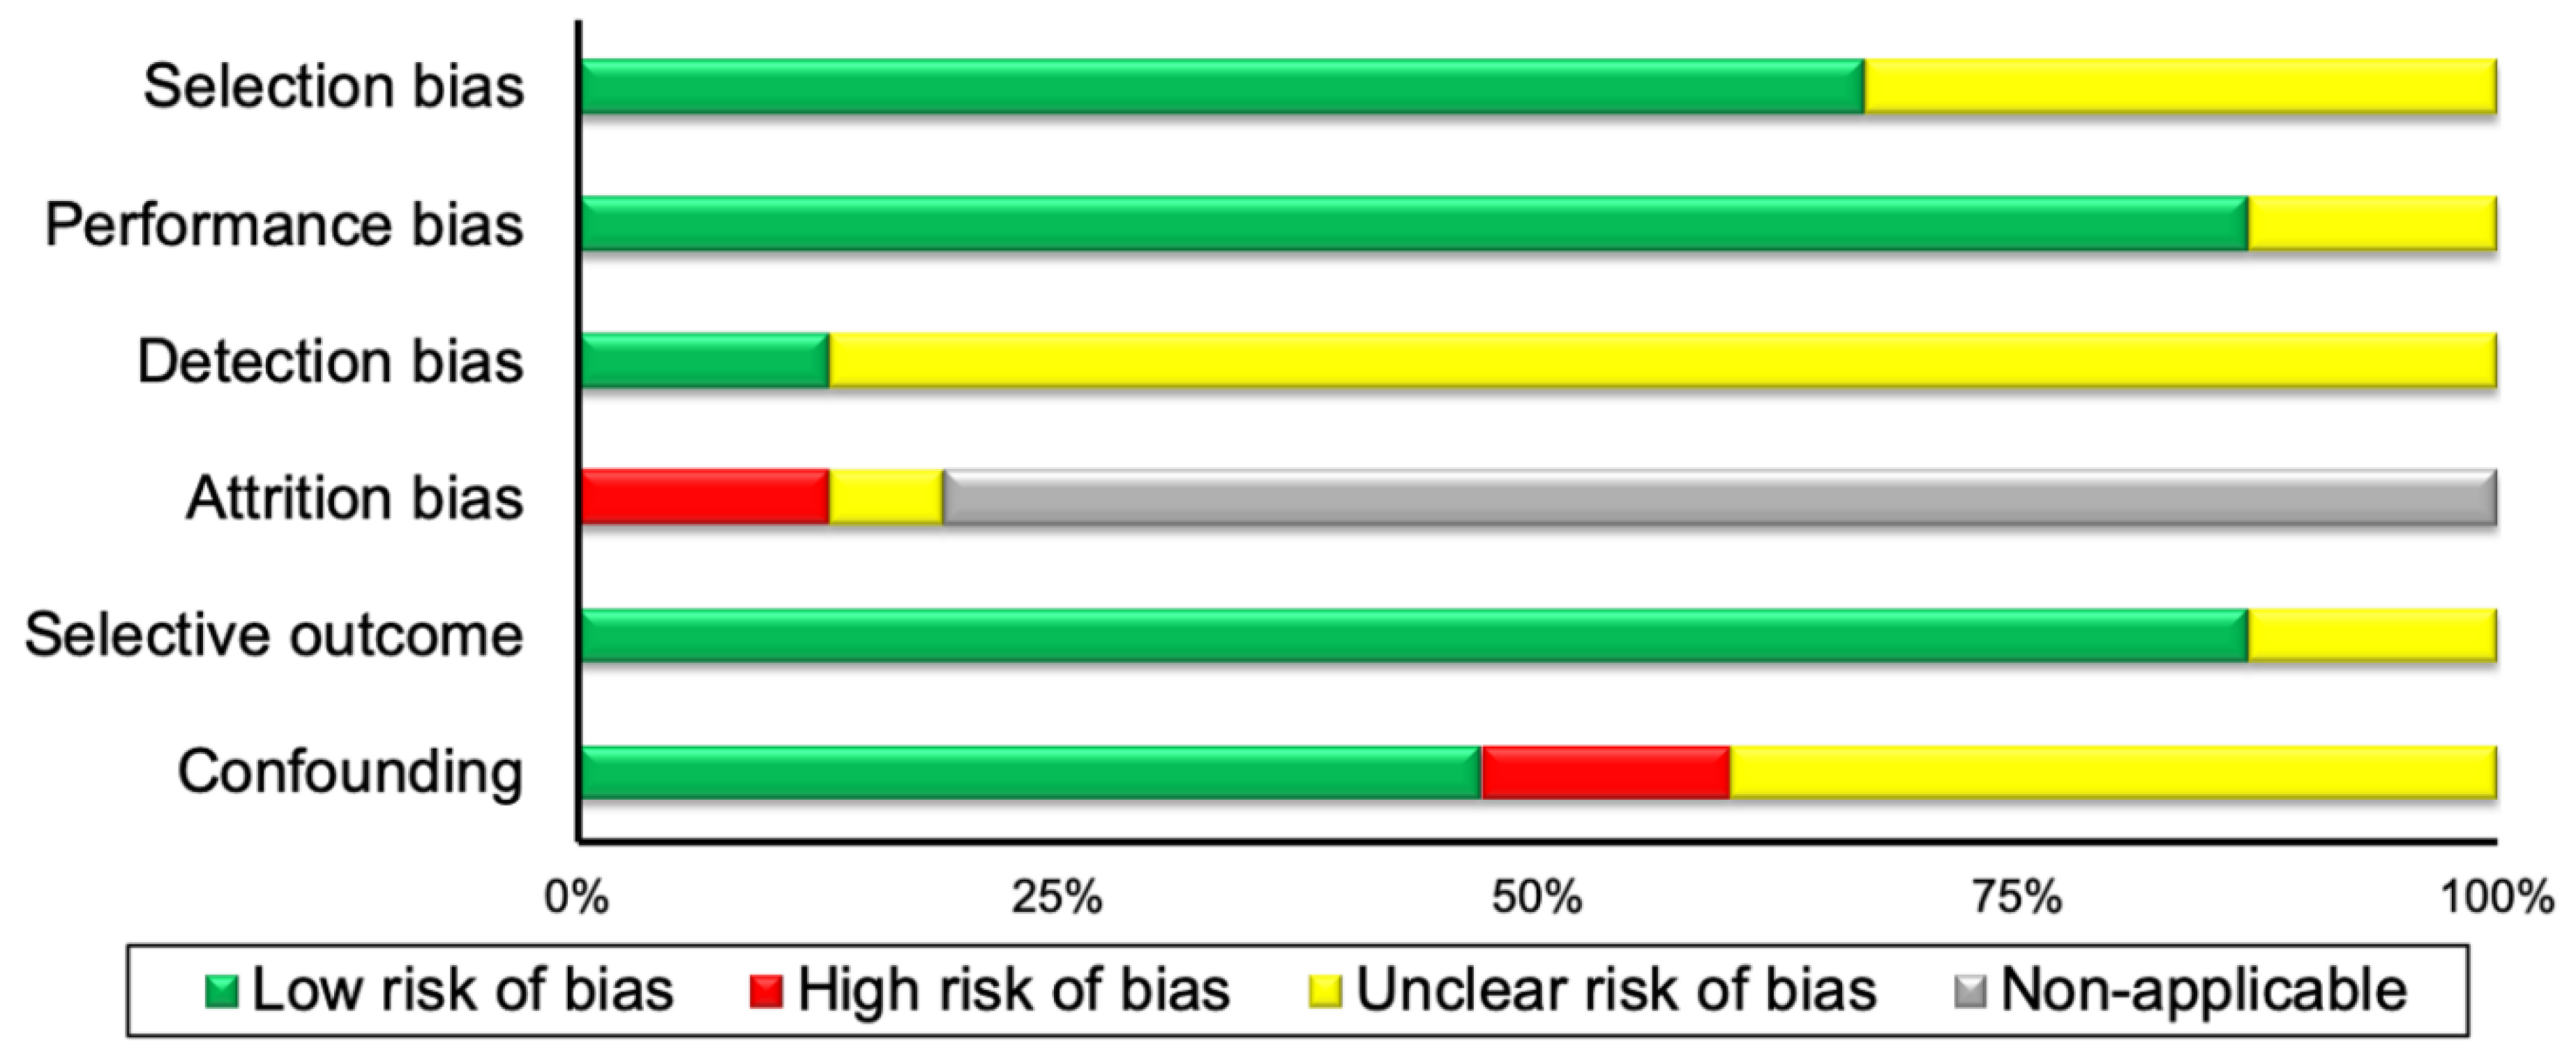
3.3. Risk of Bias Assessment Results
3.4. Qualitative Data Synthesis
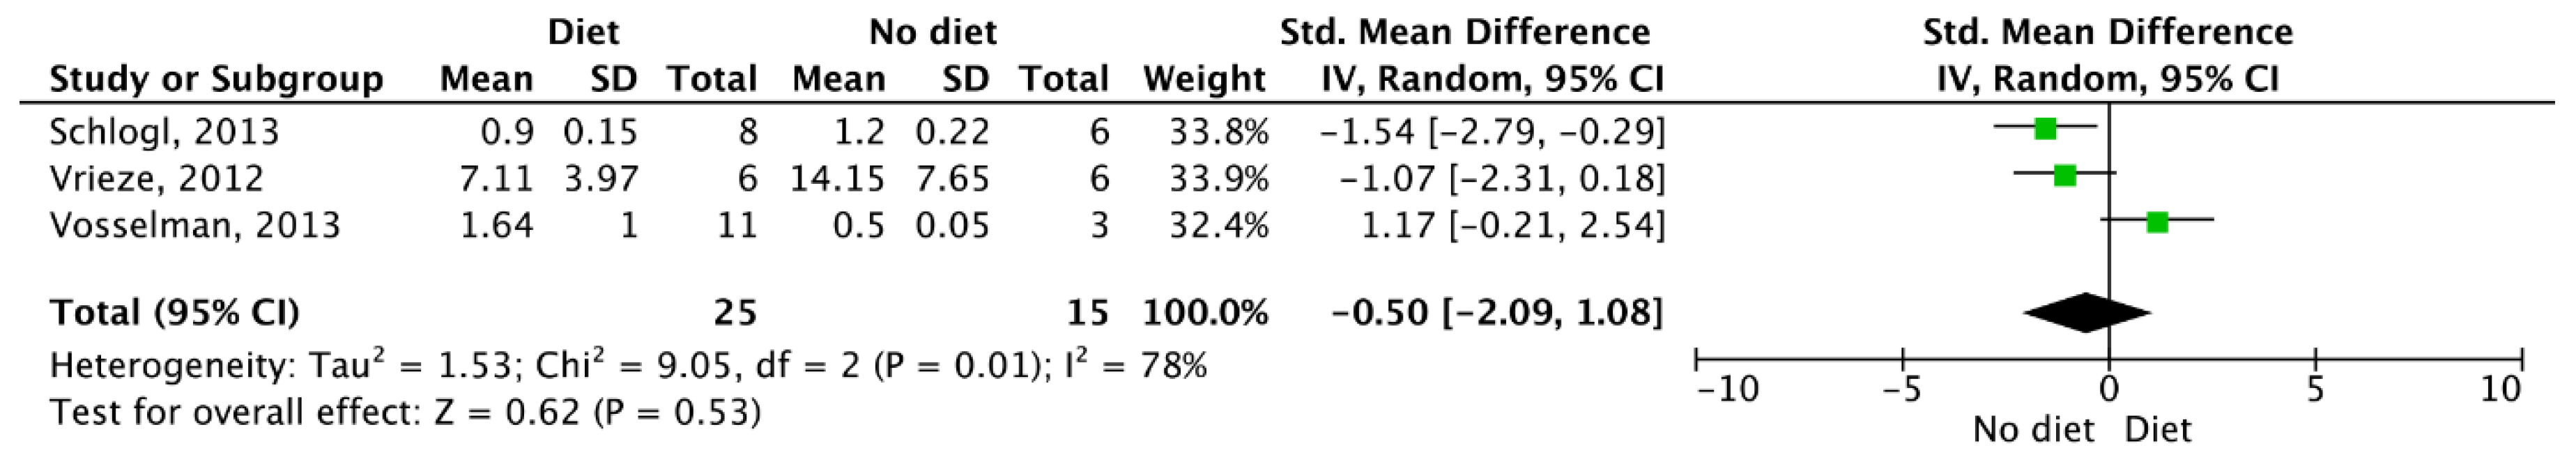
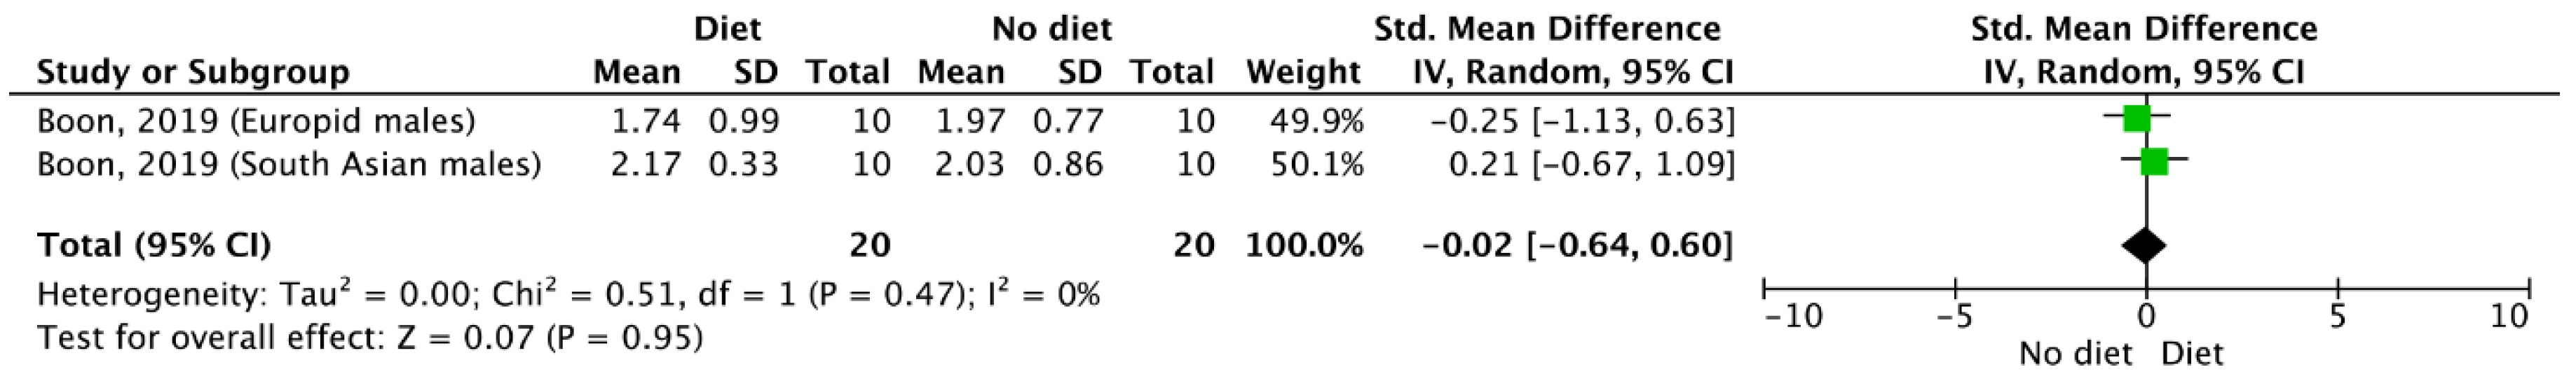
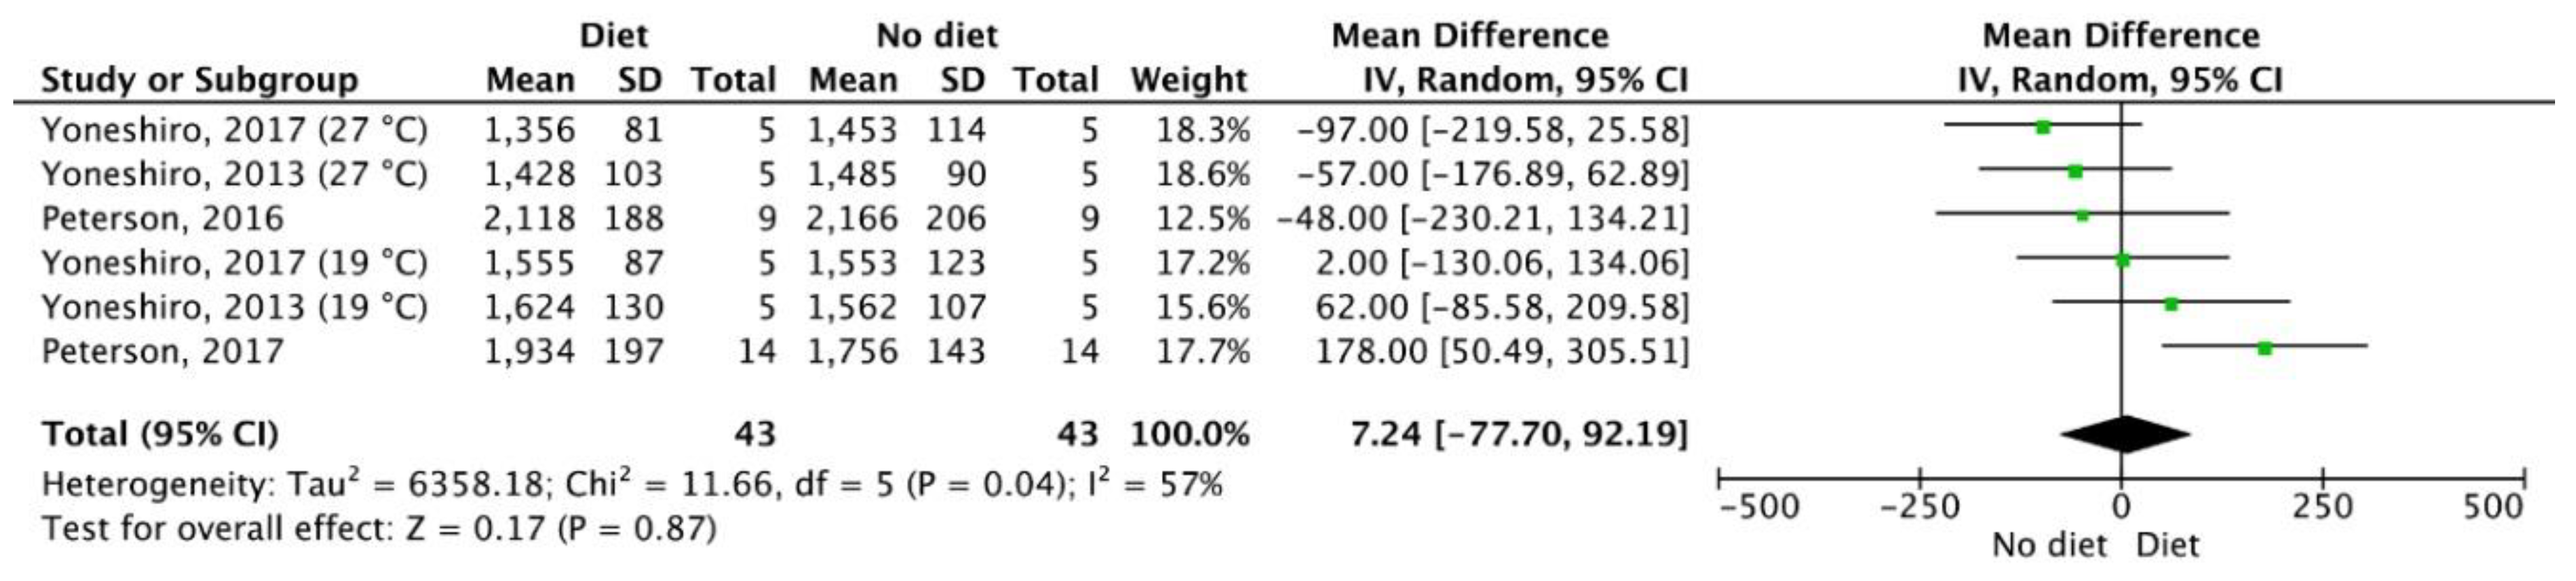
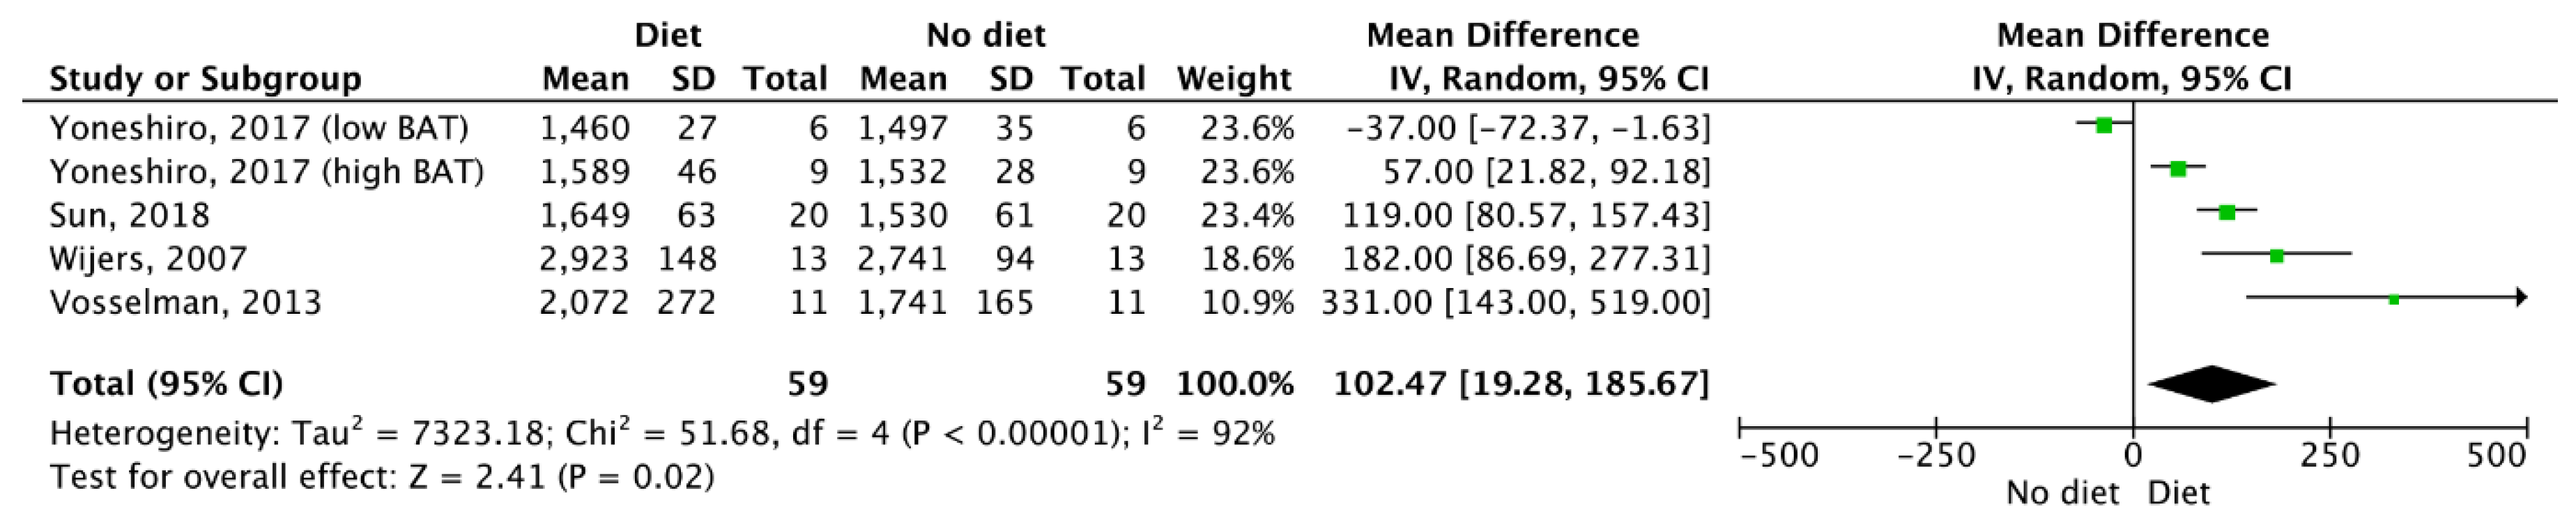
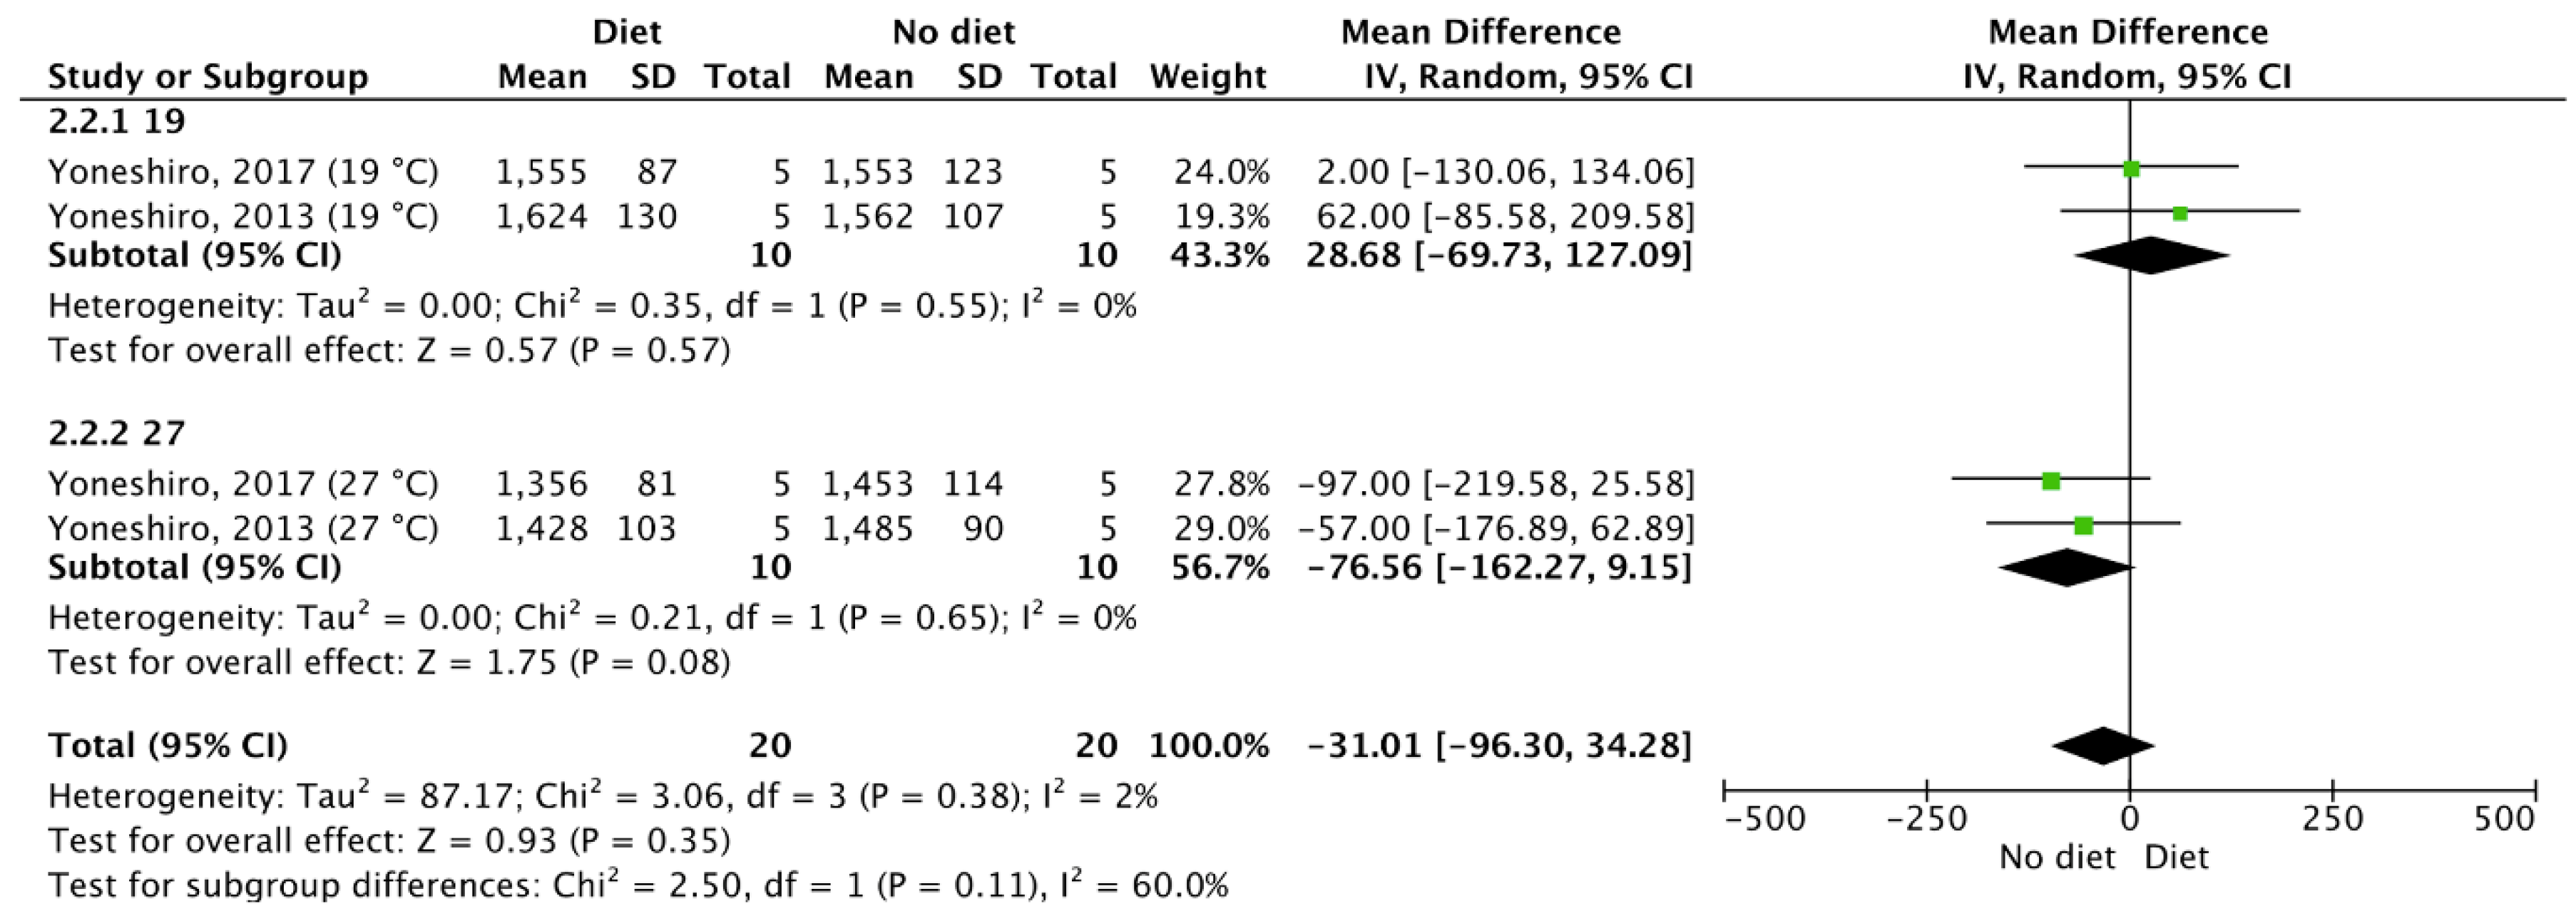
3.5. Meta-Analysis Outcomes
4. Discussion
4.1. Overall Completeness and Applicability of Evidence
4.2. Strengths and Limitations
5. Conclusions
Author Contributions
Funding
Conflicts of Interest
Appendix A


| First Author | Random Sequence Generation | Allocation Concealment | Blinding of Participants and Researchers | Blinding of Outcome Assessment | Incomplete Outcome Data | Selective Reporting | Other Bias |
|---|---|---|---|---|---|---|---|
| Selection | Performance | Detection | Attrition | Reporting | Other | ||
| Ahmadi, 2013 | ? | ? | ? | ? | - | + | + |
| Boon, 2019 | ? | + | + | + | + | + | + |
| Nagai, 2005 | + | ? | ? | ? | + | + | + |
| Schlogl, 2013 | ? | ? | ? | ? | + | + | + |
| Vrieze, 2012 | ? | ? | ? | ? | + | + | + |
| Wijers, 2007 | ? | ? | ? | ? | + | + | + |
| Yoshioka, 1998 | ? | ? | ? | ? | + | + | - |
| Yoneshiro, 2013 | ? | ? | - | ? | + | + | + |
| Yoneshiro, 2017 | + | ? | - | ? | + | + | + |
| First Author | Selection | Performance | Detection | Attrition | Reporting | Confounding |
|---|---|---|---|---|---|---|
| Barquissau, 2018 | ? | + | ? | N | + | ? |
| Dinas, 2017 | + | + | + | N | + | + |
| Hibi, 2016 | + | + | ? | N | + | + |
| Matsumoto, 2001 | + | + | ? | - | + | + |
| Matsumoto, 2000 | + | + | ? | - | + | - |
| Nagai, 2011 | ? | ? | ? | N | + | + |
| Peterson, 2017 | ? | + | ? | N | + | ? |
| Peterson, 2016 | + | + | ? | N | + | ? |
| Robinson, 2019 | + | + | ? | N | + | - |
| Schutz, 1984 | ? | + | ? | N | + | + |
| Sun, 2018 | + | + | ? | ? | ? | + |
| Vosselman, 2013 | + | + | ? | N | + | ? |
| Weststrate, 1993 | ? | + | ? | N | ? | + |
| Williams, 2008 | + | ? | ? | N | + | ? |
| Yoneshiro, 2012 | + | + | + | N | + | ? |
| Study | Design | Participants Characteristics | Intervention | Main Outcome |
|---|---|---|---|---|
| Ahmadi, 2013 | RCT | 65 (n = 33 AGE-S (aged garlic extract plus supplement); n = 32 placebo) participants 40–79 yr. and free from clinical coronary artery disease; 51 M and 14 F. | Daily capsule of placebo or AGE-S (aged garlic-extract (250 mg), vitamin-B12 (100 µg), folic-acid (300 µg), vitamin-B6 (12.5 mg) and L-arginine (100 mg)) for 12-months. | AGE-S participants showed higher brown epicardial adipose tissue (bEAT) (AGE-S: 43.4 ± 15.9; placebo: 33.7 ± 13.89) and temperature-rebound when compared to placebo (p < 0.05) after 12-months. |
| Barquissau, 2018 | SGDS | 289 obese males (n = 101, BMI: 33.7 ± 4.6 kg/m2, age: 43.4 ± 5.9 yr.) and females (n = 188, BMI: 34.5 ± 4.6 kg/m2, age: 41.7 ± 6.4 yr.). | Dietary intervention performed in two phases. Phase one: 8-week very low-calorie diet. Phase two: 6-month weight maintenance period. | Decreased browning of subcutaneous abdominal white adipose tissue was reported after the very low-calorie diet. Changes observed in body fat and insulin resistance were not dependent on changes in brown and beige fat markers. |
| Boon, 2019 | RCT | 10 prediabetic overweight Dutch South Asian males, (age: 46.5 ± 2.8 yr., BMI: 30.1 ± 1.1 kg/m2) and 10 prediabetic Dutch males of European decent (age 47.5 ± 2.0 yr., BMI: 30.7 ± 1.2 kg/m2). | Participants ingested either L-arginine (9 g/day) or placebo tablets for 6 weeks followed by a 4-week washout period. | Six weeks of L-arginine supplementation did not influence body weight, BMI, fat mass or lean mass in either the Dutch South Asian group or the Dutch males of European decent. The mean and maximum BAT activity values (expressed as SUV) did not differ between groups and were not influenced by L-arginine treatment. |
| Dinas, 2017 | CSS | 32 healthy, non-smoking males (age: 36.1 ± 7.4 yr., BMI: 27.1 ± 4.6 kg/m2) free from chronic disease. | Diet recalls were retrieved from two weekdays and one weekend day (randomly selected) to assess energy/nutrient intake during the week prior to measurements. Measurements included body composition, REE and a subcutaneous fat biopsy following a 12-h fast and after refraining from exercise, alcohol and passive smoking for 72 h. Fat biopsy samples were used to assess UCP1, PGC-1α, PPARα and PPARγ mRNA expression. | Diet was not associated with browning formation markers of subcutaneous adipose tissue in healthy men. UCP1 mRNA in white adipose tissue was not linked to body weight or body composition. Activation of the PGC-1α, PPARα and PPARγ genes could collectively indicate browning formation of white adipose tissue through increased UCP1 expression. |
| Hibi, 2016 | CSS | 21 healthy males between 20–50 yr. with a BMI of 18.0–24.9 kg/m2. Subjects were divided into BAT-positive (n = 13) and BAT-negative (n = 8) groups according to F-FDG-PET/CT findings. | A prescribed meal was given at 18:00 h before energy metabolism was measured. Subjects ate the same meal/quantity at 09:00 h (breakfast), 14:00 h (lunch) and 19:00 (dinner) and were instructed to drink water ad libitum. The three meals were comprised. BAT activity was measured using PET/CT. | Diet induced thermogenesis and fat utilization were higher in BAT-positive subjects than in the BAT-negative subjects. These findings suggest that brown adipose tissue may have a physiologic role in energy metabolism. Mean SUV max was 8.5 ± 4.8 in the BAT-positive group and 1.1 ± 0.4 in the BAT-negative group (p < 0.001). |
| Matsumoto, 2000 | CT | 8 lean (age: 19.6 ± 0.3 yr., BMI: 21.0 ± 0.6 kg/m2) and 8 obese (age: 20.1 ± 0.4 yr., BMI: 28.8 ± 1.0 kg/m2) females. | Participants were served rice with spicy yellow curry sauce containing 3 mg of capsaicin over a ten-minute period. The experimental meal was composed of 60% carbohydrate, 30% fat and 10% protein. The energy content of the meal was 2016 kJ. DIT was assessed via energy expenditure measurements. | The lean females experienced an increase in energy expenditure after the meal (5574.7 ± 221.2 to 6114.7 ± 239 kj*day-1; p < 0.01). No postprandial changes were observed in the obese group (6191.8 ± 274.3 to 6531.8 ± 337.3 kj*day-1). |
| Matsumoto, 2001 | CT | 8 obese (age: 20.0 ± 0.3 yr., BMI: 29.0 ± 1.0 kg/m2) and 8 non-obese (age: 19.8 ± 0.9 yr., BMI: 18.6 ± 0.4 kg/m2) females. | Participants consumed a mixed food meal (480 kcal; 55% carbohydrate, 15% protein and 30% fat) over a 5-min period. DIT was assessed via energy expenditure measurements. | Energy expenditure was increased in the non-obese group (0.79 ± 0.02 to 0.90 ± 0.02 kcal/min, p < 0.01) and the obese group (1.00 ± 0.02 to 1.06 ± 0.03 kcal/min, p < 0.05) after the mixed-food meal. Magnitude of the increase above the pre-meal condition was greater in the non-obese compared to the obese participants (11.2 ± 2.3 vs. 6.7 ± 0.8%, p < 0.05). |
| Nagai, 2005 | RCT | 13 healthy, lean (age: 8.8 ± 0.4 yr., BMI: 16.5 ± 0.4 kg/m2) and 10 obese (age: 9.2 ± 0.4 yr., BMI: 23.3 ± 0.8 kg/m2) boys. | Different menus served on two different days were provided to the two groups. One menu consisted of a high carbohydrate meal (70% carbohydrate, 20% fat and 10% protein) and the other consisted of a high fat meal (20% carbohydrate, 70% fat and 10% protein). Each meal was standardized, 80 kJ per kg of actual body mass (30.9 ± 1.0 kg) in lean boys and 80 kJ per kg of ideal body mass (33.2 ± 1.6 kg) in obese boys. Thermic effect of food (TEF) was assessed via energy expenditure measurements. | The obese group experienced a smaller increase in VO2 (lean, 1.25 ± 0.02 L; obese, 1.15 ± 0.20 L; p < 0.01) and in VCO2 (lean, 1.26 ± 0.03 L; obese, 1.16 ± 0.03 L; p <0.05) after the high carbohydrate meal. Following the high fat meal, the net increase in VO2 was not different between groups (lean, 1.24 ± 0.03 L; obese, 1.19 ± 0.02 L), but the net increase in VCO2 was lower in the obese group compared to the lean group (lean, 1.15 ± 0.03 L; obese, 1.08 ± 0.02 L; p < 0.05). Obese boys appeared to experience a diminished TEF response to the high carbohydrate meal. |
| Nagai, 2011 | SGDS | 17 female volunteers (age: 20–22 yr.) with normal weight and BMI, percent body fat between 25.1–38.5%, free from disease and were not using any treatment known to affect weight loss. | Participants were fed a hypoenergetic diet consisting of a 30% reduction in energy intake during a 2-week energy-restriction period. During the energy-restriction period, participants were restricted to 5.0 MJ (1200 kcal)/d (62% carbohydrate, 19% protein and 19% fat), consisting of 3 isoenergetic, nutritionally balanced meals. During the experimental period, participants were not permitted to consume soft drinks, alcoholic beverages or any food not included in the test meals. | Following the intervention, the G allele participants experienced significantly smaller changes in body weight, BMI and waist circumference compared to the A/A genotype participants. These data suggest that the UCP1 gene −3826 G allele could contribute to smaller weight loss after a short-term, controlled-energy diet in young, lean women. |
| Peterson, 2016 | SGDS | 9 healthy, non-smoking males (age: 23 ± 3 yr., 23.0 ± 1.8 kg/m2). Volunteers consumed less than 3 alcoholic drinks/day, were not currently on medication, had no recent change in body weight (>2 kg in the prior 6 months), had no impaired fasting glucose (>100 mg/dL), did not exercise intensely (>3 times/week) and had no chronic disease. | Participants were exposed to cold for 20 min per day, for five days per week for four weeks. DIT was determined during a 24-h thermic response to one day of 50% overfeeding. | Participants were overfed by 50.2 ± 4.6% at baseline versus 53.1 ± 3.4% post-cold acclimation. 24-h thermic response following overfeeding was similar at baseline (2166 ± 206 kcal/day) and following the four-week cold intervention (2118 ± 188 kcal/day; p = 0.15). Cold acclimation did not change the thermic response following overfeeding. |
| Peterson, 2017 | SGDS | 14 males (age: 24 ± 3 yr., BMI: 24.5 ± 1.6 kg/m2). | Participants were overfed by 40% for 8 weeks. The diet composed of 41% carbohydrate, 44% fat and 15% protein. The PBRC Metabolic Kitchen prepared all 21 meals during the 8-week intervention. BAT activity was measured using infrared imaging of the supraclavicular BAT depot. | Metabolic adaptation increased from -0.9 ± 3.9% to 4.7 ± 5.6% (p = 0.001). BAT thermal activity remained similar (p = 0.81). BAT thermal activity was not associated with the degree of metabolic adaptation (p = 0.32) or with the change in body weight (p = 0.51). |
| Robinson, 2019 | CSS | 36 children (16 boys and 20 girls; age: 8.5–11.8 yr.). | A survey on the child’s diet was completed by the parents. Based on the answers, foods were sorted into categories of carbohydrate, dairy, fruit, protein, savory, sweet and vegetable. Infrared thermography of the neck and upper thorax was utilized to examine BAT activity. | BAT thermogenesis may be altered by dietary intake in a sex-specific manner. A correlation between the supraclavicular region temperature and report of vegetable and protein consumption was observed in young girls. After adjustment for multiple testing in the study sample, the relationships were no longer statistically significant. There were no associations between supraclavicular region temperature and food consumption in any category for the young boys. There was no difference in vegetable and protein consumption scores between girls and boys. |
| Schlogl, 2013 | RCT | 16 healthy women (n = 7, age: 30.7 ± 8.6 yr., BMI 28.0 ± 6.5 kg/m2) and men (n = 9, age: 31.1 ± 11.3 yr., BMI: 25.1 ± 4.6 kg/m2). | Volunteers followed a weight-maintenance diet composed of 50% carbohydrate, 30% fat and 20% protein. Each participant completed 24-h EE measures, during energy balance, fasting and during 200% over feeding (60% fat, 20% protein, 20% carbohydrate). The first six participants had a second PET/CT after 36 h of fasting to further examine BAT activation at 22 °C. Other participants had a second PET/CT after 24 h of overfeeding at 22 °C but only if they showed cold-induced BAT activity. | Cold-induced BAT activity was seen in 8 of 10 participants after overfeeding. DIT was 280 ± 164 kcal during overfeeding vs 140 ± 116 kcal during energy balance (p = 0.009). The mean SUV of BAT (n = 8) after overfeeding (0.9 ± 0.2) compared to cold-induced BAT activity (3.5 ± 0.7) was lower (p = 0.001). |
| Schutz, 1984 | SGDS | 28 females (age: 19–44 yr.) 20 were obese (percent body fat: 38.6 ± 0.7%), and 8 were non-obese (percent body fat: 24.7 ± 0.9%). | For the weight maintenance period, 1–2 weeks before the study, subjects consumed their normal diet. Each subject ate three meals prepared by a dietician including normal “natural” foods (breakfast: bread, butter, marmalade, milk; lunch and dinner: bread, meat or fish, vegetables, dessert). Decaffeinated coffee was served at each meal, and no alcohol was consumed during the experiment. Energy expenditure was measured for 24 h in a respiration chamber. | The thermogenic response to the three meals was found to be low in the obese participants (8.7 ± 0.8%) when compared to the controls’ (14.8 ± 1.1%). The thermogenic response induced by the three meals was negatively correlated with body weight (r = −0.552, p < 0.01) and percent body fat (r = −0.613, p < 0.001). |
| Sun, 2018 | CT | 20 healthy males and females (age: 21–35 yr., BMI: 18.5–26.0 kg/m2). All participants were healthy, no history of diabetes or cardiovascular disease, smoke or use tobacco. They did not adhere to special diets or take medication known to alter brown adipose tissue metabolism. | PET/CT measurement and whole-body calorimetry were assessed after capsinoid ingestion (12 mg) or cold exposure (~14 °C) in a crossover design. | Capsinoid ingestion did not result in detectable BAT activation, as all participants in each trial stayed at or below the level of baseline-detectable activity assessed during the PET/CT scan. The results showed that ingestion of capsinoids led to a bigger increase in energy expenditure (10%) in BAT-positive participants than in BAT-negative participants (5%). |
| Vosselman, 2013 | SGDS | 11 lean males (age: 23.6 ± 2.1 yr., BMI: 22.4 ± 2.1 kg/m2). | Participants consumed a high calorie and carbohydrate rich meal (1622 ± 222 kcal; 78% carbohydrate, 12% protein, 10% fat). BAT activity was assessed by (18F) FDG-PET/CT following consumption of the meal. BAT assessed during 2 h of cold exposure served as a positive control. Energy expenditure was assessed via indirect calorimetry. | BAT activity following the meal was lower compared to cold-induced BAT activity. There was no direct relationship between BAT activity and DIT. |
| Vrieze, 2012 | RCT | 10 healthy, lean males (age: 18–32 yr., BMI 20–24 kg/m2). | Each volunteer underwent two PET/CT scans two weeks apart. The first scan was completed after an overnight fast and the second scan was completed after an overnight fast with a standardized meal consumed 90 min beforehand. The meal was a chicken-bacon sandwich and 200 mL of whole milk (545 kcal), containing 34g of fat, 37g or carbohydrates and 23g of protein. | BAT activity was observed in 6 of 10 volunteers. All subjects with BAT activity had higher SUVmax in the fasted state (median, 13.1 g/mL; range, 6.1–27.6 g/mL) than in the post-meal state (median, 6.8 g/mL; range 2.1–13.4 g/mL) (p = 0.03). Cold activated BAT in humans is more distinct during fasting. Meal-induced insulin secretion could explain the postprandial decrease in BAT. |
| Weststrate, 1993 | SGDS | 49 non-obese males and 54 women (22 non-obese and 32 obese). | DIT was assessed using a ventilated-hood system. In males: Study 1 tested the thermic effect of alcohol. Study 2 examined the impact of palatability on DIT. Study 3 examined a 2-week dietary intervention on individual energy metabolism. In females: Studies 1 and 2, were similar to the studies conducted in males. Studies 3 and 4 examined the effect of the ovular phase of the menstrual cycle on RMR and DIT. Study 5 looked at the effect of body-fat distribution in obesity on energy metabolism. Study 6 studied the effect of body-fat distribution on weight loss and energy metabolism in obese women. DIET: nine subjects, four males and five females, followed a 2-week diet. Food was provided in a 4-day rotating menu with minor differences in energy content (CV<5%) and nutrient composition (CV protein, fat < 10%, CV carbohydrates < 15%) between the four menus. Mean energy intake was 9.3 ± 0.5 MJ/d. | Variation in DIT was not changed when the diet was controlled. Total DIT values were significantly higher (p < 0.05) in women with higher energy intakes. No significant differences were found between both groups in DIT, when expressed as a percentage of the energy content of the test meal, 6.62 ± 0.29% in the group with high energy intake and 6.24 ± 0.50% in the group with low energy intake. |
| Wijers, 2007 | RCT | 13 lean males (age 22.8 ± 1.7 yr., BMI: 22.96 ± 0.90 kg/m2). | Participants underwent three different experimental conditions in a respiration chamber once for 36 h (control meal) and twice for 84 h (overfeeding at 16 °C and at 22 °C). | Overfeeding showed significant increases in EE (0.77 MJ/d, p < 0.001). The increase in EE during overfeeding was significantly related to the increase in EE during mild cold exposure (r = 0.63; p < 0.05). This suggests that both overfeeding-induced and mild cold-induced adaptive thermogenesis share similar mechanisms. |
| Williams, 2008 | CSS | Fasting protocol (n = 1229; age: 58 ± 16 yr., male 58%, female 48%). High fat, low carbohydrate, protein permitted diet (n = 741; age: 58 ± 16 yr., male 53%, female 47%). | Consumption of a high fat, very low carbohydrate, protein permitted diet. Brown adipose tissue activity was assessed via PET/CT measurements. | The results showed a difference between the fasting and high fat, low carbohydrate group in blood glucose and frequency of FDG uptake by hypermetabolic brown adipose tissue. Participants who consumed the high-fat diet experienced a significant reduction in the frequency of hypermetabolic BAT uptake (p < 0.0002) and had lower blood glucose levels (p < 0.001). |
| Yoneshiro, 2012 | SGDS | 18 healthy males (age: 20–32 yr.) separated into BAT-positive (n = 10) and BAT-negative (n = 8) groups after FDG uptake was assessed. | 2 h of cold exposure while wearing light clothing after oral ingestion of capsinoids (9 mg). Brown adipose tissue was assessed using PET/CT measurements. | Energy expenditure increased by 15.2 ± 2.6 kJ/h in 1 h in the BAT-positive group and by 1.7 ± 3.8 kJ/h in the BAT-negative group following the intervention (p < 0.01). Significant effects of time (p < 0.001), capsinoids x BAT (p < 0.05) and time x capsinoids x BAT (p < 0.05) were found. The BAT-positive group showed an increase in energy expenditure. This increase was significant, 0.5–2 h after capsinoids treatment (maximal increase of 502 ± 81 kJ/d at 1 h). Energy expenditure slightly changed after placebo ingestion. |
| Yoneshiro, 2013 | RCT | 51 healthy males (age: 22.4 ± 0.5 yr., BMI: 22.0 ± 0.4 kg/m2). Only 10 males were selected to complete the capsinoid test, with low or undetectable BAT activity. | The 10 males ingested capsules containing 9 or 0 mg (placebo) capsinoids every day for 6 weeks. BAT was assessed via PET/CT measurements. | Daily ingestion of capsinoids (9 mg) and cold exposure can brown adipose tissue even among individuals who have lost active brown adipose tissue. |
| Yoneshiro, 2017 | RCT | 15 healthy males participated in the acute catechin trial. 10 healthy males who showed low or no BAT activity participated in the chronic catechin trial. | The experiment consisted of a single ingestion of a beverage containing 615 mg catechin and 77 mg of caffeine in 350 mL. The control beverage contained 0 mg of catechin and 81 mg of caffeine. Ingestion occurred for 5 weeks, twice per day. Participants maintained their daily lifestyle, including dietary intake and physical activity during the experimental period. BAT activity was assessed via PET/CT measurements. | Ingestion of the catechin beverage increased energy expenditure in 9 participants who had active BAT (mean ± SEM: +15.24 ± 1.48 kcal, p = 0.01) but not in 6 participants who had inactive BAT (mean ± SEM: +3.42 ± 2.68 kcal). The placebo beverage containing 82 mg of caffeine produced a smaller and comparative EE response. The recruitment of BAT in humans possibly led to increased EE levels and non-shivering CIT through the tea catechin with caffeine. |
| Yoshioka, 1998 | RCT | 13 healthy females (age: 25.8 ± 2.8 yr., body weight: 54.2 ± 6.4 kg). | Women consumed a standardized meal before beginning the experiment with a standardized breakfast. The breakfast fell under one of the following four conditions: high fat meal, high fat and red-pepper (10 g) meal, high calorie meal or high calorie and red-pepper meal. The experimental meals consisted of a stir fry of rice, scallops, shrimps, bacon, green peppers, green peas, onions and tomatoes. DIT was assessed via energy expenditure measurements. | Diet induced thermogenesis was significantly higher after the high calorie meals than after the high fat meal. The addition of red pepper to the meals significantly increased diet-induced thermogenesis and lipid oxidation, especially in the high fat meal. |
| Section/Topic | Identification Number | Checklist Item | Reported on Page |
|---|---|---|---|
| TITLE | |||
| Title | 1 | Identify the report as a systematic review, meta-analysis or both. | 1 |
| ABSTRACT | |||
| Structured summary | 2 | Provide a structured summary including, as applicable, background; objectives; data sources; study eligibility criteria, participants and interventions; study appraisal and synthesis methods; results; limitations; conclusions and implications of key findings; systematic review registration number. | 1 |
| INTRODUCTION | |||
| Rationale | 3 | Describe the rationale for the review in the context of what is already known. | 1–2 |
| Objectives | 4 | Provide an explicit statement of questions being addressed with reference to participants, interventions, comparisons, outcomes and study design (PICOS). | 2 |
| METHODS | |||
| Protocol and registration | 5 | Indicate if a review protocol exists, if and where it can be accessed (e.g., Web address) and, if available, provide registration information including registration number. | 2 |
| Eligibility criteria | 6 | Specify study characteristics (e.g., PICOS, length of follow-up) and report characteristics (e.g., years considered, language, publication status) used as criteria for eligibility, giving rationale. | 2–3 |
| Information sources | 7 | Describe all information sources (e.g., databases with dates of coverage, contact with study authors to identify additional studies) in the search and date last searched. | 2 |
| Search | 8 | Present full electronic search strategy for at least one database, including any limits used, such that it could be repeated. | 2 |
| Study selection | 9 | State the process for selecting studies (i.e., screening, eligibility, included in systematic review and, if applicable, included in the meta-analysis). | 2–3 |
| Data collection process | 10 | Describe method of data extraction from reports (e.g., piloted forms, independently, in duplicate) and any processes for obtaining and confirming data from investigators. | 3 |
| Data items | 11 | List and define all variables for which data were sought (e.g., PICOS, funding sources) and any assumptions and simplifications made. | 3 |
| Risk of bias in individual studies | 12 | Describe methods used for assessing risk of bias of individual studies (including specification of whether this was done at the study or outcome level) and how this information is to be used in any data synthesis. | 3 |
| Summary measures | 13 | State the principal summary measures (e.g., risk ratio, difference in means). | 3 |
| Synthesis of results | 14 | Describe the methods of handling data and combining results of studies, if done, including measures of consistency (e.g., I2) for each meta-analysis. | 3 |
| Risk of bias across studies | 15 | Specify any assessment of risk of bias that may affect the cumulative evidence (e.g., publication bias, selective reporting within studies). | 3 |
| Additional analyses | 16 | Describe methods of additional analyses (e.g., sensitivity or subgroup analyses, meta-regression), if done, indicating which were pre-specified. | N/A |
| RESULTS | |||
| Study selection | 17 | Give numbers of studies screened, assessed for eligibility and included in the review, with reasons for exclusions at each stage, ideally with a flow diagram. | 3–4 |
| Study characteristics | 18 | For each study, present characteristics for which data were extracted (e.g., study size, PICOS, follow-up period) and provide the citations. | 3–4 |
| Risk of bias within studies | 19 | Present data on risk of bias of each study and, if available, any outcome level assessment (see item 12). | 4 and Appendix |
| Results of individual studies | 20 | For all outcomes considered (benefits or harms), present, for each study, (a) simple summary data for each intervention group and (b) effect estimates and confidence intervals, ideally with a forest plot. | 4–6 |
| Synthesis of results | 21 | Present the main results of the review. If meta-analyses are done, include for each confidence intervals and measures of consistency | 3–6 |
| Risk of bias across studies | 22 | Present results of any assessment of risk of bias across studies (see Item 15). | 4 and Appendix |
| Additional analysis | 23 | Give results of additional analyses, if done (e.g., sensitivity or subgroup analyses, meta-regression (see Item 16)). | N/A |
| DISCUSSION | |||
| Summary of evidence | 24 | Summarize the main findings including the strength of evidence for each main outcome; consider their relevance to key groups (e.g., healthcare providers, users and policy makers). | 6–7 |
| Limitations | 25 | Discuss limitations at study and outcome level (e.g., risk of bias) and at review-level (e.g., incomplete retrieval of identified research, reporting bias). | 8 |
| Conclusions | 26 | Provide a general interpretation of the results in the context of other evidence and implications for future research. | 7–8 |
| FUNDING | |||
| Funding | 27 | Describe sources of funding for the systematic review and other support (e.g., supply of data); role of funders for the systematic review. | N/A |
References
- Van Marken Lichtenbelt, W.D.; Vanhommerig, J.W.; Smulders, N.M.; Drossaerts, J.M.; Kemerink, G.J.; Bouvy, N.D.; Schrauwen, P.; Teule, G.J. Cold-activated brown adipose tissue in healthy men. N. Engl. J. Med. 2009, 360, 1500–1508. [Google Scholar] [CrossRef]
- Mattson, M.P. Perspective: Does brown fat protect against diseases of aging? Ageing Res. Rev. 2010, 9, 69–76. [Google Scholar] [CrossRef] [PubMed]
- van Marken Lichtenbelt, W.D.; Schrauwen, P. Implications of nonshivering thermogenesis for energy balance regulation in humans. Am. J. Physiol. Regul. Integr. Comp. Physiol. 2011, 301, R285–R296. [Google Scholar] [CrossRef] [PubMed]
- Cannon, B.; Nedergaard, J. Brown adipose tissue: Function and physiological significance. Physiol. Rev. 2004, 84, 277–359. [Google Scholar] [CrossRef] [PubMed]
- Westerterp, K.R. Diet induced thermogenesis. Nutr. Metab. 2004, 1, 5. [Google Scholar] [CrossRef] [PubMed]
- Kopecky, J.; Clarke, G.; Enerback, S.; Spiegelman, B.; Kozak, L.P. Expression of the mitochondrial uncoupling protein gene from the aP2 gene promoter prevents genetic obesity. J. Clin. Investig. 1995, 96, 2914–2923. [Google Scholar] [CrossRef] [PubMed]
- Kopecky, J.; Rossmeisl, M.; Hodny, Z.; Syrovy, I.; Horakova, M.; Kolarova, P. Reduction of dietary obesity in aP2-Ucp transgenic mice: Mechanism and adipose tissue morphology. Am. J. Physiol. 1996, 270, E776–E786. [Google Scholar] [CrossRef]
- Cederberg, A.; Gronning, L.M.; Ahren, B.; Tasken, K.; Carlsson, P.; Enerback, S. FOXC2 is a winged helix gene that counteracts obesity, hypertriglyceridemia, and diet-induced insulin resistance. Cell 2001, 106, 563–573. [Google Scholar] [CrossRef]
- Tsukiyama-Kohara, K.; Poulin, F.; Kohara, M.; DeMaria, C.T.; Cheng, A.; Wu, Z.; Gingras, A.C.; Katsume, A.; Elchebly, M.; Spiegelman, B.M.; et al. Adipose tissue reduction in mice lacking the translational inhibitor 4E-BP1. Nat. Med. 2001, 7, 1128–1132. [Google Scholar] [CrossRef]
- Seale, P.; Kajimura, S.; Spiegelman, B.M. Transcriptional control of brown adipocyte development and physiological function--of mice and men. Genes Dev. 2009, 23, 788–797. [Google Scholar] [CrossRef]
- Bartelt, A.; Bruns, O.T.; Reimer, R.; Hohenberg, H.; Ittrich, H.; Peldschus, K.; Kaul, M.G.; Tromsdorf, U.I.; Weller, H.; Waurisch, C.; et al. Brown adipose tissue activity controls triglyceride clearance. Nat. Med. 2011, 17, 200–205. [Google Scholar] [CrossRef] [PubMed]
- Berbée, J.F.P.; Boon, M.R.; Khedoe, P.P.S.J.; Bartelt, A.; Schlein, C.; Worthmann, A.; Kooijman, S.; Hoeke, G.; Mol, I.M.; John, C.; et al. Brown fat activation reduces hypercholesterolaemia and protects from atherosclerosis development. Nat. Commun. 2015, 6, 6356. [Google Scholar] [CrossRef] [PubMed]
- Fischer, A.W.; Behrens, J.; Sass, F.; Schlein, C.; Heine, M.; Pertzborn, P.; Scheja, L.; Heeren, J. Brown adipose tissue lipoprotein and glucose disposal is not determined by thermogenesis in UCP1- deficient mice. J. Lipid Res. 2020. [Google Scholar] [CrossRef] [PubMed]
- Stanford, K.I.; Middelbeek, R.J.W.; Townsend, K.L.; An, D.; Nygaard, E.B.; Hitchcox, K.M.; Markan, K.R.; Nakano, K.; Hirshman, M.F.; Tseng, Y.-H.; et al. Brown adipose tissue regulates glucose homeostasis and insulin sensitivity. J. Clin. Investig. 2013, 123, 215–223. [Google Scholar] [CrossRef] [PubMed]
- Cypess, A.M.; Lehman, S.; Williams, G.; Tal, I.; Rodman, D.; Goldfine, A.B.; Kuo, F.C.; Palmer, E.L.; Tseng, Y.H.; Doria, A.; et al. Identification and importance of brown adipose tissue in adult humans. N. Engl. J. Med. 2009, 360, 1509–1517. [Google Scholar] [CrossRef]
- Dinas, P.C.; Nikaki, A.; Jamurtas, A.Z.; Prassopoulos, V.; Efthymiadou, R.; Koutedakis, Y.; Georgoulias, P.; Flouris, A.D. Association between habitual physical activity and brown adipose tissue activity in individuals undergoing PET-CT scan. Clin. Endocrinol. 2015, 82, 147–154. [Google Scholar] [CrossRef]
- Dinas, P.C.; Krase, A.; Nintou, E.; Georgakopoulos, A.; Granzotto, M.; Metaxas, M.; Karachaliou, E.; Rossato, M.; Vettor, R.; Georgoulias, P.; et al. Human white-fat thermogenesis: Experimental and meta-analytic findings. Temperature 2020, 1–14. [Google Scholar] [CrossRef]
- Rothwell, N.J.; Stock, M.J.; Tyzbir, R.S. Energy balance and mitochondrial function in liver and brown fat of rats fed “cafeteria” diets of varying protein content. J. Nutr. 1982, 112, 1663–1672. [Google Scholar] [CrossRef]
- Rothwell, N.J.; Stock, M.J.; Tyzbir, R.S. Mechanisms of thermogenesis induced by low protein diets. Metabolism 1983, 32, 257–261. [Google Scholar] [CrossRef]
- Leblanc, J. Prefeeding of high fat diet and resistance of rats to intense cold. Can. J. Biochem. Physiol. 1957, 35, 25–30. [Google Scholar] [CrossRef]
- Yoshimura, M.; Hori, S.; Yoshimura, H. Effect of high-fat diet on thermal acclimation with special reference to thyroid activity. Jpn. J. Physiol. 1972, 22, 517–531. [Google Scholar] [CrossRef] [PubMed]
- Kuroshima, A.; Doi, K.; Yahata, T.; Ohno, T. Improved cold tolerance and its mechanism in cold-acclimated rats by high fat diet feeding. Can. J. Physiol. Pharmacol. 1977, 55, 943–950. [Google Scholar] [CrossRef] [PubMed]
- Mercer, S.W.; Trayhurn, P. Effect of high fat diets on the thermogenic activity of brown adipose tissue in cold-acclimated mice. J. Nutr. 1984, 114, 1151–1158. [Google Scholar] [CrossRef] [PubMed]
- Srivastava, S.; Kashiwaya, Y.; King, M.T.; Baxa, U.; Tam, J.; Niu, G.; Chen, X.; Clarke, K.; Veech, R.L. Mitochondrial biogenesis and increased uncoupling protein 1 in brown adipose tissue of mice fed a ketone ester diet. FASEB J. 2012, 26, 2351–2362. [Google Scholar] [CrossRef] [PubMed]
- Srivastava, S.; Baxa, U.; Niu, G.; Chen, X.; Veech, R.L. A ketogenic diet increases brown adipose tissue mitochondrial proteins and UCP1 levels in mice. IUBMB Life 2013, 65, 58–66. [Google Scholar] [CrossRef] [PubMed]
- Feldmann, H.M.; Golozoubova, V.; Cannon, B.; Nedergaard, J. UCP1 ablation induces obesity and abolishes diet-induced thermogenesis in mice exempt from thermal stress by living at thermoneutrality. Cell Metab. 2009, 9, 203–209. [Google Scholar] [CrossRef]
- Luijten, I.H.N.; Feldmann, H.M.; von Essen, G.; Cannon, B.; Nedergaard, J. In the absence of UCP1-mediated diet-induced thermogenesis, obesity is augmented even in the obesity-resistant 129S mouse strain. Am. J. Physiol. Endocrinol. Metab. 2019, 316, E729–E740. [Google Scholar] [CrossRef] [PubMed]
- von Essen, G.; Lindsund, E.; Cannon, B.; Nedergaard, J. Adaptive facultative diet-induced thermogenesis in wild-type but not in UCP1-ablated mice. Am. J. Physiol. Endocrinol. Metab. 2017, 313, E515–E527. [Google Scholar] [CrossRef]
- Vrieze, A.; Schopman, J.E.; Admiraal, W.M.; Soeters, M.R.; Nieuwdorp, M.; Verberne, H.J.; Holleman, F. Fasting and postprandial activity of brown adipose tissue in healthy men. J. Nucl. Med. 2012, 53, 1407–1410. [Google Scholar] [CrossRef]
- Hibi, M.; Oishi, S.; Matsushita, M.; Yoneshiro, T.; Yamaguchi, T.; Usui, C.; Yasunaga, K.; Katsuragi, Y.; Kubota, K.; Tanaka, S.; et al. Brown adipose tissue is involved in diet-induced thermogenesis and whole-body fat utilization in healthy humans. Int. J. Obes. 2016, 40, 1655–1661. [Google Scholar] [CrossRef]
- Vosselman, M.J.; Brans, B.; van der Lans, A.A.; Wierts, R.; van Baak, M.A.; Mottaghy, F.M.; Schrauwen, P.; van Marken Lichtenbelt, W.D. Brown adipose tissue activity after a high-calorie meal in humans. Am. J. Clin. Nutr. 2013, 98, 57–64. [Google Scholar] [CrossRef] [PubMed]
- Peterson, C.M.; Orooji, M.; Johnson, D.N.; Naraghi-Pour, M.; Ravussin, E. Brown adipose tissue does not seem to mediate metabolic adaptation to overfeeding in men. Obes. Silver Spring 2017, 25, 502–505. [Google Scholar] [CrossRef]
- Moher, D.; Liberati, A.; Tetzlaff, J.; Altman, D.G.; Group, P. Preferred reporting items for systematic reviews and meta-analyses: The PRISMA statement. BMJ 2009, 339, b2535. [Google Scholar] [CrossRef] [PubMed]
- Higgins, J.P.; Altman, D.G.; Gotzsche, P.C.; Juni, P.; Moher, D.; Oxman, A.D.; Savovic, J.; Schulz, K.F.; Weeks, L.; Sterne, J.A.; et al. The Cochrane Collaboration’s tool for assessing risk of bias in randomised trials. BMJ 2011, 343, d5928. [Google Scholar] [CrossRef] [PubMed]
- Viswanathan, M.; Berkman, N.D.; Dryden, D.M.; Hartling, L. Further Development of the RTI Item Bank. In Assessing Risk of Bias and Confounding in Observational Studies of Interventions or Exposures; Agency for Healthcare Research and Quality: Rockville, MD, USA, 2013. [Google Scholar]
- Margulis, A.V.; Pladevall, M.; Riera-Guardia, N.; Varas-Lorenzo, C.; Hazell, L.; Berkman, N.D.; Viswanathan, M.; Perez-Gutthann, S. Quality assessment of observational studies in a drug-safety systematic review, comparison of two tools: The Newcastle-Ottawa Scale and the RTI item bank. Clin. Epidemiol. 2014, 6, 359–368. [Google Scholar] [CrossRef] [PubMed]
- Al-Saleh, M.A.; Armijo-Olivo, S.; Thie, N.; Seikaly, H.; Boulanger, P.; Wolfaardt, J.; Major, P. Morphologic and functional changes in the temporomandibular joint and stomatognathic system after transmandibular surgery in oral and oropharyngeal cancers: Systematic review. J. Otolaryngol. Head Neck Surg. 2012, 41, 345–360. [Google Scholar]
- Centre, T.N.C. Review Manager (RevMan) [Computer Program.], Version 5.3; The Cochrane Collaboration: Copenhagen, Denmark, 2014. [Google Scholar]
- Higgins, J.P.; Green, S. (Eds.) Cochrane Handbook for Systematic Reviews of Interventions Version 5.1.0 [updated March 2011]; The Cochrane Collaboration: Copenhagen, Denmark, 2011; Available online: www.handbook.cochrane.org (accessed on 9 September 2020).
- Ahmadi, N.; Nabavi, V.; Hajsadeghi, F.; Zeb, I.; Flores, F.; Ebrahimi, R.; Budoff, M. Aged garlic extract with supplement is associated with increase in brown adipose, decrease in white adipose tissue and predict lack of progression in coronary atherosclerosis. Int. J. Cardiol. 2013, 168, 2310–2314. [Google Scholar] [CrossRef]
- Robinson, L.J.; Law, J.; Astle, V.; Gutierrez-Garcia, M.; Ojha, S.; Symonds, M.E.; Pitchford, N.; Budge, H. Sexual Dimorphism of Brown Adipose Tissue Function. J. Pediatr. 2019, 210, 166–172. [Google Scholar] [CrossRef]
- Boon, M.R.; Hanssen, M.J.W.; Brans, B.; Hulsman, C.J.M.; Hoeks, J.; Nahon, K.J.; Bakker, C.; van Klinken, J.B.; Havekes, B.; Schaart, G.; et al. Effect of L-arginine on energy metabolism, skeletal muscle and brown adipose tissue in South Asian and Europid prediabetic men: A randomised double-blinded crossover study. Diabetologia 2019, 62, 112–122. [Google Scholar] [CrossRef]
- Yoneshiro, T.; Aita, S.; Matsushita, M.; Kayahara, T.; Kameya, T.; Kawai, Y.; Iwanaga, T.; Saito, M. Recruited brown adipose tissue as an antiobesity agent in humans. J. Clin. Investig. 2013, 123, 3404–3408. [Google Scholar] [CrossRef]
- Yoneshiro, T.; Matsushita, M.; Hibi, M.; Tone, H.; Takeshita, M.; Yasunaga, K.; Katsuragi, Y.; Kameya, T.; Sugie, H.; Saito, M. Tea catechin and caffeine activate brown adipose tissue and increase cold-induced thermogenic capacity in humans. Am. J. Clin. Nutr. 2017, 105, 873–881. [Google Scholar] [CrossRef] [PubMed]
- Schlogl, M.; Piaggi, P.; Thiyyagura, P.; Reiman, E.M.; Chen, K.; Lutrin, C.; Krakoff, J.; Thearle, M.S. Overfeeding over 24 hours does not activate brown adipose tissue in humans. J. Clin. Endocrinol. Metab. 2013, 98, E1956–E1960. [Google Scholar] [CrossRef] [PubMed]
- Williams, G.; Kolodny, G.M. Method for decreasing uptake of 18F-FDG by hypermetabolic brown adipose tissue on PET. AJR Am. J. Roentgenol. 2008, 190, 1406–1409. [Google Scholar] [CrossRef] [PubMed]
- Sun, L.; Camps, S.G.; Goh, H.J.; Govindharajulu, P.; Schaefferkoetter, J.D.; Townsend, D.W.; Verma, S.K.; Velan, S.S.; Sun, L.; Sze, S.K.; et al. Capsinoids activate brown adipose tissue (BAT) with increased energy expenditure associated with subthreshold 18-fluorine fluorodeoxyglucose uptake in BAT-positive humans confirmed by positron emission tomography scan. Am. J. Clin. Nutr. 2018, 107, 62–70. [Google Scholar] [CrossRef]
- Nagai, N.; Sakane, N.; Kotani, K.; Hamada, T.; Tsuzaki, K.; Moritani, T. Uncoupling protein 1 gene -3826 A/G polymorphism is associated with weight loss on a short-term, controlled-energy diet in young women. Nutr. Res. 2011, 31, 255–261. [Google Scholar] [CrossRef]
- Dinas, P.C.; Valente, A.; Granzotto, M.; Rossato, M.; Vettor, R.; Zacharopoulou, A.; Carrillo, A.E.; Davies, N.A.; Gkiata, P.; Jamurtas, A.Z.; et al. Browning formation markers of subcutaneous adipose tissue in relation to resting energy expenditure, physical activity and diet in humans. Horm Mol. Biol. Clin. Investig. 2017, 31. [Google Scholar] [CrossRef]
- Nagai, N.; Sakane, N.; Hamada, T.; Kimura, T.; Moritani, T. The effect of a high-carbohydrate meal on postprandial thermogenesis and sympathetic nervous system activity in boys with a recent onset of obesity. Metabolism 2005, 54, 430–438. [Google Scholar] [CrossRef]
- Yoshioka, M.; St-Pierre, S.; Suzuki, M.; Tremblay, A. Effects of red pepper added to high-fat and high-carbohydrate meals on energy metabolism and substrate utilization in Japanese women. Br. J. Nutr. 1998, 80, 503–510. [Google Scholar] [CrossRef]
- Wijers, S.L.; Saris, W.H.; van Marken Lichtenbelt, W.D. Individual thermogenic responses to mild cold and overfeeding are closely related. J. Clin. Endocrinol. Metab. 2007, 92, 4299–4305. [Google Scholar] [CrossRef] [PubMed]
- Matsumoto, T.; Miyawaki, C.; Ue, H.; Yuasa, T.; Miyatsuji, A.; Moritani, T. Effects of capsaicin-containing yellow curry sauce on sympathetic nervous system activity and diet-induced thermogenesis in lean and obese young women. J. Nutr. Sci. Vitaminol. 2000, 46, 309–315. [Google Scholar] [CrossRef]
- Matsumoto, T.; Miyawaki, C.; Ue, H.; Kanda, T.; Yoshitake, Y.; Moritani, T. Comparison of thermogenic sympathetic response to food intake between obese and non-obese young women. Obes. Res. 2001, 9, 78–85. [Google Scholar] [CrossRef] [PubMed]
- Weststrate, J.A. Resting metabolic rate and diet-induced thermogenesis: A methodological reappraisal. Am. J. Clin. Nutr. 1993, 58, 592–601. [Google Scholar] [CrossRef] [PubMed]
- Schutz, Y.; Bessard, T.; Jequier, E. Diet-induced thermogenesis measured over a whole day in obese and nonobese women. Am. J. Clin. Nutr. 1984, 40, 542–552. [Google Scholar] [CrossRef] [PubMed]
- Peterson, C.M.; Lecoultre, V.; Frost, E.A.; Simmons, J.; Redman, L.M.; Ravussin, E. The thermogenic responses to overfeeding and cold are differentially regulated. Obes. Silver Spring 2016, 24, 96–101. [Google Scholar] [CrossRef]
- Yoneshiro, T.; Aita, S.; Kawai, Y.; Iwanaga, T.; Saito, M. Nonpungent capsaicin analogs (capsinoids) increase energy expenditure through the activation of brown adipose tissue in humans. Am. J. Clin. Nutr. 2012, 95, 845–850. [Google Scholar] [CrossRef]
- Barquissau, V.; Leger, B.; Beuzelin, D.; Martins, F.; Amri, E.Z.; Pisani, D.F.; Saris, W.H.M.; Astrup, A.; Maoret, J.J.; Iacovoni, J.; et al. Caloric Restriction and Diet-Induced Weight Loss Do Not Induce Browning of Human Subcutaneous White Adipose Tissue in Women and Men with Obesity. Cell Rep. 2018, 22, 1079–1089. [Google Scholar] [CrossRef]
- Van der Lans, A.A.J.J.; Vosselman, M.J.; Hanssen, M.J.W.; Brans, B.; van Marken Lichtenbelt, W.D. Supraclavicular skin temperature and BAT activity in lean healthy adults. J. Physiol. Sci. 2016, 66, 77–83. [Google Scholar] [CrossRef]
- Shirkhani, S.; Marandi, S.M.; Kazeminasab, F.; Esmaeili, M.; Ghaedi, K.; Esfarjani, F.; Shiralian-Esfahani, H.; Nasr-Esfahani, M.H. Comparative studies on the effects of high-fat diet, endurance training and obesity on Ucp1 expression in male C57BL/6 mice. Gene 2018, 676, 16–21. [Google Scholar] [CrossRef]
- Surwit, R.S.; Wang, S.; Petro, A.E.; Sanchis, D.; Raimbault, S.; Ricquier, D.; Collins, S. Diet-induced changes in uncoupling proteins in obesity-prone and obesity-resistant strains of mice. Proc. Natl. Acad. Sci. USA 1998, 95, 4061–4065. [Google Scholar] [CrossRef]
- Li, Y.; Schnabl, K.; Gabler, S.-M.; Willershäuser, M.; Reber, J.; Karlas, A.; Laurila, S.; Lahesmaa, M.; u Din, M.; Bast-Habersbrunner, A.; et al. Secretin-Activated Brown Fat Mediates Prandial Thermogenesis to Induce Satiation. Cell 2018, 175, 1561–1574. [Google Scholar] [CrossRef]
- U Din, M.; Saari, T.; Raiko, J.; Kudomi, N.; Maurer, S.F.; Lahesmaa, M.; Fromme, T.; Amri, E.-Z.; Klingenspor, M.; Solin, O.; et al. Postprandial Oxidative Metabolism of Human Brown Fat Indicates Thermogenesis. Cell Metab. 2018, 28, 207–216. [Google Scholar] [CrossRef] [PubMed]
- Kraemer, R.; Castracane, V. Effect of Acute and Chronic Exercise on Ghrelin and Adipocytokines during Pubertal Development. Med. Sport Sci. 2010, 55, 156–173. [Google Scholar] [PubMed]
- Friedman, J. Leptin and the Regulation of Food Intake and Body Weight. J. Nutr. Sci. Vitaminol. 2015, 61 (Suppl. S202), S202. [Google Scholar] [CrossRef]
- Trayhurn, P.; Hoggard, N.; Mercer, J.G.; Rayner, D.V. Leptin: Fundamental aspects. Int. J. Obes. Relat. Metab. Disord. 1999, 23 (Suppl 1), 22–28. [Google Scholar] [CrossRef]
- Fischer, A.W.; Hoefig, C.S.; Abreu-Vieira, G.; de Jong, J.M.A.; Petrovic, N.; Mittag, J.; Cannon, B.; Nedergaard, J. Leptin Raises Defended Body Temperature without Activating Thermogenesis. Cell Rep. 2016, 14, 1621–1631. [Google Scholar] [CrossRef] [PubMed]
- Fischer, A.W.; Cannon, B.; Nedergaard, J. Leptin: Is It Thermogenic? Endocr. Rev. 2020, 41, 232–260. [Google Scholar] [CrossRef]
- Chondronikola, M.; Volpi, E.; Børsheim, E.; Porter, C.; Annamalai, P.; Enerbäck, S.; Lidell, M.E.; Saraf, M.K.; Labbe, S.M.; Hurren, N.M.; et al. Brown adipose tissue improves whole-body glucose homeostasis and insulin sensitivity in humans. Diabetes 2014, 63, 4089–4099. [Google Scholar] [CrossRef] [PubMed]
- Khan, K.S.; Kunz, R.; Kleijnen, J.; Antes, G. Five steps to conducting a systematic review. J. R. Soc. Med. 2003, 96, 118–121. [Google Scholar] [CrossRef]
- Liberati, A.; Altman, D.; Tetzlaff, J.; Mulrow, C.; Gøtzsche, P.; Ioannidis, J.; Clarke, M.; Devereaux, P.; Kleijnen, J.; Moher, D. The PRISMA statement for reporting systematic reviews and meta-analyses of studies that evaluate healthcare interventions: Explanation and elaboration. BMJ 2009, 339, b270. [Google Scholar] [CrossRef]
- Harris, J.D.; Quatman, C.E.; Manring, M.M.; Siston, R.A.; Flanigan, D.C. How to write a systematic review. Am. J. Sports Med. 2014, 42, 2761–2768. [Google Scholar] [CrossRef]
- Steinberg, J.D.; Vogel, W.; Vegt, E. Factors influencing brown fat activation in FDG PET/CT: A retrospective analysis of 15,000+ cases. Br. J. Radiol. 2017, 90, 20170093. [Google Scholar] [CrossRef] [PubMed]
- Osuna-Prieto, F.J.; Martinez-Tellez, B.; Sanchez-Delgado, G.; Aguilera, C.M.; Lozano-Sánchez, J.; Arráez-Román, D.; Segura-Carretero, A.; Ruiz, J.R. Activation of Human Brown Adipose Tissue by Capsinoids, Catechins, Ephedrine, and Other Dietary Components: A Systematic Review. Adv. Nutr. 2019, 10, 291–302. [Google Scholar] [CrossRef] [PubMed]


© 2020 by the authors. Licensee MDPI, Basel, Switzerland. This article is an open access article distributed under the terms and conditions of the Creative Commons Attribution (CC BY) license (http://creativecommons.org/licenses/by/4.0/).
Share and Cite
Heenan, K.A.; Carrillo, A.E.; Fulton, J.L.; Ryan, E.J.; Edsall, J.R.; Rigopoulos, D.; Markofski, M.M.; Flouris, A.D.; Dinas, P.C. Effects of Nutrition/Diet on Brown Adipose Tissue in Humans: A Systematic Review and Meta-Analysis. Nutrients 2020, 12, 2752. https://doi.org/10.3390/nu12092752
Heenan KA, Carrillo AE, Fulton JL, Ryan EJ, Edsall JR, Rigopoulos D, Markofski MM, Flouris AD, Dinas PC. Effects of Nutrition/Diet on Brown Adipose Tissue in Humans: A Systematic Review and Meta-Analysis. Nutrients. 2020; 12(9):2752. https://doi.org/10.3390/nu12092752
Chicago/Turabian StyleHeenan, Kelsey A., Andres E. Carrillo, Jacob L. Fulton, Edward J. Ryan, Jason R. Edsall, Dimitrios Rigopoulos, Melissa M. Markofski, Andreas D. Flouris, and Petros C. Dinas. 2020. "Effects of Nutrition/Diet on Brown Adipose Tissue in Humans: A Systematic Review and Meta-Analysis" Nutrients 12, no. 9: 2752. https://doi.org/10.3390/nu12092752
APA StyleHeenan, K. A., Carrillo, A. E., Fulton, J. L., Ryan, E. J., Edsall, J. R., Rigopoulos, D., Markofski, M. M., Flouris, A. D., & Dinas, P. C. (2020). Effects of Nutrition/Diet on Brown Adipose Tissue in Humans: A Systematic Review and Meta-Analysis. Nutrients, 12(9), 2752. https://doi.org/10.3390/nu12092752