Effects of Vegetarian Diets on Blood Pressure Lowering: A Systematic Review with Meta-Analysis and Trial Sequential Analysis

 , ,
, ,
Abstract
1. Introduction
2. Methods
2.1. Data Sources
2.2. Intervention and Control Group Definitions
2.3. Study Selection
2.4. Data Extraction
2.5. Data Syntheses
2.6. Risk of Bias Assessment
2.7. Grading of the Evidence
3. Results
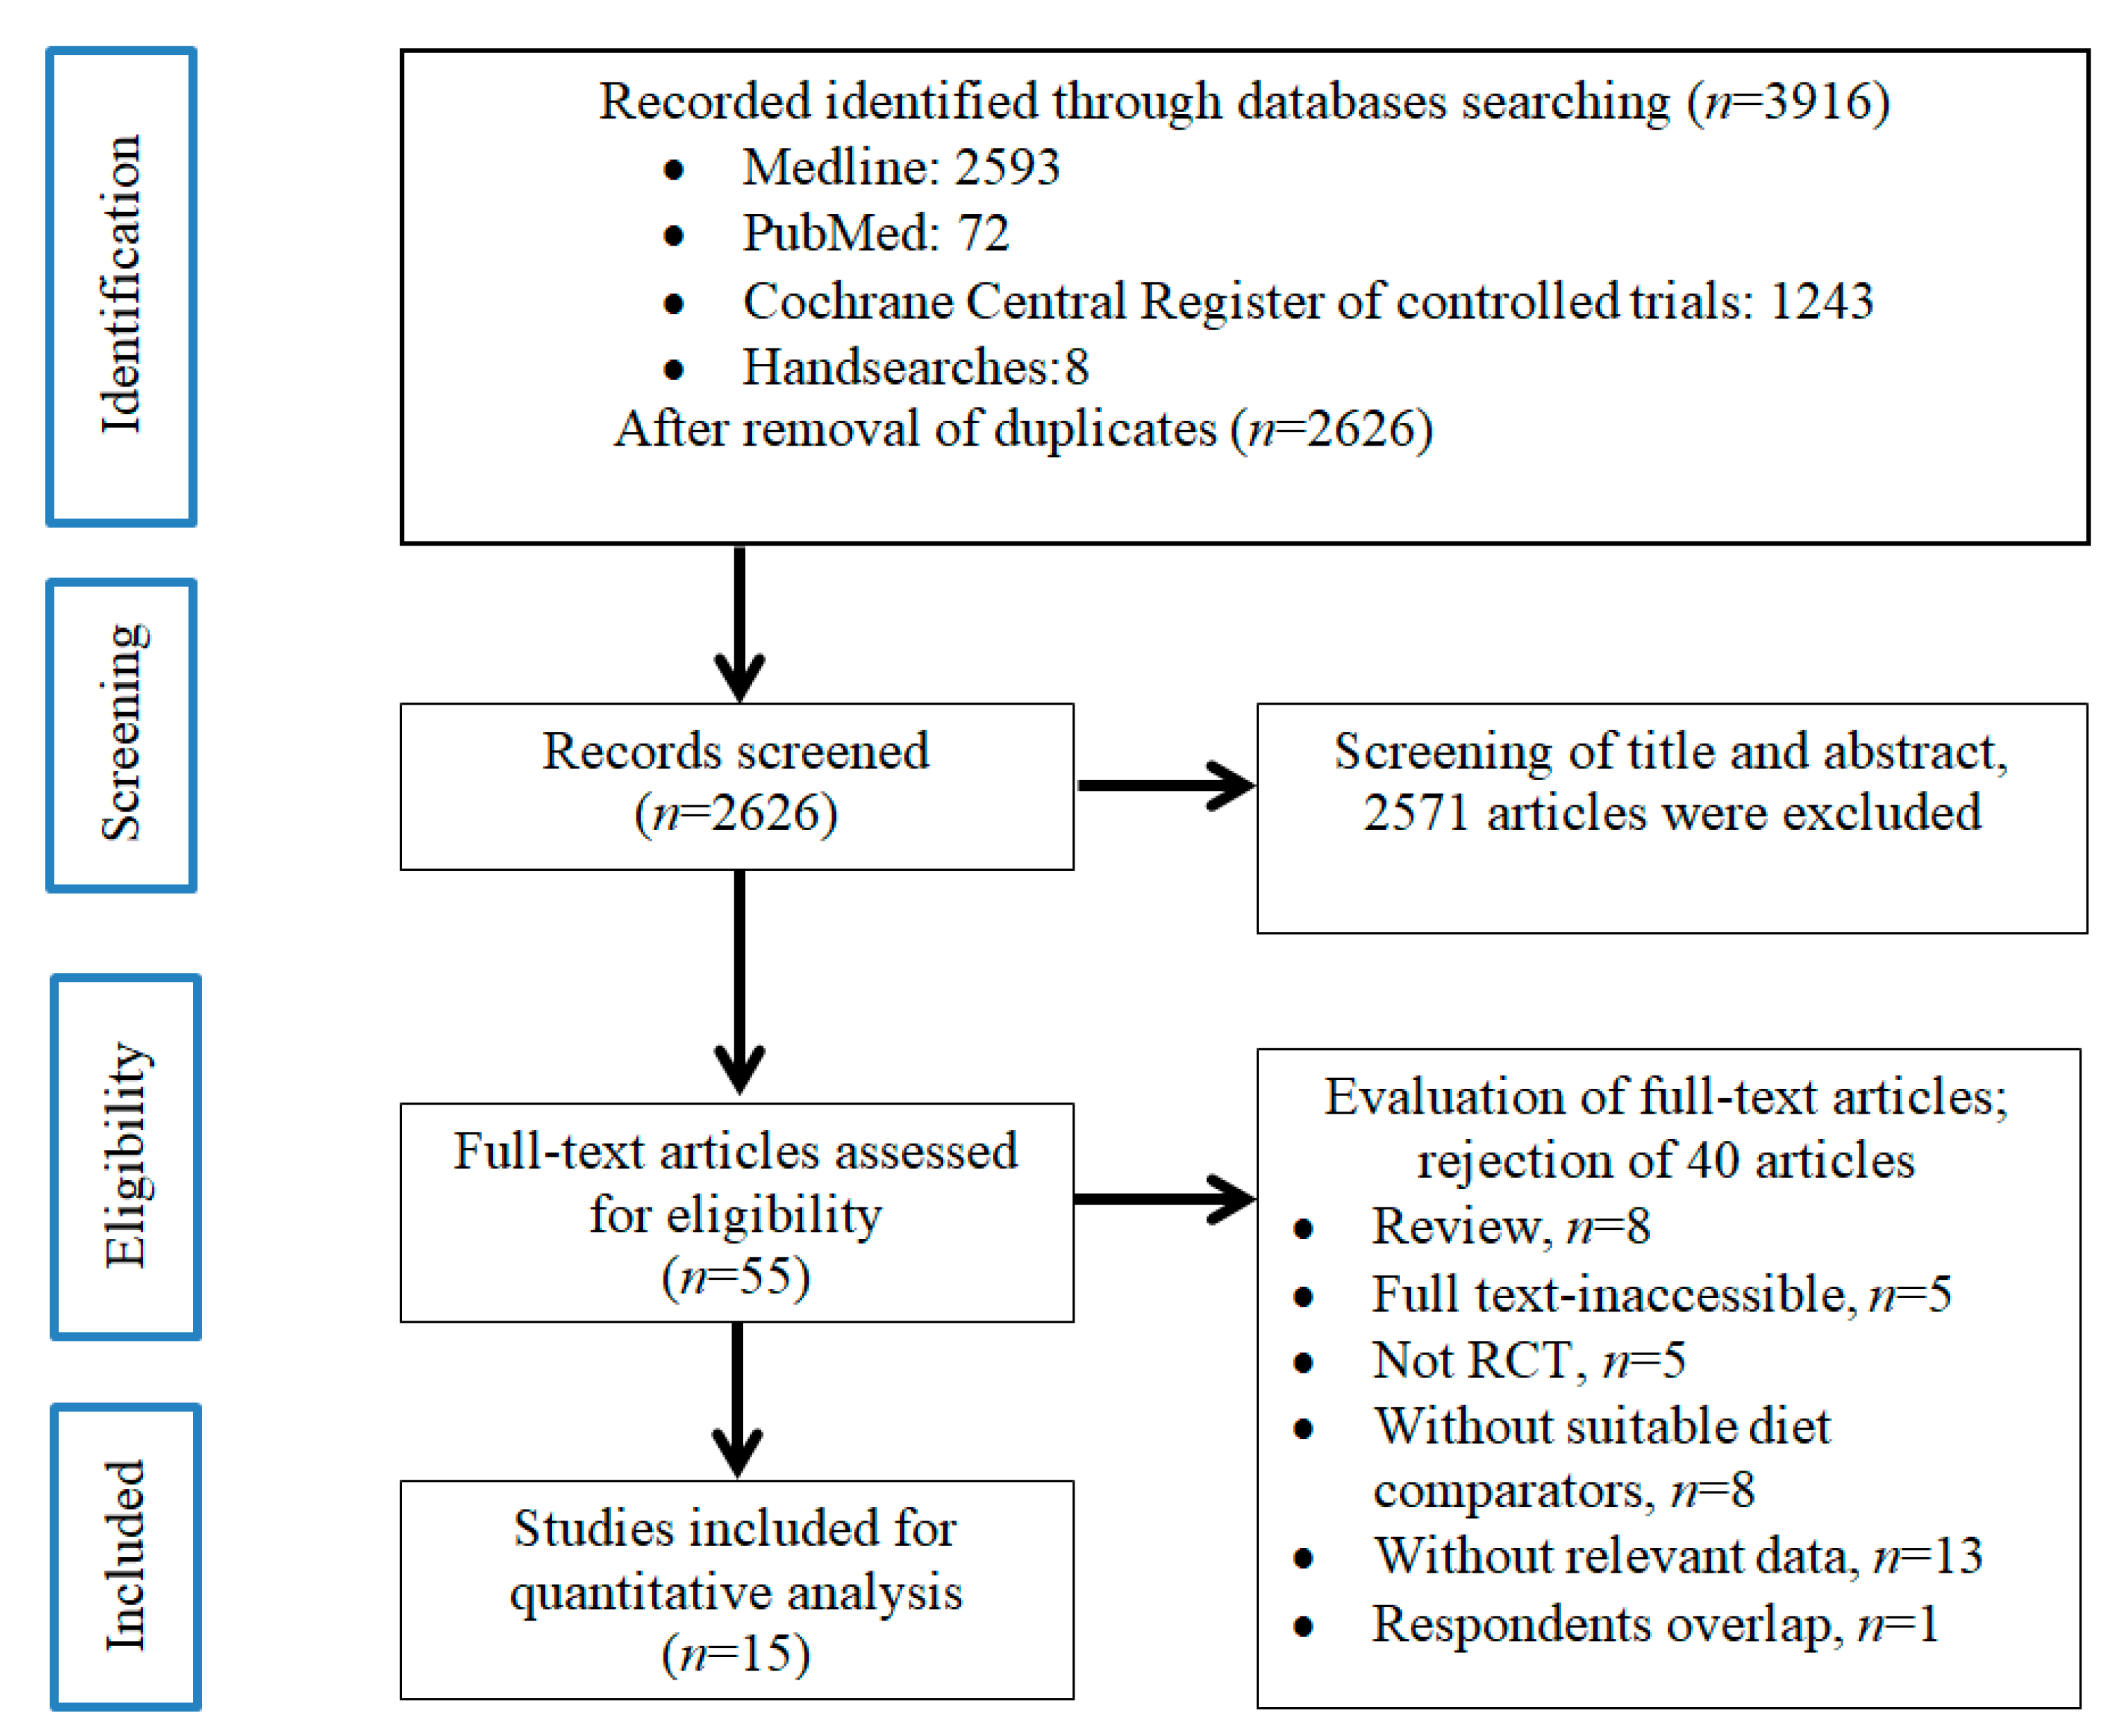
3.1. Search Results
3.2. Trials Characteristics
3.3. Effect of Vegetarian Diets on Systolic Blood Pressure Lowering and Its Subgroup Analysis
3.4. Effect of Vegetarian Diets on Diastolic Blood Pressure Lowering and Its Subgroup Analysis
3.5. Risk of Bias within Studies
3.6. GRADE Assessment
4. Discussion
Limitations and Future Research Recommendation
5. Conclusions
Supplementary Materials
Author Contributions
Funding
Acknowledgments
Conflicts of Interest
References
- Kearney, P.M.; Whelton, M.; Reynolds, K.; Muntner, P.; Whelton, P.K.; He, J. Global burden of hypertension: Analysis of worldwide data. Lancet 2005, 365, 217–223. [Google Scholar] [CrossRef]
- Collaboration, N.C.D.R.F. Worldwide trends in blood pressure from 1975 to 2015: A pooled analysis of 1479 population-based measurement studies with 19·1 million participants. Lancet 2017, 389, 37–55. [Google Scholar]
- Whelton, P.K.; Carey, R.M.; Aronow, W.S.; Casey, D.E., Jr.; Collins, K.J.; Dennison Himmelfarb, C.; DePalma, S.M.; Gidding, S.; Jamerson, K.A.; Jones, D.W.; et al. 2017 ACC/AHA/AAPA/ABC/ACPM/AGS/APhA/ASH/ASPC/NMA/PCNA Guideline for the Prevention, Detection, Evaluation, and Management of High Blood Pressure in Adults: A Report of the American College of Cardiology/American Heart Association Task Force on Clinical Practice Guidelines. J. Am. Coll. Cardiol. 2018, 71, e127–e248. [Google Scholar] [PubMed]
- Hadaegh, F.; Mohebi, R.; Khalili, D.; Hasheminia, M.; Sheikholeslami, F.; Azizi, F. High normal blood pressure is an independent risk factor for cardiovascular disease among middle-aged but not in elderly populations: 9-year results of a population-based study. J. Hum. Hypertens. 2013, 27, 18–23. [Google Scholar] [CrossRef] [PubMed]
- Kannel, W.B. Blood pressure as a cardiovascular risk factor: Prevention and treatment. JAMA 1996, 275, 1571–1576. [Google Scholar] [CrossRef]
- Hu, G.; Sarti, C.; Jousilahti, P.; Peltonen, M.; Qiao, Q.; Antikainen, R.; Tuomilehto, J. The impact of history of hypertension and type 2 diabetes at baseline on the incidence of stroke and stroke mortality. Stroke 2005, 36, 2538–2543. [Google Scholar] [CrossRef]
- Klag, M.J.; Whelton, P.K.; Randall, B.L.; Neaton, J.D.; Brancati, F.L.; Ford, C.E.; Shulman, N.B.; Stamler, J. Blood Pressure and End-Stage Renal Disease in Men. N. Engl. J. Med. 1996, 334, 13–18. [Google Scholar] [CrossRef]
- Gress, T.W.; Nieto, F.J.; Shahar, E.; Wofford, M.R.; Brancati, F.L. Hypertension and antihypertensive therapy as risk factors for type 2 diabetes mellitus. Atherosclerosis Risk in Communities Study. N. Engl. J. Med. 2000, 342, 905–912. [Google Scholar] [CrossRef]
- Arauz-Pacheco, C.; Parrott, M.A.; Raskin, P. Treatment of hypertension in adults with diabetes. Diabetes Care 2003, 26 (Suppl. 1), S80–S82. [Google Scholar]
- Fraser, G.E. Vegetarian diets: What do we know of their effects on common chronic diseases? Am. J. Clin. Nutr. 2009, 89, 1607s–1612s. [Google Scholar] [CrossRef]
- Rogerson, D. Vegan diets: Practical advice for athletes and exercisers. J. Int. Soc. Sports Nutr. 2017, 14, 36. [Google Scholar] [CrossRef] [PubMed]
- Górska-Warsewicz, H.; Laskowski, W.; Kulykovets, O.; Kudlińska-Chylak, A.; Czeczotko, M.; Rejman, K. Food products as sources of protein and amino acids—The case of Poland. Nutrients 2018, 10, 1977. [Google Scholar] [CrossRef] [PubMed]
- Poppitt, S.D. Milk proteins and human health. In Milk Proteins; Elsevier: Cambridge, MA, USA, 2020; pp. 651–669. [Google Scholar]
- Dasinger, J.H.; Fehrenbach, D.J.; Abais-Battad, J.M. Dietary Protein: Mechanisms Influencing Hypertension and Renal Disease. Curr. Hypertens. Rep. 2020, 22, 13. [Google Scholar] [CrossRef] [PubMed]
- Soeters, P.B. Vegan diets: What is the benefit? Curr. Opin. Clin. Nutr. Metab. Care 2020, 23, 151–153. [Google Scholar] [CrossRef] [PubMed]
- Willett, W. Lessons from dietary studies in Adventists and questions for the future. Am. J. Clin. Nutr. 2003, 78 (Suppl. 3), 539s–543s. [Google Scholar] [CrossRef]
- Alexander, S.; Ostfeld, R.J.; Allen, K.; Williams, K.A. A plant-based diet and hypertension. J. Geriatr. Cardiol. 2017, 14, 327–330. [Google Scholar]
- Suter, P.M.; Sierro, C.; Vetter, W. Nutritional factors in the control of blood pressure and hypertension. Nutr. Clin. Care 2002, 5, 9–19. [Google Scholar] [CrossRef]
- Baradaran, A.; Nasri, H.; Rafieian-Kopaei, M. Oxidative stress and hypertension: Possibility of hypertension therapy with antioxidants. J. Res. Med. Sci. 2014, 19, 358–367. [Google Scholar]
- Upadhyay, S.; Dixit, M. Role of Polyphenols and Other Phytochemicals on Molecular Signaling. Oxidative Med. Cell. Longev. 2015, 2015, 504253. [Google Scholar] [CrossRef]
- Zhou, M.S.; Wang, A.; Yu, H. Link between insulin resistance and hypertension: What is the evidence from evolutionary biology? Diabetol. Metab. Syndr. 2014, 6, 12. [Google Scholar] [CrossRef]
- Ernst, E.; Pietsch, L.; Matrai, A.; Eisenberg, J. Blood rheology in vegetarians. Br. J. Nutr. 1986, 56, 555–560. [Google Scholar] [CrossRef] [PubMed]
- Marques, F.Z.; Nelson, E.; Chu, P.Y.; Horlock, D.; Fiedler, A.; Ziemann, M.; Tan, J.K.; Kuruppu, S.; Rajapakse, N.W.; El-Osta, A.; et al. High-Fiber Diet and Acetate Supplementation Change the Gut Microbiota and Prevent the Development of Hypertension and Heart Failure in Hypertensive Mice. Circulation 2017, 135, 964–977. [Google Scholar] [CrossRef] [PubMed]
- Yokoyama, Y.; Nishimura, K.; Barnard, N.D.; Takegami, M.; Watanabe, M.; Sekikawa, A.; Okamura, T.; Miyamoto, Y. Vegetarian diets and blood pressure: A meta-analysis. JAMA Intern. Med. 2014, 174, 577–587. [Google Scholar] [CrossRef] [PubMed]
- Lopez, P.D.; Cativo, E.H.; Atlas, S.A.; Rosendorff, C. The Effect of Vegan Diets on Blood Pressure in Adults: A Meta-Analysis of Randomized Controlled Trials. Am. J. Med. 2019, 132, 875–883.e877. [Google Scholar] [CrossRef] [PubMed]
- Moher, D.; Shamseer, L.; Clarke, M.; Ghersi, D.; Liberati, A.; Petticrew, M.; Shekelle, P.; Stewart, L.A. Preferred reporting items for systematic review and meta-analysis protocols (PRISMA-P) 2015 statement. Syst. Rev. 2015, 4, 1. [Google Scholar] [CrossRef]
- Wallace, B.C.; Dahabreh, I.J.; Trikalinos, T.A.; Lau, J.; Trow, P.; Schmid, C.H. Closing the gap between methodologists and end-users: R as a computational back-end. J. Stat. Softw. 2012, 49, 1–15. [Google Scholar] [CrossRef]
- Borenstein, M.; Hedges, L.V.; Higgins, J.P.; Rothstein, H.R. Introduction to Meta-Analysis; John Wiley Sons: Hoboken, NJ, USA, 2011. [Google Scholar]
- Brok, J.; Thorlund, K.; Gluud, C.; Wetterslev, J. Trial sequential analysis reveals insufficient information size and potentially false positive results in many meta-analyses. J. Clin. Epidemiol. 2008, 61, 763–769. [Google Scholar] [CrossRef]
- Gordon Lan, K.; DeMets, D.L. Discrete sequential boundaries for clinical trials. Biometrika 1983, 70, 659–663. [Google Scholar] [CrossRef]
- Jenkins, W.L. A quick method for estimating standard deviation. Psychol. Rep. 1955, 1, 77–78. [Google Scholar] [CrossRef]
- Higgins, J. Cochrane Handbook for Systematic Reviews of Interventions; Version 5.1; The Cochrane Collaboration: London, UK; Available online: www.cochrane-handbook.Org (accessed on 6 March 2011).
- Sterne, J.A.; Savović, J.; Page, M.J.; Elbers, R.G.; Blencowe, N.S.; Boutron, I.; Cates, C.J.; Cheng, H.-Y.; Corbett, M.S.; Eldridge, S.M. RoB 2: A revised tool for assessing risk of bias in randomised trials. BMJ 2019, 366, 4898. [Google Scholar] [CrossRef]
- Guyatt, G.; Oxman, A.D.; Akl, E.A.; Kunz, R.; Vist, G.; Brozek, J.; Norris, S.; Falck-Ytter, Y.; Glasziou, P.; Debeer, H. GRADE guidelines: 1. Introduction—GRADE evidence profiles and summary of findings tables. J. Clin. Epidemiol. 2011, 64, 383–394. [Google Scholar] [CrossRef] [PubMed]
- Guyatt, G.H.; Oxman, A.D.; Kunz, R.; Atkins, D.; Brozek, J.; Vist, G.; Alderson, P.; Glasziou, P.; Falck-Ytter, Y.; Schünemann, H.J. GRADE guidelines: 2. Framing the question and deciding on important outcomes. J. Clin. Epidemiol. 2011, 64, 395–400. [Google Scholar] [CrossRef] [PubMed]
- Balshem, H.; Helfand, M.; Schünemann, H.J.; Oxman, A.D.; Kunz, R.; Brozek, J.; Vist, G.E.; Falck-Ytter, Y.; Meerpohl, J.; Norris, S. GRADE guidelines: 3. Rating the quality of evidence. J. Clin. Epidemiol. 2011, 64, 401–406. [Google Scholar] [CrossRef] [PubMed]
- Guyatt, G.H.; Oxman, A.D.; Vist, G.; Kunz, R.; Brozek, J.; Alonso-Coello, P.; Montori, V.; Akl, E.A.; Djulbegovic, B.; Falck-Ytter, Y. GRADE guidelines: 4. Rating the quality of evidence—Study limitations (risk of bias). J. Clin. Epidemiol. 2011, 64, 407–415. [Google Scholar] [CrossRef]
- Guyatt, G.H.; Thorlund, K.; Oxman, A.D.; Walter, S.D.; Patrick, D.; Furukawa, T.A.; Johnston, B.C.; Karanicolas, P.; Akl, E.A.; Vist, G. GRADE guidelines: 13. Preparing summary of findings tables and evidence profiles—Continuous outcomes. J. Clin. Epidemiol. 2013, 66, 173–183. [Google Scholar] [CrossRef]
- Guyatt, G.H.; Oxman, A.D.; Kunz, R.; Woodcock, J.; Brozek, J.; Helfand, M.; Alonso-Coello, P.; Glasziou, P.; Jaeschke, R.; Akl, E.A. GRADE guidelines: 7. Rating the quality of evidence—Inconsistency. J. Clin. Epidemiol. 2011, 64, 1294–1302. [Google Scholar] [CrossRef]
- Guyatt, G.H.; Oxman, A.D.; Kunz, R.; Woodcock, J.; Brozek, J.; Helfand, M.; Alonso-Coello, P.; Falck-Ytter, Y.; Jaeschke, R.; Vist, G. GRADE guidelines: 8. Rating the quality of evidence—Indirectness. J. Clin. Epidemiol. 2011, 64, 1303–1310. [Google Scholar] [CrossRef]
- Guyatt, G.H.; Oxman, A.D.; Kunz, R.; Brozek, J.; Alonso-Coello, P.; Rind, D.; Devereaux, P.; Montori, V.M.; Freyschuss, B.; Vist, G. GRADE guidelines 6. Rating the quality of evidence—Imprecision. J. Clin. Epidemiol. 2011, 64, 1283–1293. [Google Scholar] [CrossRef]
- Guyatt, G.H.; Oxman, A.D.; Montori, V.; Vist, G.; Kunz, R.; Brozek, J.; Alonso-Coello, P.; Djulbegovic, B.; Atkins, D.; Falck-Ytter, Y. GRADE guidelines: 5. Rating the quality of evidence—Publication bias. J. Clin. Epidemiol. 2011, 64, 1277–1282. [Google Scholar] [CrossRef]
- Barnard, N.D.; Cohen, J.; Jenkins, D.J.; Turner-McGrievy, G.; Gloede, L.; Green, A.; Ferdowsian, H. A low-fat vegan diet and a conventional diabetes diet in the treatment of type 2 diabetes: A randomized, controlled, 74-wk clinical trial. Am. J. Clin. Nutr. 2009, 89, 1588S–1596S. [Google Scholar] [CrossRef]
- Barnard, N.D.; Levin, S.M.; Gloede, L.; Flores, R. Turning the waiting room into a classroom: Weekly classes using a vegan or a portion-controlled eating plan improve diabetes control in a randomized translational study. J. Acad. Nutr. Diet. 2018, 118, 1072–1079. [Google Scholar] [CrossRef]
- Bloomer, R.; Gunnels, T.; Schriefer, J. Comparison of a restricted and unrestricted vegan diet plan with a restricted omnivorous diet plan on health-specific measures. In Healthcare; Multidisciplinary Digital Publishing Institute: Basel, Switzerland, 2015. [Google Scholar]
- Ferdowsian, H.R.; Barnard, N.D.; Hoover, V.J.; Katcher, H.I.; Levin, S.M.; Green, A.A.; Cohen, J.L. A multicomponent intervention reduces body weight and cardiovascular risk at a GEICO corporate site. Am. J. Health Promot. 2010, 24, 384–387. [Google Scholar] [CrossRef] [PubMed]
- Hunt, J.R.; Matthys, L.A.; Johnson, L.K. Zinc absorption, mineral balance, and blood lipids in women consuming controlled lactoovovegetarian and omnivorous diets for 8 wk. Am. J. Clin. Nutr. 1998, 67, 421–430. [Google Scholar] [CrossRef] [PubMed]
- Lee, Y.-M.; Kim, S.-A.; Lee, I.-K.; Kim, J.-G.; Park, K.-G.; Jeong, J.-Y.; Jeon, J.-H.; Shin, J.-Y.; Lee, D.-H. Effect of a brown rice based vegan diet and conventional diabetic diet on glycemic control of patients with type 2 diabetes: A 12-week randomized clinical trial. PLoS ONE 2016, 11, e0155918. [Google Scholar] [CrossRef] [PubMed]
- Macknin, M.; Kong, T.; Weier, A.; Worley, S.; Tang, A.S.; Alkhouri, N.; Golubic, M. Plant-based, no-added-fat or American Heart Association diets: Impact on cardiovascular risk in obese children with hypercholesterolemia and their parents. J. Pediatrics 2015, 166, 953–959.e953. [Google Scholar] [CrossRef]
- Mishra, S.; Xu, J.; Agarwal, U.; Gonzales, J.; Levin, S.; Barnard, N.D. A multicenter randomized controlled trial of a plant-based nutrition program to reduce body weight and cardiovascular risk in the corporate setting: The GEICO study. Eur. J. Clin. Nutr. 2013, 67, 718–724. [Google Scholar] [CrossRef]
- Nicholson, A.S.; Sklar, M.; Barnard, N.D.; Gore, S.; Sullivan, R.; Browning, S. Toward improved management of NIDDM: A randomized, controlled, pilot intervention using a lowfat, vegetarian diet. Prev. Med. 1999, 29, 87–91. [Google Scholar] [CrossRef]
- Prescott, S.L.; Jenner, D.A.; Beilin, L.J.; Margetts, B.M.; Vandongen, R. A randomized controlled trial of the effect on blood pressure of dietary non-meat protein versus meat protein in normotensive omnivores. Clin. Sci. 1988, 74, 665–672. [Google Scholar] [CrossRef]
- Ramal, E.; Champlin, A.; Bahjri, K. Impact of a plant-based diet and support on mitigating type 2 diabetes mellitus in Latinos living in medically underserved areas. Am. J. Health Promot. 2018, 32, 753–762. [Google Scholar] [CrossRef]
- Rouse, I.L.; Beilin, L.J.; Mahoney, D.P.; Margetts, B.M.; Armstrong, B.K.; Record, S.J.; Vandongen, R.; Barden, A. Nutrient intake, blood pressure, serum and urinary prostaglandins and serum thromboxane B2 in a controlled trial with a lacto-ovo-vegetarian diet. J. Hypertens. 1986, 4, 241–250. [Google Scholar] [CrossRef]
- Sciarrone, S.E.; Strahan, M.T.; Beilin, L.J.; Burke, V.; Rogers, P.; Rouse, I.L. Biochemical and neurohormonal responses to the introduction of a lacto-ovovegetarian diet. J. Hypertens. 1993, 11, 849–860. [Google Scholar] [CrossRef]
- Toobert, D.J.; Glasgow, R.E.; Radcliffe, J.L. Physiologic and related behavioral outcomes from the Women’s Lifestyle Heart Trial. Ann. Behav. Med. 2000, 22, 1–9. [Google Scholar] [CrossRef]
- Wright, N.; Wilson, L.; Smith, M.; Duncan, B.; McHugh, P. The BROAD study: A randomised controlled trial using a whole food plant-based diet in the community for obesity, ischaemic heart disease or diabetes. Nutr. Diabetes 2017, 7, e256. [Google Scholar] [CrossRef] [PubMed]
- Rouse, I.L.; Armstrong, B.K.; Beilin, L.J. The relationship of blood pressure to diet and lifestyle in two religious populations. J. Hypertens. 1983, 1, 65–71. [Google Scholar] [CrossRef] [PubMed]
- House, F.; Seale, S.A.; Newman, I.B. The 30-Day Diabetes Miracle: Lifestyle Center of America’s Complete Program to Stop Diabetes, Restore Health, and Build Natural Vitality; Penguin: London, UK, 2008. [Google Scholar]
- Ornish, D. Dr. Dean Ornish’s Program for Reversing Heart Disease: The Only System Scientifically Proven to Reverse Heart Disease without Drugs or Surgery; Ivy Books: New York, NY, USA, 2010. [Google Scholar]
- McDougall, J.; Thomas, L.E.; McDougall, C.; Moloney, G.; Saul, B.; Finnell, J.S.; Richardson, K.; Petersen, K.M. Effects of 7 days on an ad libitum low-fat vegan diet: The McDougall Program cohort. Nutr. J. 2014, 13, 99. [Google Scholar] [CrossRef]
- Hardy, S.T.; Loehr, L.R.; Butler, K.R.; Chakladar, S.; Chang, P.P.; Folsom, A.R.; Heiss, G.; MacLehose, R.F.; Matsushita, K.; Avery, C.L. Reducing the blood pressure–related burden of cardiovascular disease: Impact of achievable improvements in blood pressure prevention and control. J. Am. Heart Assoc. 2015, 4, e002276. [Google Scholar] [CrossRef]
- Wang, F.; Zheng, J.; Yang, B.; Jiang, J.; Fu, Y.; Li, D. Effects of vegetarian diets on blood lipids: A systematic review and meta-analysis of randomized controlled trials. J. Am. Heart Assoc. 2015, 4, e002408. [Google Scholar] [CrossRef] [PubMed]
- Li, D. Chemistry behind vegetarianism. J. Agric. Food Chem. 2011, 59, 777–784. [Google Scholar] [CrossRef] [PubMed]
- Ferrara, L.; Guida, L.; Iannuzzi, R.; Celentano, A.; Lionello, F. Serum cholesterol affects blood pressure regulation. J. Hum. Hypertens. 2002, 16, 337–343. [Google Scholar] [CrossRef]
- Tamadon, M.R.; Baradaran, A.; Rafieian-Kopaei, M. Antioxidant and kidney protection; differential impacts of single and whole natural antioxidants. J. Ren. Inj. Prev. 2014, 3, 41–42. [Google Scholar]
- Ndanuko, R.N.; Tapsell, L.C.; Charlton, K.E.; Neale, E.P.; Batterham, M.J. Dietary patterns and blood pressure in adults: A systematic review and meta-analysis of randomized controlled trials. Adv. Nutr. 2016, 7, 76–89. [Google Scholar] [CrossRef] [PubMed]
- Schwingshackl, L.; Schwedhelm, C.; Hoffmann, G.; Knüppel, S.; Iqbal, K.; Andriolo, V.; Bechthold, A.; Schlesinger, S.; Boeing, H. Food groups and risk of hypertension: A systematic review and dose-response meta-analysis of prospective studies. Adv. Nutr. 2017, 8, 793–803. [Google Scholar] [CrossRef] [PubMed]
- Wang, L.; Manson, J.E.; Buring, J.E.; Sesso, H.D. Meat intake and the risk of hypertension in middle-aged and older women. J. Hypertens. 2008, 26, 215–222. [Google Scholar] [CrossRef] [PubMed]
- Wu, P.-Y.; Yang, S.-H.; Wong, T.-C.; Chen, T.-W.; Chen, H.-H.; Chen, T.-H.; Chen, Y.-T. Association of processed meat intake with hypertension risk in hemodialysis patients: A cross-sectional study. PLoS ONE 2015, 10, e0141917. [Google Scholar] [CrossRef]
- Huang, T.; Yang, B.; Zheng, J.; Li, G.; Wahlqvist, M.L.; Li, D. Cardiovascular disease mortality and cancer incidence in vegetarians: A meta-analysis and systematic review. Ann. Nutr. Metab. 2012, 60, 233–240. [Google Scholar] [CrossRef]
- Pettersen, B.J.; Anousheh, R.; Fan, J.; Jaceldo-Siegl, K.; Fraser, G.E. Vegetarian diets and blood pressure among white subjects: Results from the Adventist Health Study-2 (AHS-2). Public Health Nutr. 2012, 15, 1909–1916. [Google Scholar] [CrossRef]
- Dauchet, L.; Kesse-Guyot, E.; Czernichow, S.; Bertrais, S.; Estaquio, C.; Péneau, S.; Vergnaud, A.-C.; Chat-Yung, S.; Castetbon, K.; Deschamps, V. Dietary patterns and blood pressure change over 5-y follow-up in the SU. VI. MAX cohort. Am. J. Clin. Nutr. 2007, 85, 1650–1656. [Google Scholar] [CrossRef]
- Snijder, M.B.; Van Dam, R.M.; Stehouwer, C.D.; Hiddink, G.J.; Heine, R.J.; Dekker, J.M. A prospective study of dairy consumption in relation to changes in metabolic risk factors: The Hoorn Study. Obesity 2008, 16, 706–709. [Google Scholar] [CrossRef]
- Samara, A.; Herbeth, B.; Ndiaye, N.C.; Fumeron, F.; Billod, S.; Siest, G.; Visvikis-Siest, S. Dairy product consumption, calcium intakes, and metabolic syndrome–related factors over 5 years in the STANISLAS study. Nutrition 2013, 29, 519–524. [Google Scholar] [CrossRef]
- Ding, M.; Li, J.; Qi, L.; Ellervik, C.; Zhang, X.; Manson, J.E.; Stampfer, M.; Chavarro, J.E.; Rexrode, K.M.; Kraft, P. Associations of dairy intake with risk of mortality in women and men: Three prospective cohort studies. BMJ 2019, 367, l6204. [Google Scholar] [CrossRef]
- Bhattacharya, P.; Samal, A.; Majumdar, J.; Santra, S. Arsenic contamination in rice, wheat, pulses, and vegetables: A study in an arsenic affected area of West Bengal, India. Water Air Soil Pollut. 2010, 213, 3–13. [Google Scholar] [CrossRef]
- Khan, Z.I.; Nisar, A.; Ugulu, I.; Ahmad, K.; Wajid, K.; Bashir, H.; Dogan, Y. Determination of cadmium concentrations of vegetables grown in soil irrigated with wastewater: Evaluation of health risk to the public. Egypt. J. Bot. 2019, 18, 753–762. [Google Scholar] [CrossRef]
- Egharevba, I.; Aluyor, E.; Ossai, J.; Oiwoh, O. Assessment of Heavy Metals Contamination in Vegetables and Fruits Sold in Benin City, Edo State, Nigeria. Nig. Res. J. Eng. Environ. Sci. 2017, 2, 161–168. [Google Scholar]
- Edogbo, B.; Okolocha, E.; Maikai, B.; Aluwong, T.; Uchendu, C. Risk Analysis of Heavy Metal Contamination In Soil, Vegetables And Fish Around Challawa Area in Kano State, Nigeria. Sci. Afr. 2020, 23, e00281. [Google Scholar] [CrossRef]
- Houston, M.C. The role of mercury and cadmium heavy metals in vascular disease, hypertension, coronary heart disease, and myocardial infarction. Altern. Ther. Health Med. 2007, 13, S128–S133. [Google Scholar] [PubMed]
- Saltman, P. Trace elements and blood pressure. Ann. Intern. Med. 1983, 98, 823–827. [Google Scholar] [CrossRef]


| First Author (Vegetarian vs. Control) | Year | Area | Age, Mean ± SD (Range) | Gender, n (%) | Medication (%) | Baseline BMI, Mean ± SD (Range) | Energy Intake Difference † | Weight Difference † | Diabetes | Vegetarian/Vegan | Control Group | Trial Duration | ||||
|---|---|---|---|---|---|---|---|---|---|---|---|---|---|---|---|---|
| Vegan | Conventional Diet | Vegan | Conventional Diet | Vegan | Conventional Diet | Vegan | Conventional Diet | |||||||||
| Barnard et al., 2009 (Low-fat vegan diet vs. conventional diabetes diet) | 2013 | USA | 56.7 ± 9.8 (35–82) | 54.6 ± 10.2 (27–80) | Male, 22 (45); Female, 27 (55) | Male, 17 (34); Female, 33 (66) | DM (78); HPT (76); LIPID (54) | DM (69); HPT (63); LIPID (55) | N/A | N/A | 0.90 | 0.25 | With Diabetes | Vegan | meat diet | 74 weeks |
| Barnard et al., 2017 (Low-fat vegan diet vs. portion-controlled eating plan) | 2017 | USA | 61 (41–79) | 61 (30–75) | Male, 8 (38); Female, 13 (62) | Male, 13 (54); Female, 11 (46) | N/A | N/A | 34.9 ± 1.5 | 33.0 ± 1.3 | 0.46 | 0.10 | With Diabetes | Vegan | Meat diet | 20 weeks |
| Bloomer et al., 2015 (Traditional Daniel fast vs. Modified Daniel fast) | 2015 | USA | 33 ± 2 years (18–67 years) | Male, 6 (17.1); Female, 29 (82.9) | N/A | N/A | 26.2 ± 1.3 (19–45) | 25.6 ± 1.4 (19–45) | 0.04 | >0.05 | Without Diabetes | Vegan | Meat diet | 3 weeks | ||
| Ferdowsian et al., 2010 (low-fat vegan diet vs. control diet) | 2010 | USA | 44.4 (21–65) | Male, 20 (17.7); Female, 93 (82.3) | N/A | N/A | N/A | N/A | 0.017 | <0.0001 | With Diabetes | Vegan | Meat diet | 22 weeks | ||
| Hunt et al., 1998 (Lacto-ovo-vegetarian vs. non-vegetarian diet) | 1998 | USA | 33 ± 7 (20–42) | Female, 21 women (100) | No, with the exception that 9 used hormonal contraceptives | 23.5 ± 2.8 (range: 19.0–29.0) | N/A | N/A | Without Diabetes | Lacto-ovo-vegetarian | Meat diet | 8 weeks | ||||
| Lee et al., 2016 (Brown rice vegan diet vs. conventional diabetic diet) | 2016 | South Korea | 57.5 ± 7.7 (32–70) | 58.3 ± 7.0 (40–69) | Male, 6 (13.0); Female, 40 (87.0) | Male, 12 (25.5); Female, 35 (74.5) | DM (73.9); HPT (39.1); LIPID (50) | DM (76.6); HPT (46.8); LIPID (55.3) | 23.9 ± 3.4 | 23.1 ± 2.4 | 0.042 | N/A | With Diabetes | Vegan | Meat diet | 12 weeks |
| Macknin et al., 2015 (Plant-based low fat diet vs. American Heart Association diets) | 2015 | USA | 15.0 (9.0–18.0) | 15.0 (9.0–18.0) | Male, 5 (36); Female, 9 (64) | Male, 5 (36); Female, 9 (64) | N/A | N/A | Overweight, 4 (29%); Obese, 10 (71%) | Overweight, 2(14%); Obese, 12 (86%) | N/A | N/A | Without Diabetes | Vegan | Meat diet | 4 weeks |
| Mishra et al., 2013 (low-fat vegan diet vs. control diet) | 2013 | USA | 44.3 ± 15.3 | 46.1 ± 13.6 | Male, 32 (23); Female, 110 (77) | Male, 18 (12); Female, 132 (88) | N/A | N/A | 34.7 ± 0.6 | 35.3 ± 0.7 | 0.09 | <0.001 | With Diabetes | Vegan | Meat diet | 18 weeks |
| Nicholson et al., 1999 (low-fat Vegan diet vs. control diet) | 1999 | USA | Mean 54.3 | Male, (54.5); Female (45.5) | 81.80 | N/A | N/A | N/A | With Diabetes | Vegan | Meat diet | 12 weeks | ||||
| Prescott et al., 1987 (Lacto-ovo-vegetarian vs. non-vegetarian diet) | 1987 | Australia | 36.4 ± 2.4 | 34.0 ± 2.1 | Male, 9; Female, 16 | Male, 11; Female, 14 | N/A | N/A | 25.3 ± 0.9 | 25.5 ± 1.0 | N/A | N/A | Without Diabetes | Lacto-ovo-vegetarian | Meat diet | 12 weeks |
| Ramal et al., 2017 (High-fiber low-fat plant based diet vs. control diet) | 2017 | USA | 53.35 ± 6.74 | 52.93 ± 13.11 | Male, 4 (23.5); Female, 13 (76.5) | Male, 3 (20.0); Female, 12 (80.0) | 15 (88.2) | 13 (86.7) | 31.81 ± 1.01 | 30.84 ± 1.08 | N/A | N/A | With Diabetes | Vegan | Meat diet | 24 weeks |
| Rouse et al., 1986 (Lacto-ovo-vegetarian vs. non-vegetarian diet) | 1986 | Australia | Mean 40.1 | Male (50); Female (50) | no | 23.7 | N/A | N/A | Without Diabetes | Lacto-ovo-vegetarian | Meat diet | 14 weeks | ||||
| Sciarrone et al., 1993 (Lacto-ovo-vegetarian vs. non-vegetarian diet) | 1993 | Australia | Mean 41 | Male (100) | no | 25.3 | N/A | N/A | Without Diabetes | Lacto-ovo-vegetarian | Meat diet | 6 weeks | ||||
| Toobert et al., 2000 (Prime time diet vs. Usual care diet) | 2000 | USA | 64 ± 10 | 63 ± 11 | Female, 25 (100) | ERT (35.7); HPT (71.4); LIPID (28.6) | ERT (45.5); HPT (81.8); LIPID (45.5) | 32 ± 4.2 | 32 ± 5.5 | N/A | N/A | Without Diabetes | Lacto-ovo-vegetarian | Meat diet | 24 months | |
| Wright et al., 2017 (Low-fat plant-based diet vs. control diet) | 2017 | New Zealand | 56 ± 9.9 | 56 ± 9.5 | Male, 11 (33); Female, 22 (67) | Male, 15 (47); Female, 17 (53) | N/A | N/A | 34.5 ± 1.6 | 34.2 ± 2.3 | N/A | N/A | With Diabetes | Vegan | Meat diet | 48 weeks |
| Variables | N | Weighted Mean Difference | 95% CI | I2 | p-Value | Forest Plot | |
|---|---|---|---|---|---|---|---|
| Systolic blood pressure | |||||||
| Overall systolic blood pressure (inclusive of children) | 16 | −2.655 | (−3.758, −1.553) | 98.32 | <0.001 | Figure S1 | |
| Overall systolic blood pressure (exclusive of children) | 15 | −2.509 | (−3.630, −1.388) | 98.42 | <0.001 | Figure S2 | |
| Diet subgroup | Vegan diet | 11 | −3.118 | (−4.540, −1.696) | 96.99 | <0.001 | Figure S3 |
| Lacto-ovo-vegetarian diet | 5 | −1.752 | (−5.382, 1.878) | 72.69 | 0.005 | ||
| Diabetes subgroup | Participants with diabetes | 8 | −1.625 | (−3.106, −0.144) | 96.84 | <0.001 | Figure S4 |
| Participants without diabetes | 8 | −4.083 | (−7.684, −0.482) | 96.90 | <0.001 | ||
| Country | USA | 11 | −2.803 | (−4.037, −1.569) | 98.85 | <0.001 | Figure S5 |
| Australia | 3 | −2.075 | (−9.859, 5.709) | 83.24 | 0.003 | ||
| New Zealand | 1 | −4.000 | (−6.352, −1.648) | N.A | N.A | ||
| South Korea | 1 | 1.000 | (−3.306, 5.306) | N.A | N.A | ||
| Diastolic blood pressure | |||||||
| Overall diastolic blood pressure (inclusive of children) | 16 | −1.687 | (−2.968, −0.407) | 99.35 | <0.001 | Figure S6 | |
| Overall diastolic blood pressure (exclusive of children) | 15 | −1.654 | (−2.958, −0.351) | 99.39 | <0.001 | Figure S7 | |
| Diet subgroup | Vegan diet | 11 | −1.920 | (−3.180, −0.661) | 97.80 | <0.001 | Figure S8 |
| Lacto-ovo-vegetarian diet | 5 | −0.000 | (0.000, 0.000) | 0.0 | 0.432 | ||
| Diabetes subgroup | Participants with diabetes | 8 | −1.838 | (−3.304, −0.373) | 98.46 | <0.001 | Figure S9 |
| Participants without diabetes | 8 | −1.242 | (−2.551, 0.066) | 57.48 | 0.021 | ||
| Country | USA | 11 | −2.179 | (−3.678, −0.680) | 99.57 | <0.001 | Figure S10 |
| Australia | 3 | −0.302 | (−2.912, 2.308) | 0.0 | 0.468 | ||
| New Zealand | 1 | −1.000 | (−2.176, 0.176) | N.A | N.A | ||
| South Korea | 1 | 1.100 | (−1.501, 3.701) | N.A | N.A | ||
© 2020 by the authors. Licensee MDPI, Basel, Switzerland. This article is an open access article distributed under the terms and conditions of the Creative Commons Attribution (CC BY) license (http://creativecommons.org/licenses/by/4.0/).
Share and Cite
Lee, K.W.; Loh, H.C.; Ching, S.M.; Devaraj, N.K.; Hoo, F.K. Effects of Vegetarian Diets on Blood Pressure Lowering: A Systematic Review with Meta-Analysis and Trial Sequential Analysis. Nutrients 2020, 12, 1604. https://doi.org/10.3390/nu12061604
Lee KW, Loh HC, Ching SM, Devaraj NK, Hoo FK. Effects of Vegetarian Diets on Blood Pressure Lowering: A Systematic Review with Meta-Analysis and Trial Sequential Analysis. Nutrients. 2020; 12(6):1604. https://doi.org/10.3390/nu12061604
Chicago/Turabian StyleLee, Kai Wei, Hong Chuan Loh, Siew Mooi Ching, Navin Kumar Devaraj, and Fan Kee Hoo. 2020. "Effects of Vegetarian Diets on Blood Pressure Lowering: A Systematic Review with Meta-Analysis and Trial Sequential Analysis" Nutrients 12, no. 6: 1604. https://doi.org/10.3390/nu12061604
APA StyleLee, K. W., Loh, H. C., Ching, S. M., Devaraj, N. K., & Hoo, F. K. (2020). Effects of Vegetarian Diets on Blood Pressure Lowering: A Systematic Review with Meta-Analysis and Trial Sequential Analysis. Nutrients, 12(6), 1604. https://doi.org/10.3390/nu12061604