Article

Surface-Dependent Isotopic Adsorption of CO on α-Al2O3: Role of Weak Interactions and Zero-Point Energy

by
Qun Yang
1,2,3,
Xiyue Cheng
1,3,4,*,
Qian Xu
1,2,3 and
Shuiquan Deng
1,3,4,*
1
Key Laboratory of Optoelectronic Materials Chemistry and Physics, Fujian Institute of Research on the Stricture of Matter, Chinese Academy of Sciences, Fuzhou 350002, China
2
College of Chemistry and Materials Science, Fujian Normal University, Fuzhou 350007, China
3
Fujian College, University of Chinese Academy of Sciences, Beijing 100049, China
4
State Key Laboratory of Structural Chemistry, Fujian Institute of Research on the Structure of Matter, Chinese Academy of Sciences, Fuzhou 350002, China
*
Authors to whom correspondence should be addressed.
Molecules 2025, 30(9), 2067; https://doi.org/10.3390/molecules30092067
Submission received: 18 April 2025 / Revised: 3 May 2025 / Accepted: 5 May 2025 / Published: 6 May 2025

Abstract

:
Carbon isotopes, particularly 13C, are critical for applications in food authentication, biomedical diagnostics, and metabolic research; however, their efficient separation remains challenging due to their low natural abundance. This study investigates the adsorption behavior of 12CO and 13CO on various low-index α -Al2O3 surfaces as a strategy for isotope separation. Density functional theory (DFT) calculations with D3 (BJ) dispersion corrections were employed to optimize surface models for five representative α -Al2O3 facets. Nine adsorption configurations were systematically evaluated by optimizing geometric structures, computing adsorption enthalpies with zero-point energy corrections, and performing Bader charge and charge density difference analyses to elucidate interfacial interactions. The results reveal that CO preferentially adsorbs in a vertical configuration via its carbon end at Al sites, with the (0001) surface exhibiting the lowest surface energy and most favorable adsorption characteristics. Furthermore, we found that facets with lower surface energy not only facilitate stronger CO adsorption but also demonstrate pronounced adsorption enthalpy differences between 12CO and 13CO, driven by vibrational zero-point energy disparities. These findings highlight the potential of low adsorption enthalpy surfaces, particularly (0001), ( 01 1 ¯ 2 ), and ( 11 2 ¯ 0 ), for enhancing isotope separation efficiency, providing valuable insights for the design of advanced separation materials.

Graphical Abstract

1. Introduction

Carbon is a fundamental element in natural organic matter, existing primarily as two stable isotopes, 12C and 13C, with 14C being a radioactive isotope. Among them, 13C has attracted significant interest due to its non-radioactivity, chemical stability, and biological safety, facilitating its widespread application in diverse fields ranging from food authentication and biomedical diagnostics to metabolic research [1,2,3]. In clinical settings, 13C-labeled compounds serve as tracers in nuclear magnetic resonance (NMR) spectroscopy for real-time monitoring of metabolic pathways [4]. A prominent example is the 13C–urea breath test, a non-invasive diagnostic tool for detecting Helicobacter pylori infections, which relies on analyzing isotopic enrichment in exhaled CO2 [5]. In the agri-food sector, distinct δ 13C signatures between C4 plants and C3 plants are leveraged for origin verification and fraud detection in supply chains [6]. Despite its growing demand, the commercial-scale separation of 13C remains challenging due to its low natural abundance at 1.1%. Traditional isotope enrichment methods, such as cryogenic distillation, are energy-intensive, capital-demanding, and limited in throughput. These drawbacks underscore the critical need for more efficient, cost-effective, and scalable separation techniques to address the increasing industrial and research demands for high-purity 13C.
Recent advancements have highlighted the potential of porous materials in isotope separation, leveraging mechanisms like kinetic quantum sieving (KQS) [7] and chemical affinity quantum sieving (CAQS) [8]. Experimental investigations in the field of hydrogen/deuterium (H/D) isotope separation have confirmed the effectiveness of porous materials as selective adsorbents. The KQS effect occurs at cryogenic temperatures (20–50 K) when pore sizes approach the molecular de Broglie wavelength, leading to quantum energy barriers that favor diffusion of heavier isotopes such as D2 over H2 due to lower zero-point energy [7]. Conversely, the CAQS effect operates without ultra-low temperatures, relying on differences in zero-point energy and binding affinity, with heavier isotopes preferentially adsorbing at stronger sites [8]. For instance, through the KQS effect, researchers have obtained an optimal separation factor of 13.6 for the H/D isotopes at 40 K [9], significantly surpassing the factor of 1.5 achieved by cryogenic distillation at 24 K [10]. In 2014, Hu et al. [11] investigated proton conduction through graphene, hBN, and MoS2, uncovering the proton transmission barriers. They found that decorating graphene films with catalytic metal nanoparticles enhances proton transport performance, resulting in high proton selectivity. In 2017, Kim et al. [12] reported that incorporating imidazole molecules into the open metal site channels of MOF-74 allowed the synergistic effects of KQS and CAQS to maximize separation performance, achieving a separation factor as high as 26 for H2 and D2 at 77 K. In 2022, Su et al. [13] designed a porous coordination polymer with dynamically tunable gates, achieving highly efficient separation of water isotope isomers (H2O/HDO/D2O) at room temperature with a water separation factor as high as 210.
For heavier isotopes, in 2021, Ujjain et al. [14] demonstrated that nanoporous carbide-derived carbon (CDC) exhibits extremely high adsorption selectivity for 18O2, with selectivity increasing as temperature decreases and being significantly affected by pore geometry; their adsorption–separation device based on CDC achieved a S(18O2/16O2) of approximately 60 ± 15 at 112 K and, similarly, a S(13C/12C) of 56 ± 6 for 13CH4 separation. Theoretically, in 2018, Tian et al. [15] explored the potential of MOF materials for carbon isotope separation through adsorption or membrane separation. Using classical density functional theory (cDFT) methods, they calculated the gas diffusion rates and isotope selectivities of methane pairs with different 12CH4/13CH4 carbon isotopes, demonstrating that MOFs are capable of separating carbon isotopes. Subsequent studies by Wang et al. [16] validated these results by screening 12,478 MOF materials, identifing nanoporous membranes with high selectivity for 12CH4/13CH4 separation. These experimental and theoretical studies prove the potential of using porous materials for the separation of carbon isotopes.
Beyond conventional porous materials such as molecular sieves, carbon-based materials, and MOFs, alumina as a porous metal oxide also exhibits a porous structure and strong polar adsorption capability [17]. With its nanoscale particle size, high specific surface area, and internal pore structure conducive to adsorbing isotope molecules, porous Al2O3 emerges as a promising candidate for isotope separation applications, which can potentially overcome the limitations of traditional techniques [18]. The coexistence of Lewis acid (Al3+) and Lewis base (O2−) sites on its surface provides diverse adsorption site options for polar molecules, such as CO and NOx [19]. Moreover, Al2O3 has demonstrated excellent selectivity and stability in the adsorption of inert gases, further underscoring its potential for gas separation technologies [20]. Its adsorption behavior can be precisely controlled through the modulation of surface exposure and atomic reconstruction, thereby substantially enhancing its gas adsorption and catalytic performance [21,22,23,24]. Recent computational studies have validated the potential of α -Al2O3 in gas separation applications. For instance, Kojabad et al. [25] developed α -Al2O3 composite membranes that exhibit excellent CO2 selectivity over N2 and CH4 under both dry and humid conditions, while maintaining high gas permeance. Consistently, metal-functionalized α -Al2O3 surfaces such as Ni-decorated ( 0001 ) facets demonstrate a preferential adsorption of CO2 and CO from complex gas mixtures containing CO2, CO, CH4, and H2, thereby enabling the selective purification of CH4 and H2 due to the weaker interactions of the latter gases with the surface [26]. Hass et al. [27] also demonstrated that α -Al2O3 ( 0001 ) readily dissociates water through surface-mediated pathways, even without defects, confirming its strong interaction with polar adsorbates under varying surface conditions. In terms of CO adsorption, extensive theoretical investigations have identified stable adsorption configurations on various α -Al2O3 single-crystal surfaces. Casarin et al. [28] reported that CO chemisorbs most stably atop Lewis acid (Al3+) sites in a perpendicular geometry on α -Al2O3 ( 0001 ), with a computed C-O stretching frequency ( ν c o ) of 2158 cm−1, indicating a 44 cm−1 blue shift, in qualitative agreement with IR data on CO adsorbed on alumina powders. Additionally, Rohmann et al. [29] investigated CO adsorption on α -Al2O3 ( 0001 ) via DFT-GGA and infrared spectroscopy, demonstrating that the adsorption energy and C-O vibrational frequency vary with surface coverage due to adsorption-induced surface relaxation. Although α -Al2O3 low-index surfaces have been widely studied for gas adsorption, systematic investigations into isotope adsorption and separation remain unexplored. A fundamental understanding of the atomic- and electronic-scale mechanisms governing isotope separation on these surfaces is urgently needed.
In this study, we evaluate CO isotope separation on five low-index α -Al2O3 surfaces. A comprehensive investigation was conducted on the adsorption configurations, geometric parameters, and adsorption enthalpies of 12CO and 13CO molecules on the α -Al2O3 ( 0001 ) surface. A corrected adsorption enthalpy approach considering zero-point energy (ZPE) corrections was applied in the calculation of adsorption enthalpies. Among the nine configurations we examined, the most favorable involved vertical C-end adsorption atop an Al site. Bader charge analysis, charge density difference, and non-covalent interaction analyses revealed subtle yet noticeable charge transfer between CO and the surface. Comparative results across the five surfaces indicate that lower-energy facets—particularly ( 0001 ), ( 01 1 ¯ 2 ), and ( 11 2 ¯ 0 )—not only exhibit stronger CO binding but also show more distinct differences between 12CO and 13CO adsorption enthalpies, underscoring their promise for surface-engineered isotope separation.

2. Results and Discussion

2.1. Surface Energy of Al2O3 Surfaces
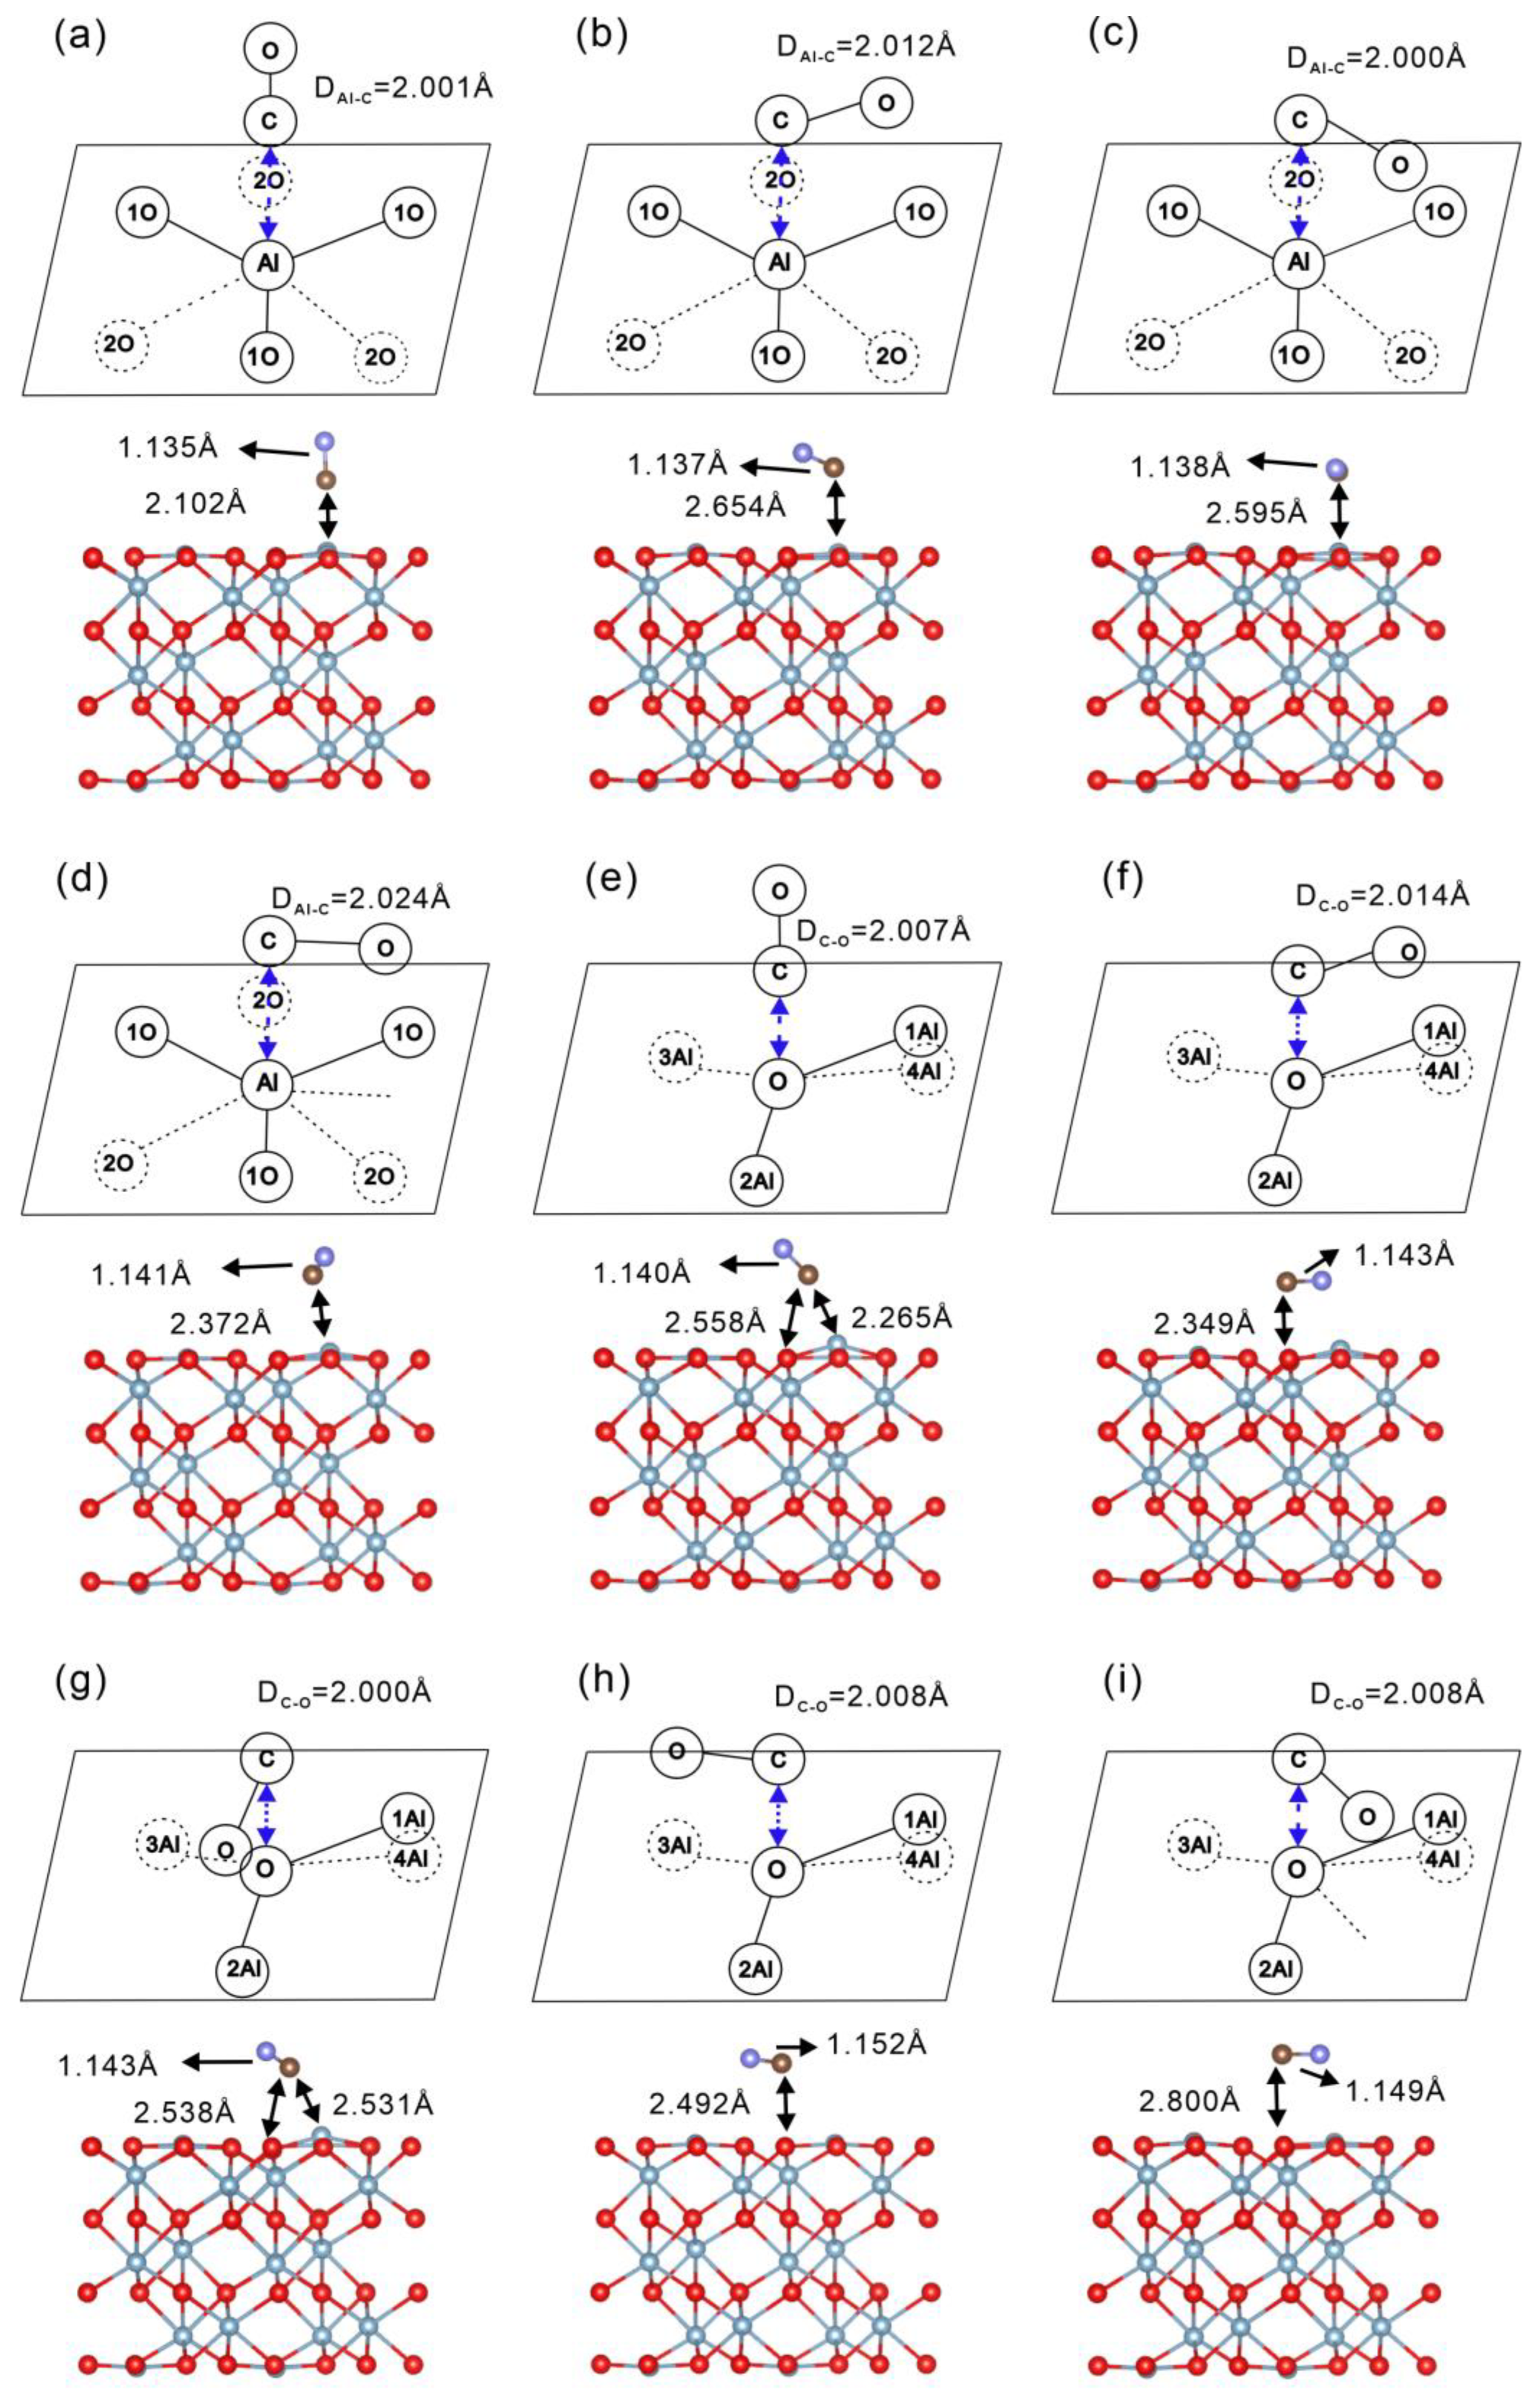
We primarily investigated the ( 0001 ), ( 11 2 ¯ 0 ), ( 01 1 ¯ 2 ), ( 10 1 ¯ 1 ), and ( 10 1 ¯ 0 ) surfaces of α -Al2O3 in this work. Although these surfaces can theoretically present a variety of configurations, our study assumes that all surfaces maintain stoichiometric balance and strictly adhere to the crystal symmetry, thereby precluding any surface reconstruction. Moreover, it is assumed that the unrelaxed surfaces are directly obtained by cleaving an ideal crystal along a single crystallographic plane [30]. In accordance with Tasker’s [31] rules, these surfaces are constructed with termination layers composed of repeating units that do not generate a net dipole moment. To construct a reliable model of an α -Al2O3 surface, we employed a layered geometric approach under periodic boundary conditions. Each supercell comprises multiple parallel slabs separated by a 20 Å vacuum layer along the c-axis. Each slab includes a sufficient number of repeating units—approximately 100 atoms per slab—to ensure convergence and computational stability. Surfaces models were generated from optimized bulk α -Al2O3 along the ( 0001 ), ( 11 2 ¯ 0 ), ( 01 1 ¯ 2 ), ( 10 1 ¯ 1 ), and ( 10 1 ¯ 0 ) planes. The specific stacking sequences were chosen based on the literature, as shown in Figure 1: For the ( 0001 ) surface, a repeating unit with the sequence M-3O-M··· (four layers) was employed [30,32,33]. We computed the surface energy E s u r f as a function of the number of Al-O-Al layers n in the slab (with n = 4–10) for (0001). The results are shown in Figure S1 of the Supplementary Materials. As one can see, E s u r f changes by less than 0.006 J/m2 upon increasing n from 4 to 10 and remains essentially constant for n ≥ 4. During the relaxation, we observe that the atomic displacement below the third layer is small, confirming that the displacements of the atoms in the deeper layers have a negligible effect on the overall result. Accordingly, we conclude that a four-layer (Al-O-Al) ( 0001 ) slab provides converged surface energies and captures all significant surface relaxations. For the ( 11 2 ¯ 0 ) surface, the sequence O-2O-4M-2O-O··· (7 layers) was adopted; for the ( 01 1 ¯ 2 ) surface, a 2O-2M-2O-2M-2O··· (7 layers) sequence was used; for the ( 10 1 ¯ 1 ) surface, the sequence O-M-O-M-O··· (10 layers) was employed; and for the ( 10 1 ¯ 0 ) surface, 2O-4M-2O-2O··· (8 layers) was constructed. These layer numbers were found to be sufficient to ensure convergence of the final results [34]. Significant differences in atomic displacements upon structural relaxation were observed among the five surfaces. As illustrated in Figure 1, the displacements of atomic layers parallel to the surface, with 3–4 layers of the repeating unit shown, reveal notable structural changes. For instance, on the ( 0001 ) surfaces, the Al atoms in the topmost repeating unit contract markedly inward, whereas on the ( 10 1 ¯ 0 ) surface, the Al atoms exhibit a pronounced inward movement, even penetrating the overlying O layer, demonstrating behavior consistent with that reported by Manassidis and Gillan [30]. In contrast, the atomic displacements on the other surfaces are considerably smaller.
The surface energies ( E s u r f ) for these low-index surfaces was calculated using the following equation:
E s u r f = ( E ( n ) n E b u l k ) / ( 2 A )
where A is the area of the surface, E b u l k is the energy per unit layer of the bulk, and E ( n ) is the total energy of a slab containing n unit layers. The computed surface energies are summarized in Table 1. The results reveal the following order for the E s u r f of the relaxed surfaces, ( 0001 ) < ( 11 2 ¯ 0 ) < ( 01 1 ¯ 2 ) < ( 10 1 ¯ 1 ) < ( 10 1 ¯ 0 ), which is in close agreement with the predictions reported by Sun [32]. Notably, the ( 0001 ) surface exhibits the lowest energy about 1.54 eV after relaxation, consistent with the findings of Sun et al. [32] and Mackrodt et al. [33] confirmed the validity of our computational methods. The α -Al2O3 ( 0001 ) surface exhibits the lowest energy among all facets investigated, thereby demonstrating its superior thermodynamic stability under equilibrium conditions. Consequently, the α -Al2O3 ( 0001 ) surface was selected for the subsequent adsorption site analysis.

2.2. Adsorption of 12CO and 13CO on α -Al2O3 ( 0001 ) Surface

Geometric optimization of the gas-phase CO molecule by applying a 10 × 10 × 10 Å3 unit cell and a C-O bond length of 1.143 Å, approximately 0.015 Å longer than the experimental values of 1.128 Å [38]. This slight overestimation is attributable to the adopted exchange–correlation functional, basis-set incompleteness and finite plane-wave cutoff energy. To determine the most stable adsorption structure of CO on α -Al2O3, we systematically examined a series of adsorption configurations on the ( 0001 ) surface. Nine representative configurations were constructed at the top sites of the α -Al2O3 ( 0001 ) surface. Specifically, for adsorption on Al sites, calculations were centered on site 3 (as indicated in Figure 1a), while for adsorption on O sites, site 5 was selected. Figure 2 presents both schematic representations of the pre-adsorption configurations and side views of the optimized post-adsorption geometries for nine distinct configurations. Configurations (a–d) correspond to CO adsorption at Al sites, with configuration (a) adopting a vertical orientation and configurations (b–d) corresponding to horizontal adsorption. Similarly, configurations (e–i) represent CO adsorption at O sites, where configuration (e) is vertically adsorbed and configurations (f–i) exhibit horizontal geometries. In addition to visualizing the adsorption geometries, the figure also includes key structural parameters, including the initial distance between the carbon atom and surface Al or O atoms, as well as the corresponding bond lengths and adsorption distances after structural optimization. Adsorption via the oxygen end of CO on either Al or O sites was not considered in this study, as previous studies [28] have indicated that such configurations result in weak interactions with the surface and are therefore energetically unfavorable.
Based on static DFT-D3 (BJ) calculations, the interaction energies ( E i n t ) were calculated by Equation (2):
E i n t = E A l 2 O 3 + C O E A l 2 O 3 E C O
where E A l 2 O 3 + C O is the energy of the optimized α -Al2O3/CO system, E A l 2 O 3 refers to the energy of pristine α -Al2O3 structure, and E C O is the energy of a free CO molecule in the gas phase. The adsorption enthalpy ( H a d s ) at a given temperature T and standard pressure was then obtained by incorporating the zero-point energy ( E Z P E ) correction, as shown in Equation (3):
H a d s T = E i n t + E Z P E + E T E ( T )
In Equation (3), E Z P E represents the zero-point energy difference between the optimized α -Al2O3/CO system and a single gas-phase CO molecule, and E T E ( T ) is the thermal energy contribution. The temperature-dependent vibrational enthalpy was initially calculated to obtain E T E T , but since its effect on the adsorption enthalpy was found to be minor at 0 K, it was not considered in the subsequent analysis. In the harmonic frequency analysis, the α -Al2O3 slab remained fixed at its optimized geometry and only the CO vibrational modes were considered. The zero-point energy is defined as follows [39]:
E Z P E = 1 2 i = 1 3 N 3 h v i
where h represents Planck’s constant, v i is the vibrational frequency of the i-th vibrational mode, and N denotes the number of atoms in the system. Under harmonic approximation, the vibrational frequencies are first computed, and E Z P E is subsequently evaluated as one-half of the summation of all the vibrational frequencies. In the present study, vibrational frequency calculations for the CO adsorption on alumina were carried out using VASP. The ZPE was then calculated from the vibrational frequencies according to Equation (4), with vibrational data extracted and processed using VASPKIT. [40]. The adsorption enthalpy H a d s T and zero-point energy difference E Z P E for 12CO and 13CO at various sites are calculated as shown in Table 2. Lower adsorption enthalpy values indicate stronger adsorption capabilities. Notably, configurations (a) and (e) exhibit the most negative adsorption enthalpies at −0.6035 eV and −0.5754 eV, indicating these configurations possess the highest adsorption stability, with configuration (a)’s vertical adsorption on an Al site being the most favorable. Analysis of the schematic adsorption sites suggests that configurations (a) and (e) correspond to scenarios in which the CO molecule is adsorbed with its carbon atom oriented vertically toward an Al site. Furthermore, by comparing the relaxed Al-C distance, configuration (a) exhibits the shortest distance among the nine models, with a value of 2.102 Å. This suggests that the Al-C interactions in the other models are weaker than that in configuration (a). Therefore, this vertical configuration in the (a) model demonstrates the highest stability among all tested sites, as indicated by its shorter C-Al distance and lower adsorption enthalpy. In contrast, other parallel adsorption configurations also exhibit relatively high adsorption enthalpy values, indicating that adsorption in a parallel orientation is generally less stable. It is consistent with reports indicating that the C end of CO, when perpendicular to the adsorption site, is more readily adsorbed [41,42,43]. Furthermore, from configurations (e) and (g), it is observed that when the C atom of CO is initially positioned above a surface O atom, the molecule tends to reorient during structural optimization and is eventually attracted toward a nearby Al site. This further confirms the strong preference of CO to bind through the carbon end to Al atoms rather than O atoms, driven by stronger electrostatic and orbital interactions. Based on these findings, the subsequent studies on adsorption behavior across other α -Al2O3 surfaces will utilize models in which the carbon ends of both 12CO and 13CO are oriented perpendicular to the Al adsorption site.

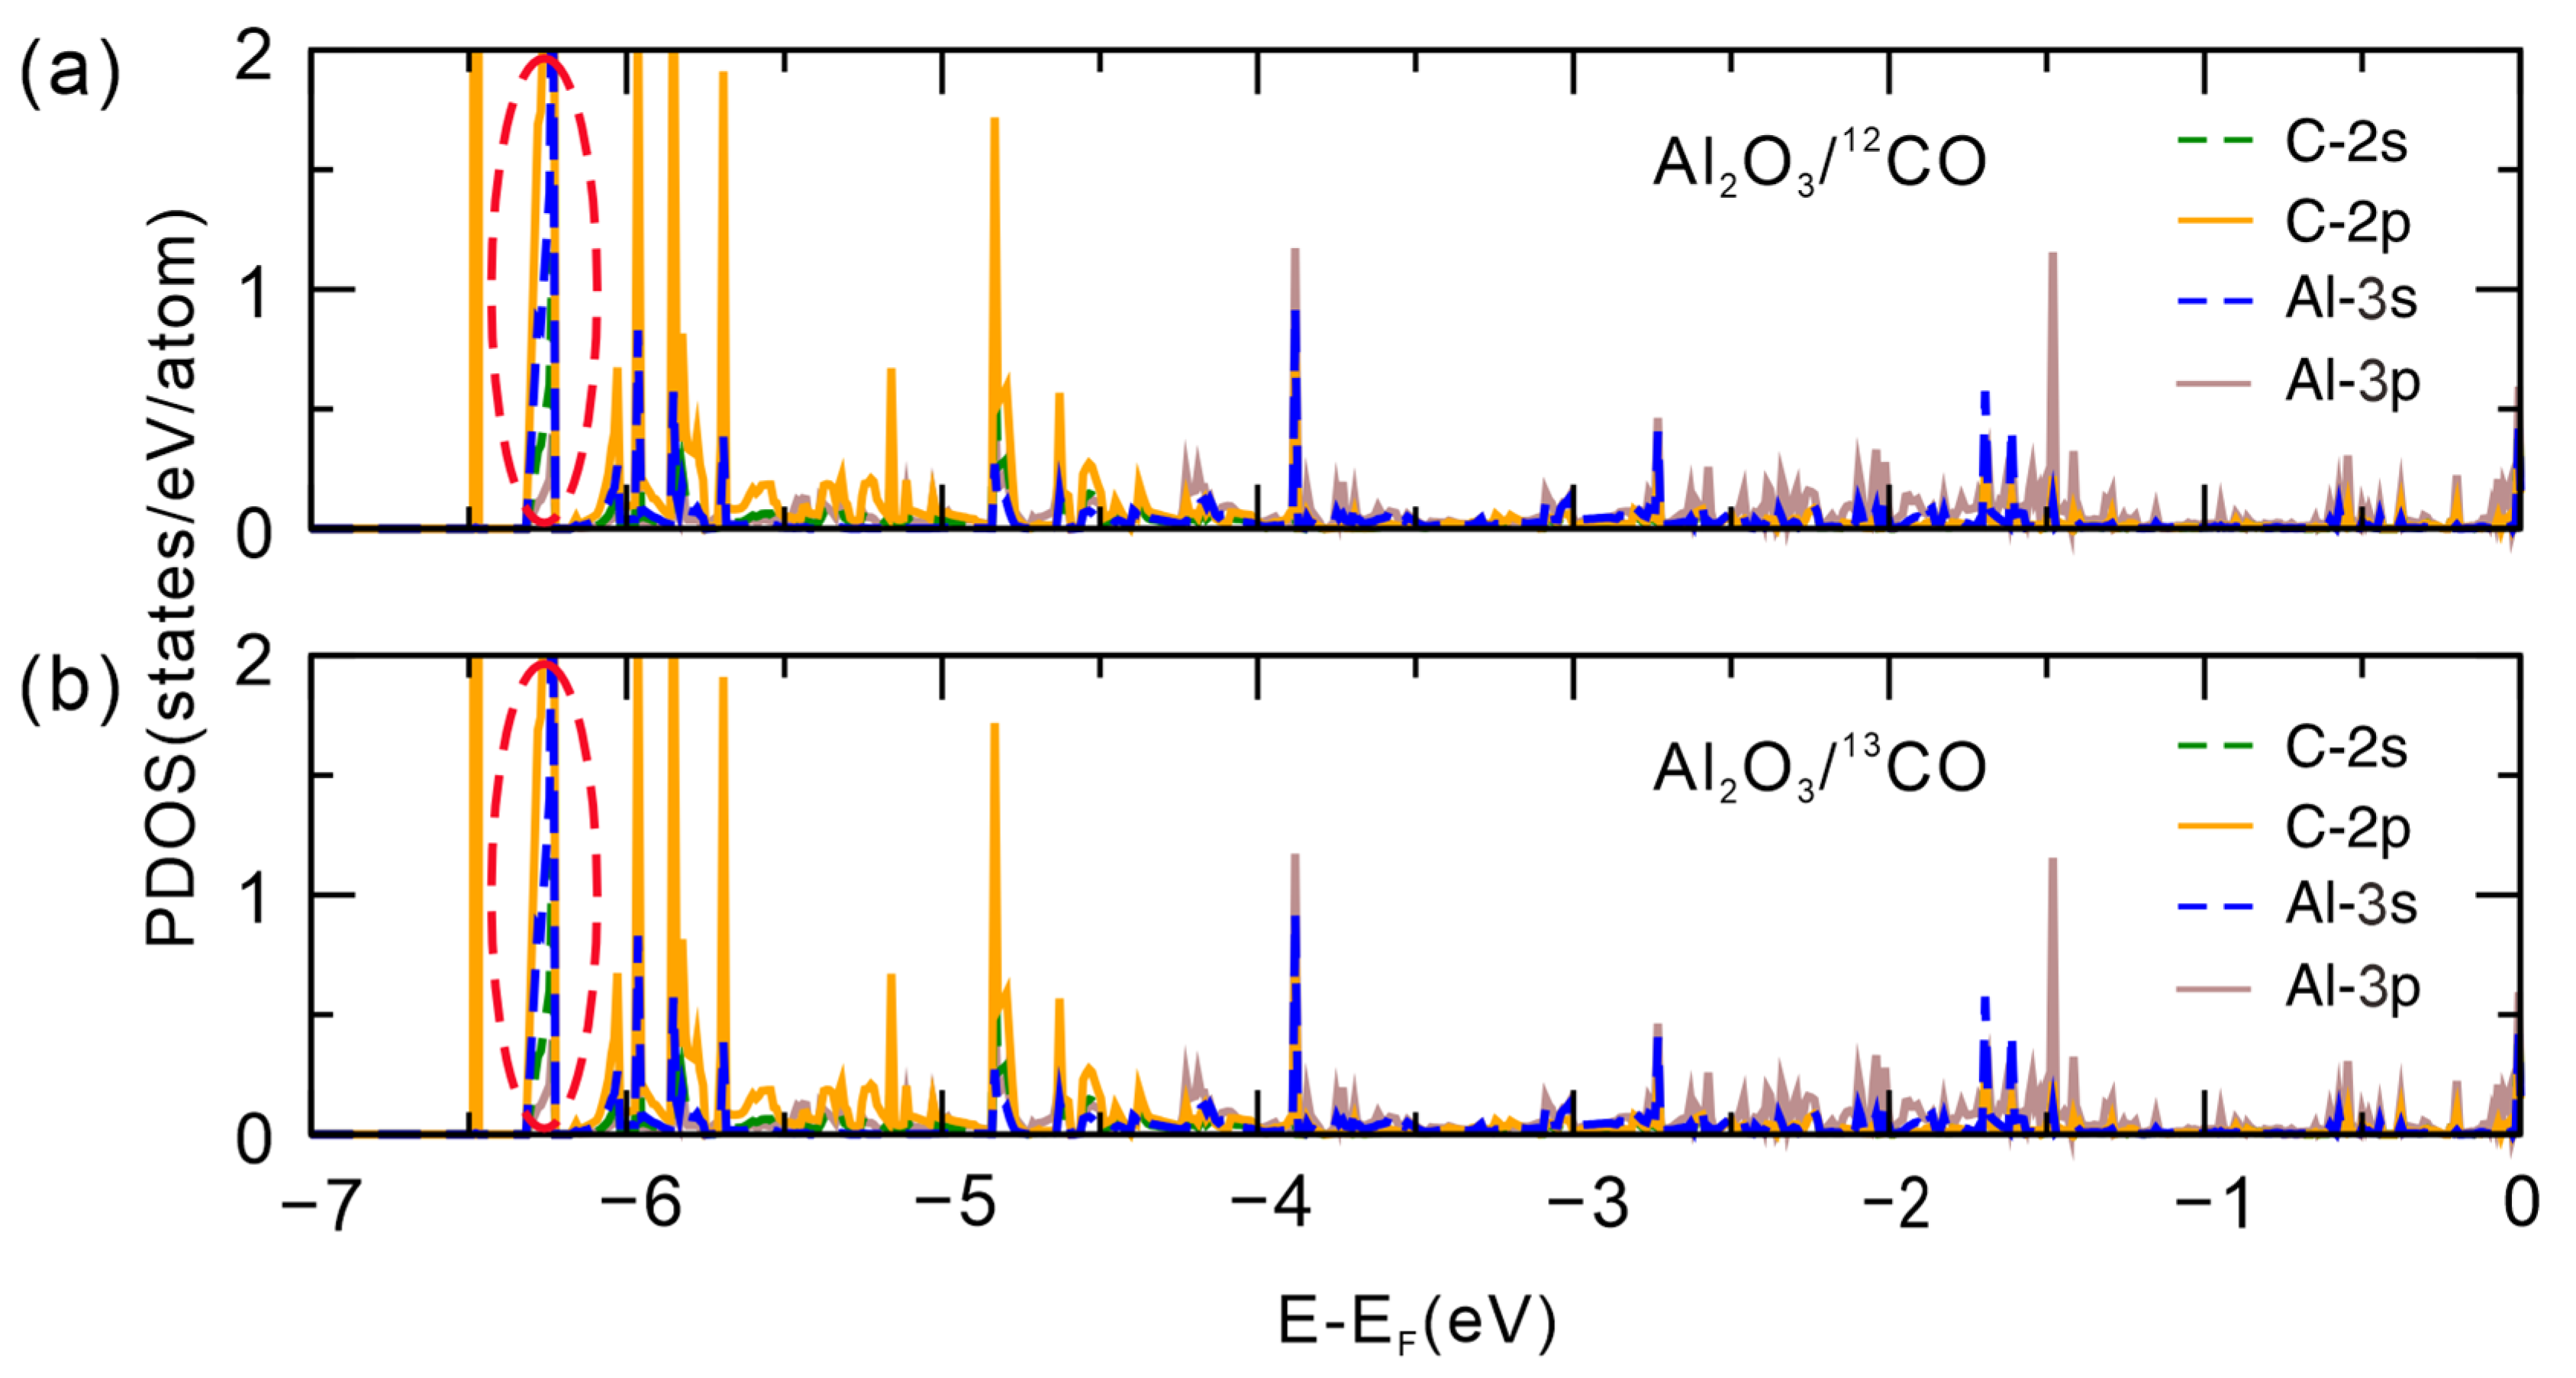
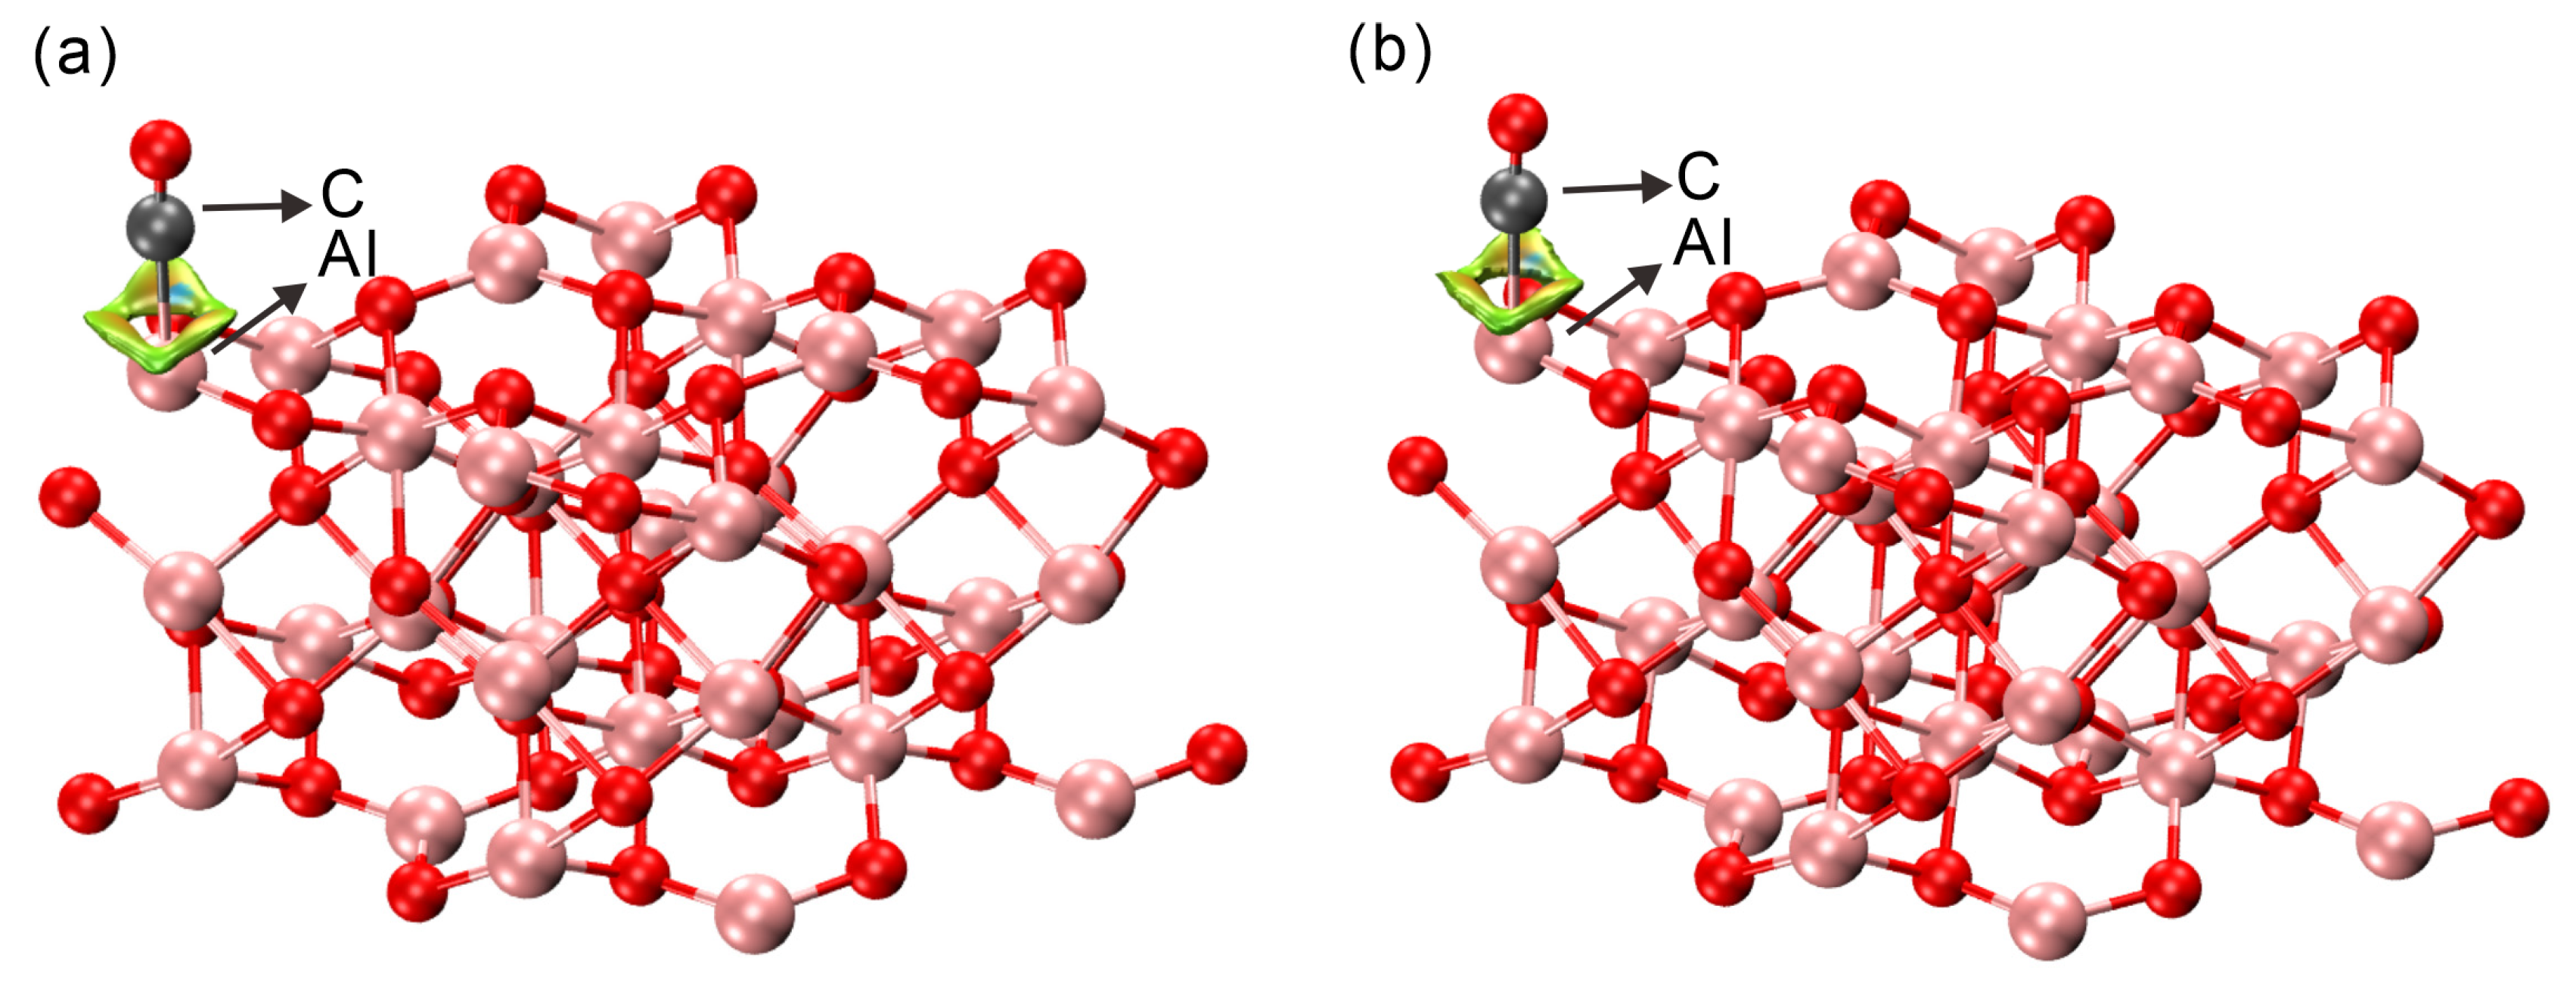
2.3. Bader Charge and Electronic Structure Analysis

To understand the charge variations resulting from CO adsorption and the intricate interaction mechanism with the α -Al2O3 ( 0001 ) surface, we conducted the Bader charge analysis across all adsorption configurations. Table 3 summarizes the net charge transfer associated with CO adsorption, where a positive value indicates electron loss and a negative value indicates electron gain. Given that the chemical properties of 12CO and 13CO are nearly identical, the Bader charge and electronic structure analyses yield indistinguishable results for the Al2O3/12CO and Al2O3/13CO systems. Consequently, the discussion herein refers collectively to both isotopic systems. Among these nine configurations, the observed charge transfer values are as follows: 0.03e for configurations (a) and (d), 0.01e for configuration (b), 0.02e for configurations (c) and (i), 0.05e for configuration (e), 0.08e for configuration (f), and 0.04e for configuration (h). Overall, the electron transfer from the α -Al2O3 surface to the CO molecule is minimal, indicating only a subtle redistribution of charge.
To further elucidate the interaction mechanism between the α -Al2O3 ( 0001 ) surface and the CO molecules, we performed a partial density of states (PDOS) analysis in Figure 3. The PDOS plots at the top valence bands, focusing specifically on the C and Al atomic contributions, reveal a localized interaction predominantly within the −4.5 to −6.5 eV energy window. Notably, at approximately −6.3 eV, both the Al2O3/12CO and Al2O3/13CO systems exhibit pronounced hybridization, mainly between the Al 3s and C 2p orbitals. The observed orbital overlap, though limited, suggests that the interaction is not purely governed by van der Waals forces. Instead, a weak electronic hybridization between CO and the surface contributes to a slight bonding character, which is stronger than simple physisorption but much weaker than a typical covalent bond.
Furthermore, non-covalent interaction (NCI) analysis was conducted to gain deeper insight into the nature of the CO–surface interaction. NCI is a visualization technique based on the electron density and its gradient, which highlights regions of weak interactions—such as van der Waals forces—through low electron density and reduced density gradient values. In this study, NCI analysis was performed using the Critic2 program, version 1.2.2 [44], which supports both molecular and periodic systems. As shown in Figure 4, green to yellow isosurfaces are observed between the CO molecule and the α -Al2O3 ( 0001 ) surface. These features indicate the presence of weak attractive forces, mainly dispersion interactions. However, the subtle variation in isosurface color suggests that the interaction is not purely dispersive and may involve a small degree of charge redistribution. The absence of pronounced blue or red regions around the adsorption site indicates that there is neither strong electrostatic attraction nor significant steric repulsion. Combined with the minimal charge transfer and weak orbital hybridization observed from Bader analysis and PDOS, these results suggest that CO adsorption on the α -Al2O3 ( 0001 ) surface is primarily characterized by weak physisorption with minor electronic contributions beyond van der Waals forces.

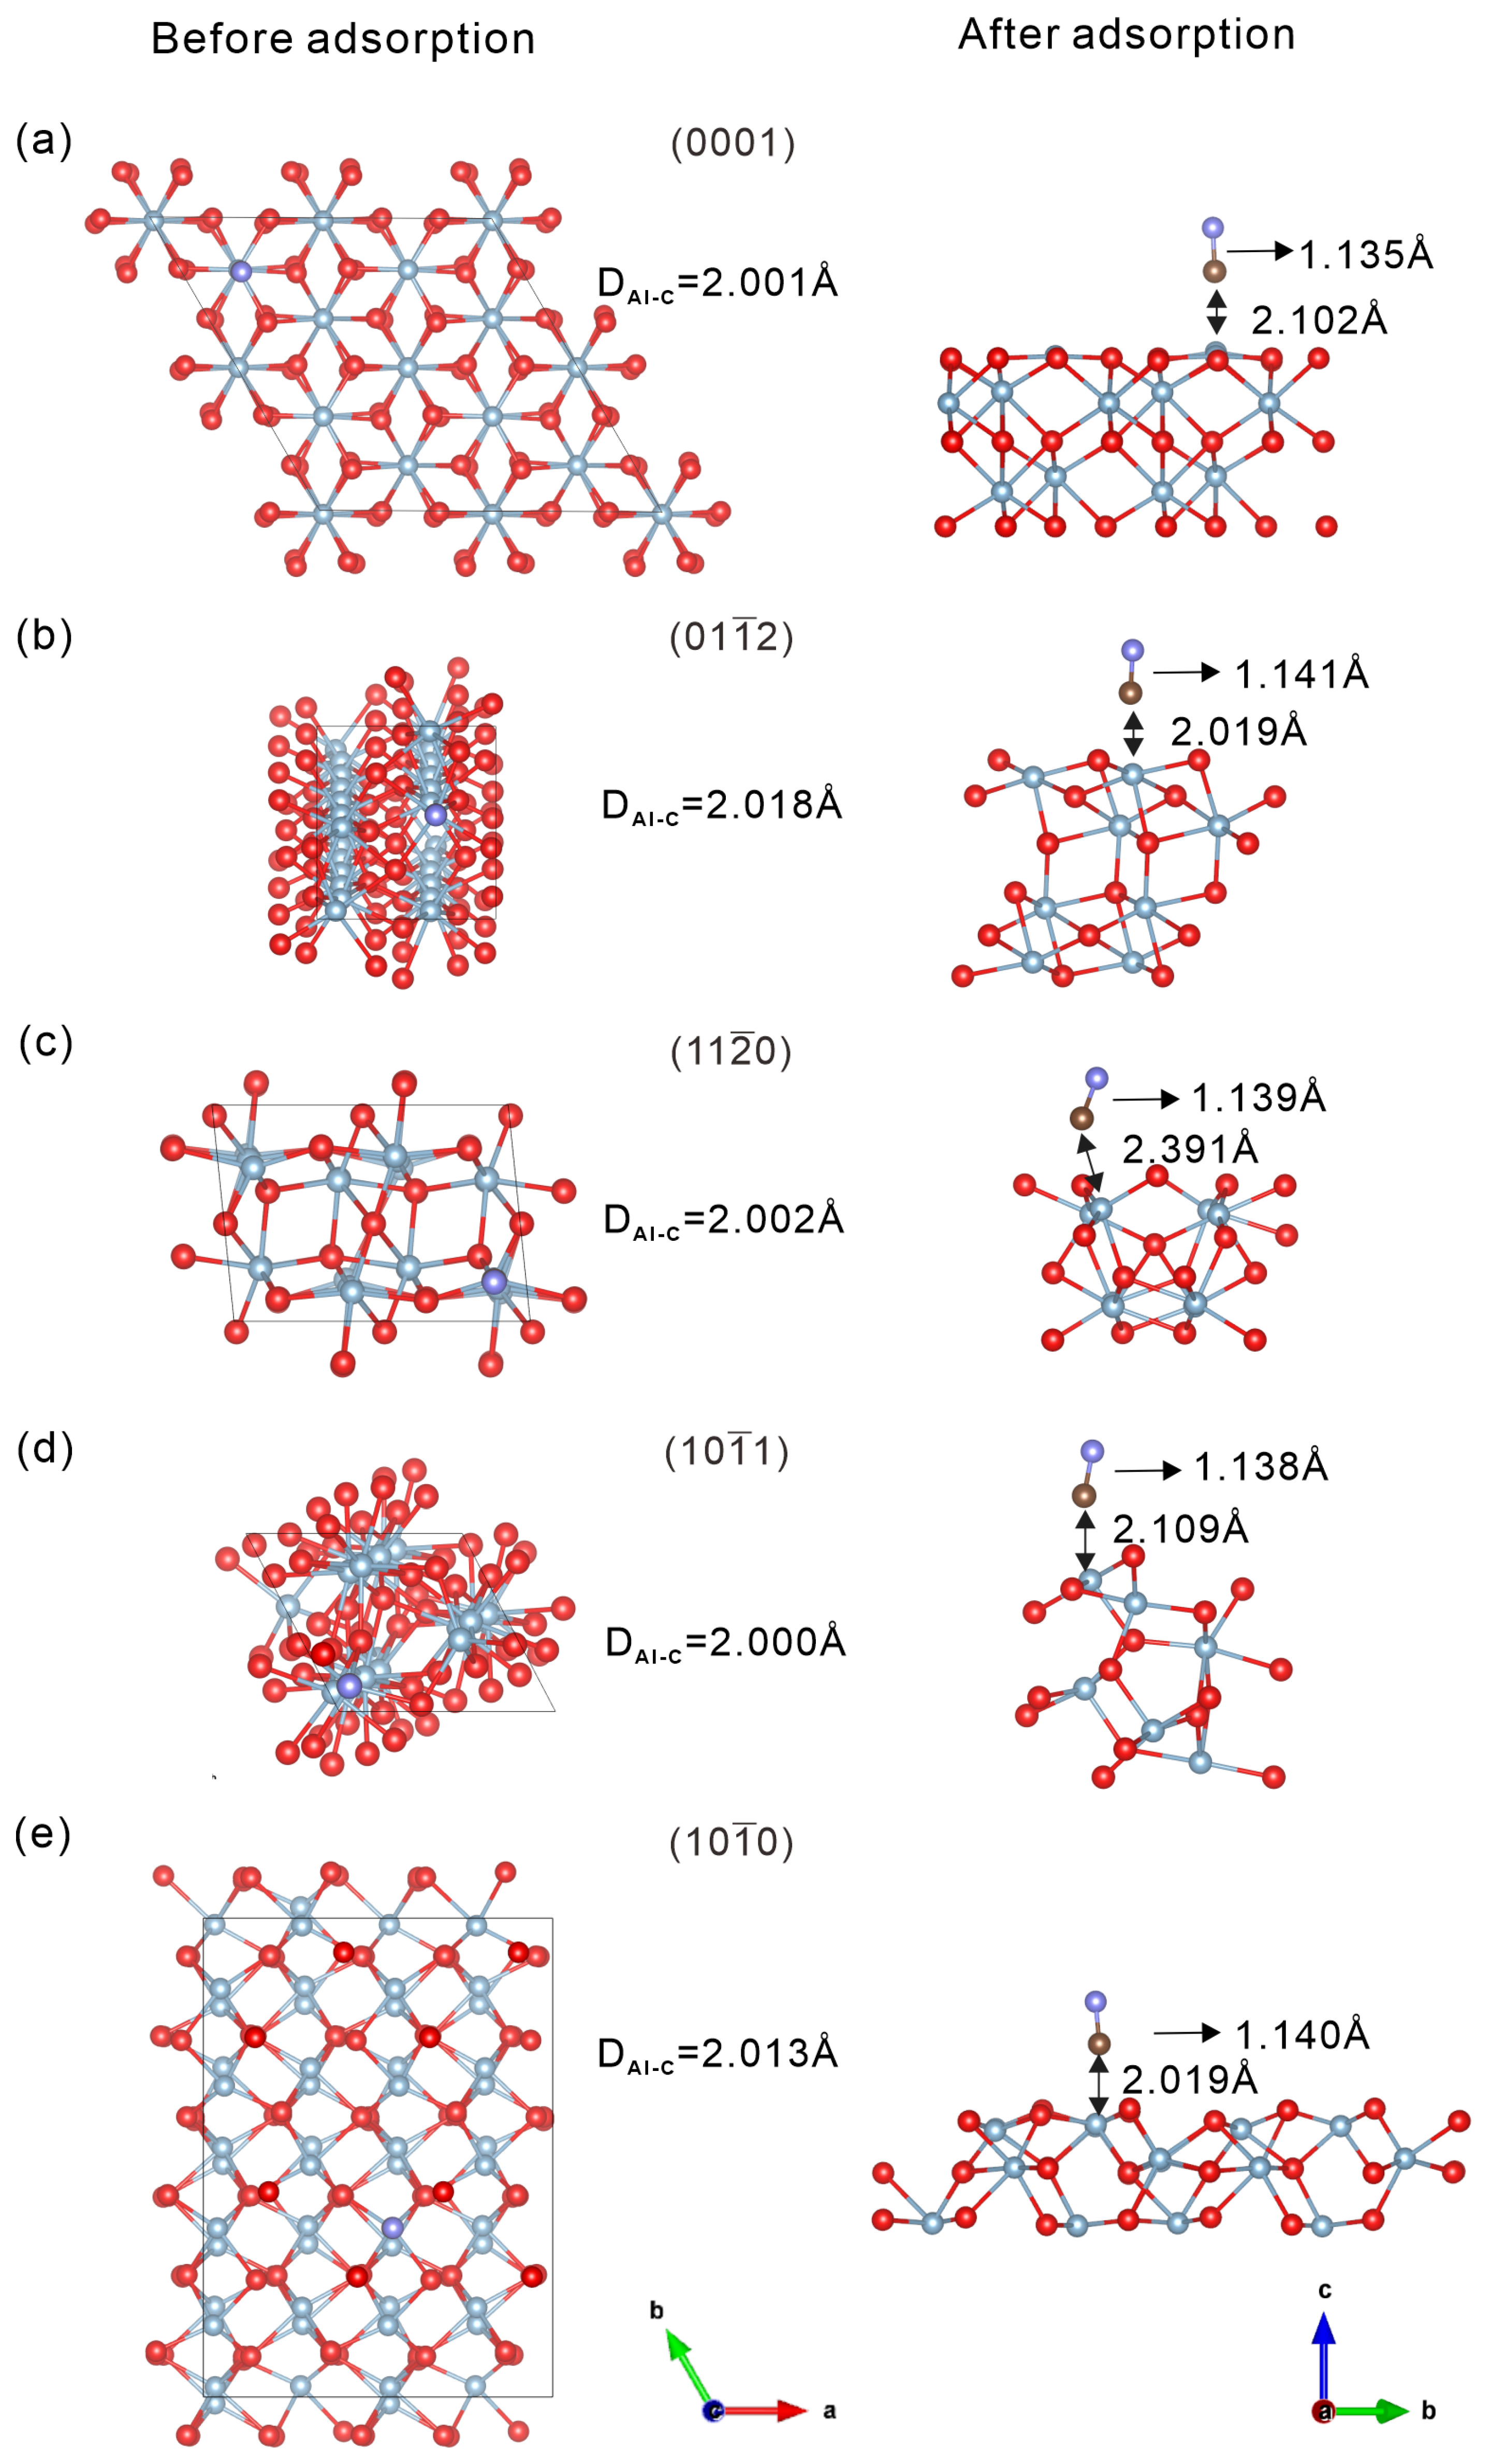
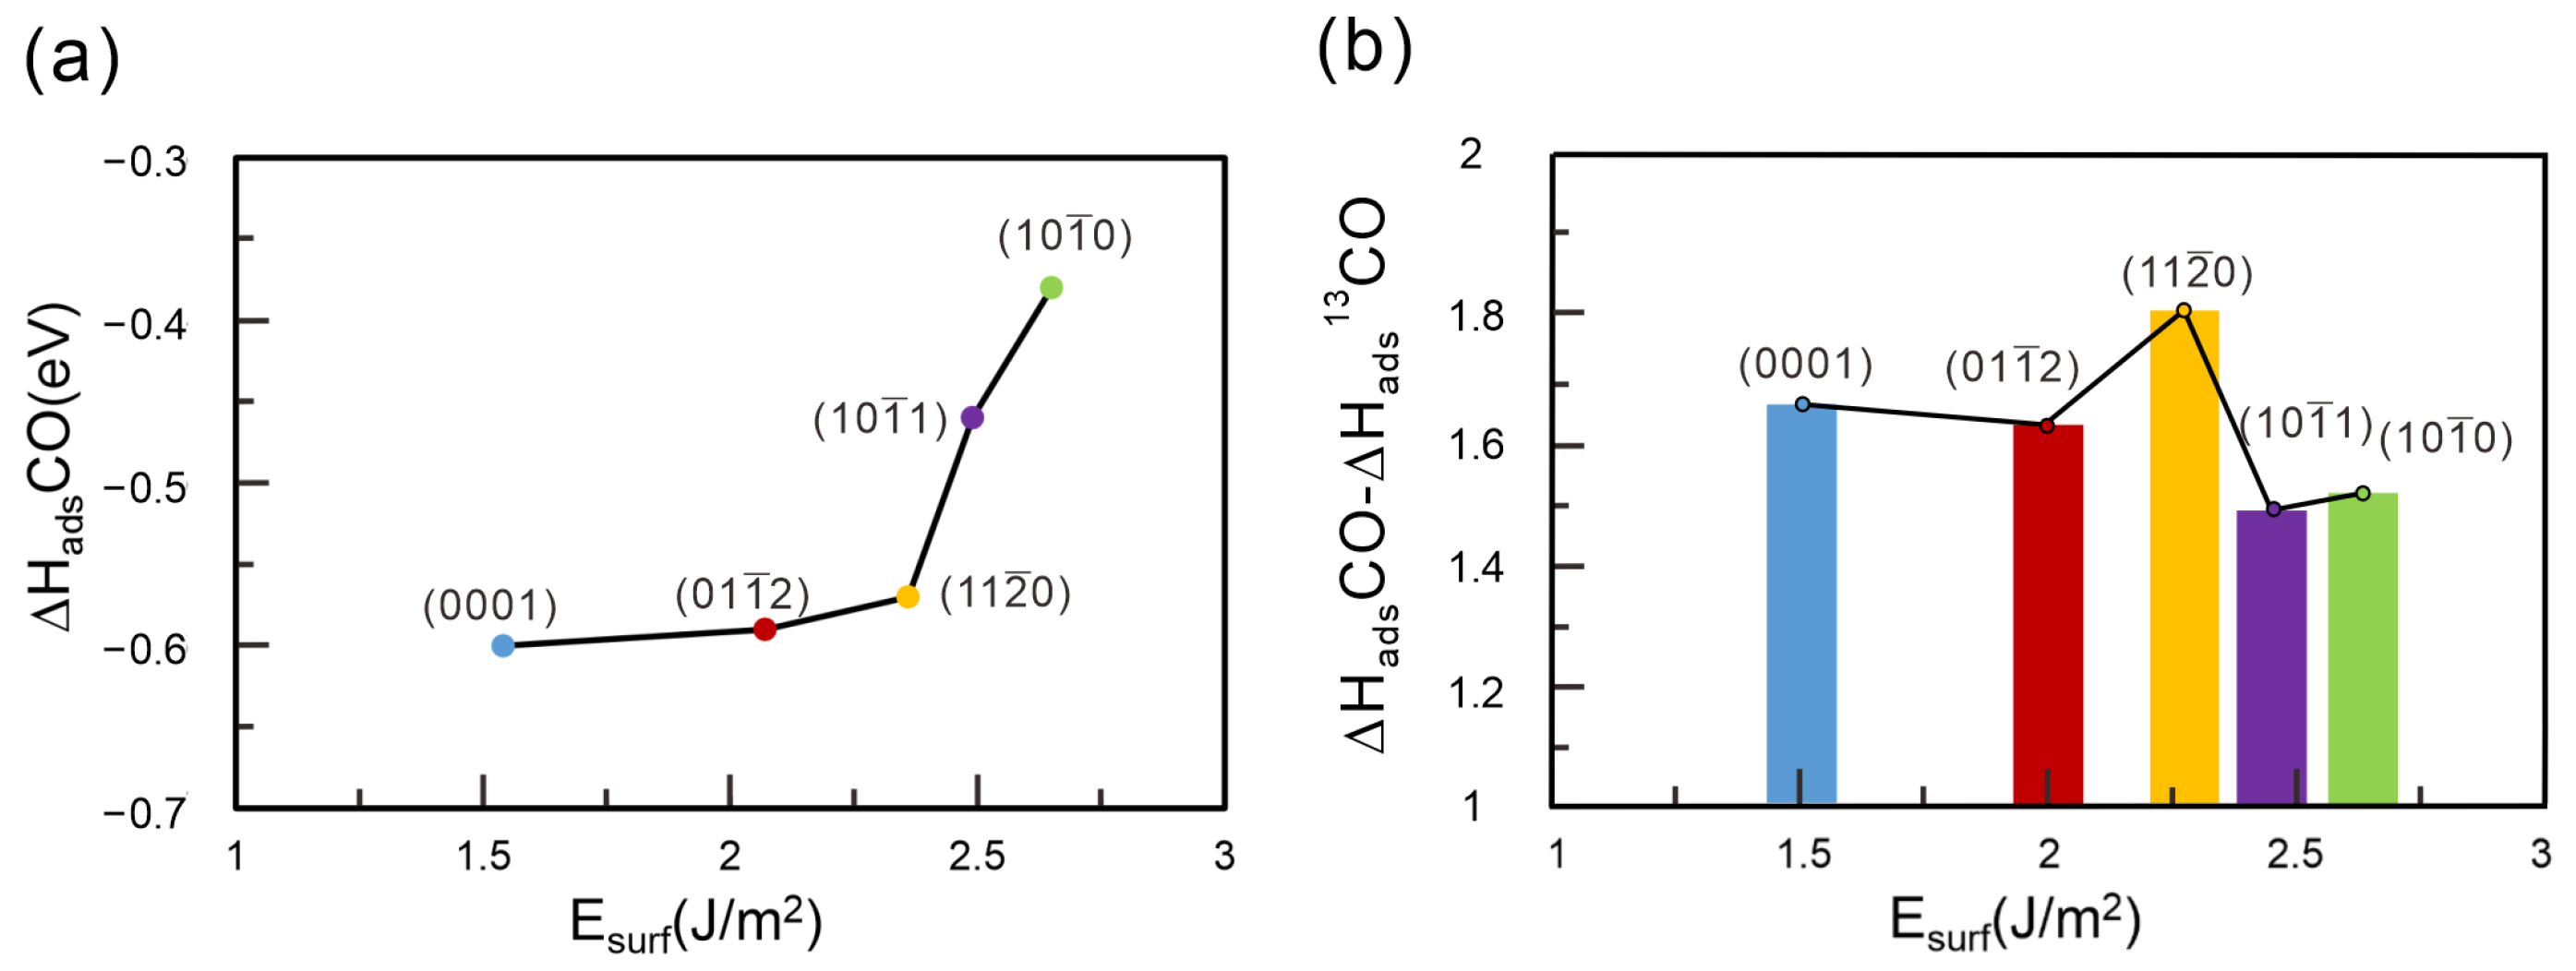
2.4. Comparison of 12CO and 13CO Separation Performance on Different α -Al2O3 Surfaces

The separation performance of different α -Al2O3 surfaces was evaluated through calculations of adsorption enthalpy, geometric parameters, and CO adsorption configurations at surface Al sites. As depicted in Figure 5, the top view represents the initial adsorption geometry of the CO molecule prior to interaction with the surface, whereas the side view illustrates the fully relaxed configuration after adsorption. Structural parameters such as the initial C–Al distance (DAl-C), the C–O bond length, and the final DAl–C after relaxation are labeled to highlight adsorption-induced changes. These geometric descriptors provide insight into the adsorption mechanism and the extent of structural reorganization upon binding.
As shown in Table 4, the adsorption enthalpies of 13CO are consistently slightly lower than those of 12CO across all examined surfaces, with differences ranging from 1.51 to 1.85 meV. This consistent trend suggests that 13CO interacts slightly more strongly with the surface, indicating a small but measurable isotopic preference. This preference primarily originates from differences in ZPE, as shown in Table 5. Due to its higher mass, 13CO has lower vibrational frequencies and thus a smaller ZPE than 12CO. Upon adsorption, this ZPE difference results in a slightly more stable bound state for 13CO. Therefore, the observed enthalpy differences are mainly attributed to differences in ZPE. This aligns with the concept of chemical affinity quantum sieving, where isotope selectivity arises partly from differences in ZPE. Among the five surfaces we studied, the ( 11 2 ¯ 0 ) surface shows the largest enthalpy and ZPE difference (1.85 meV), suggesting the strongest isotopic selectivity. In contrast, the ( 10 1 ¯ 1 ) surface shows the smallest difference, indicating a weaker separation effect between the two isotopes. This ZPE difference, though small, is sufficient for effective separation, and similar ZPE differences on the order of magnitude have been reported in carbon isotope effects, such as the ZPE difference between 12CH4 and 12CH4 has been reported as ~29.8 cm−1 (~3.7 meV) [45]. Furthermore, ZPE differences between 12C/13C bonds as small as 0.01–0.05 kcal/mol (0.43–2.15 meV) have been reported in enzyme-catalyzed reactions, which still can lead to a predicted ~9‰ enrichment in pyruvate [46]. The isotope differences we obtained in CO (1.51–1.85 meV) are of the same order of magnitude as those reported in the literature. This shows that even such small ZPE differences can be effectively utilized to investigate isotope fractionation, supporting the feasibility of our approach.
To better understand the surface-dependent isotope separation behavior, we systematically analyzed the adsorption characteristics of different α -Al2O3 facets, incorporating ZPE corrections, as shown in Figure 6. Figure 6a illustrates the relationship between adsorption enthalpy and surface energy. On the ( 0001 ), ( 01 1 ¯ 2 ), ( 11 2 ¯ 0 ), ( 10 1 ¯ 1 ), and ( 10 1 ¯ 0 ) surfaces, the adsorption energy difference between 12CO and 13CO primarily arises from zero-point energy differences. It shows that surfaces with lower surface energy tend to have lower adsorption enthalpy, suggesting stronger CO binding. These findings are consistent with previous studies [47,48], which reported a correlation between surface stability and adsorption strength. Figure 6b displays the differences in adsorption enthalpy between 12CO and 13CO as bars, with the corresponding ZPE differences shown as a line plot. The analysis reveals a clear trend: surfaces with lower surface energy not only adsorb CO more strongly but also exhibit larger enthalpy differences between the two CO isotopes. This suggests better isotope separation performance. Moreover, our findings support the chemical affinity quantum sieving concept, which posits that lower adsorption energy can enhance isotopic selectivity due to the greater influence of vibrational energy differences. Overall, among the various surfaces of α -Al2O3, the ( 0001 ), ( 01 1 ¯ 2 ), and ( 11 2 ¯ 0 ) planes exhibit superior separation performance. This finding provides valuable insights for future experimental design and theoretical studies, highlighting these surfaces as promising candidates for targeted investigation.

3. Computational Methods

All calculations were performed within the density functional theory (DFT) framework using the Vienna ab initio simulation package (VASP, version 5.4.4) [49] and the projector augmented wave (PAW) method [50]. In this work, the generalized gradient approximation (GGA) with the Perdew–Burke–Ernzerhof (PBE)-type exchange–correlation potential [51] was employed. The dispersion correction was introduced by combining Grimme’s D3 method with Becke−Johnson (BJ) damping [52]. For bulk α -Al2O3 and its 2 × 2 surface, a plane-wave cutoff of 600 eV was used. The bulk calculations adopted an 8 × 8 × 3 k-point grid, while the surface calculations used a 4 × 4 × 2 grid. The quasi-Newton algorithm as implemented in the VASP code was used in all structural relaxations. Excellent convergence of the energy differences (0.001 meV) and forces (5 meV/Å) were achieved. The optimized bulk α -Al2O3 lattice parameters were a = 4.806 Å and c   = 13.113 Å, which are in excellent agreement with experimental data [53] and previously reported DFT-GGA results [54]. During the optimization of the α -Al2O3 surface model, the ionic positions, cell volume, and cell shape were allowed to relax. To account for isotopic effects, the mass parameter in the POTCAR file was modified from the default 12.011 amu (12C) to 13.011 amu (13C). This adjustment affects vibrational frequencies and zero-point energy but does not alter the electronic wavefunctions since the pseudopotential remains unchanged.

4. Conclusions

In this study, we constructed surface models of various low-index α -Al2O3 planes and investigated their CO adsorption and isotope separation behavior using DFT-D3(BJ) calculations with zero-point energy and van der Waals corrections. On the (0001) surface, the most favorable configuration was identified as vertical adsorption of CO via the carbon atom onto an Al site. Charge analysis and PDOS indicate weak electronic interactions with minor charge transfer, consistent with physisorption dominated by dispersion forces. NCI analysis further supports this, revealing weak, non-covalent interactions without significant repulsion or strong bonding. Across different surfaces, those with lower surface energy showed both lower adsorption enthalpy and more pronounced differences between 12CO and 13CO adsorption, suggesting better potential for isotope separation. In particular, the ( 0001 ), ( 11 2 ¯ 0 ), and ( 01 1 ¯ 2 ) surfaces exhibit the most promising separation performance. Overall, this work provides a clear understanding of how surface orientation influences CO adsorption and isotope selectivity on α -Al2O3. These insights offer useful guidance for designing materials for isotope separation and related applications.

Supplementary Materials

The following supporting information can be downloaded at: https://www.mdpi.com/article/10.3390/molecules30092067/s1, Figure S1: E s u r f as a function of the number of Al-O-Al layers n in the slab (with n = 4–10) for (0001).

Author Contributions

Conceptualization, X.C. and S.D.; methodology, X.C.; software, Q.Y.; validation, X.C., S.D., and Q.Y.; formal analysis, Q.Y.; investigation, Q.Y.; resources, S.D.; data curation, Q.Y. and Q.X.; writing—original draft preparation, Q.Y.; writing—review and editing, X.C. and Q.Y.; visualization, Q.Y.; supervision, X.C. and S.D.; project administration, X.C. and S.D.; funding acquisition, X.C. and S.D. All authors have read and agreed to the published version of the manuscript.

Funding

This work was financially supported by the National Natural Science Foundation (NSF) of China (62475265, 22031009); the National Key R & D Program of China (2021YFB3601501); and the NSF of Fujian Province (2023J01212).

Institutional Review Board Statement

Not applicable.

Informed Consent Statement

Not applicable.

Data Availability Statement

The original contributions presented in this study are included in the article. Further inquiries can be directed to the corresponding authors.

Acknowledgments

Computational resources have been provided by the supercomputing facilities of National Supercomputer Center in Tianjin and Guangzhou.

Conflicts of Interest

The authors declare no conflicts of interest.

References

  1. Wilkinson, D.J. Historical and Contemporary Stable Isotope Tracer Approaches to Studying Mammalian Protein Metabolism. Mass Spectrom. Rev. 2018, 37, 57–80. [Google Scholar] [CrossRef] [PubMed]
  2. Metallo, C.M.; Walther, J.L.; Stephanopoulos, G. Evaluation of 13C Isotopic Tracers for Metabolic Flux Analysis in Mammalian Cells. J. Biotechnol. 2009, 144, 167–174. [Google Scholar] [CrossRef] [PubMed]
  3. Davies, P.S.W. Stable Isotopes: Their Use and Safety in Human Nutrition Studies. Eur. J. Clin. Nutr. 2020, 74, 362–365. [Google Scholar] [CrossRef] [PubMed]
  4. Nelson, S.J.; Kurhanewicz, J.; Vigneron, D.B.; Larson, P.E.Z.; Harzstark, A.L.; Ferrone, M.; Van Criekinge, M.; Chang, J.W.; Bok, R.; Park, I.; et al. Metabolic Imaging of Patients with Prostate Cancer Using Hyperpolarized [1-13 C]Pyruvate. Sci. Transl. Med. 2013, 5, 198ra108. [Google Scholar] [CrossRef]
  5. Herold, R.; Becker, M. 13C-Urea Breath Test Threshold Calculation and Evaluation for the Detection of Helicobacter Pylori Infection in Children. BMC Gastroenterol. 2002, 2, 12. [Google Scholar] [CrossRef]
  6. Smith, B.N.; Epstein, S. Two Categories of13 C/12 C Ratios for Higher Plants. Plant Physiol. 1971, 47, 380–384. [Google Scholar] [CrossRef]
  7. Beenakker, J.J.M.; Borman, V.D.; Krylov, S.Y. Molecular Transport in Subnanometer Pores: Zero-Point Energy, Reduced Dimensionality and Quantum Sieving. Chem. Phys. Lett. 1995, 232, 379–382. [Google Scholar] [CrossRef]
  8. FitzGerald, S.A.; Pierce, C.J.; Rowsell, J.L.C.; Bloch, E.D.; Mason, J.A. Highly Selective Quantum Sieving of D2 from H2 by a Metal–Organic Framework as Determined by Gas Manometry and Infrared Spectroscopy. J. Am. Chem. Soc. 2013, 135, 9458–9464. [Google Scholar] [CrossRef]
  9. Kim, J.Y.; Zhang, L.; Balderas-Xicohténcatl, R.; Park, J.; Hirscher, M.; Moon, H.R.; Oh, H. Selective Hydrogen Isotope Separation via Breathing Transition in MIL-53(Al). J. Am. Chem. Soc. 2017, 139, 17743–17746. [Google Scholar] [CrossRef]
  10. Rae, H.K. Separation of Hydrogen Isotopes; ACS Publications: Washington, DC, USA, 1978. [Google Scholar]
  11. Hu, S.; Lozada-Hidalgo, M.; Wang, F.C.; Mishchenko, A.; Schedin, F.; Nair, R.R.; Hill, E.W.; Boukhvalov, D.W.; Katsnelson, M.I.; Dryfe, R.A.W.; et al. Proton Transport through One-Atom-Thick Crystals. Nature 2014, 516, 227–230. [Google Scholar] [CrossRef]
  12. Kim, J.Y.; Balderas-Xicohténcatl, R.; Zhang, L.; Kang, S.G.; Hirscher, M.; Oh, H.; Moon, H.R. Exploiting Diffusion Barrier and Chemical Affinity of Metal–Organic Frameworks for Efficient Hydrogen Isotope Separation. J. Am. Chem. Soc. 2017, 139, 15135–15141. [Google Scholar] [CrossRef]
  13. Su, Y.; Otake, K.; Zheng, J.-J.; Horike, S.; Kitagawa, S.; Gu, C. Separating Water Isotopologues Using Diffusion-Regulatory Porous Materials. Nature 2022, 611, 289–294. [Google Scholar] [CrossRef] [PubMed]
  14. Ujjain, S.K.; Bagusetty, A.; Matsuda, Y.; Tanaka, H.; Ahuja, P.; De Tomas, C.; Sakai, M.; Vallejos-Burgos, F.; Futamura, R.; Suarez-Martinez, I.; et al. Adsorption Separation of Heavier Isotope Gases in Subnanometer Carbon Pores. Nat. Commun. 2021, 12, 546. [Google Scholar] [CrossRef]
  15. Tian, Y.; Fei, W.; Wu, J. Separation of Carbon Isotopes in Methane with Nanoporous Materials. Ind. Eng. Chem. Res. 2018, 57, 5151–5160. [Google Scholar] [CrossRef]
  16. Wang, J.; Zhou, M.; Lu, D.; Fei, W.; Wu, J. Computational Screening and Design of Nanoporous Membranes for Efficient Carbon Isotope Separation. Green Energy Environ. 2020, 5, 364–373. [Google Scholar] [CrossRef]
  17. Li, W.; Xie, K. Porous Single Crystals at the Macroscale: From Growth to Application. Acc. Chem. Res. 2023, 56, 374–384. [Google Scholar] [CrossRef]
  18. Li, X.; Li, W.; Zhang, J.; Yin, W.; Xia, Y.; Xie, K. Porous Single-crystalline Centimeter-sized α-Al2 O3 Monoliths for Selective and Durable Non-oxidative Dehydrogenation of Ethane. Angew. Chem. Int. Ed. 2024, 63, e202315274. [Google Scholar] [CrossRef]
  19. Parkinson, G.S.; Diebold, U. Adsorption on Metal Oxide Surfaces. In Surface and Interface Science; Wandelt, K., Ed.; Wiley: Hoboken, NJ, USA, 2016; pp. 793–817. [Google Scholar]
  20. Huang, Y.-C.; Zhao, K.-Y.; Liu, Y.; Zhang, X.-Y.; Du, H.-Y.; Ren, X.-W. Investigation on Adsorption of Ar and N2 on α-Al2O3(0001) Surface from First-Principles Calculations. Vacuum 2020, 176, 109344. [Google Scholar] [CrossRef]
  21. Yue, Y.; Melani, G.; Kirsch, H.; Paarmann, A.; Saalfrank, P.; Campen, R.K.; Tong, Y. Structure and Reactivity of α-Al2 O3 (0001) Surfaces: How Do Al–I and Gibbsite-like Terminations Interconvert? J. Phys. Chem. C 2022, 126, 13467–13476. [Google Scholar] [CrossRef]
  22. Zhu, Z.; Yu, Z.; Yun, F.F.; Pan, D.; Tian, Y.; Jiang, L.; Wang, X. Crystal Face Dependent Intrinsic Wettability of Metal Oxide Surfaces. Natl. Sci. Rev. 2021, 8, nwaa166. [Google Scholar] [CrossRef]
  23. Tamijani, A.A.; Bjorklund, J.L.; Augustine, L.J.; Catalano, J.G.; Mason, S.E. Density Functional Theory and Thermodynamics Modeling of Inner-Sphere Oxyanion Adsorption on the Hydroxylated α-Al2 O3 (001) Surface. Langmuir 2020, 36, 13166–13180. [Google Scholar] [CrossRef]
  24. Zhang, G.; Dou, S.; Lu, Y.; Shi, Y.; Lai, X.; Wang, X. Mechanisms for Adsorption, Dissociation and Diffusion of Hydrogen in Hydrogen Permeation Barrier of α-Al2O3: The Role of Crystal Orientation. Int. J. Hydrogen Energy 2014, 39, 610–619. [Google Scholar] [CrossRef]
  25. Elyasi Kojabad, M.; Nouri, M.; Babaluo, A.A.; Tavakoli, A.; Sardari, R.; Farhadi, Z.; Moharrami, M. Alumina-PEBA/PSf Multilayer Composite Membranes for CO2 Separation: Experimental and Molecular Simulation Studies. Sci. Iran. 2022, 30, 2043–2055. [Google Scholar] [CrossRef]
  26. Alioui, O.; Gueddida, S.; Benguerba, Y.; Lebègue, S.; Badawi, M. Potential of Nickel Nanoclusters Supported on α-Al2O3 (0001) Surface for CO2 Capture, Energy Production, and Dry Reforming of Methane. Appl. Surf. Sci. 2023, 610, 155474. [Google Scholar] [CrossRef]
  27. Hass, K.C.; Schneider, W.F.; Curioni, A.; Andreoni, W. The Chemistry of Water on Alumina Surfaces: Reaction Dynamics from First Principles. Science 1998, 282, 265–268. [Google Scholar] [CrossRef] [PubMed]
  28. Casarin, M.; Maccato, C.; Vittadini, A. Theoretical Study of the Chemisorption of CO on Al2O3 (0001). Inorg. Chem. 2000, 39, 5232–5237. [Google Scholar] [CrossRef]
  29. Rohmann, C.; Metson, J.B.; Idriss, H. DFT Study of Carbon Monoxide Adsorption on α-Al2O3(0001). Surf. Sci. 2011, 605, 1694–1703. [Google Scholar] [CrossRef]
  30. Manassidis, I.; Gillan, M.J. Structure and Energetics of Alumina Surfaces Calculated from First Principles. J. Am. Ceram. Soc. 1994, 77, 335–338. [Google Scholar] [CrossRef]
  31. Tasker, P.W. The Stability of Ionic Crystal Surfaces. J. Phys. C Solid State Phys. 1979, 12, 4977–4984. [Google Scholar] [CrossRef]
  32. Sun, J.; Stirner, T.; Matthews, A. Structure and Surface Energy of Low-Index Surfaces of Stoichiometric α-Al2O3 and α-Cr2O3. Surf. Coat. Technol. 2006, 201, 4205–4208. [Google Scholar] [CrossRef]
  33. Mackrodt, W.C.; Davey, R.J.; Black, S.N.; Docherty, R. The Morphology of α-Al2O3 and α-Fe2O3: The Importance of Surface Relaxation. J. Cryst. Growth 1987, 80, 441–446. [Google Scholar] [CrossRef]
  34. Ruberto, C.; Yourdshahyan, Y.; Lundqvist, B.I. Surface Properties of Metastable Alumina: A Comparative Study of κ- and α-Al2O3. Phys. Rev. B 2003, 67, 195412. [Google Scholar] [CrossRef]
  35. Alavi, S.; Sorescu, D.C.; Thompson, D.L. Adsorption of HCl on Single-Crystal α-Al2O3 (0001) Surface: A DFT Study. J. Phys. Chem. B 2003, 107, 186–195. [Google Scholar] [CrossRef]
  36. Hinnemann, B.; Carter, E.A. Adsorption of Al, O, Hf, Y, Pt, and S Atoms on α-Al2O3 (0001). J. Phys. Chem. C 2007, 111, 7105–7126. [Google Scholar] [CrossRef]
  37. Bedghiou, D.; Rahab, M.N.; Benali-Cherif, R.; Djelloul, A.; Boumaza, A. First Principles Unveiling Equilibrium Shapes for Understanding Morphological Growth Mechanisms in Alumina Polymorphs. Acta Mater. 2024, 281, 120450. [Google Scholar] [CrossRef]
  38. Huber, K.P.; Herzberg, G. Constants of Diatomic Molecules. In Molecular Spectra and Molecular Structure; Springer: Boston, MA, USA, 1979; pp. 8–689. ISBN 978-1-4757-0963-6. [Google Scholar]
  39. Chen, Y.; Bai, X.; Liu, D.; Fu, X.; Yang, Q. High-Throughput Computational Exploration of MOFs with Open Cu Sites for Adsorptive Separation of Hydrogen Isotopes. ACS Appl. Mater. Interfaces 2022, 14, 24980–24991. [Google Scholar] [CrossRef] [PubMed]
  40. Wang, V.; Xu, N.; Liu, J.-C.; Tang, G.; Geng, W.-T. VASPKIT: A User-Friendly Interface Facilitating High-Throughput Computing and Analysis Using VASP Code. Comput. Phys. Commun. 2021, 267, 108033. [Google Scholar] [CrossRef]
  41. Blyholder, G. Molecular Orbital View of Chemisorbed Carbon Monoxide. J. Phys. Chem. 1964, 68, 2772–2777. [Google Scholar] [CrossRef]
  42. Pandey, I.; Lin, L.-C.; Chen, C.-C.; Howe, J.D. Understanding Carbon Monoxide Binding and Interactions in M-MOF-74 (M = Mg, Mn, Ni, Zn). Langmuir 2023, 39, 18187–18197. [Google Scholar] [CrossRef]
  43. Sung, S.S.; Hoffmann, R. How Carbon Monoxide Bonds to Metal Surfaces. J. Am. Chem. Soc. 1985, 107, 578–584. [Google Scholar] [CrossRef]
  44. Otero-de-la-Roza, A.; Johnson, E.R.; Luaña, V. Critic2: A Program for Real-Space Analysis of Quantum Chemical Interactions in Solids. Comput. Phys. Commun. 2014, 185, 1007–1018. [Google Scholar] [CrossRef]
  45. Ono, S.; Rhim, J.H.; Gruen, D.S.; Taubner, H.; Kölling, M.; Wegener, G. Clumped Isotopologue Fractionation by Microbial Cultures Performing the Anaerobic Oxidation of Methane. Geochim. Cosmochim. Acta 2021, 293, 70–85. [Google Scholar] [CrossRef]
  46. McNeill, A.S.; Dallas, B.H.; Eiler, J.M.; Bylaska, E.J.; Dixon, D.A. Reaction Energetics and13 C Fractionation of Alanine Transamination in the Aqueous and Gas Phases. J. Phys. Chem. A 2020, 124, 2077–2089. [Google Scholar] [CrossRef]
  47. Bajdich, M.; Nørskov, J.K.; Vojvodic, A. Surface Energetics of Alkaline-Earth Metal Oxides: Trends in Stability and Adsorption of Small Molecules. Phys. Rev. B 2015, 91, 155401. [Google Scholar] [CrossRef]
  48. Gao, W.; Chen, Y.; Li, B.; Liu, S.-P.; Liu, X.; Jiang, Q. Determining the Adsorption Energies of Small Molecules with the Intrinsic Properties of Adsorbates and Substrates. Nat. Commun. 2020, 11, 1196. [Google Scholar] [CrossRef]
  49. Kresse, G.; Hafner, J. Ab Initio Molecular Dynamics for Liquid Metals. Phys. Rev. B 1993, 47, 558–561. [Google Scholar] [CrossRef]
  50. Blöchl, P.E. Projector Augmented-Wave Method. Phys. Rev. B 1994, 50, 17953–17979. [Google Scholar] [CrossRef] [PubMed]
  51. Perdew, J.P.; Burke, K.; Ernzerhof, M. Generalized Gradient Approximation Made Simple. Phys. Rev. Lett. 1996, 77, 3865–3868. [Google Scholar] [CrossRef]
  52. Grimme, S.; Ehrlich, S.; Goerigk, L. Effect of the Damping Function in Dispersion Corrected Density Functional Theory. J. Comput. Chem. 2011, 32, 1456–1465. [Google Scholar] [CrossRef]
  53. Wyckoff, R.W.G.; Wyckoff, R.W. Crystal Structures; Interscience Publishers: New York, NY, USA, 1963; Volume 1. [Google Scholar]
  54. Corum, K.; Abbaspour Tamijani, A.; Mason, S. Density Functional Theory Study of Arsenate Adsorption onto Alumina Surfaces. Minerals 2018, 8, 91. [Google Scholar] [CrossRef]
Figure 1. (a) Top view of the ( 0001 ) 2 × 2 surface showing 4 and 18 possible adsorption sites on Al and O atoms, respectively. (bf) The positions of Al and O atoms in the unrelaxed and relaxed states for five low-index ( 0001 ), ( 11 2 ¯ 0 ), ( 01 1 ¯ 2 ), ( 10 1 ¯ 1 ), and ( 10 1 ¯ 0 ) surfaces, showing the positions of Al and O atoms in the repeating units of five low-index surfaces before and after relaxation. The diagrams illustrate the atomic configurations in the upper half of the layered structure, with the surface located at the top of each panel. Blue balls represent Al atoms, and red balls represent O atoms.
Molecules 30 02067 g001
Figure 2. Nine adsorption configurations of CO adsorbed on the α -Al2O3 ( 0001 ) surface. Configurations (ad) correspond to CO adsorption at the Al sites, while configurations (ei) represent adsorption at the O sites. Configurations (a,e) feature a vertical adsorption geometry, whereas configurations (bd) and (fi) exhibit a horizontal adsorption orientation. Red and purple balls represent O atoms in α -Al2O3 and CO, respectively; blue balls represent Al atoms, and brown balls represent C atoms. The single-headed arrows indicate the C-O bond length, and the double-headed arrows indicate the distance between the C atom in CO and the surface Al or O atoms.
Molecules 30 02067 g002
Figure 3. PDOS for the interaction between the C atom of CO and the Al atoms of the α -Al2O3 ( 0001 ) surface in (a) Al2O3/12CO and (b) Al2O3/13CO system. The red dashed circles indicate the region where hybridization occurs between the Al 3s and C 2p orbitals in the Al2O3/12CO and Al2O3/13CO systems.
Molecules 30 02067 g003
Figure 4. NCI plots of (a) 12CO and (b) 13CO molecules adsorbed on an α -Al2O3 ( 0001 ) surface. Pink balls represent Al atoms, red balls represent O atoms, and gray balls represent C atoms.
Molecules 30 02067 g004
Figure 5. (ae) Adsorption models of CO on five low-index α -Al2O3 ( 0001 ), ( 01 1 ¯ 2 ), ( 11 2 ¯ 0 ), ( 10 1 ¯ 1 ), and ( 10 1 ¯ 0 ) surfaces. For each surface, the left row shows the initial position of the CO molecule before geometry optimization (top view), while the right row shows the optimized structure after adsorption (side view). Red and purple balls represent O atoms in α -Al2O3 and CO, respectively; blue balls represent Al atoms, and brown balls represent C atoms. The single-headed arrows indicate the C-O bond length, and the double-headed arrows indicate the distance between the C atom in CO and the surface Al or O atoms.
Molecules 30 02067 g005
Figure 6. (a) Diagram illustrates the relationship between surface energy and adsorption enthalpy. (b) Bar diagram shows the relationship between surface energy and the adsorption enthalpy differences of 12CO and 13CO isotopic molecules. The blue, red, yellow, purple, and green points and bars represent the surfaces ( 0001 ), ( 01 1 ¯ 2 ), ( 11 2 ¯ 0 ), ( 10 1 ¯ 1 ), and ( 10 1 ¯ 0 ), respectively.
Molecules 30 02067 g006
Table 1. The surface energy ( E s u r f , J/m2) of low-index α -Al2O3 surfaces.
Reference(0001)( 11 2 ¯ 0)( 01 1 ¯ 2)( 10 1 ¯ 1)( 10 1 ¯ 0)
[30]1.761.86-2.551.40
[32]1.852.39-2.532.44
[33]2.032.501.582.522.23
[35]1.42----
[36]1.54----
[37]1.922.301.16--
This work1.542.362.072.492.65
Table 2. The adsorption enthalpy H a d s and zero-point energy difference E Z P E of CO molecules at nine adsorption sites on an α -Al2O3 ( 0001 ) surface.
Adsorption Site α -Al2O3/CO α -Al2O3/12CO α -Al2O3/13CO
E i n t ( e V ) E Z P E ( e V ) H a d s ( e V ) E Z P E ( e V ) H a d s ( e V )
a−0.65950.0560−0.60350.0543−0.6051
b−0.18130.0187−0.16260.0183−0.1630
c0.01140.01720.02860.01690.0283
d−0.08580.0155−0.07020.0152−0.0705
e−0.62920.0538−0.57540.0524−0.5768
f−0.11650.0357−0.08080.0351−0.0814
g−0.42680.0389−0.38780.0379−0.3889
h−0.141670.0275−0.11410.0269−0.1147
i−0.10510.0230−0.08210.0225−0.0826
Table 3. Valence charge for O and C atoms in CO based on Bader charge analysis.
Adsorption SiteO(e)C(e)CO(e)
a−1.05+1.02−0.03
b−1.11+1.09−0.01
c−1.06+1.04−0.02
d−1.07+1.04−0.03
e−1.07+1.02−0.05
f−1.25+1.17−0.08
g−1.13+1.10−0.03
h−1.10+1.05−0.04
i−1.14+1.12−0.02
Table 4. Adsorption enthalpy of α -Al2O3/12CO and α -Al2O3/13CO systems, including the difference in adsorption enthalpy between α -Al2O3/12CO and α -Al2O3/13CO.
Surface E i n t ( e V ) H a d s ( e V ) H a d s C O H a d s C O 13 (meV)
α -Al2O3/CO α -Al2O3/12CO α -Al2O3/13CO
(0001)−0.659499−0.603479−0.6051661.69
( 01 1 ¯ 2)−0.631939−0.574888−0.5765451.66
( 11 2 ¯ 0)−0.662079−0.591091−0.5929361.85
( 10 1 ¯ 1)−0.511349−0.459618−0.4611321.51
( 10 1 ¯ 0)−0.441109−0.386177−0.3877191.54
Table 5. Zero-point energy correction of the α -Al2O3/12CO and α -Al2O3/13CO systems, including the difference in ZPE between α -Al2O3/12CO and α -Al2O3/13CO.
Surface E Z P E ( e V ) E Z P E C O C O 13 (meV)
α -Al2O3/12CO α -Al2O3/13CO
(0001)0.0560200.0543331.69
( 01 1 ¯ 2)0.0570510.0553941.66
( 11 2 ¯ 0)0.0709880.0691431.85
( 10 1 ¯ 1)0.0549320.0533901.51
( 10 1 ¯ 0)0.0517310.0502171.54
Disclaimer/Publisher’s Note: The statements, opinions and data contained in all publications are solely those of the individual author(s) and contributor(s) and not of MDPI and/or the editor(s). MDPI and/or the editor(s) disclaim responsibility for any injury to people or property resulting from any ideas, methods, instructions or products referred to in the content.

