Article

Structural Investigation and Energy Transfer of Eu3+/Mn4+ Co-Doped Mg3Ga2SnO8 Phosphors for Multifunctional Applications

College of Physics and Electronic Engineering, Qilu Normal University, Jinan 250200, China
Molecules 2025, 30(9), 1945; https://doi.org/10.3390/molecules30091945
Submission received: 29 March 2025 / Revised: 21 April 2025 / Accepted: 24 April 2025 / Published: 27 April 2025

Abstract

In recent years, rare earth ion and transition metal ion co-doped fluorescent materials have attracted a lot of attention in the fields of WLEDs and optical temperature sensing. In this study, I successfully prepared the dual-emission Mg3Ga2SnO8:Eu3+,Mn4+ red phosphors and the XRD patterns and refinement results show that the prepared phosphors belong to the Fd-3m space group. The energy transfer process between Eu3+ and Mn4+ was systematically investigated by emission spectra and decay curves of Mg3Ga2SnO8:0.12Eu3+,yMn4+ (0.002 ≤ y ≤ 0.012) phosphors and the maximum value of transfer efficiency can reach 71.2%. Due to the weak thermal quenching effect of Eu3+, its emission provides a stable reference for the rapid thermal quenching of the Mn4+ emission peak, thereby achieving good temperature measurement performance. The relative thermometric sensitivities of the fluorescence intensity ratio and fluorescence lifetime methods reached a maximum value of 2.53% K−1 at 448 K and a maximum value of 3.38% K−1 at 473 K. In addition, the prepared WLEDs utilizing Mg3Ga2SnO8:0.12Eu3+ phosphor have a high color rendering index of 82.5 and correlated color temperature of 6170 K. The electroluminescence spectrum of the synthesized red LED device by Mg3Ga2SnO8:0.009Mn4+ phosphor highly overlaps with the absorption range of the phytochrome PFR and thus can effectively promote plant growth. Therefore, the Mg3Ga2SnO8:Eu3+,Mn4+ phosphors have good application prospects in WLEDs, temperature sensing, and plant growth illumination.

Graphical Abstract

1. Introduction

Phosphor-converted white LEDs (WLEDs) are widely used in solid-state lighting, liquid crystal displays, and the medical industry because of their high luminous efficiency, long lifetime, and environmental friendliness [1,2]. Currently, the main use of gallium nitride (GaN) or indium gallium nitride (GaInN) is in blue semiconductor chips combined with yellow Y3Al5O12:Ce3+ phosphor to produce white light [3]. However, it is difficult to meet the conditions for high-quality indoor lighting and backlight display due to insufficient red light [4]. Therefore, the development of stable and efficient red phosphors has important research value. In addition, fluorescence thermometry is a method of measuring temperature by utilizing luminescent properties that are responsive to temperature changes. Fluorescence temperature sensors have a series of advantages over other traditional electrical temperature measurement techniques, such as fast response time, high accuracy, and high spatial and temporal resolution [5,6]. In particular, fluorescence intensity ratio (FIR)- and fluorescence lifetime (FL)-based temperature measurement methods have excellent stability and are less susceptible to emission losses and excitation power fluctuations, thus enabling high-precision and high-resolution temperature measurements [7]. Although fluorescent lighting materials for LEDs and fluorescent temperature sensing materials have been heavily investigated, realizing multifunctional applications with the same material is still a great challenge.
Trivalent rare earth Eu3+ ions can be effectively excited by near-ultraviolet (NUV) and blue light due to their special 4f6 shell-layer structure, thus displaying strong red emission, which is caused by the 5D07FJ transitions [8]. Therefore, Eu3+ ions are frequently doped into certain matrix materials as activators to emit vivid and enjoyable red light. In contrast, Mn4+ ions with a 3d3 electronic configuration can exhibit broader excitation and emission bands due to its sensitivity to the coordination environment [9]. The completely different electronic configurations of Eu3+ and Mn4+ result in different temperature dependence of their luminescence intensity [10]. Therefore, Eu3+ and Mn4+ co-doped phosphors are ideal materials for designing a novel optical temperature measurement. In recent years, there have been many reports on Eu3+ and Mn4+ co-doped optical thermometry materials, such as La2LiSbO6:Eu3+,Mn4+ [11], Sr2InTaO6:Eu3+,Mn4+ [12], Ca2GdSbO6:Mn4+,Eu3+ [13], and so on. In addition, the matrix materials are equally important for the photoluminescence and optical thermometry properties of phosphors. Stannate materials are excellent substrates for ions doping due to their excellent stability and unique crystal environment [14]. Mg3Ga2SnO8 (MGS) matrix materials with a cubic structure were first reported by Zhu et al. They constructed MGS substrates based on Mg2TiO4 through a co-substitution strategy of [Ga3+-Ga3+] instead of [Mg2+-Ti4+] and Sn4+ instead of Ti4+ [15]. The results show that the MGS matrix material has stable physicochemical properties and low phonon energy of the optical mode [16]. Therefore, the study of Eu3+ and Mn4+ co-doped MGS phosphors for WLEDs and optical temperature measurement has attracted our attention.
In this work, dual-emission MGS:Eu3+,Mn4+ phosphors with tunable red light emission were successfully prepared. The crystal structure, phase purity, and luminescence properties were comprehensively studied. The results of the X-ray diffractometer (XRD) patterns indicate the successful synthesis of the MGS crystal structure. The systematic analysis of the emission spectra and decay curves of MGS:0.12Eu3+,yMn4+ (0.002 ≤ y ≤ 0.012) illustrates the existence of energy transfer between Eu3+ and Mn4+. The maximum efficiency of energy transfer can reach 71.4%. The temperature sensing properties of the MGS:0.12Eu3+,0.004Mn4+ phosphor were explored in detail based on FIR and FL modes, and higher absolute sensitivity (Sa) and relative sensitivity (Sr) were obtained. Moreover, we further completed the package testing of the phosphors for application in LEDs. In conclusion, MGS:Eu3+,Mn4+ phosphors have potential applications in optical temperature measurement and illumination.

2. Results and Discussion

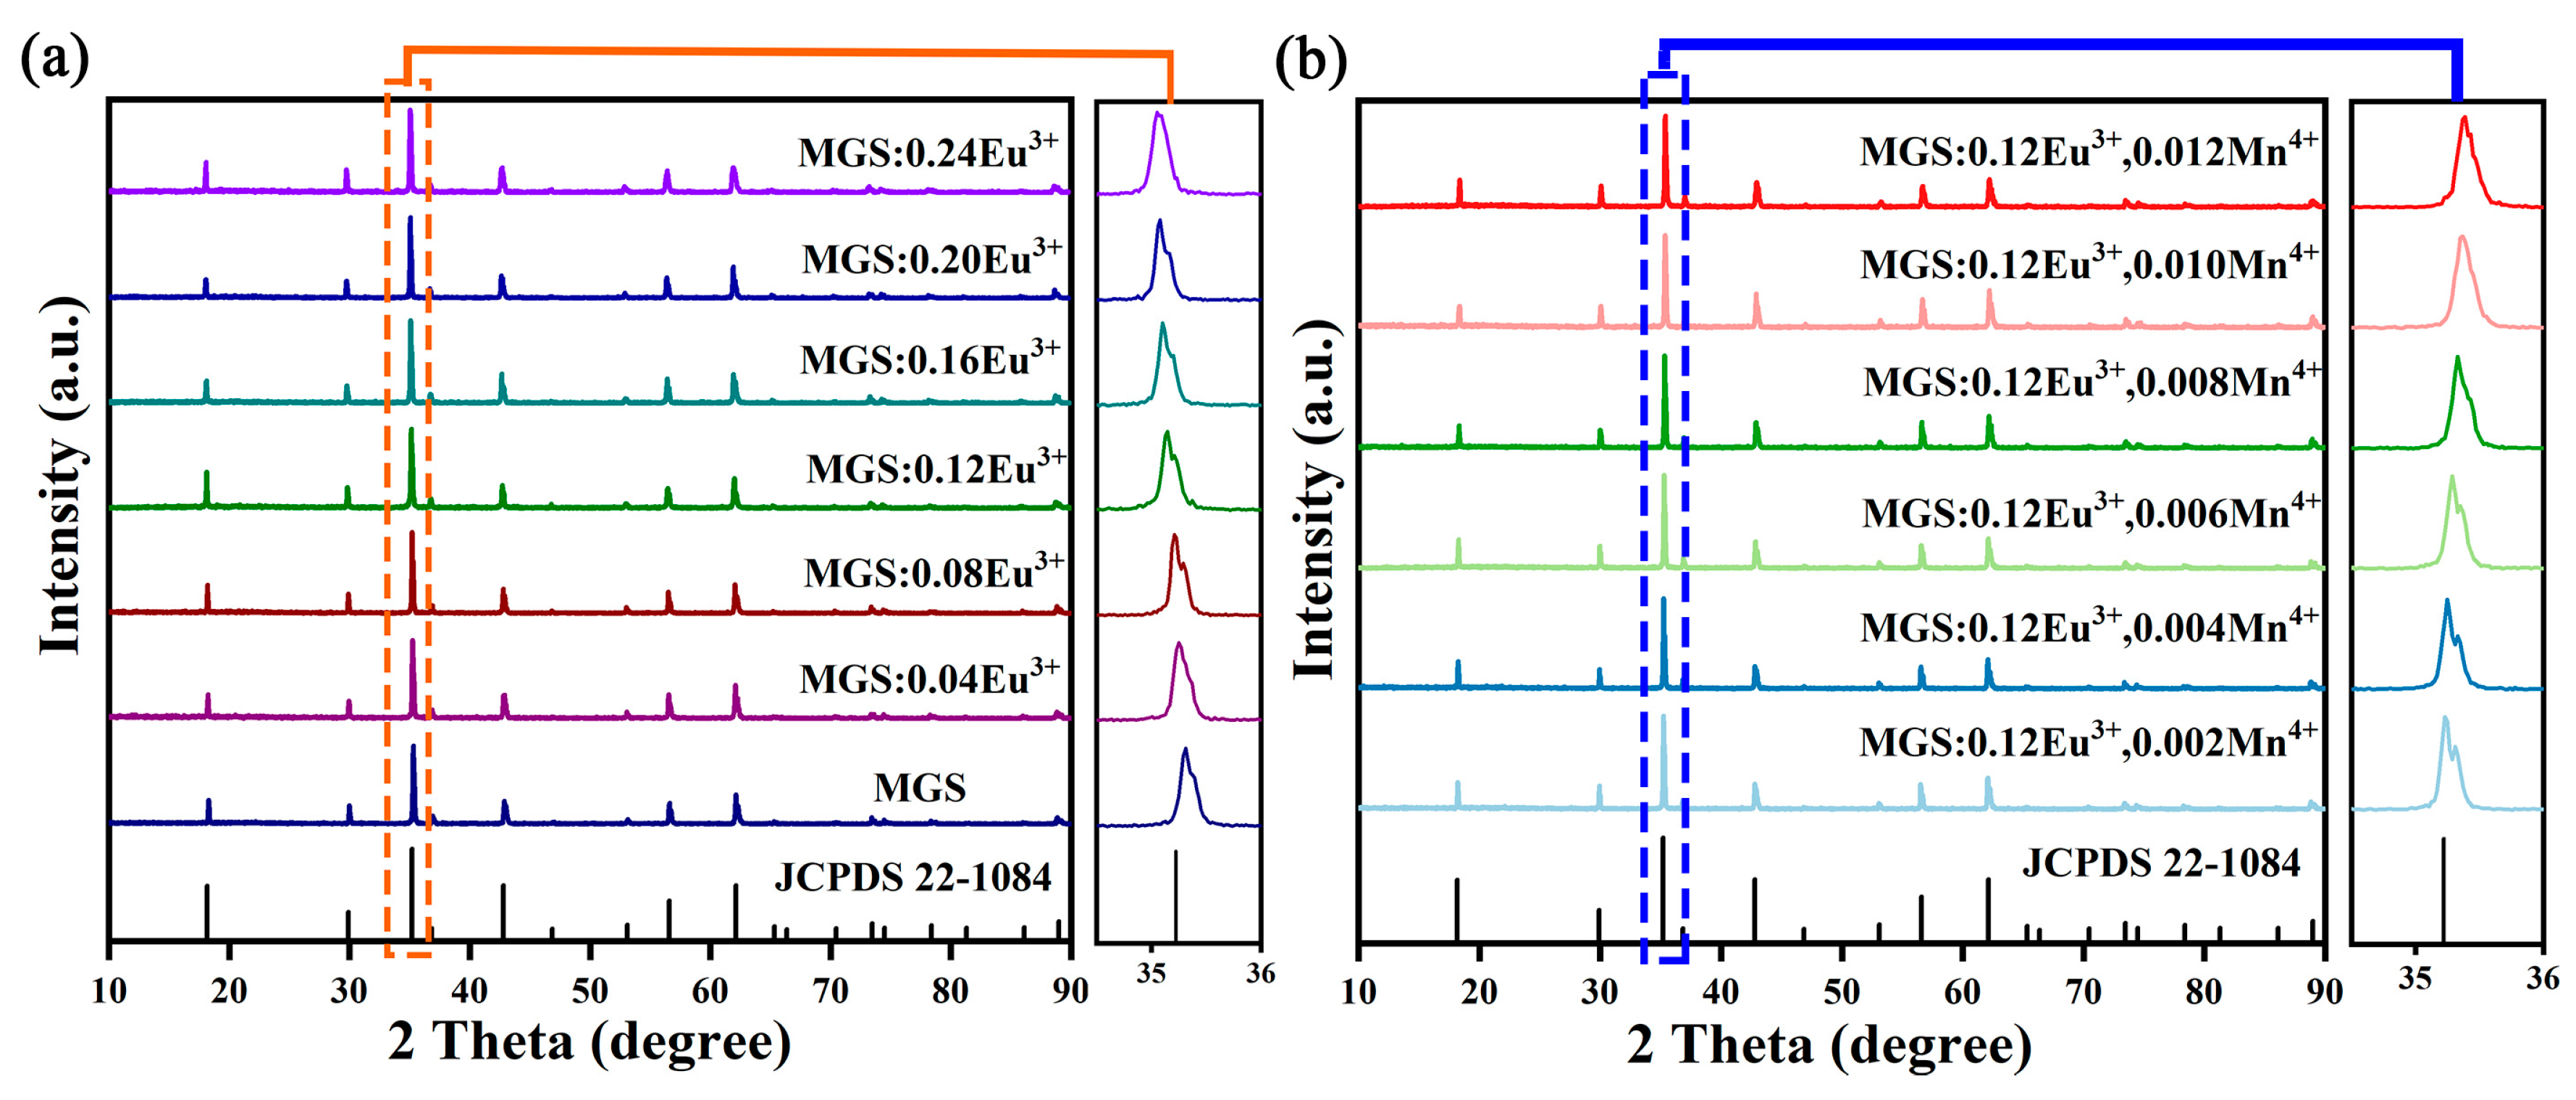
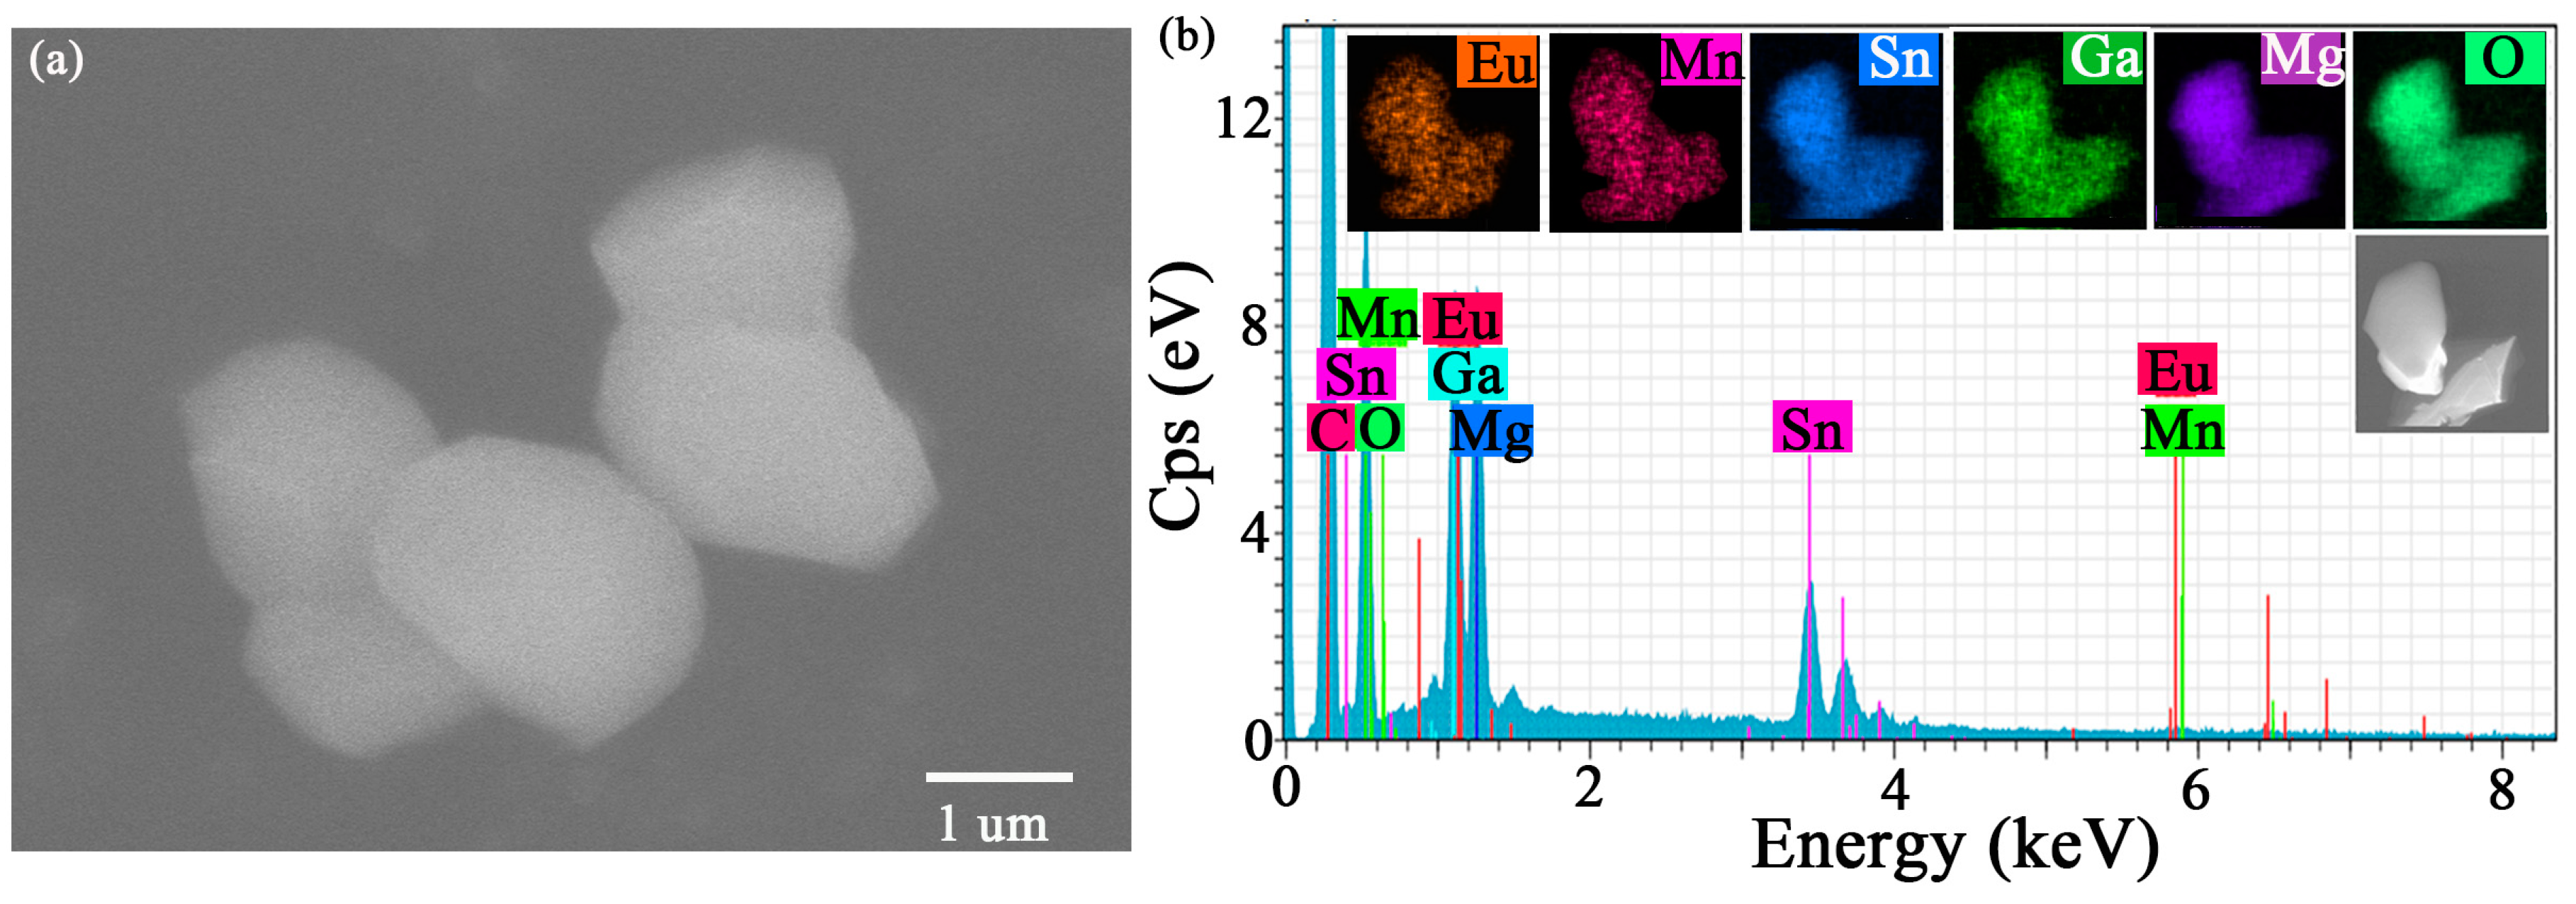
2.1. Crystal Structure

Figure 1a demonstrates the XRD patterns of MGS and MGS:xEu3+ (0.04 ≤ x ≤ 0.24) samples. The XRD diffraction peaks of all the samples were sharp and well matched with the MGS standard card (JCPDS 22-1084), indicating that all the synthesized phosphors were well crystallized and in pure phase. Figure 1b also shows the XRD patterns of Mn4+ and Eu3+ co-doped MGS phosphors and the sharp diffraction peaks of the samples indicate that the prepared phosphor has good crystallinity [17]. In addition, the positions of all the diffraction peaks corresponded to the standard cards of MGS, which further confirmed that the MGS:0.12Eu3+,yMn4+ (0.002 ≤ y ≤ 0.012) phosphors were pure phase. The main diffraction peak is slightly shifted to the left for the MGS:xEu3+ (0.04 ≤ x ≤ 0.24) samples; however, the main diffraction peak is slightly shifted to the right for the MGS:0.12Eu3+,yMn4+ (0.002 ≤ y ≤ 0.012) samples. Such a result comes mainly from the change in the lattice during ion substitution according to the Bragg equation [18]. Considering the radius similarity and charge balance principle, Eu3+ is most likely to take the place of Ga3+ and Mn4+ is most likely to take the place of Sn4+. The corresponding ionic radii of MGS are as follows: Ga3+ (r = 0.86 Å, CN = 6); Sn4+ (r = 0.62 Å, CN = 6); Eu3+ (r = 0.947 Å, CN = 6); and Mn4+ (r = 0.53 Å, CN = 6) [19]. Obviously, the larger radius Eu3+ occupying the Ga3+ site causes the expansion of the cell, while the smaller radius Mn4+ occupying the Sn4+ site causes the contraction of the cell, and thus the angles are shifted in two different directions in the XRD patterns, respectively. In order to further accurately characterize the lattice positions occupied by the dopant ions, the structure of the samples was further refined.
To further investigate the crystal structure data of MGS, MGS:0.12Eu3+ and MGS:0.12Eu3+,0.006Mn4+, the measured XRD result was refined by the EXPGUI version program software of the General Structure Analysis System (GSAS), and the results are shown in Figure 2a–c and Table 1. All refinement fitting parameters—Rp, Rwp, and χ2—converged to low levels, indicating reliable refinement results [20]. Moreover, the cell volume gradually increases from 604.85 Å3 to 605.17 Å3 with the addition of Eu3+ ions and decreases from 604.85 Å3 to 603.27 Å3 with the addition of Mn4+ ions, which further confirms the successful doping of Eu3+ and Mn4+. Figure 2d displays the crystal structure of MGS. There are two kinds of Mg2+ in the crystal structure, one part of Mg(1)2+ combines with eight O2− ions in the form of body-centered cube to form [MgO6] octahedra, and the rest of Mg(2)2+ combines with four O2− ions to form [Mg(2)O4] trihedra. The Mg(1), Ga, and Sn occupy the same position in the lattice and form an octahedral structure with six oxygen atoms. The [Mg(1),Sn,GaO6] and [Mg(2)O4] are alternately connected by sharing oxygen atoms and thus form the basic skeleton of the cubic structure.
The SEM image of MGS:0.12Eu3+,0.004Mn4+ is shown in Figure 3a. As can be seen from the figure, the particles of the MGS:0.12Eu3+,0.004Mn4+ phosphor exhibits irregular shapes without obvious agglomerations, and the particle size distribution ranges from 1 to 2 µm. Figure 3b shows all of the coherent elements in the energy dispersive X-ray (EDX) spectra, and the elemental mass ratios are consistent with the chemical formulas, further demonstrating the successful preparation of the MGS:0.12Eu3+,0.004Mn4+ sample. The elemental mapping of the representative particles is also shown in Figure 3b. The elemental mapping profiles of the representative particles showed that the elements Eu, Mn, Sn, Ga, Mg, and O were uniformly distributed on the particles without significant elemental aggregation, further indicating that Eu3+ ions and Mn4+ ions were successfully doped into the MGS matrix.

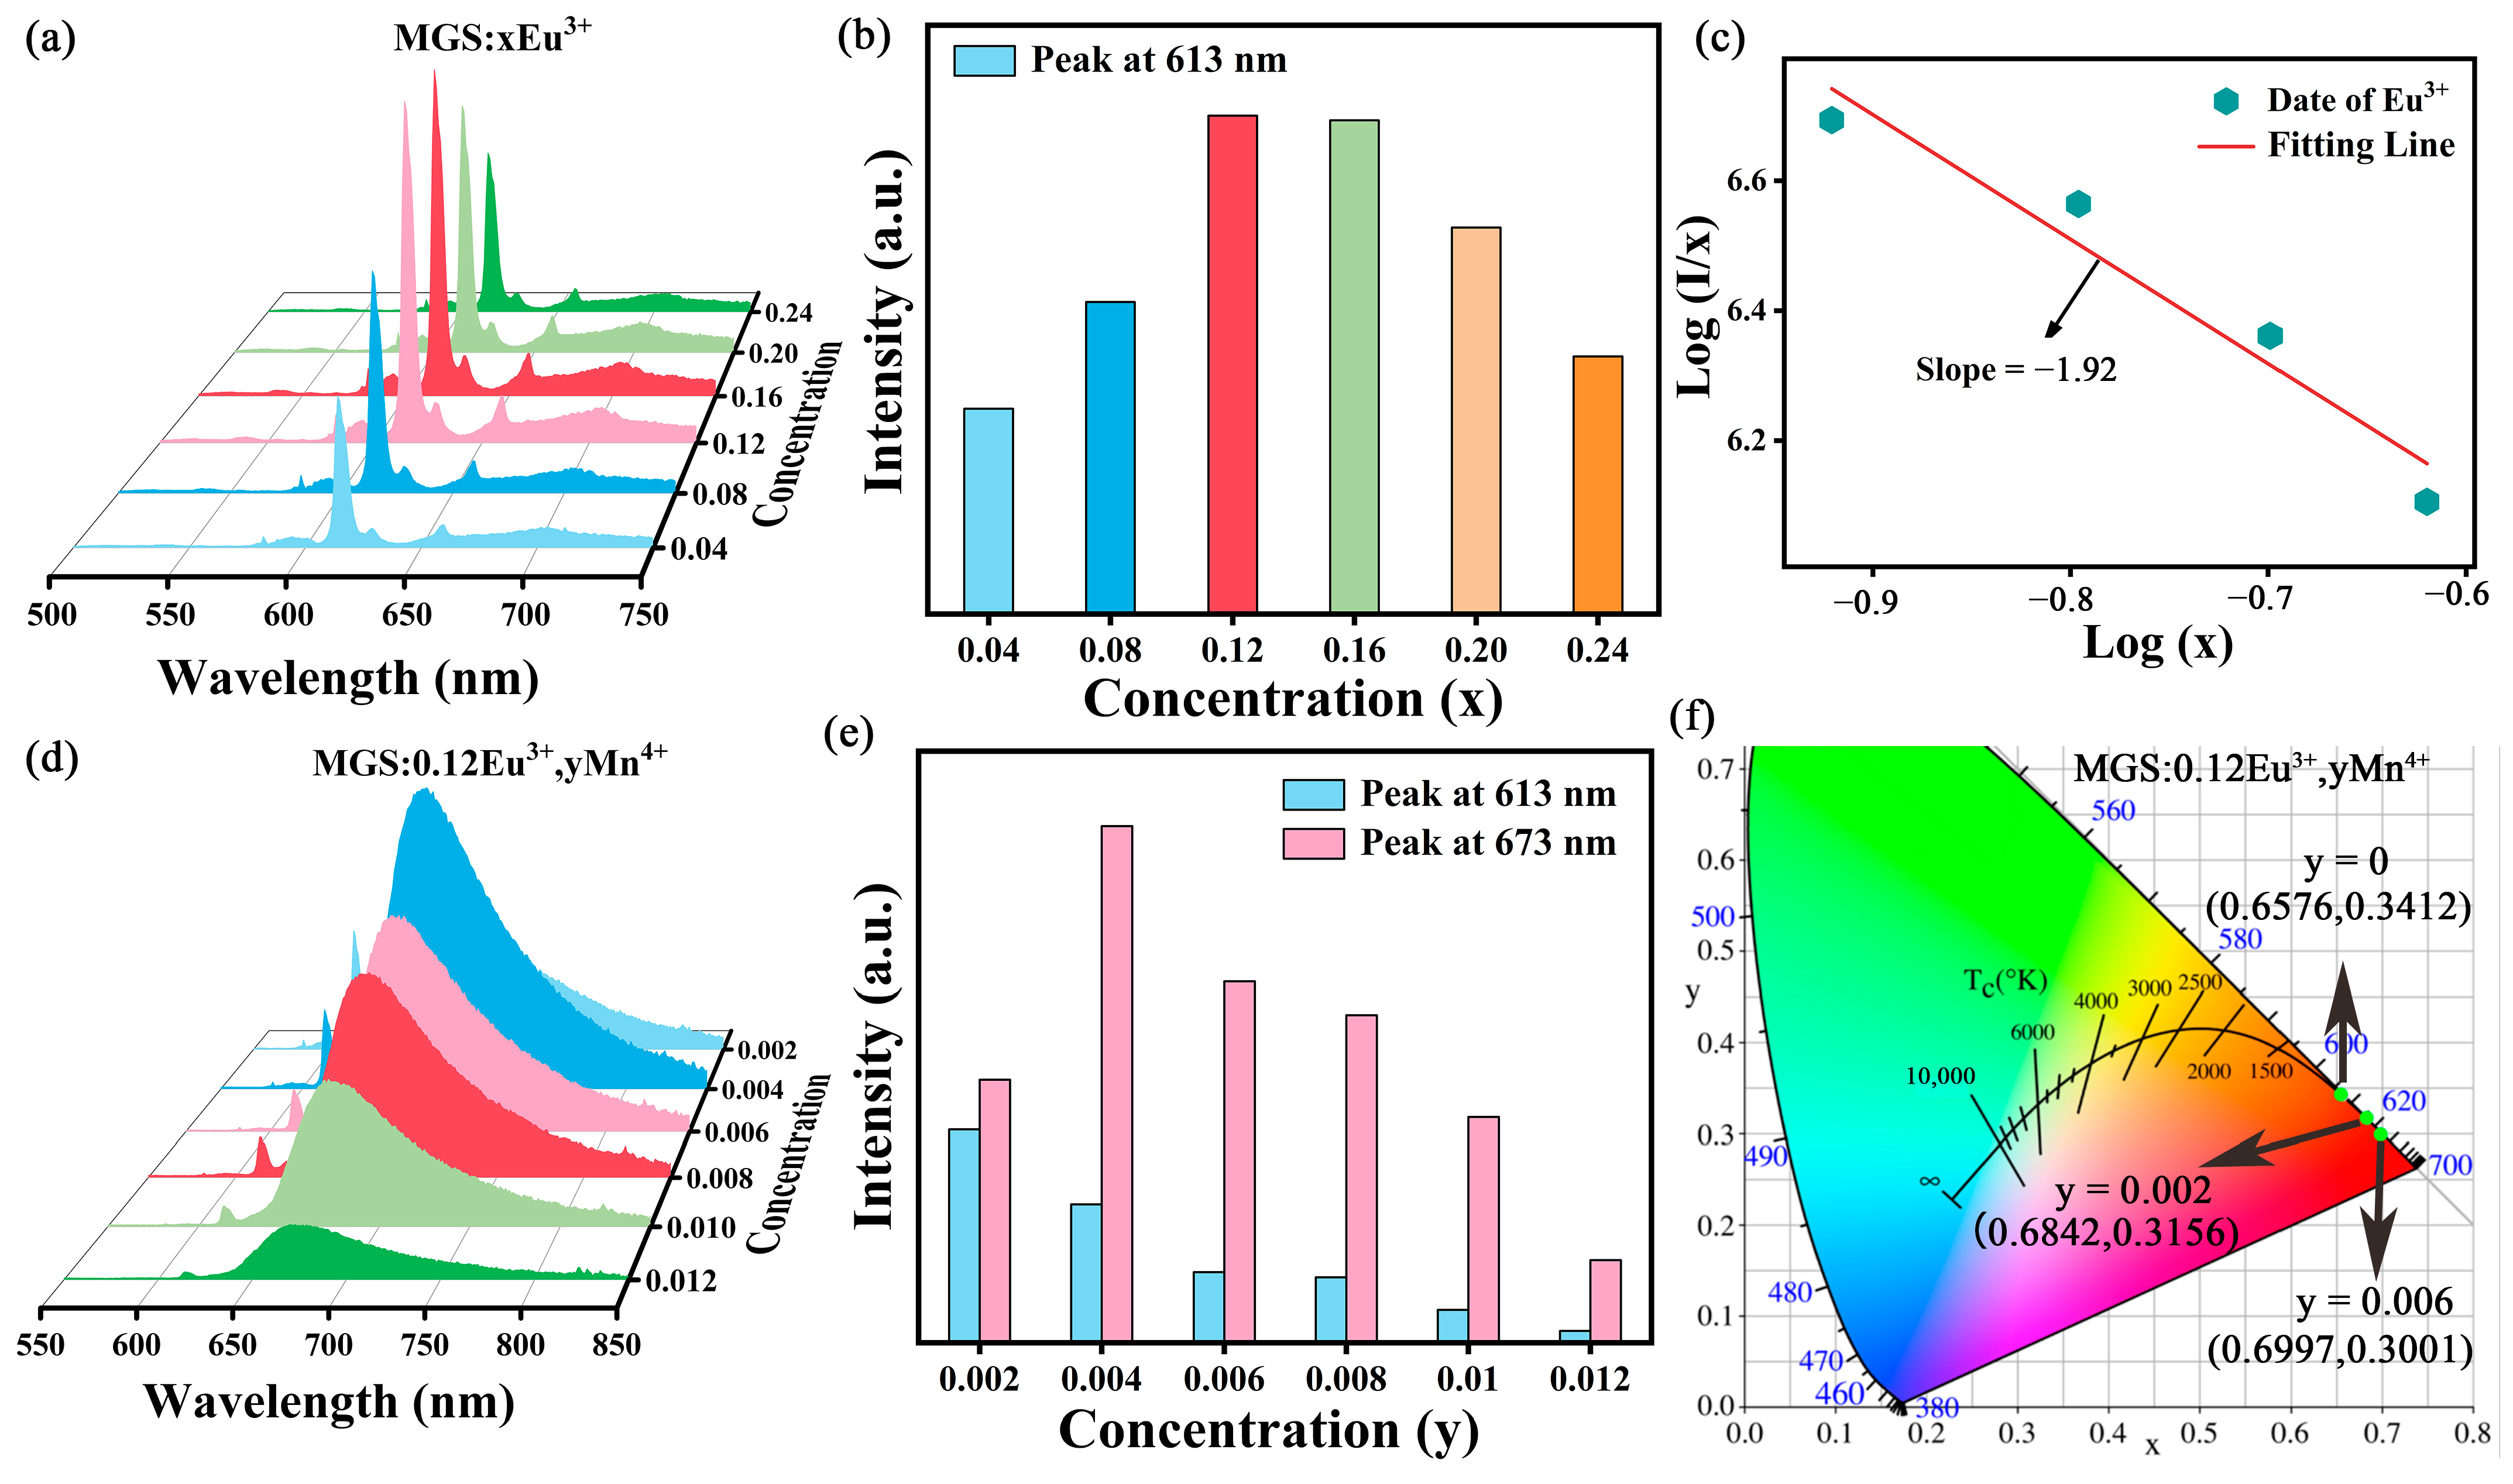
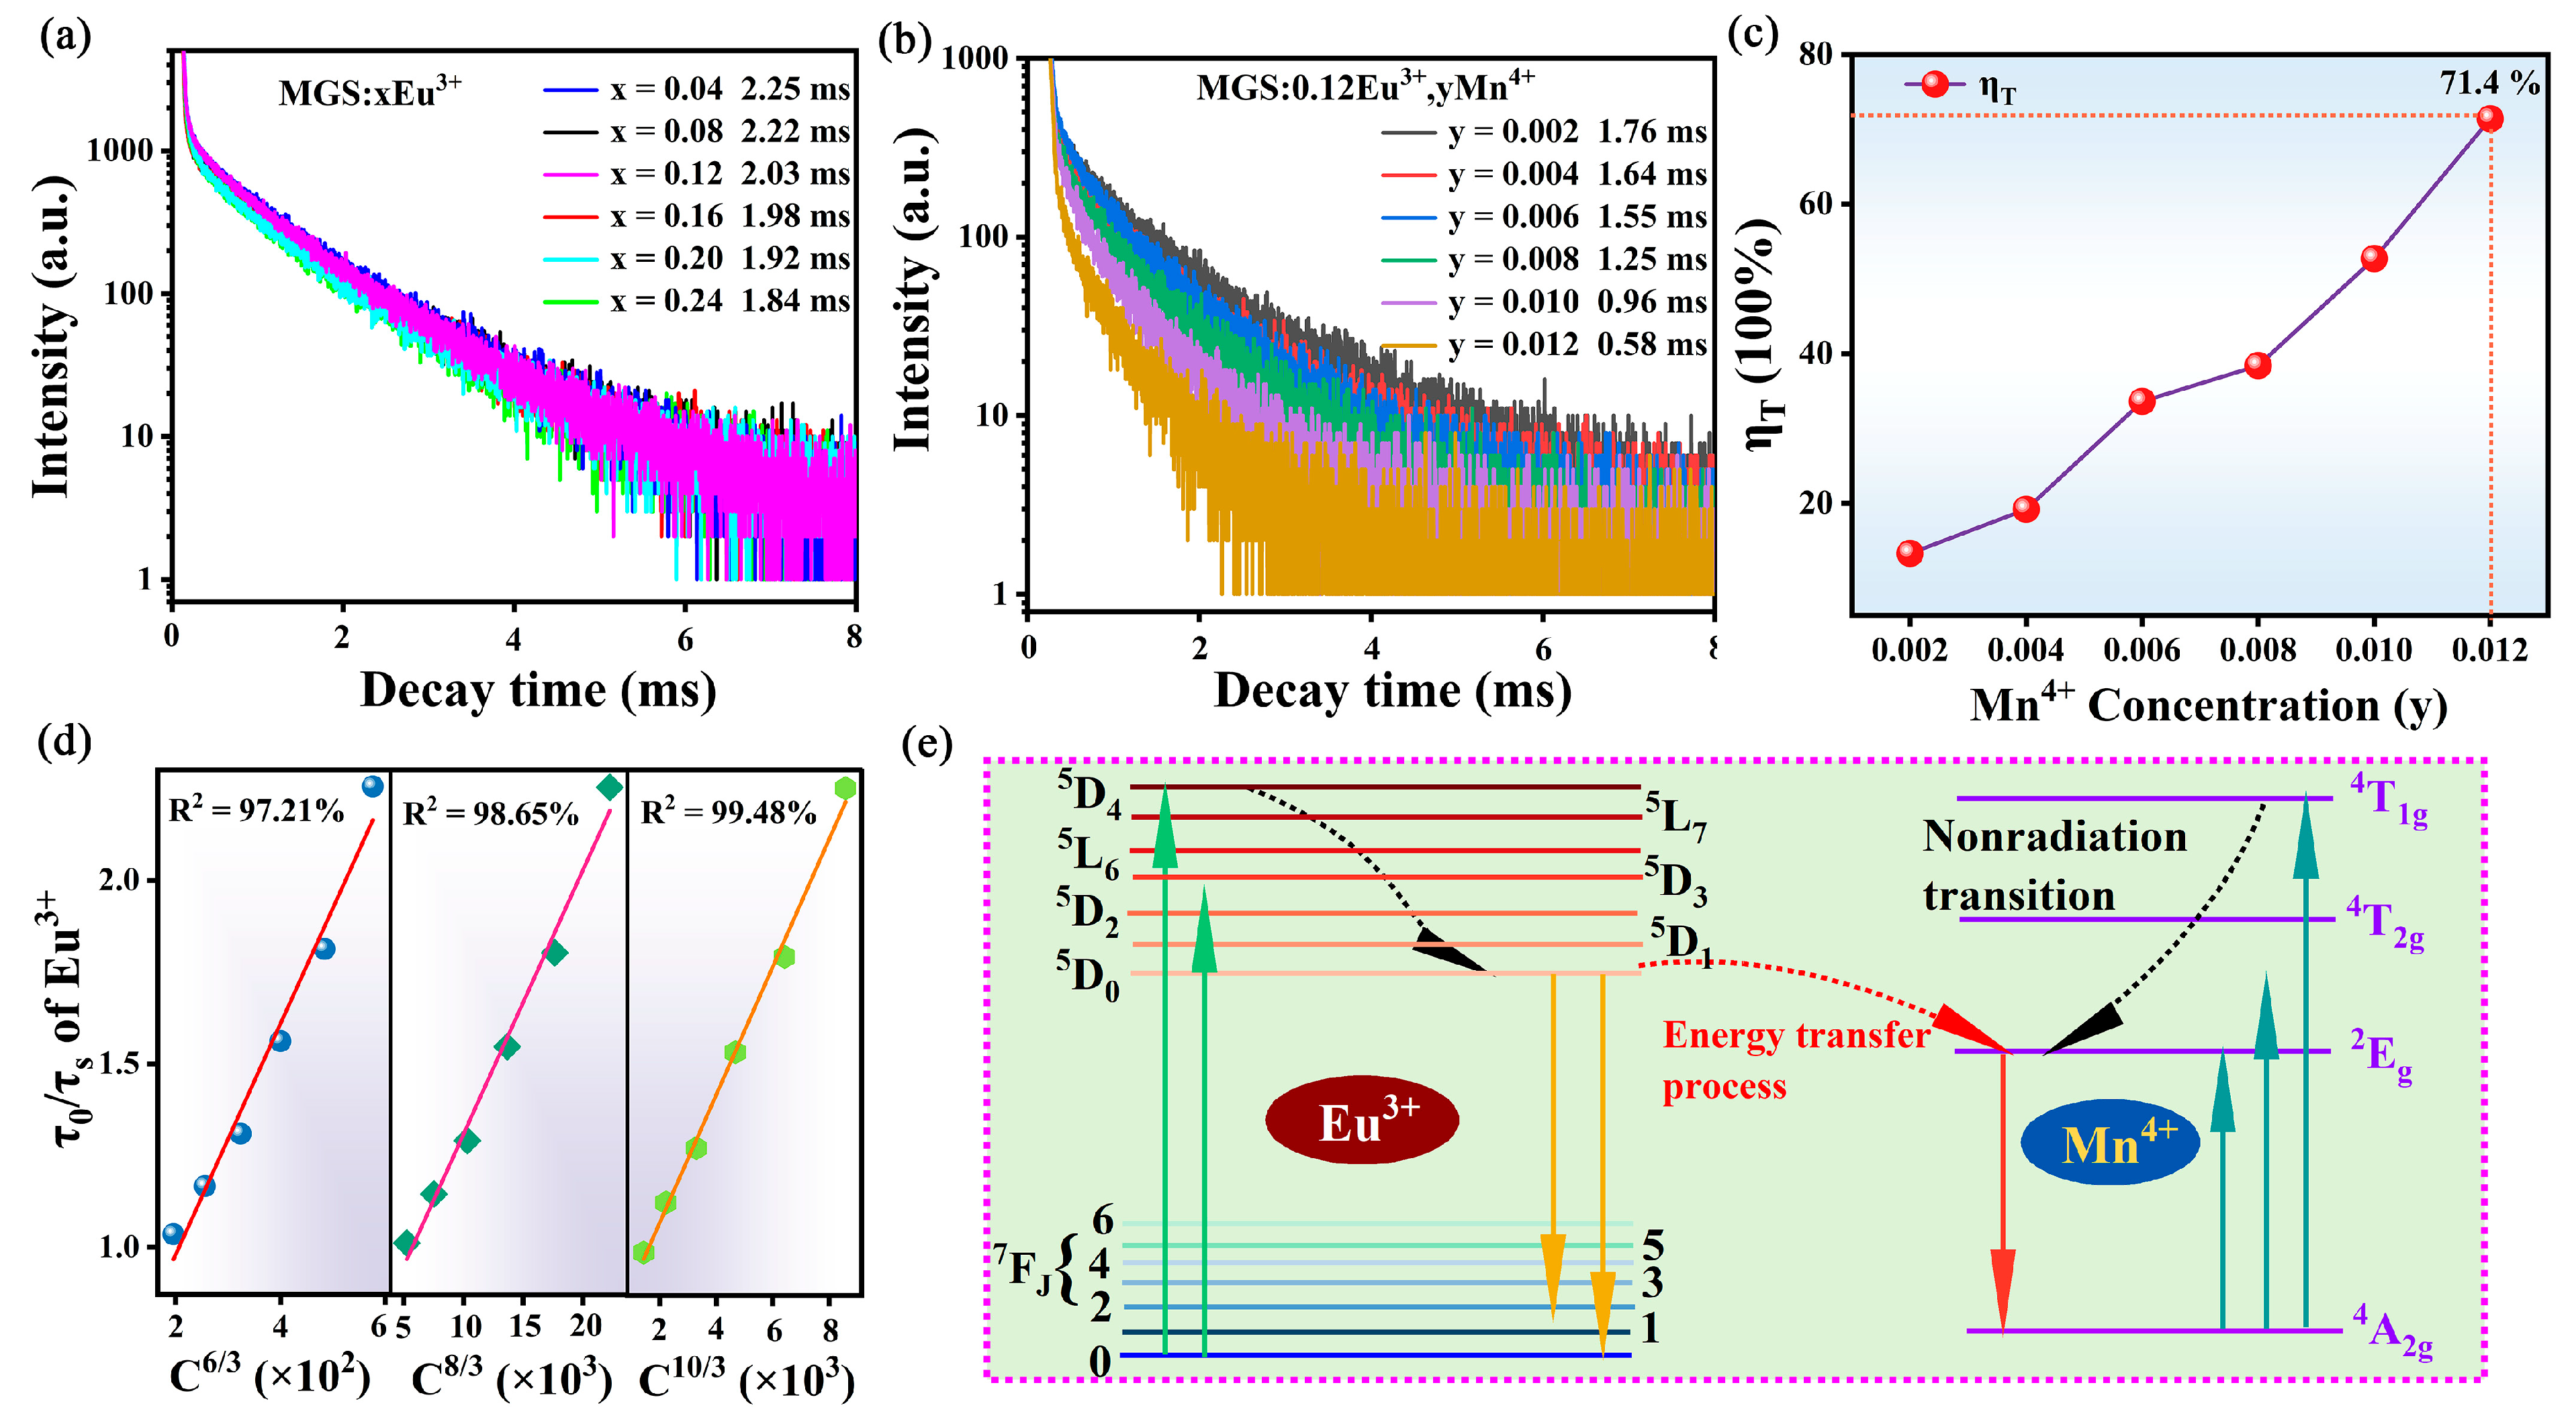
2.2. Optical Properties

Figure 4a shows the diffuse reflectance spectra in the UV-visible range for the MGS matrix and the MGS:0.12Eu3+ and MGS:0.009Mn4+ samples. A highly reflective region appears in the diffuse reflectance curve of the MGS matrix material (350–800 nm) as well as a strong absorption band (200–350 nm). The MGS:0.009Mn4+ sample shows two distinct strong absorption bands corresponding to 4A2-4T1 and 4A2-4T2 transitions [21]. However, the MGS:0.12Eu3+ sample shows several absorption peaks in the UV region, and they all come from the f-f transitions of Eu3+ [22]. In addition, the band gap (Eg) can be calculated according to Kubelka–Munk formula [23]:
[ h ν F ( R ) ] n = A ( h ν E g )
F ( R ) = ( 1 R ) 2 / 2 R
where F(R) represents the absorption coefficient, R denotes the measured diffuse reflection coefficient, denotes photon energy, n = 2 and 1/2 correspond to the direct and indirect bandgaps, respectively, and A is a constant. According to previous reports, MGS has a direct bandgap, so n = 2 [24]. As shown in Figure 4b, the optical bandgap of MGS matrix is estimated to be 4.16 eV based on a linear extrapolation of the function [F(R)hv]2 = 0. The above results indicate that the MGS matrix has a sufficiently large band gap and is a potential matrix material for the preparation of Eu3+ and Mn4+ co-doped samples.
The excitation and emission spectra of MGS:0.12Eu3+ are shown in Figure 5a. The strong absorption of the sample between 200 and 320 nm is from the charge transfer band (CTB) between O2−→Eu3+ [25]. At 362 nm, 381 nm, 394 nm, 416 nm, 466 nm, and 497 nm excitation centers, the Eu3+ ions are sharply excited, and the excitation centers are attributed to the f-f characteristic transitions of the Eu3+ ions (7F05D4, 5L7, 5L6, 5D3, 5D2 and 5D1) [26]. The 7F05D2 transition at 466 nm has the highest intensity, indicating that the MGS:0.12Eu3+ sample can be effectively excited by blue light. The characteristic peaks at 582, 594, 613, 659, and 710 nm in the emission spectrum belong to the 5D07FJ (J = 0, 1, 2, 3 and 4) transitions of Eu3+ [27]. Figure 5b shows the excitation and emission spectra of MGS:0.009Mn4+. The excitation spectrum contains four sets of excitation peaks at 295, 339, 405, and 478 nm after Gaussian split peak fitting. The excitation peak at 295 nm is generated by the CTB from O2-→Mn4+, while the excitation peaks at 339, 405, and 478 nm are generated by the 4A24T1, 2A22T2, and 2A24T2 transitions of Mn4+, respectively [28]. The emission spectrum of MGS:0.009Mn4+ exhibits broadband emission centered at 674 nm from the 2E→4A2 transition [29]. Comparing the excitation spectrum of MGS:0.009Mn4+ sample with the emission range of MGS:0.12Eu3+ phosphor, the overlap between 500 nm and 550 nm suggests the possibility of energy transfer occurring between the Eu3+ ions and the Mn4+ ions. The excitation and emission spectra of MGS:0.12Eu3+,0.004Mn4+ are shown in Figure 5c. The emission spectra are mainly at 613 and 674 nm, where the 613 nm band is characterized by the emission of Eu3+ ions, while the emission at 674 nm is characterized by the emission of Mn4+ ions. Moreover, the characteristic excitation peaks of Eu3+ and Mn4+ are detected in the same emission peaks. The above results suggest that the energy transfer may occur between Eu3+ and Mn4+.
The emission spectra of MGS:xEu3+ (0.04 ≤ x ≤ 0.24) phosphors with different Eu3+ doping concentrations are given in Figure 6a. There is no significant change in the shape and position of the emission peaks with increasing Eu3+ doping concentration. Figure 6b shows the variation in luminescence intensity, and the luminescence intensity reaches the highest when the doping concentration of Eu3+ is increased to 0.12, and after that, the luminescence intensity of Eu3+ gradually decreases due to the concentration quenching. Based on Dexter’s theory, the mechanism of multipolar interactions was determined by the following equation [30]:
I x = K 1 + β x Q / 3 1
where K and β are substrate-related constants. Q = 6, 8, or 10 correspond to dipole–dipole (d-d), dipole–quadrupole (d-q), and quadrupole–quadrupole (q-q) interactions [31]. The lg(I/x)~lg(x) relationship for MGS:xEu3+ phosphors is illustrated in Figure 6c, and the linear fit yields a slope of −1.92, so Q = 5.76, implying that d-d interaction is the main mechanism leading to concentration quenching.
Figure 6d shows the emission spectra of MGS:0.12Eu3+,yMn4+ (0.002 ≤ y ≤ 0.012) samples. Figure 6e shows the variation in normalized emission intensity of MGS:0.12Eu3+,yMn4+ (0.002 ≤ y ≤ 0.012). As the concentration of Mn4+ increases, the emission intensity of Eu3+ at 613 nm shows a monotonically decreasing trend, whereas the emission intensity of Mn4+ at 673 nm first gradually increases and then decreases. This result comes from the enhancement of energy transfer between Eu3+ and Mn4+ with the increase of Mn4+ doping concentration [32] and the decrease in strength of Mn4+ mainly comes from the concentration quenching of Mn4+. To further investigate the multicolor tunable emission in MGS:0.12Eu3+,yMn4+ (0.002 ≤ y ≤ 0.012) phosphors, the CIE coordinates of MGS:0.12Eu3+,yMn4+ (0.002 ≤ y ≤ 0.012) phosphors were plotted in Figure 6f, from which a color change in the CIE coordinates from red to deep red can be clearly observed. At the same time, the color coordinates of all the samples are at the edge of the coordinate chart, indicating that the samples have very high color purity of light emission, which provides the conditions for the later LED packaging application.
Figure 7a shows the decay curves of MGS:xEu3+ (0.04 ≤ x ≤ 0.24) samples. The value of fluorescence lifetime can be obtained by fitting a double exponential equation as follows [33]:
I = I 0 + A 1 exp ( t / τ 1 ) + A 2 exp ( t / τ 2 )
The average lifetime of a sample can be calculated using the following formula [34]:
τ = ( A 1 τ 1 2 + A 2 τ 2 2 ) / ( A 1 τ 1 + A 2 τ 2 )
where τ1 and τ2 represent the fast and slow parts of the lifetime, It denotes the integrated emission intensity at time t, and A1 and A2 are constants, respectively. The average lifetime of MGS:xEu3+ (0.04 ≤ x ≤ 0.24) decreases monotonically from 2.25 ms to 1.84 ms as the Eu3+ doping increases from 0.04 to 0.24. The main reasons for the lifetime attenuation are that the spacing between dopant ions decreases with increasing concentration, leading to the enhanced probability of non-radiative transitions [35]. To further demonstrate the occurrence of energy transfer, the fluorescence decay curves of Eu3+ ions in MGS:0.12Eu3+,yMn4+ (0.002 ≤ y ≤ 0.012) are shown in Figure 7b. The average lifetimes τ of MGS:0.12Eu3+,yMn4+ (0.002 ≤ y ≤ 0.012) were calculated from Equation (6) as 1.76, 1.64, 1.55, 1.25, 0.96, and 0.58 ms. Such results provide further evidence that energy transfer from Eu3+ ions to Mn4+ ions occurs in MGS:0.12Eu3+,yMn4+ (0.002 ≤ y ≤ 0.012) samples. The following equation can be used to analyze the energy transfer efficiency [36]:
η T = 1 τ S / τ S 0
where τS and τS0 are the fluorescence lifetimes of Eu3+ at single doping and co-doping, respectively. Figure 7c demonstrates the relationship between the Mn4+ ion concentration and the energy transfer efficiency. The energy transfer efficiency reaches 71.4% at the Mn4+ ion doping concentration of 0.012. The multipole–multipole interactions can be used to analyze energy transfer mechanism according to Dexter’s theory [37]:
τ S 0 / τ S C n / 3
where C is the total doping concentration of Eu3+ and Mn4+ ions and n is 6, 8, and 10 corresponding to the three types of interactions: d-d, d-q, and q-q interactions, respectively. The best linear fit value of n is 10 and the correlation fitting exponent R2 is 0.9948, as shown in Figure 7d. This result suggests that the energy transfer mechanism between Eu3+ ions and Mn4+ ions in the MGS:0.12Eu3+,yMn4+ (0.002 ≤ y ≤ 0.012) samples is mainly a q-q interaction. Figure 7e displays the schematic diagram of Eu3+ to Mn4+ in the MGS matrix. When MGS:0.12Eu3+,yMn4+ (0.002 ≤ y ≤ 0.012) samples were excited by blue light, the ground state electrons of Eu3+ ions were lifted to higher excited states. After that, the excited state electrons of Eu3+ rapidly relax radiationally to a lower excited state. Then, some of the electrons radiatively return from 5D0 to 7FJ (J = 0, 1, 2, 3, 4 and 5), releasing the characteristic emission of Eu3+. The other excited state electrons come to the excited state of Mn4+ through an energy transfer process, and then leap back to the 4A2 state, releasing the characteristic emission of Mn4+.
Thermal stability is an important parameter for evaluating luminescent performance and commercial availability. The temperature-dependent emission spectra and relative emission contour spectra of the MGS:0.12Eu3+ phosphor are displayed in Figure 8a,b and the temperature-dependent emission spectra and relative emission contour spectra of the MGS:0.009Mn4+ phosphor at different temperatures are displayed in Figure 8c,d. The peak shape and peak position of the MGS:0.12Eu3+ and MGS:0.009Mn4+ phosphors remained essentially unchanged with increasing temperature. Luminous intensity will be reduced accordingly and the temperature increase will intensify the phosphor luminescence center electron non-radiative transition. Figure 8e displays the normalized intensity plots of the characteristic emission peaks of Eu3+ (613 nm) in the MGS:0.12Eu3+ sample and Mn4+ (673 nm) in the MGS:0.009Mn4+ as the function of temperature. The emission intensity of the MGS:0.12Eu3+ phosphor at 423 K can still maintain 91.84% of the highest emission intensity at room temperature, which is superior to the majority of the reported Eu3+-activated red phosphors, such as: Sr2LaNbO6:Eu3+ (62.99%@423 K) [38], Ba2GdSbO6:0.5Eu3+ (79.27%@423 K) [39], and Li6SrLa2Nb2O12:Eu3+ (82.25%@423 K) [40]. The result suggests that the synthesized MGS:0.12Eu3+ is a promising red phosphor that is expected to be applied in WLEDs for lighting. In comparison, MGS:0.009Mn4+ phosphor exhibits poor thermal stability. In addition, the activation energy (Ea) can be calculated using the Arrhenius equation [41]:
I ( T ) = I 0 1 + c e x p ( ( E a / k T ) )
where I0 denotes the luminous intensity of the phosphor at room temperature, I(T) denotes the luminous intensity of the phosphor at different temperatures, c is a constant, k is Boltzmann’s constant, and T is the temperature of the test environment. Figure 8f shows the linear fit of ln[(I0/I)-1] versus 1/kT for the MGS:0.12Eu3+ and MGS:0.009Mn4+ samples. According to the slopes of linear fit, the value of Ea for MGS:0.009Mn4+ is 0.340 eV, while the value of Ea for MGS:0.12Eu3+ is 0.382 eV.
To further explain the process of thermal quenching, bit pattern coordinate diagrams can be used. As shown in Figure 9a, the electrons in the 7FJ state are excited to the 5DJ, 5L6, or CTB states excited by UV or blue light. After non-radiative relaxation of electrons from the upper excited state to the 5D0 state, most of the electrons will radiatively jump from the 5D0 state to the ground state 7FJ and then emit red light. At room temperature, most electrons in the CTB state can overcome the energy potential barrier to reach the 5D0 state under electron–phonon coupling and then radiatively jump to the ground state 7FJ. As the temperature increases, electrons in the excited state may overcome the low-energy potential barrier with phonon assistance, reach the intersection with the ground state from the excited state, and then non-radiatively relax to the ground state equilibrium position, resulting in thermal quenching [42]. As shown in Figure 9b, when Mn4+ is excited by UV light, electrons are pushed from the ground state (4A2) to the first excited level (2E) and higher excited states (4T2 or 4T1). At room temperature, electrons in higher excited states drop to the first excited state (2E) via nonradiative relaxation, and subsequently to the ground state (4A2) with radiative relaxation with a deep red emission. However, with the influence of phonon interaction at high temperatures, electrons in the first excited state (2E) can be thermally generated and released through the crossing point between 4T2 and 4A2 by nonradiative relaxation in the configuration coordinate diagram, leading to the formation of the thermal quenching phenomenon.

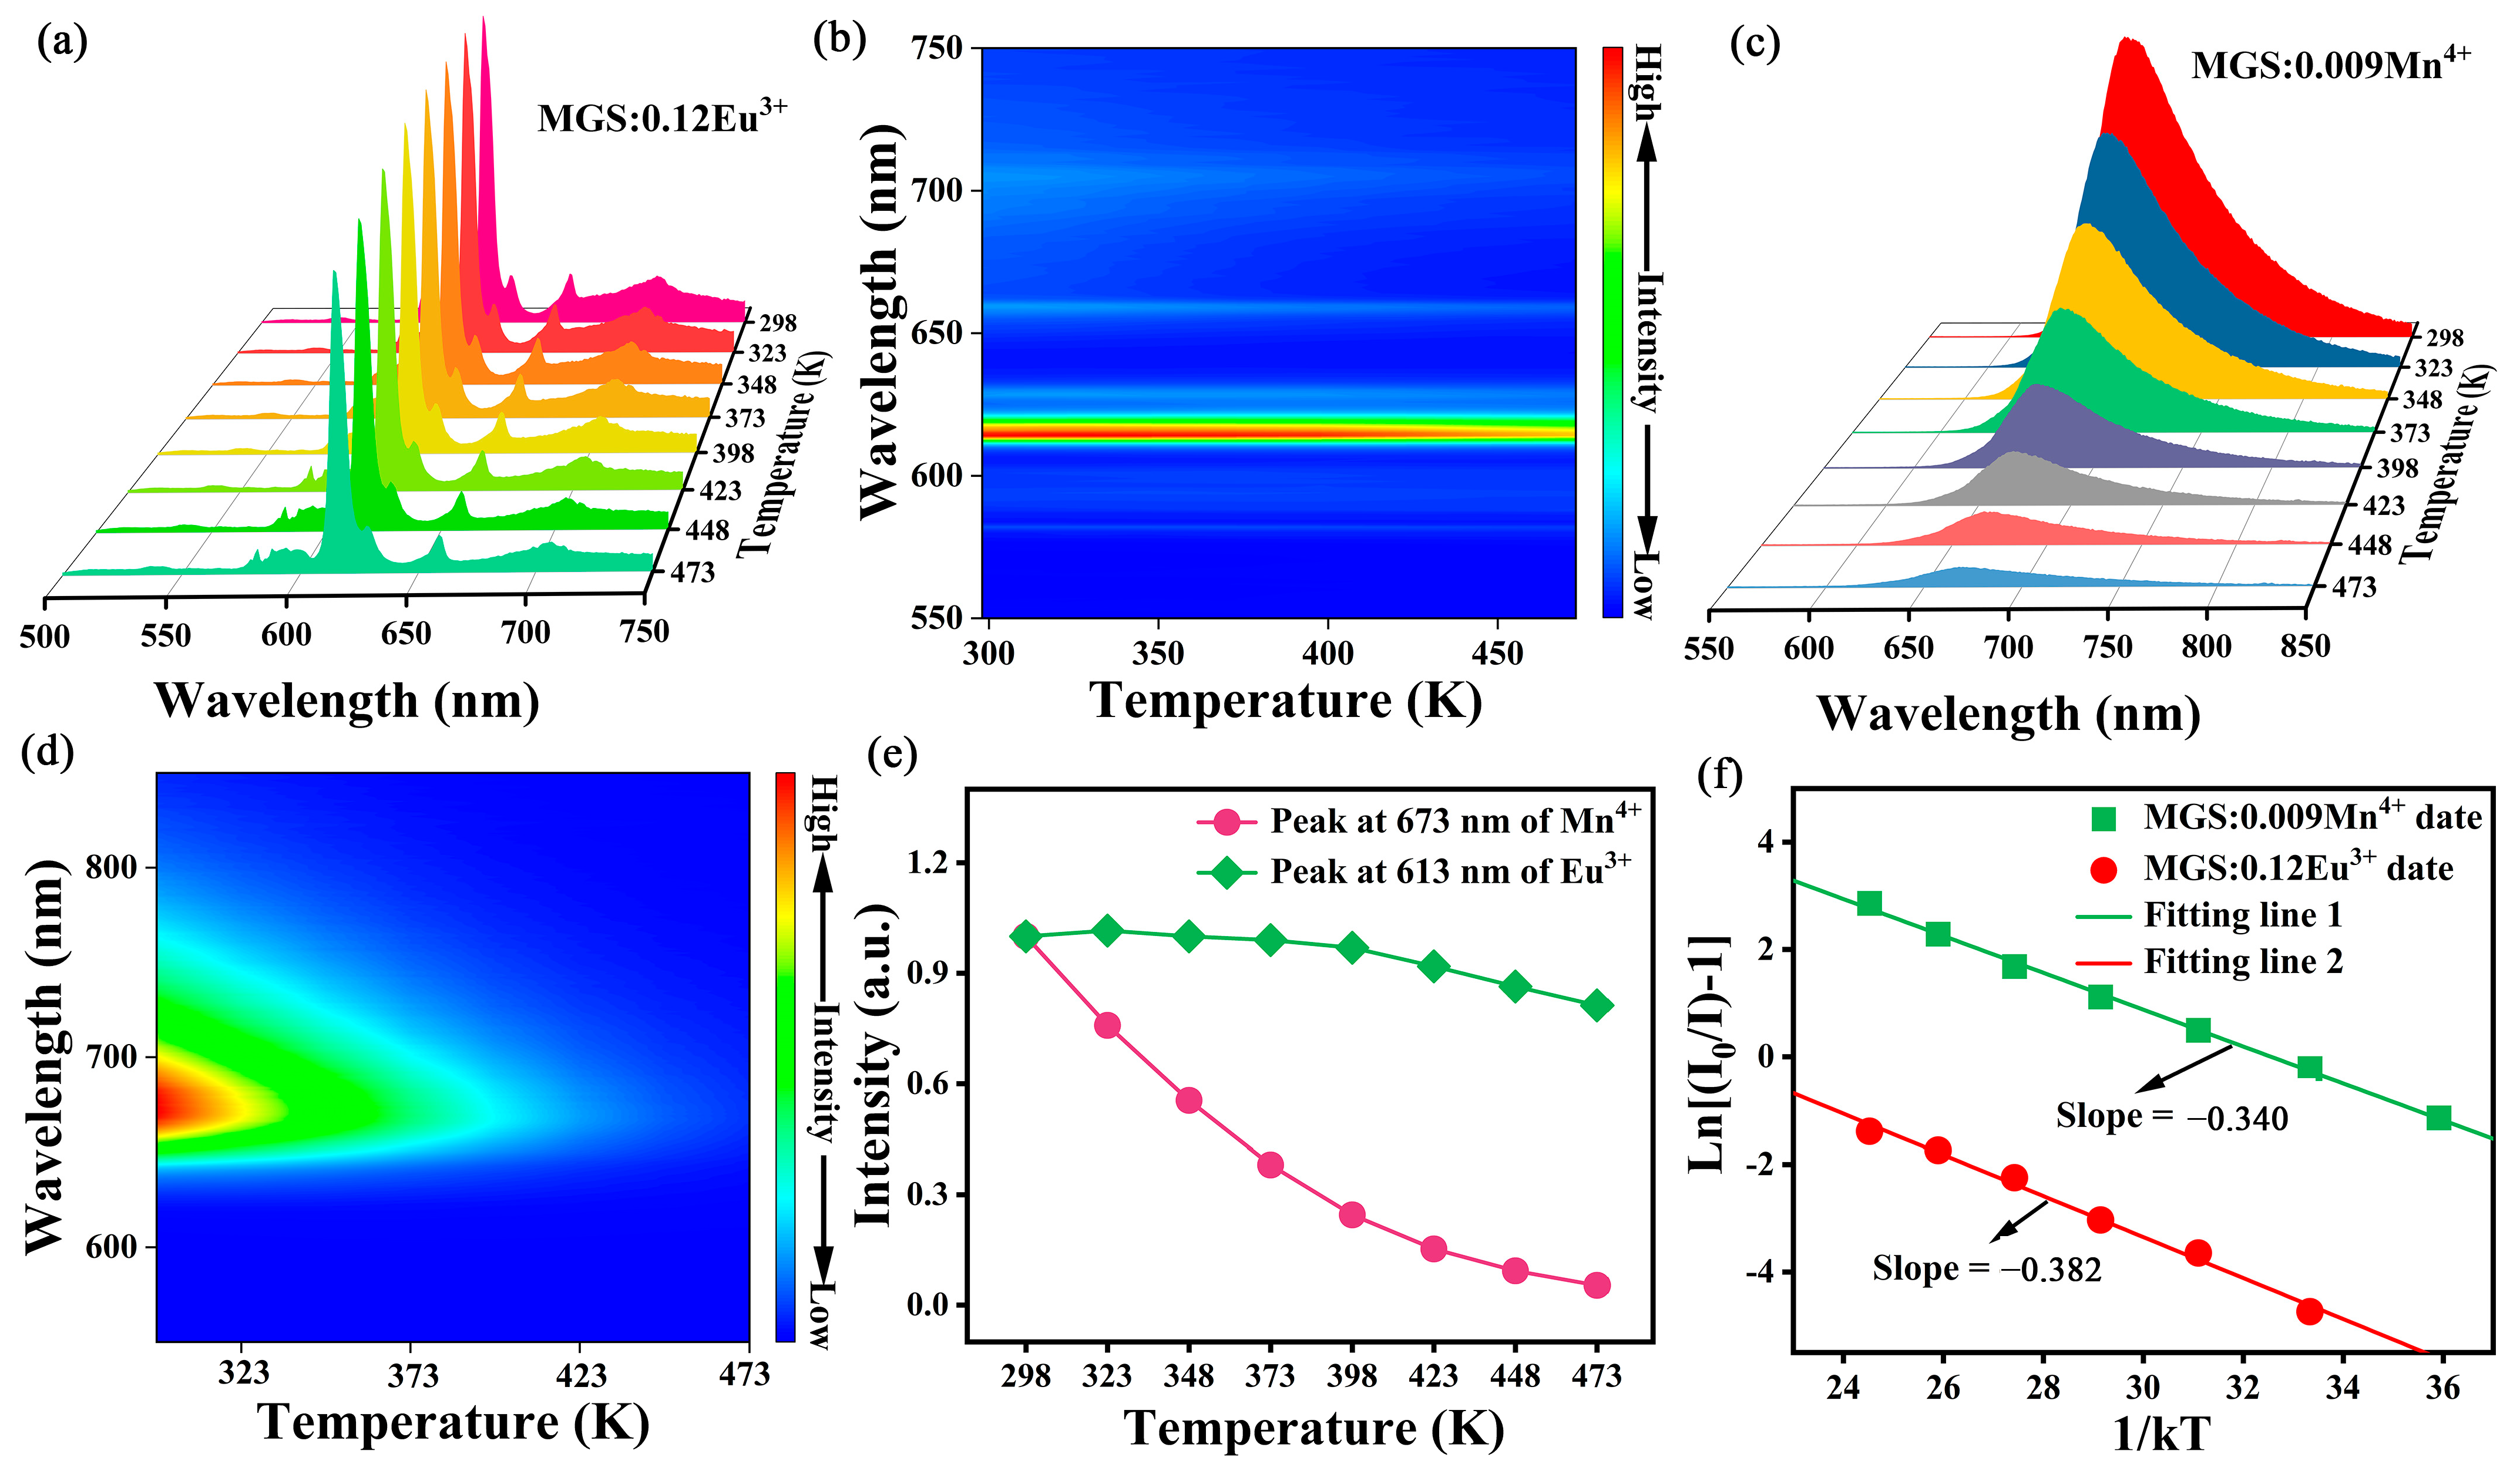
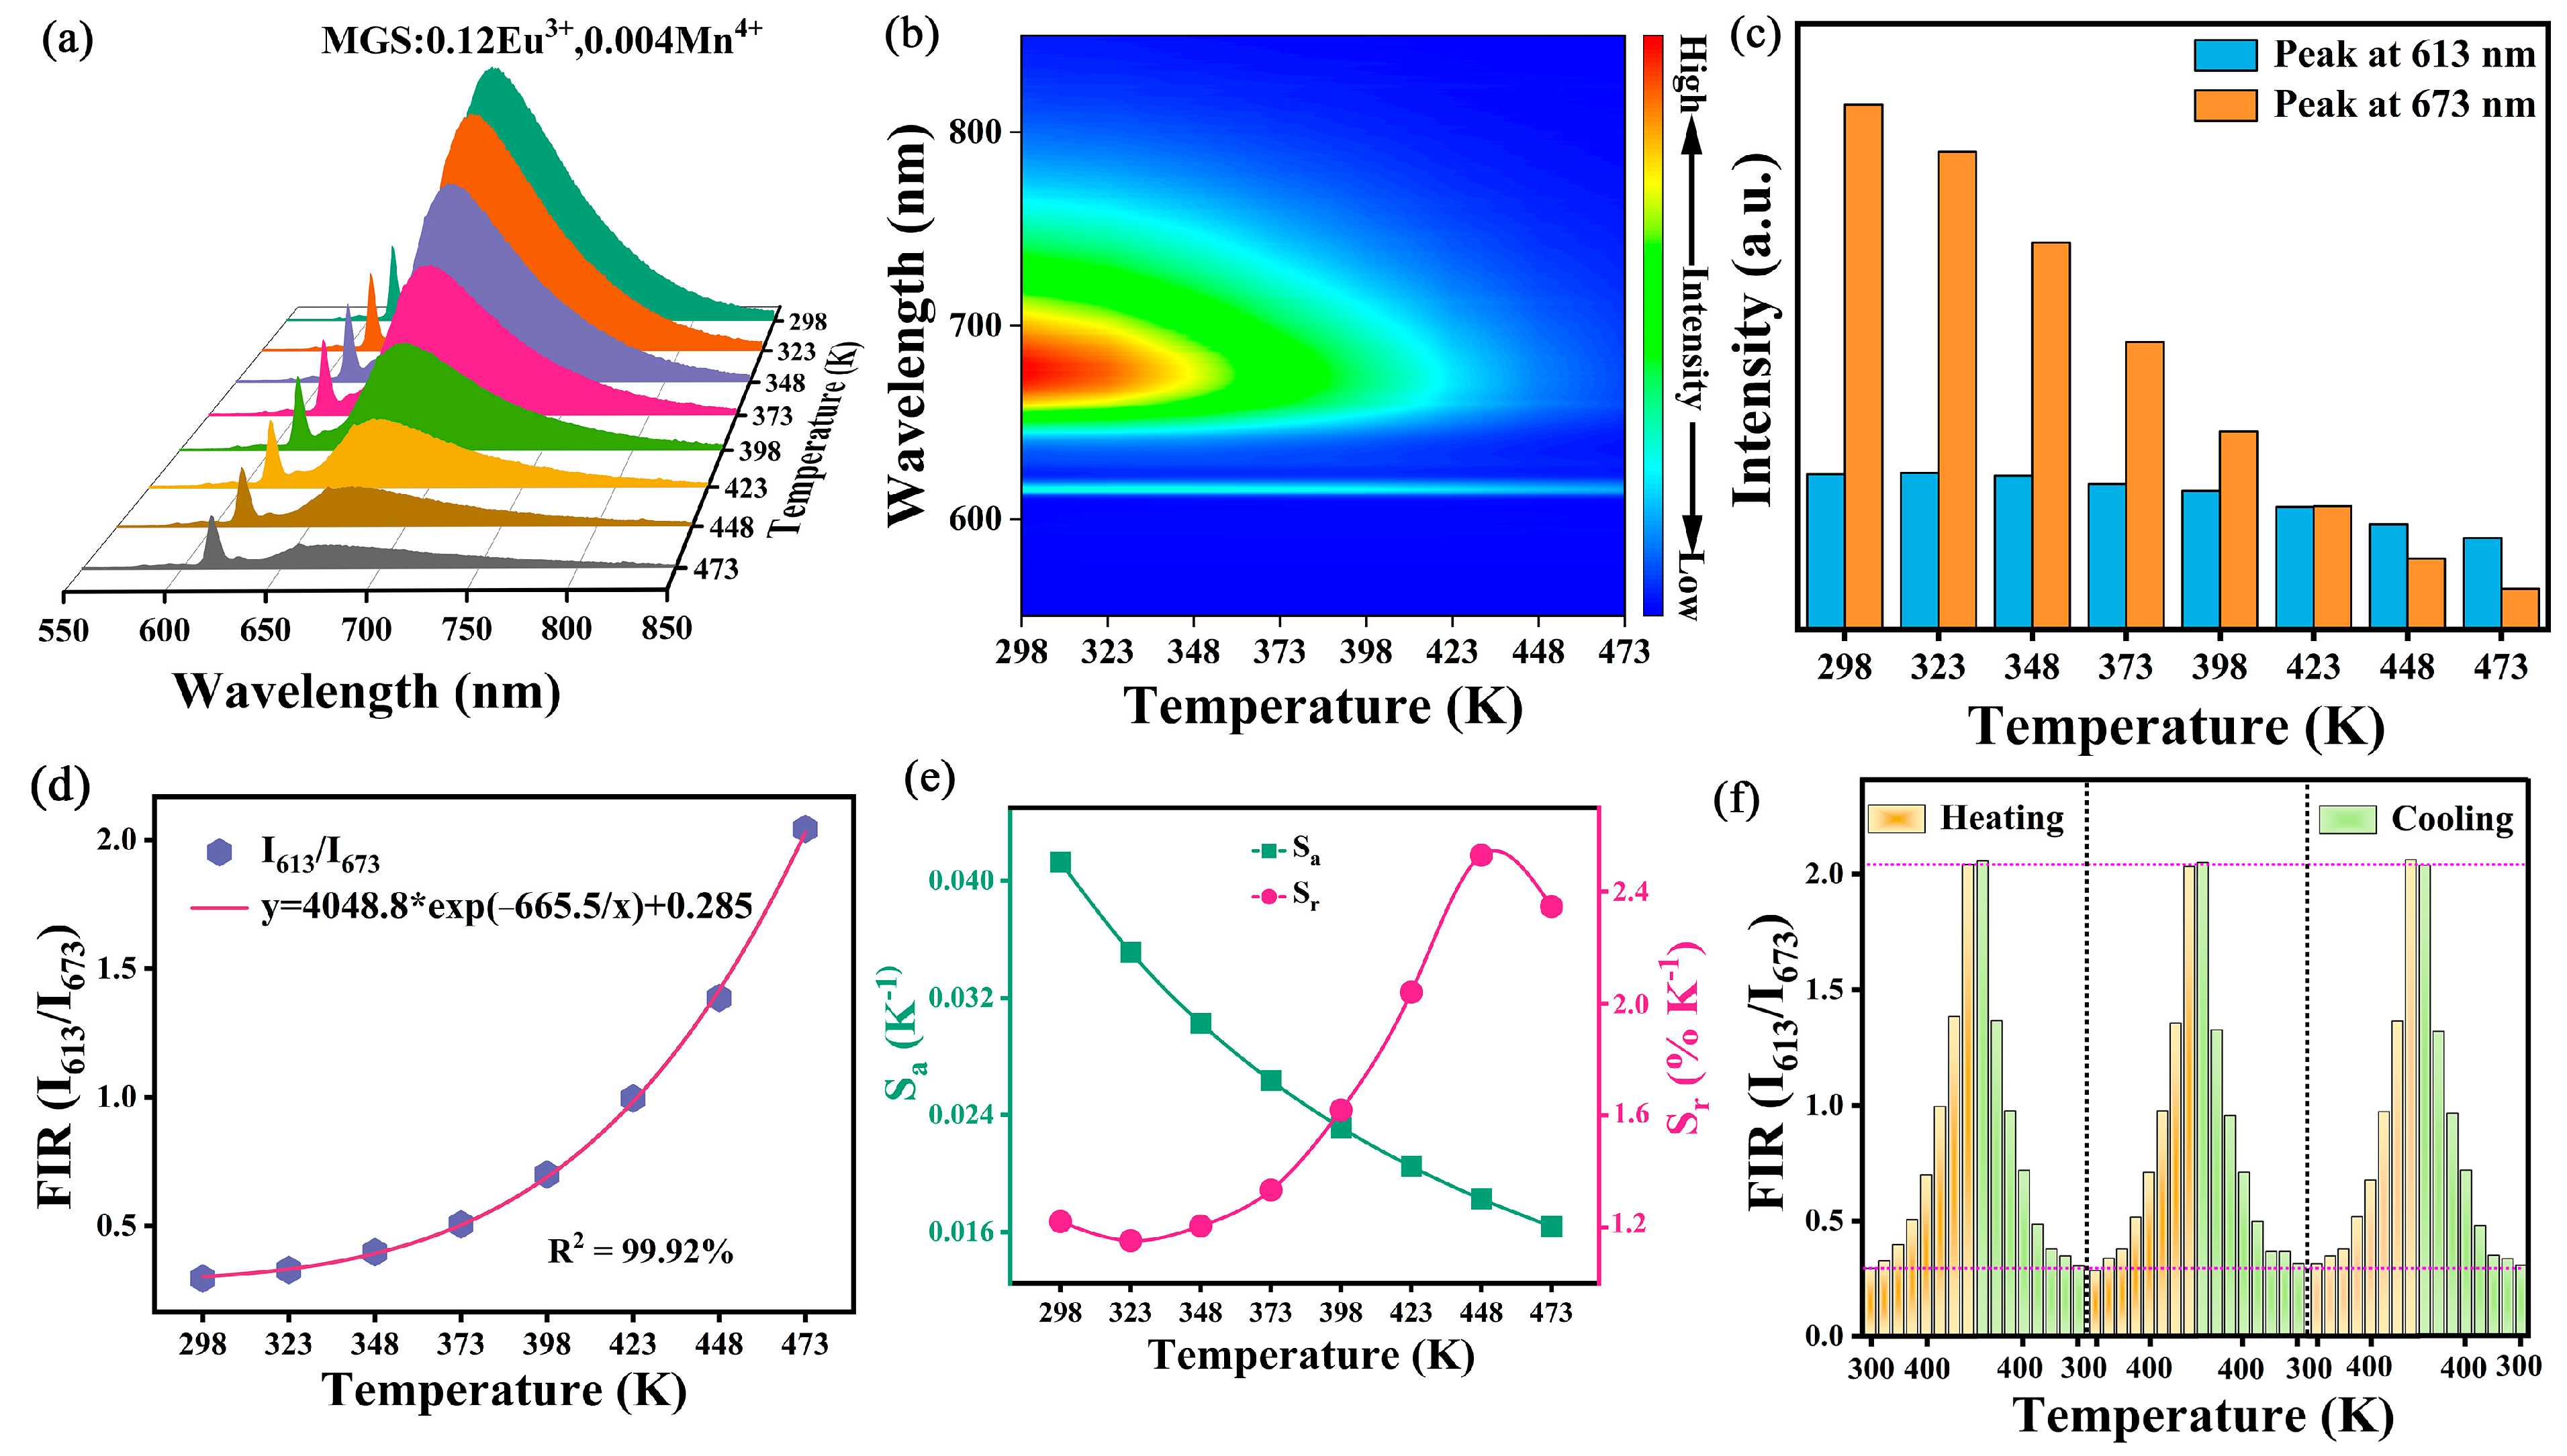
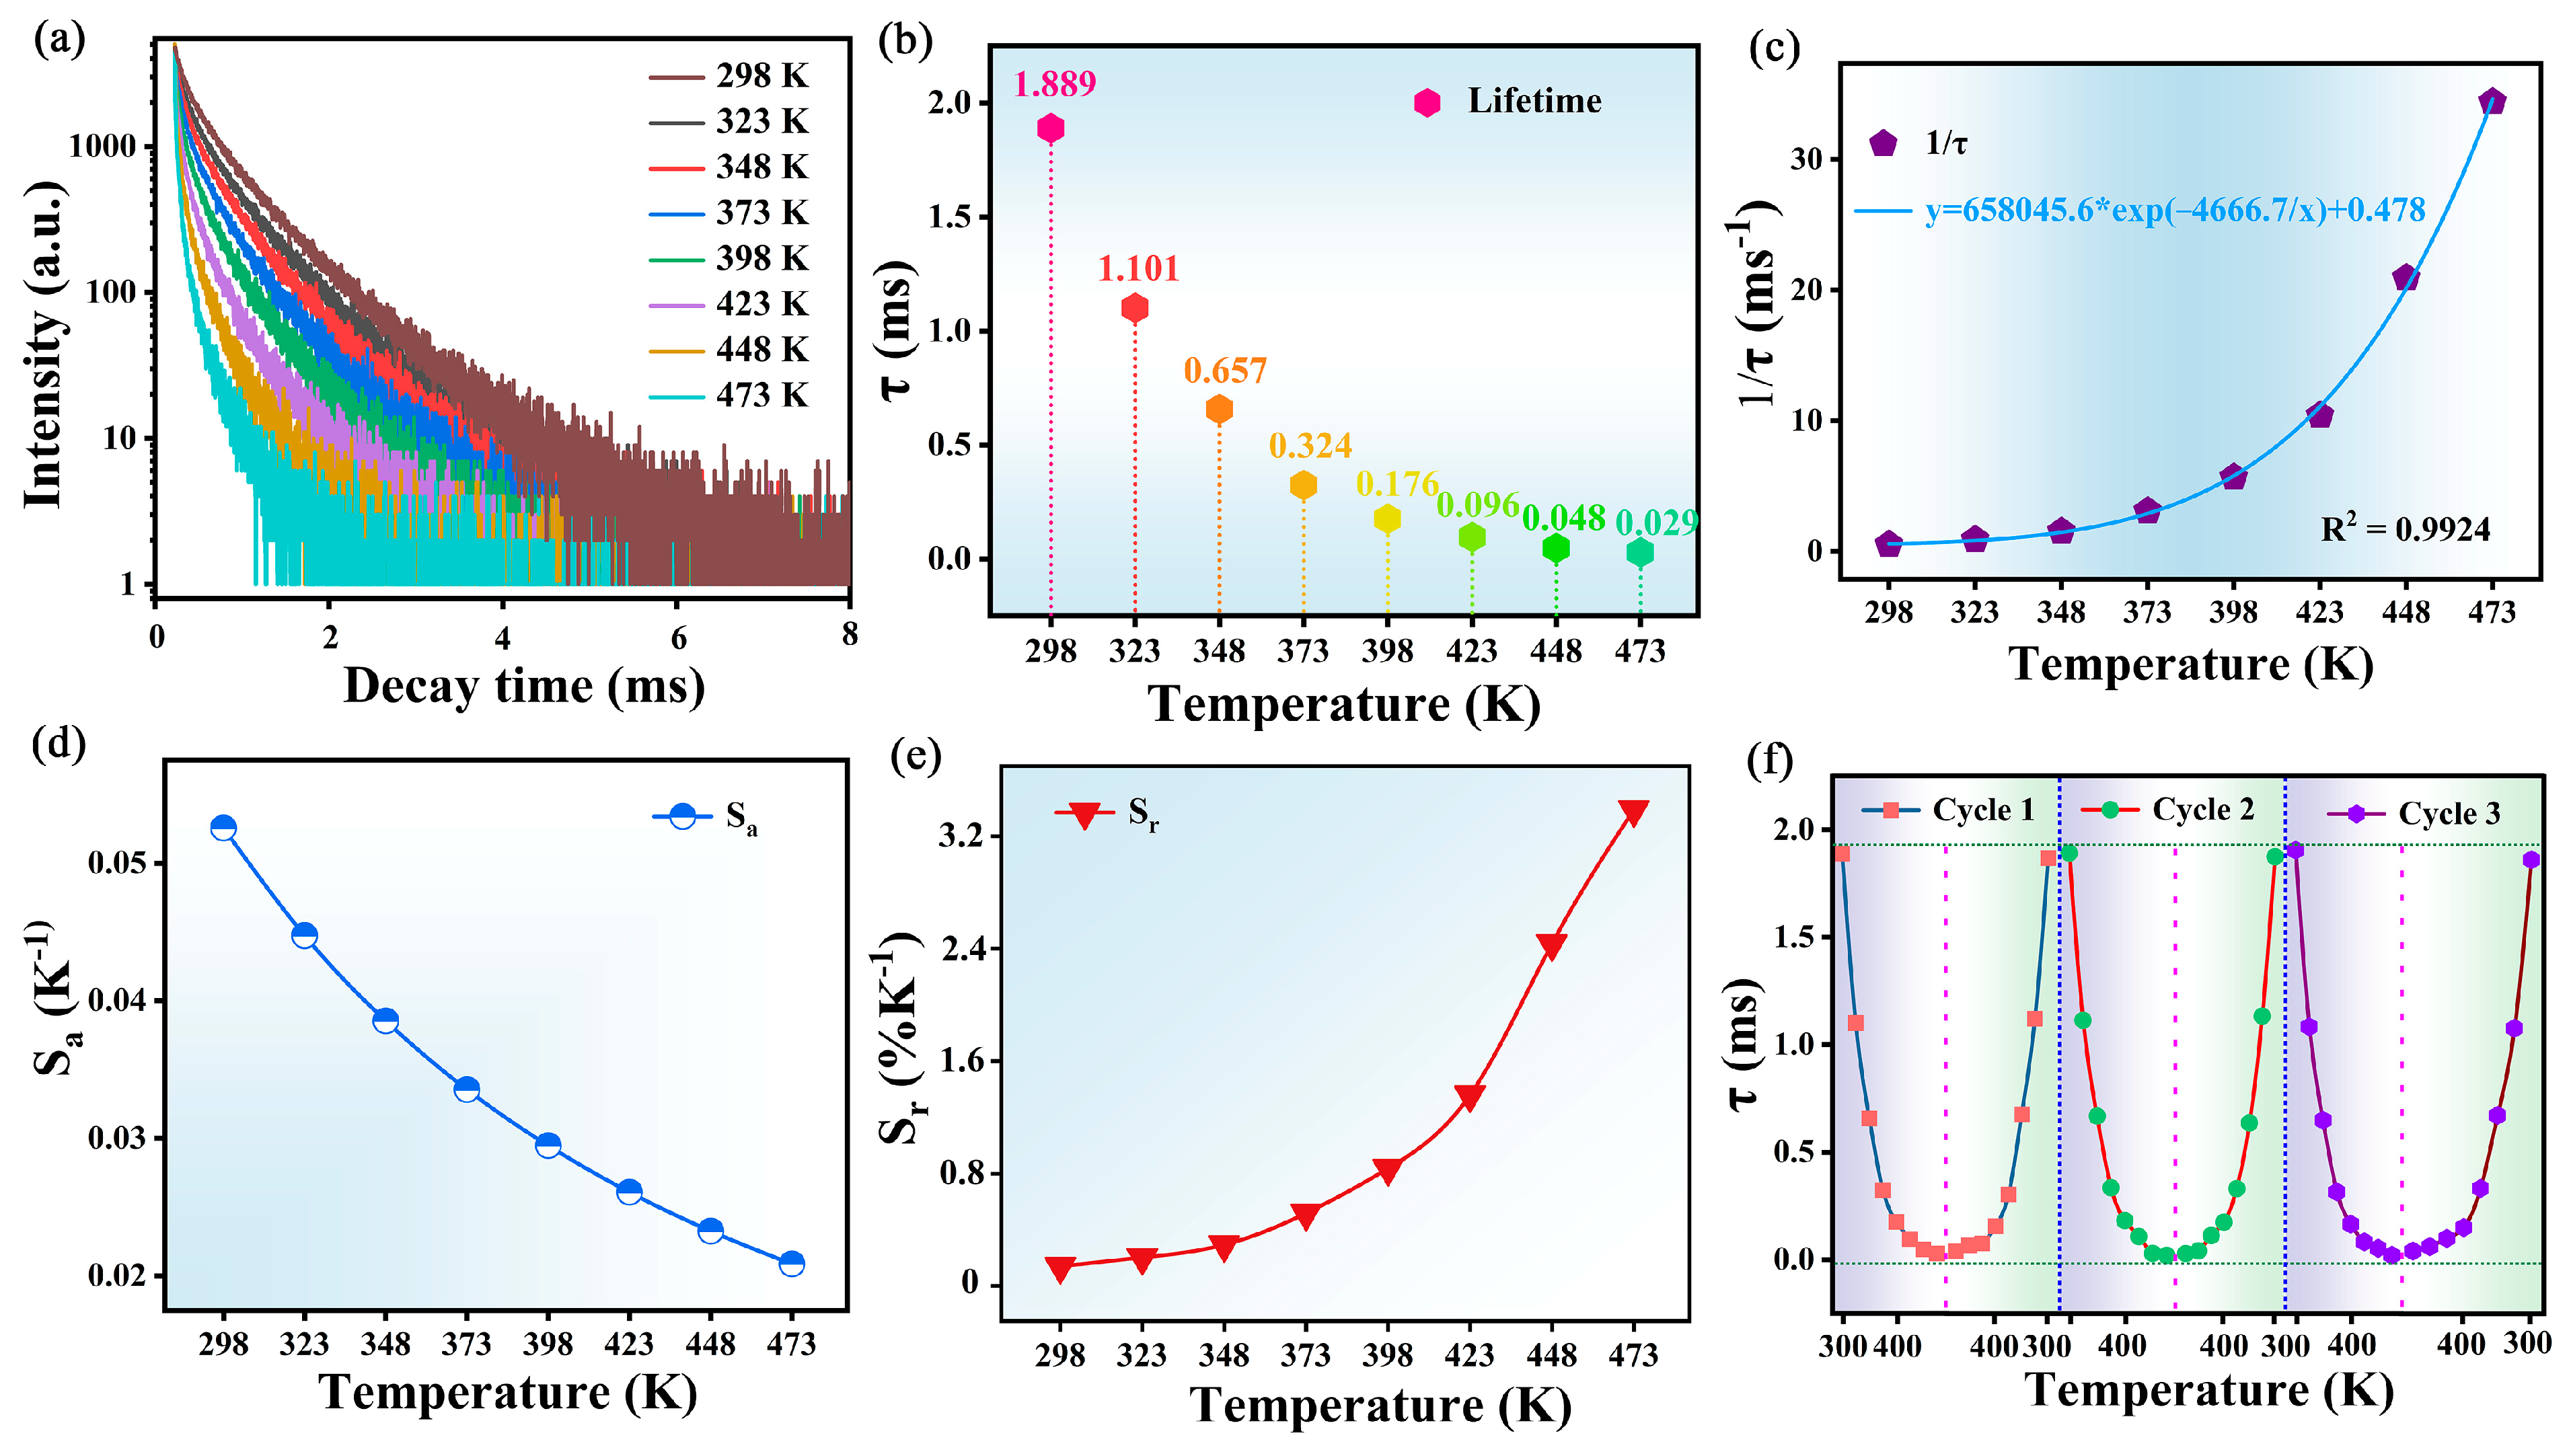
2.3. Optical Temperature Sensing

To further explore this phosphor in optical temperature sensing applications, the quantitative relationship between the fluorescence intensity of different emission peaks and the temperature interdependence can be utilized for exploratory studies. Figure 10a,b show the temperature-dependent emission spectra and relative emission contour spectra of the MGS:0.12Eu3+,0.004Mn4+ phosphor at temperatures ranging from 298 K to 473 K. Figure 10c shows the normalized intensity plots of the characteristic emission peaks of Eu3+ (613 nm) and Mn4+ (673 nm) in the MGS:0.12Eu3+,0.004Mn4+ sample at different temperatures. The luminescence at 673 nm of Mn4+ bursts faster, while the emission intensity at 613 nm of Eu3+ bursts slower with the increase in temperature. Since the intensities of the Eu3+ and Mn4+ emission peaks respond differently to temperature changes, they can be used to design non-contact optical thermometers based on the FIR technique. The FIR can be calculated according to the following equation [43]:
F I R = I 613 n m I 673 n m A exp ( B / T ) + C
where A, B, and C are constants and ΔE is the energy gap. Figure 10d shows the relationship between the FIR (I613 nm/I673 nm) value and temperature, which can be expressed by the fitting result as FIR = 4048.8 × exp(−665.5/T) + 0.285. The Sa and Sr can be determined according to the following equations [44]:
S a = F I R T
S r = 100 % F I R F I R T
Figure 10e shows the fitted curves of Sa and Sr as a function of temperature calculated by the above equations. The value of Sa shows a decreasing trend with increasing temperature and has a maximum value of 0.041 K−1 at 298 K. The value of Sr shows an increasing and then a decreasing trend and reaches a maximum value of 2.53% K−1 at 448 K. Compared to the optical thermometry phosphors already reported in Table 2, the MGS:0.12Eu3+,0.004Mn4+ phosphor has a wider thermometry range and higher sensitivity. To better analyze the cyclic stability, the change in FIR value with temperature during multiple temperature cycling is shown in Figure 10f, and the FIR value is able to recover to the initial state after three temperature cycles, which indicates that the phosphor has good reversibility and reliability in temperature sensing. In conclusion, the MGS:0.12Eu3+,0.004Mn4+ phosphor has good temperature sensing performance and can be regarded as an optical material with potential value for further research in the field of optical temperature sensing.
Temperature sensing using fluorescence lifetimes is another very promising measurement option with the inherent advantage of calibration-free measurements that are not affected by external factors such as sample size and excitation power fluctuations. Figure 11a displays the decay curves for the MGS:0.12Eu3+,0.004Mn4+ phosphor at different temperatures. The luminescence lifetime of Eu3+ decays from 1.889 ms to 0.025 ms with increasing temperature, as shown in Figure 11b, and the variability of the luminescence lifetime can be fitted by an Arrhenius-type equation with the following equation [45]:
1 τ ( T ) = 1 τ 0 ( 1 + D exp ( Δ E / ( k T ) )
where τ(T) and τ0 denote the Eu3+ luminescence lifetime at test temperature T and room temperature, respectively. As shown in Figure 11c, the relationship between the FL values and temperature can be expressed by the fitting result as 1/τ = 65,8045.6 × exp(−4666.7/T) + 0.478. To assess the feasibility of FL as a model for thermometry parameters, the Sa and Sr can be calculated using the following equations [46]:
S a = τ T
S r = 100 % 1 τ τ T
The Sa value of the MGS:0.12Eu3+,0.004Mn4+ sample decreases with increasing temperature and possesses a maximum value of 0.053 K−1 at 298 K, as shown in Figure 11d. The Sr values of the MGS:0.12Eu3+,0.004Mn4+ sample show an increasing trend, with a maximum Sr of 3.38% K−1 at 473 K, as shown in Figure 11e. The MGS:0.12Eu3+,0.004Mn4+ sample has superior temperature sensitivity properties compared to the temperature parameters of the recently reported co-doped fluorescent materials in Table 2. For optical temperature sensing materials, the reproducibility of FL with temperature is also a prerequisite for the material to be practically applicable. In order to verify the reproducibility of the sample, Figure 11f demonstrates the FL of the MGS:0.12Eu3+,0.004Mn4+ phosphor, with the temperature firstly increasing and then decreasing for three cycles. It can be observed that the phosphor exhibits good reproducibility of temperature measurement and has potential for practical application.
Table 2. Sr-Max of some co-doped phosphors based on FIR or FL mode.
SampleTemperature Range (K)Sr-Max (%
K−1)
ModeRef.
Ca2YZr2Al3O12:Bi3+,Eu3+297–5730.664FIR[22]
Sr3TaGa3Si2O14:Tb3+,Eu3+298–4980.760FIR[26]
La2LiSbO6:Eu3+,Mn4+303–5230.89FIR[11]
Ca2LaNbO6:Eu3+,Mn4+298–4981.51FIR[47]
BaLaMgNbO6:Dy3+,Mn4+230–4701.82FIR[48]
MGS:0.12Sm3+,0.004Mn4+298–4732.53FIRThis work
SrGdLiTeO6:Sm3+, Mn4+298–5731.30FL[8]
Ca2GdSbO6:Mn4+,Eu3+303–5231.47FL[13]
Ba2GdNbO6:Eu3+, Mn4+303–4831.73 FL[49]
La2MgTiO6:Dy3+,Mn4+303–5032.31 FL[50]
MGS:0.12Sm3+,0.004Mn4+298–4733.38FLThis work

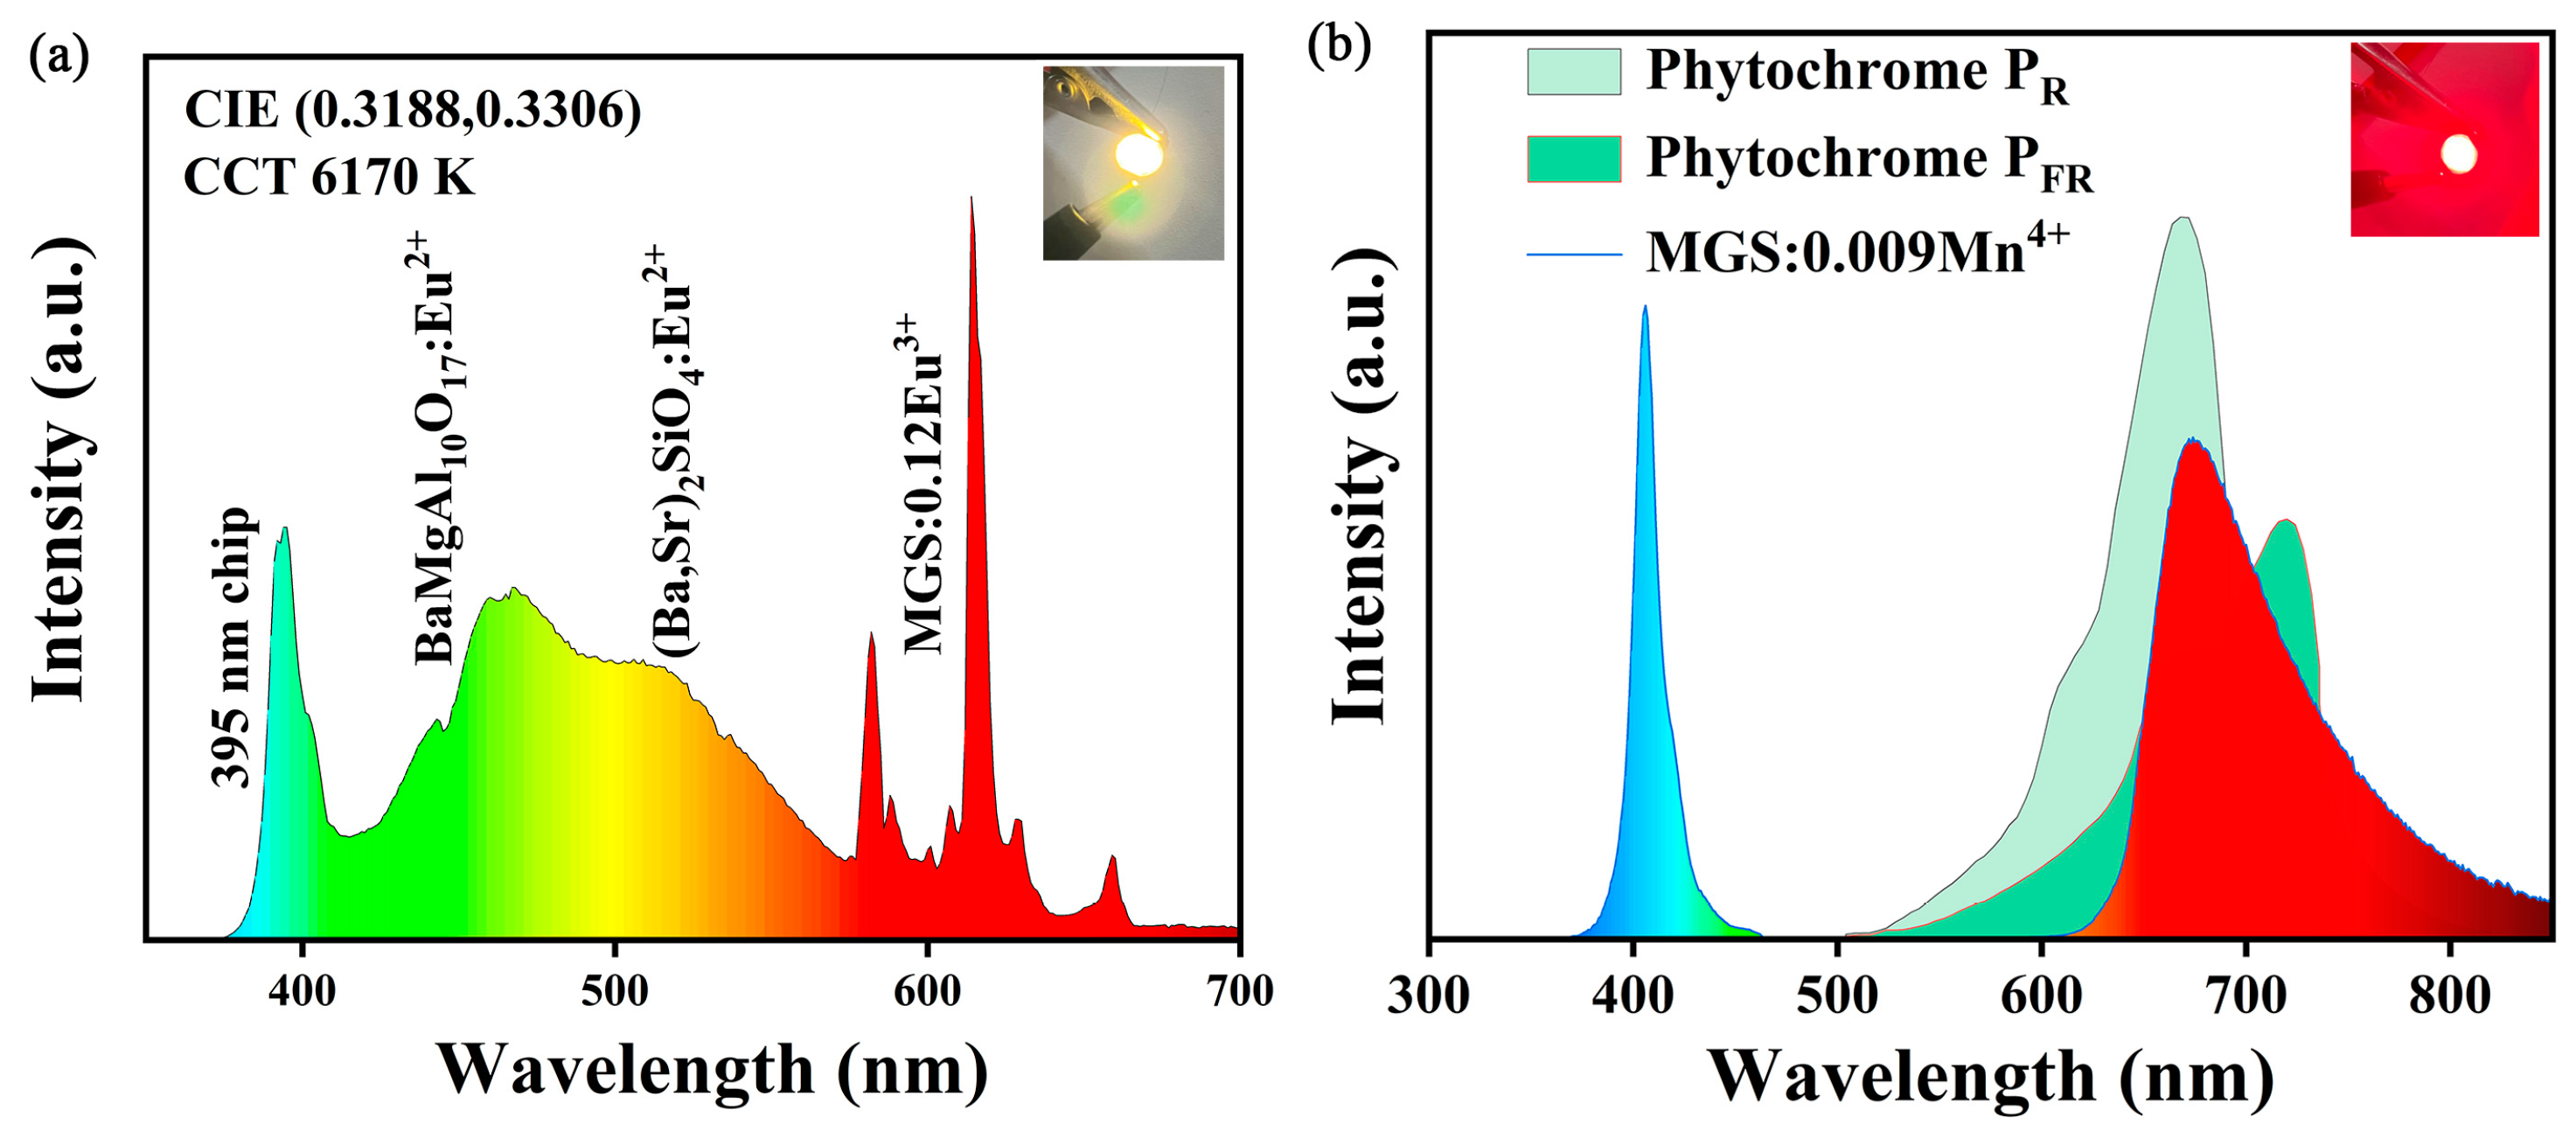
2.4. Applications in LEDs

The MGS:0.12Eu3+ sample and commercial phosphors BaMgAl10O17:Eu2+ and (Ba,Sr)2SiO4:Eu2+ were encapsulated in the 395 nm commercial chip to make a WLED light source, and its electroluminescence spectrum is shown in Figure 12a. The inset is a photo of this WLED after it is illuminated. The correlated color temperature of the prepared WLED device is 6170 K, and the color rendering index reaches 82.5, which indicates that the MGS:0.12Eu3+ phosphor has great potential for use in pc-LED backlit displays. The phytochrome has a specific absorption spectrum, so the wavelength at which the emission spectrum of the phosphor is located needs to be within the absorption spectrum of the phytochrome in order to promote plant photosynthesis more effectively [51]. Figure 12b displays the electroluminescence spectrum of the MGS:0.009Mn4+ sample and absorption spectra of the plant photosensitive pigments PR and PFR. Obviously, the strongest peak located at 673 nm is highly overlapped with spectrum of PFR and is far away from the peak wavelength of the absorption spectrum of the PR. This suggests that the sample MGS:0.009Mn4+ can promote the process of energy absorption by the plant photosensitive pigment PFR, which in turn selectively promotes some specific processes of plant growth.

3. Materials and Methods

3.1. Preparation of Materials

A series of MGS:xEu3+ (0.04 ≤ x ≤ 0.24) and MGS:0.12Eu3+,yMn4+ (0.002 ≤ y ≤ 0.012) samples were prepared by adopting a high-temperature solid phase method. Firstly, I weighed the raw materials—(MgCO3)4·Mg(OH)2·5H2O (99.5%, Aladdin), Ga2O3 (99.99%, Aladdin), SnO2 (99.5%, Aladdin), Eu2O3 (99.99%, Aladdin) and MnCO3 (99.5%, Aladdin)—according to the designed stoichiometric ratios, and ground and stirred them well in an agate mortar. After thorough grinding and homogenization, the mixed powders were transferred to a crucible of alumina, followed by sintering in the muffle furnace at 1450 °C for 6 h, with air as the sintering atmosphere. Finally, the samples were crushed into powder and subjected to subsequent performance testing.

3.2. Characterization of Materials

The XRD data were measured by a Bruker-D8 ADVANCE diffractometer (BRUKER, Germany). The morphology and dimensions of the samples were observed using a field emission scanning electron microscope (SEM, HITACHI, SU8100, Tokyo, Japan). The diffuse reflectance spectra were tested using a spectrophotometer (Pulsar, TU1950, Beijing, China) equipped with an integrating sphere accessory. The excitation and emission spectra of the samples were measured using a FLS1000 fluorescence spectrometer from (Edinburgh, UK). The excitation light source was a xenon lamp, and a variable-temperature accessory was used for variable-temperature testing. For fluorescence lifetime measurement, a microsecond lamp was selected as the light source. The electrochromic performance of packaged light-emitting devices was measured using the Starspec SSP6612 LED photoelectric measuring system (Hangzhou, China).

3.3. Preparation of LEDs

The prepared MGS:0.12Eu3+ red phosphor was thoroughly and evenly mixed with the commercial blue phosphor BaMgAl10O17:Eu2+ and the commercial green phosphor (Ba, Sr)2SiO4:Eu2+ according to a mass ratio of 10:2:1. Subsequently, this mixture was mixed with the organic silica gel according to a mass ratio of 1:0.7, and then applied onto a NUV chip with a wavelength of 395 nm and encapsulated to form a white light LED device. A single red LED was fabricated by combining the as-prepared MGS:0.009Mn4+ phosphor and organic silica gel with a 410 nm InGaN chip.

4. Conclusions

In summary, I successfully synthesized MGS:Eu3+,Mn4+ phosphors with dual emission centers. The XRD, morphology, photoluminescence properties, energy transfer process and temperature-sensitive properties of MGS:Eu3+,Mn4+ samples have been investigated. The results show that the energy transfer of Eu3+→Mn4+ ions exists in MGS:Eu3+,Mn4+ phosphors, and the maximum value of transfer efficiency can reach 71.2%. The CIE chromaticity coordinate plots of the samples show that the effective adjustment of the luminescence color of the double-doped phosphor can be achieved by changing the doping concentration of Mn4+. Thanks to the weak thermal burst effect of Eu3+, its emission provides a stable reference for the fast thermal quenching of the Mn4+ stokes emission peak, which leads to a good thermometry performance. The relative thermometric sensitivities of the two methods reached a maximum value of 2.53% K−1 at 448 K and a maximum value of 3.38% K−1 at 473 K. The prepared LED lamps have a high color temperature (the relevant color temperature is 6170 K) and a color rendering index Ra of 82.5, indicating that the prepared phosphors have good luminescence performance and can be applied to the field of LED lighting.

Funding

This work was supported by the Natural Science Foundation of Shandong Province, China (No. ZR2019PEM006), National College Students’ Innovation and Entrepreneurship Training program (No. 202414276001).

Institutional Review Board Statement

Not applicable.

Informed Consent Statement

Not applicable.

Data Availability Statement

The more research data are available from the authors on request.

Acknowledgments

The author thanks Zhide Wang, Yi Su, Wenyue Zhang, and Yu Zheng for the assistance with the SEM and electroluminescence spectra measurements.

Conflicts of Interest

The authors declare no conflicts of interest.

References

  1. Xia, Z.G.; Liu, Q.L. Progress in discovery and structural design of color conversion phosphors for LEDs. Prog. Mater. Sci. 2016, 84, 59–117. [Google Scholar] [CrossRef]
  2. Yadav, S.; Kumar, D.; Yadav, R.S.; Singh, A.K. Recent progress on optical properties of double perovskite phosphors. Prog. Solid State Chem. 2023, 69, 100391. [Google Scholar] [CrossRef]
  3. Lü, W.; Lv, W.; Zhao, Q.; Jiao, M.; Shao, B.; You, H. A Novel Efficient Mn4+ Activated Ca14Al10Zn6O35 Phosphor: Application in Red-Emitting and White LEDs. Inorg. Chem. 2014, 53, 11985–11990. [Google Scholar] [CrossRef] [PubMed]
  4. Du, Y.; Jin, Y.; Yan, K.; Li, Y.; Wang, Y.; Liu, S.; Liu, G.; Wang, J.; Yu, W.; Dong, X. Tunable luminescence in Eu3+/Sm3+ doped Na2YMg2V3O12 for WLEDs and optical thermometry. Spectrochimica Acta A 2025, 330, 125759. [Google Scholar] [CrossRef]
  5. Zhou, J.J.; Rosal, D.B.; Jaque, D.; Uchiyama, S.; Jin, D.Y. Advances and challenges for fluorescence nanothermometry. Nat. Methods 2020, 17, 967–980. [Google Scholar] [CrossRef] [PubMed]
  6. Jin, Y.; Mei, L.F.; Su, K.; Guo, Q.F.; Liao, L.B. Color tunable warm white emitting whitlockite-type phosphor applied in optical thermometry. J. Lumin. 2023, 254, 119532. [Google Scholar] [CrossRef]
  7. Venturini, F.; Bürgi, R.; Borisov, S.M.; Klimant, I. Optical temperature sensing using a new thermographic phosphor. Sensor Actuat. A-Phys. 2015, 233, 324–329. [Google Scholar] [CrossRef]
  8. Chi, F.; Wei, X.; Qin, Y.; Li, F.; Chen, Y.; Duan, C.; Yin, M. Investigation on the site occupation of rare-earth ions in CaIn2O4 with the fluorescence probe of Eu3+. Phys. Chem. Chem. Phys. 2017, 19, 12473–12479. [Google Scholar] [CrossRef]
  9. Yang, Z.F.; Yang, L.L.; Ji, C.J.; Xu, D.H.; Zhang, C.Q.; Bu, H.X.; Tan, X.; Yun, X.Y.; Sun, J.Y. Studies on luminescence properties of double perovskite deep red phosphor La2ZnTiO6:Mn4+ for indoor plant growth LED applications. J. Alloys Compd. 2019, 802, 628–635. [Google Scholar] [CrossRef]
  10. Cao, R.; Jiao, Y.; Wang, X.; Ouyang, X.; Wan, H.; Chen, T.; Zheng, G.; Xie, S. Far-red emitting Mg2La3NbO9:Mn4+ powder phosphor: Synthesis and luminescence properties. Adv. Powder Technol. 2020, 31, 4045–4052. [Google Scholar] [CrossRef]
  11. Song, Y.Y.; Guo, N.; Li, J.; Ouyang, R.Z.; Miao, Y.Q.; Shao, B.Q. Photoluminescence and temperature sensing of lanthanide Eu3+ and transition metal Mn4+ dual-doped antimoniate phosphor through site-beneficial occupation. Ceram. Int. 2020, 46, 22164–22170. [Google Scholar] [CrossRef]
  12. Niu, Y.; Wu, F.; Zhang, Q.; Teng, Y.; Huang, Y.; Yang, Z.; Mu, Z. Luminescence and thermometry sensing of Sr2InTaO6:Eu3+, Mn4+ phosphors in a wide temperature range. J. Lumin. 2024, 275, 120748. [Google Scholar] [CrossRef]
  13. Li, G.; Xue, Y.; Mao, Q.; Pei, L.; He, H.; Liu, M.; Chu, L.; Zhong, J. Synergistic luminescent thermometer of Co-doped Ca2GdSbO6:Mn4+/(Eu3+ Or Sm3+ phosphors. Dalton Trans. 2022, 51, 4685–4694. [Google Scholar] [CrossRef]
  14. Ma, L.; Tian, G.; Xiao, H.; Jiang, L.; Du, Q.; Li, H.; Yang, B. A novel spinel-type Mg3Ga2SnO8 microwave dielectric ceramic with low εr and low loss. J. Eur. Ceram. Soc. 2024, 44, 5731–5737. [Google Scholar] [CrossRef]
  15. Zhu, Q.; Huo, J.; Lin, Y.; Li, M.; Liu, W.; Gao, J.; Wang, Q. A New Co-Substitution Strategy as a Model to Study a Rare-Earth-Free Spinel-Type Phosphor with Red Emissions and Its Application in Light-Emitting Diodes. Inorg. Chem. 2020, 59, 433–442. [Google Scholar] [CrossRef]
  16. Kuttiat, T.K.; Abraham, M.; Kunti, A.K.; Amador-Mendez, N.; Tchernycheva, M.; Das, S. Enriching the Deep-Red Emission in (Mg, Ba)3M2GeO8:Mn4+ (M = Al, Ga) Compositions for Light-Emitting Diodes. ACS Appl. Mater. Interfaces 2023, 15, 7083–7101. [Google Scholar] [CrossRef]
  17. Geng, X.; Xie, Y.; Ma, Y.; Liu, Y.; Luo, J.; Wang, J.; Yu, R.; Deng, B.; Zhou, W. Abnormal thermal quenching and application for w-LEDs: Double perovskite Ca2InSbO6:Eu3+ red-emitting phosphor. J. Alloys Compd. 2020, 847, 156249. [Google Scholar] [CrossRef]
  18. Fu, Y.; Xiong, P.; Liu, X.; Wang, X.; Wu, S.; Liu, Q.; Peng, M.; Chen, Y. A promising blue-emitting phosphor CaYGaO4: Bi3+ for nearultraviolet (NUV) pumped white LED application and the emission improvement by Li+ ions. J. Mater. Chem. C 2021, 9, 303–312. [Google Scholar] [CrossRef]
  19. Shannon, R.D. Revised effective ionic radii and systematic studies of interatomie distances in halides and chaleogenides. Acta Cryst. 1976, 32, 751–767. [Google Scholar] [CrossRef]
  20. Yang, Z.F.; Ye, M.J.; Yang, S.Y.; Wang, R.X.; Sun, C.H.; Li, Y.F.; Wang, J.H. Efficient and abnormal thermal quenching Sm3+ activated perovskites-type niobate phosphor for plant growth lamp and WLEDs. Ceram. Int. 2024, 50, 21745–21754. [Google Scholar] [CrossRef]
  21. Wang, S.; Seto, T.; Liu, B.; Wang, Y.; Li, C.; Liu, Z.; Dong, H. Tremendous acceleration of plant growth by applying a new sunlight converter Sr4Al14−xGaxO25:Mn4+ breaking parity forbidden transition. Adv. Sci. 2022, 10, 2204418. [Google Scholar] [CrossRef]
  22. Zheng, Z.; Zhang, J.; Liu, X.; Wei, R.; Hu, F.; Guo, H. Luminescence and self-referenced optical temperature sensing performance in Ca2YZr2Al3O12:Bi3+,Eu3+ phosphors. Ceram. Int. 2020, 46, 6154–6159. [Google Scholar] [CrossRef]
  23. Zhou, X.; Zhang, J.; Chen, L.; Li, Y.; Xiang, G.; Jiang, S.; Li, L.; Tang, X.; Cao, Z.; Xie, G. Sr3Lu(VO4)3: Eu3+ red-emitting phosphors for warm white LEDs. J. Am. Ceram. Soc. 2021, 104, 2721–2729. [Google Scholar] [CrossRef]
  24. Ma, L.; Du, Q.; Tian, G.; Xiao, H.; Jiang, L.; Li, H. Microwave dielectric properties of novel Mg3Ga2TiO8 ceramic. Ceram. Int. 2024, 50, 50774–50779. [Google Scholar] [CrossRef]
  25. Dang, P.P.; Li, G.G.; Yun, X.H.; Zhang, Q.Q.; Liu, D.J.; Lian, H.Z.; Shang, M.M.; Lin, J. Thermally stable and highly efficient red-emitting Eu3+-doped Cs3GdGe3O9 phosphors for WLEDs: Non-concentration quenching and negative thermal expansion. Light Sci. Appl. 2021, 10, 29. [Google Scholar] [CrossRef] [PubMed]
  26. Lig, S.; Muji, H.; Zhang, Y.; Zhou, X.; Wang, K.; Wang, Z.; Tian, Q.; Chao, K. Design and synthesis of Sr3TaGa3Si2O14:Tb3+,Eu3+ phosphors for enhanced optical thermometry and multicolor anti-counterfeiting applications. Ceram. Int. 2024, 50, 53264–53271. [Google Scholar] [CrossRef]
  27. Abbas, M.T.; Khan, N.Z.; Muhammad, N.; Mehmood, I.; Mao, J.; Khan, S.A. Temperature sensing performance of ScVO4:Eu3+ phosphors by employing ground state thermal coupling approach. J. Alloys Compd. 2022, 906, 164340. [Google Scholar] [CrossRef]
  28. Duong, L.; Quang, N.; Nguyen, D. Far-red emission of CaYAlO4: Mn4+ synthesized by co-precipitation method. J. Mater. Sci. Technol. 2020, 58, 168–175. [Google Scholar]
  29. Cao, R.; Shi, Z.; Quan, G.; Chen, T.; Guo, S.; Hu, Z.; Liu, P. Preparation and luminescence properties of Li2MgZrO4:Mn4+ red phosphor for plant growth. J. Lumin. 2017, 188, 577–581. [Google Scholar] [CrossRef]
  30. Zhou, J.; Xia, Z.G. Multi-color emission evolution and energy transfer behavior of La3GaGe5O16:Tb3+, Eu3+ phosphors. J. Mater. Chem. C 2014, 2, 6978–6984. [Google Scholar] [CrossRef]
  31. Pasinski, D.; Sokolnicki, J. Nitridated Ca2NaMg2V3O12:Eu3+ vanadate garnet phosphor-in-glass. Materials 2020, 13, 2996. [Google Scholar] [CrossRef]
  32. Duan, F.F.; Wang, L.; Shi, Q.F.; Guo, H.J.; Qiao, J.W.; Cui, C.E.; Huang, P. Suitable selection of high-energy state excitation to enhance the thermal stability of Eu3+ and the sensitivity of La2CaSnO6:Eu3+,Mn4+ temperature measuring materials. J. Mater. Chem. C 2023, 11, 14705–14713. [Google Scholar] [CrossRef]
  33. Du, P.P.; Meng, Q.H.; Wang, X.J.; Zhu, Q.; Li, X.D.; Sun, X.D.; Li, J.G. Sol-gel processing of Eu3+ doped Li6CaLa2Nb2O12 garnet for efficient and thermally stable red luminescence under near-ultraviolet/blue light excitation. Chem. Eng. J. 2019, 375, 121937. [Google Scholar] [CrossRef]
  34. Zhang, X.; Xu, Y.; Wu, X.; Yin, S.; Zhong, C.; Wang, C.; Zhou, L.; You, H. Optical thermometry and multi-mode anti-counterfeiting based on Bi3+/Ln3+ and Ln3+ doped Ca2ScSbO6 phosphors. Chem. Eng. J. 2024, 481, 148717. [Google Scholar] [CrossRef]
  35. Song, Y.Y.; Guo, N.; Li, J.; Xin, Y.M.; Lü, W.; Miao, Y.Q. Dual-emissive Ln3+/Mn4+ co-doped double perovskite phosphor via site-beneficial occupation. Mater. Adv. 2021, 2, 1402–1412. [Google Scholar] [CrossRef]
  36. Xue, J.; Noh, H.; Choi, B.; Park, S.; Kim, J.; Jeong, J.; Du, P. Dual-functional of noncontact thermometry and field emission displays via efficient Bi3+/Eu3+ energy transfer in emitting-color tunable GdNbO4 phosphors. Chem. Eng. J. 2020, 382, 122861. [Google Scholar] [CrossRef]
  37. Li, L.; Tang, X.; Wu, Z.; Zheng, Y.; Jiang, S.; Tang, X.; Xiang, G.; Zhou, X. Simultaneously tuning emission color and realizing optical thermometry via efficient Tb3+→Eu3+ energy transfer in whitlockite-type phosphate multifunctional phosphors. J. Alloys Compd. 2019, 780, 266–275. [Google Scholar] [CrossRef]
  38. Hua, Y.B.; Ran, W.G.; Yu, J.S. Excellent photoluminescence and cathodoluminescence properties in Eu3+-activated Sr2LaNbO6 materials for multifunctional applications. Chem. Eng. J. 2021, 406, 127154. [Google Scholar] [CrossRef]
  39. Hua, Y.; Ran, W.; Yu, J.S. Strong red emission with excellent thermal stability in double-perovskite type Ba2GdSbO6:Eu3+ phosphors for potential field-emission displays. J. Alloy. Compd. 2020, 853, 155389. [Google Scholar] [CrossRef]
  40. Yang, Z.F.; Ye, M.J.; Sun, C.H.; Yang, S.Y.; Zheng, Y.; Xu, D.H.; Sun, J.Y. Structural and luminescence characterization of red-emitting Li6SrLa2Nb2O12:Eu3+ phosphors with excellent thermal stability. J. Mol. Struct. 2023, 1292, 136071. [Google Scholar] [CrossRef]
  41. Bhelave, S.R.; Kadam, A.R.; Yerpude, A.N.; Dhoble, S.J. Intensity enhancement of photoluminescence in Tb3+/Eu3+ co-doped Ca14Zn6Al10O35 phosphor for WLEDs. Luminescence 2023, 38, 379–388. [Google Scholar] [CrossRef] [PubMed]
  42. Cui, R.R.; Guo, X.; Gong, X.Y.; Deng, C.Y. Photoluminescence properties and energy transfer of novel orange–red emitting phosphors: Ba3Bi2(PO4)4:Sm3+, Eu3+ for white light-emitting diodes. Rare Met. 2021, 40, 2882–2891. [Google Scholar] [CrossRef]
  43. Zheng, Z.; Song, Y.; Zheng, B.; Zhao, Y.; Wang, Q.; Zhang, A.; Zou, B.; Zou, H. Eu2+ and Mn2+ co-doped Lu2Mg2Al2Si2O12 phosphors for high sensitivity and multi-mode optical pressure sensing. Inorg. Chem. Front. 2023, 10, 2788–2798. [Google Scholar] [CrossRef]
  44. Ding, Y.; Guo, N.; Lü, X.; Zhou, H.; Wang, L.; Ouyang, R.; Miao, Y.; Shao, B. None-rare-earth activated Ca14Al10Zn6O35:Bi3+,Mn4+ phosphor involving dual luminescent centers for temperature sensing. J. Am. Ceram. Soc. 2019, 102, 7436–7447. [Google Scholar] [CrossRef]
  45. Hu, F.; Ren, S.; Wu, Y.; Sun, C.; Zhu, B.; Wang, Q.; Li, S.; Zhang, D. Dual-mode optical thermometer based on fluorescence intensity ratio of Eu3+/Mn4+ co-doping zinc titanate phosphors. Spectrochim. Acta 2023, 288, 122127. [Google Scholar] [CrossRef] [PubMed]
  46. Li, L.; Tian, G.; Deng, Y.; Wang, Y.; Cao, Z.; Ling, F.; Li, Y.; Jiang, S.; Xiang, G.; Zhou, X. Constructing ultra-sensitive dual-mode optical thermometers: Utilizing FIR of Mn4+/Eu3+ and lifetime of Mn4+ based on double perovskite tellurite phosphor. Opt. Express 2020, 28, 33747–33757. [Google Scholar] [CrossRef]
  47. Wang, P.; Mao, J.S.; Zhao, L.; Jiang, B.; Xie, C.Y.; Lin, Y.; Chi, F.F.; Yin, M.; Chen, Y.H. Double perovskite A2LaNbO6:Mn4+,Eu3+ (A=Ba,Ca) phosphors: Potential applications in optical temperature sensing. Dalton Trans. 2019, 48, 10062–10069. [Google Scholar] [CrossRef]
  48. Lin, Y.; Zhao, L.; Jiang, B.; Mao, J.; Chi, F.; Wang, P.; Xie, C.; Wei, X.; Chen, Y.; Yin, M. Temperature-dependent luminescence of BaLaMgNbO6:Mn4+,Dy3+ phosphor for dual-mode optical thermometry. Opt. Mater. 2019, 95, 109199. [Google Scholar] [CrossRef]
  49. Luo, Y.X.; Chen, Y.; Li, L.J.; Chen, J.Y.; Pang, T.; Chen, L.P.; Guo, H. Three-mode fluorescence thermometers based on double perovskite Ba2GdNbO6:Eu3+,Mn4+ phosphors. Ceram. Int. 2023, 49, 38007–38014. [Google Scholar] [CrossRef]
  50. Qiang, K.; Ye, Y.; Mao, Q.; Chen, F.; Chu, L.; Liu, M.; Zhong, J. Dy3+, Mn4+ co-doped phosphors for synergistic luminescent dual-mode thermometer and high-resolution imaging. Mater. Design 2024, 241, 112906. [Google Scholar] [CrossRef]
  51. Agarwal, A.; Gupta, S.D. Impact of light-emitting diodes (LEDs) and its potential on plant growth and development in controlled-environment plant production system. Curr. Biotechnol. 2016, 5, 28–43. [Google Scholar] [CrossRef]
Figure 1. The XRD patterns of (a) MGS:xEu3+ (0.04 ≤ x ≤ 0.24) and (b) MGS:0.12Eu3+,yMn4+ (0.002 ≤ y ≤ 0.012) samples.
Molecules 30 01945 g001
Figure 2. XRD Rietveld refinement of (a) MGS (b) MGS:0.12Eu3+ and (c) MGS:0.12Eu3+,0.006Mn4+. (d) Crystal structure of MGS host lattice.
Molecules 30 01945 g002
Figure 3. (a) The SEM image of MGS:0.12Eu3+,0.004Mn4+. (b) The corresponding element mapping of Eu, Mn, Sn, Ga, Mg, and O in the MGS:0.12Eu3+,0.004Mn4+ phosphor.
Molecules 30 01945 g003
Figure 4. (a) The diffuse reflectance spectra of MGS matrix, MGS:0.12Eu3+, and MGS:0.009Mn4+. (b) Energy band structure diagram of MGS.
Molecules 30 01945 g004
Figure 5. The excitation and emission spectra of (a) MGS:0.12Eu3+, (b) MGS:0.009Mn4+, and (c) MGS:0.12Eu3+,0.004Mn4+.
Molecules 30 01945 g005
Figure 6. (a) The emission spectra of MGS:xEu3+ (0.04 ≤ x ≤ 0.24). (b) The integrated emission intensity at 613 nm with different concentrations of Eu3+. (c) The relationship between lg(x) and lg(I/x). (d) The emission spectra of MGS:0.12Eu3+,yMn4+ (0.002 ≤ y ≤ 0.012). (e) The integrated emission intensity at 613 nm and 673 nm with concentrations of different Mn4+. (f) CIE chromaticity coordinates of MGS:0.12Eu3+,yMn4+ (y = 0, 0.002 and 0.006).
Molecules 30 01945 g006
Figure 7. The decay curves of (a) MGS:xEu3+ (0.04 ≤ x ≤ 0.24) and (b) MGS:0.12Eu3+,yMn4+ (0.002 ≤ y ≤ 0.012) phosphors. (c) The energy transfer efficiency of MGS:0.12Eu3+,yMn4+ (0.002 ≤ y ≤ 0.012). (d) Dependence of lifetime ratio τS0S of Eu3+ on C6/3, C8/3, and C10/3. (e) Energy level diagrams of Eu3+ and Mn4+.
Molecules 30 01945 g007
Figure 8. (a) Temperature-dependent emission spectra and (b) two-dimensional fluorescence topographical mapping of MGS:0.12Eu3+. (c) Temperature-dependent emission spectra and (d) two-dimensional fluorescence topographical mapping of MGS:0.009Mn4+. (e) The integrated intensities of Mn4+ at 673 nm and Eu3+ at 613 nm. (f) The plot of ln[(I0/I(T)-1] VS 1/KT for MGS:0.009Mn4+ and MGS:0.12Eu3+ phosphors.
Molecules 30 01945 g008
Figure 9. The configurational coordinate diagram for the (a) Eu3+ ions and (b) Mn4+ ions.
Molecules 30 01945 g009
Figure 10. (a) The temperature-dependent emission spectra and (b) the corresponding contour maps of MGS:0.12Eu3+,0.004Mn4+. (c) The integrated intensities of MGS:0.12Eu3+,0.004Mn4+ at 613 nm and 673 nm. (d) Temperature-dependent FIR values from I613/I673 of MGS:0.12Eu3+,0.004Mn4+. (e) Calculated Sr and Sa at different temperatures by FIR. (f) FIR temperature-cycling values of I613/I673 with three cycles.
Molecules 30 01945 g010
Figure 11. (a) The decay curves of MGS:0.12Eu3+,0.004Mn4+ at the temperatures range from 298 K to 473 K. (b) The lifetime of Mn4+ for MGS:0.12Eu3+,0.004Mn4+ sample at different temperatures. (c) The fitting curve of temperature-dependent FL. The (d) Sa and (e) Sr based on FL of Mn4+. (f) The lifetime of Mn4+ at different temperatures with three cycles.
Molecules 30 01945 g011
Figure 12. (a) The electroluminescence spectrum of the prepared WLED. (b) The electroluminescence spectra of the MGS:0.009Mn4+ sample encapsulated with a 410 nm UV chip compared to the absorption spectra of PR and PFR.
Molecules 30 01945 g012
Table 1. The detailed refinement results of MGS, MGS:0.009Mn4+, MGS:0.12Eu3+, and MGS:0.12Eu3+,0.006Mn4+ samples.
SampleMGSMGS:0.009Mn4+MGS:0.12Eu3+MGS:0.12Eu3+,0.006Mn4+
Space groupFd-3mFd-3mFd-3mFd-3m
Symmetrycubiccubiccubiccubic
a/b/c, Å8.45708.45528.45858.4530
V, Å3604.85604.46605.17603.99
Z8888
α = β = γ °90909090
Rwp8.59.68.87.5
Rp6.77.56.65.2
χ22.252.832.452.38
Disclaimer/Publisher’s Note: The statements, opinions and data contained in all publications are solely those of the individual author(s) and contributor(s) and not of MDPI and/or the editor(s). MDPI and/or the editor(s) disclaim responsibility for any injury to people or property resulting from any ideas, methods, instructions or products referred to in the content.

