
Objectively Measured Physical Activity, Sedentary Behavior and Functional Performance before and after Lower Limb Joint Arthroplasty: A Systematic Review with Meta-Analysis

 , ,
, ,  ,
, 
Abstract
1. Introduction
2. Materials and Methods
2.1. Search Strategy
2.2. Eligibility Criteria
2.3. Study Selection and Quality Assessment
2.4. Data Items
2.5. Data Analysis
3. Results
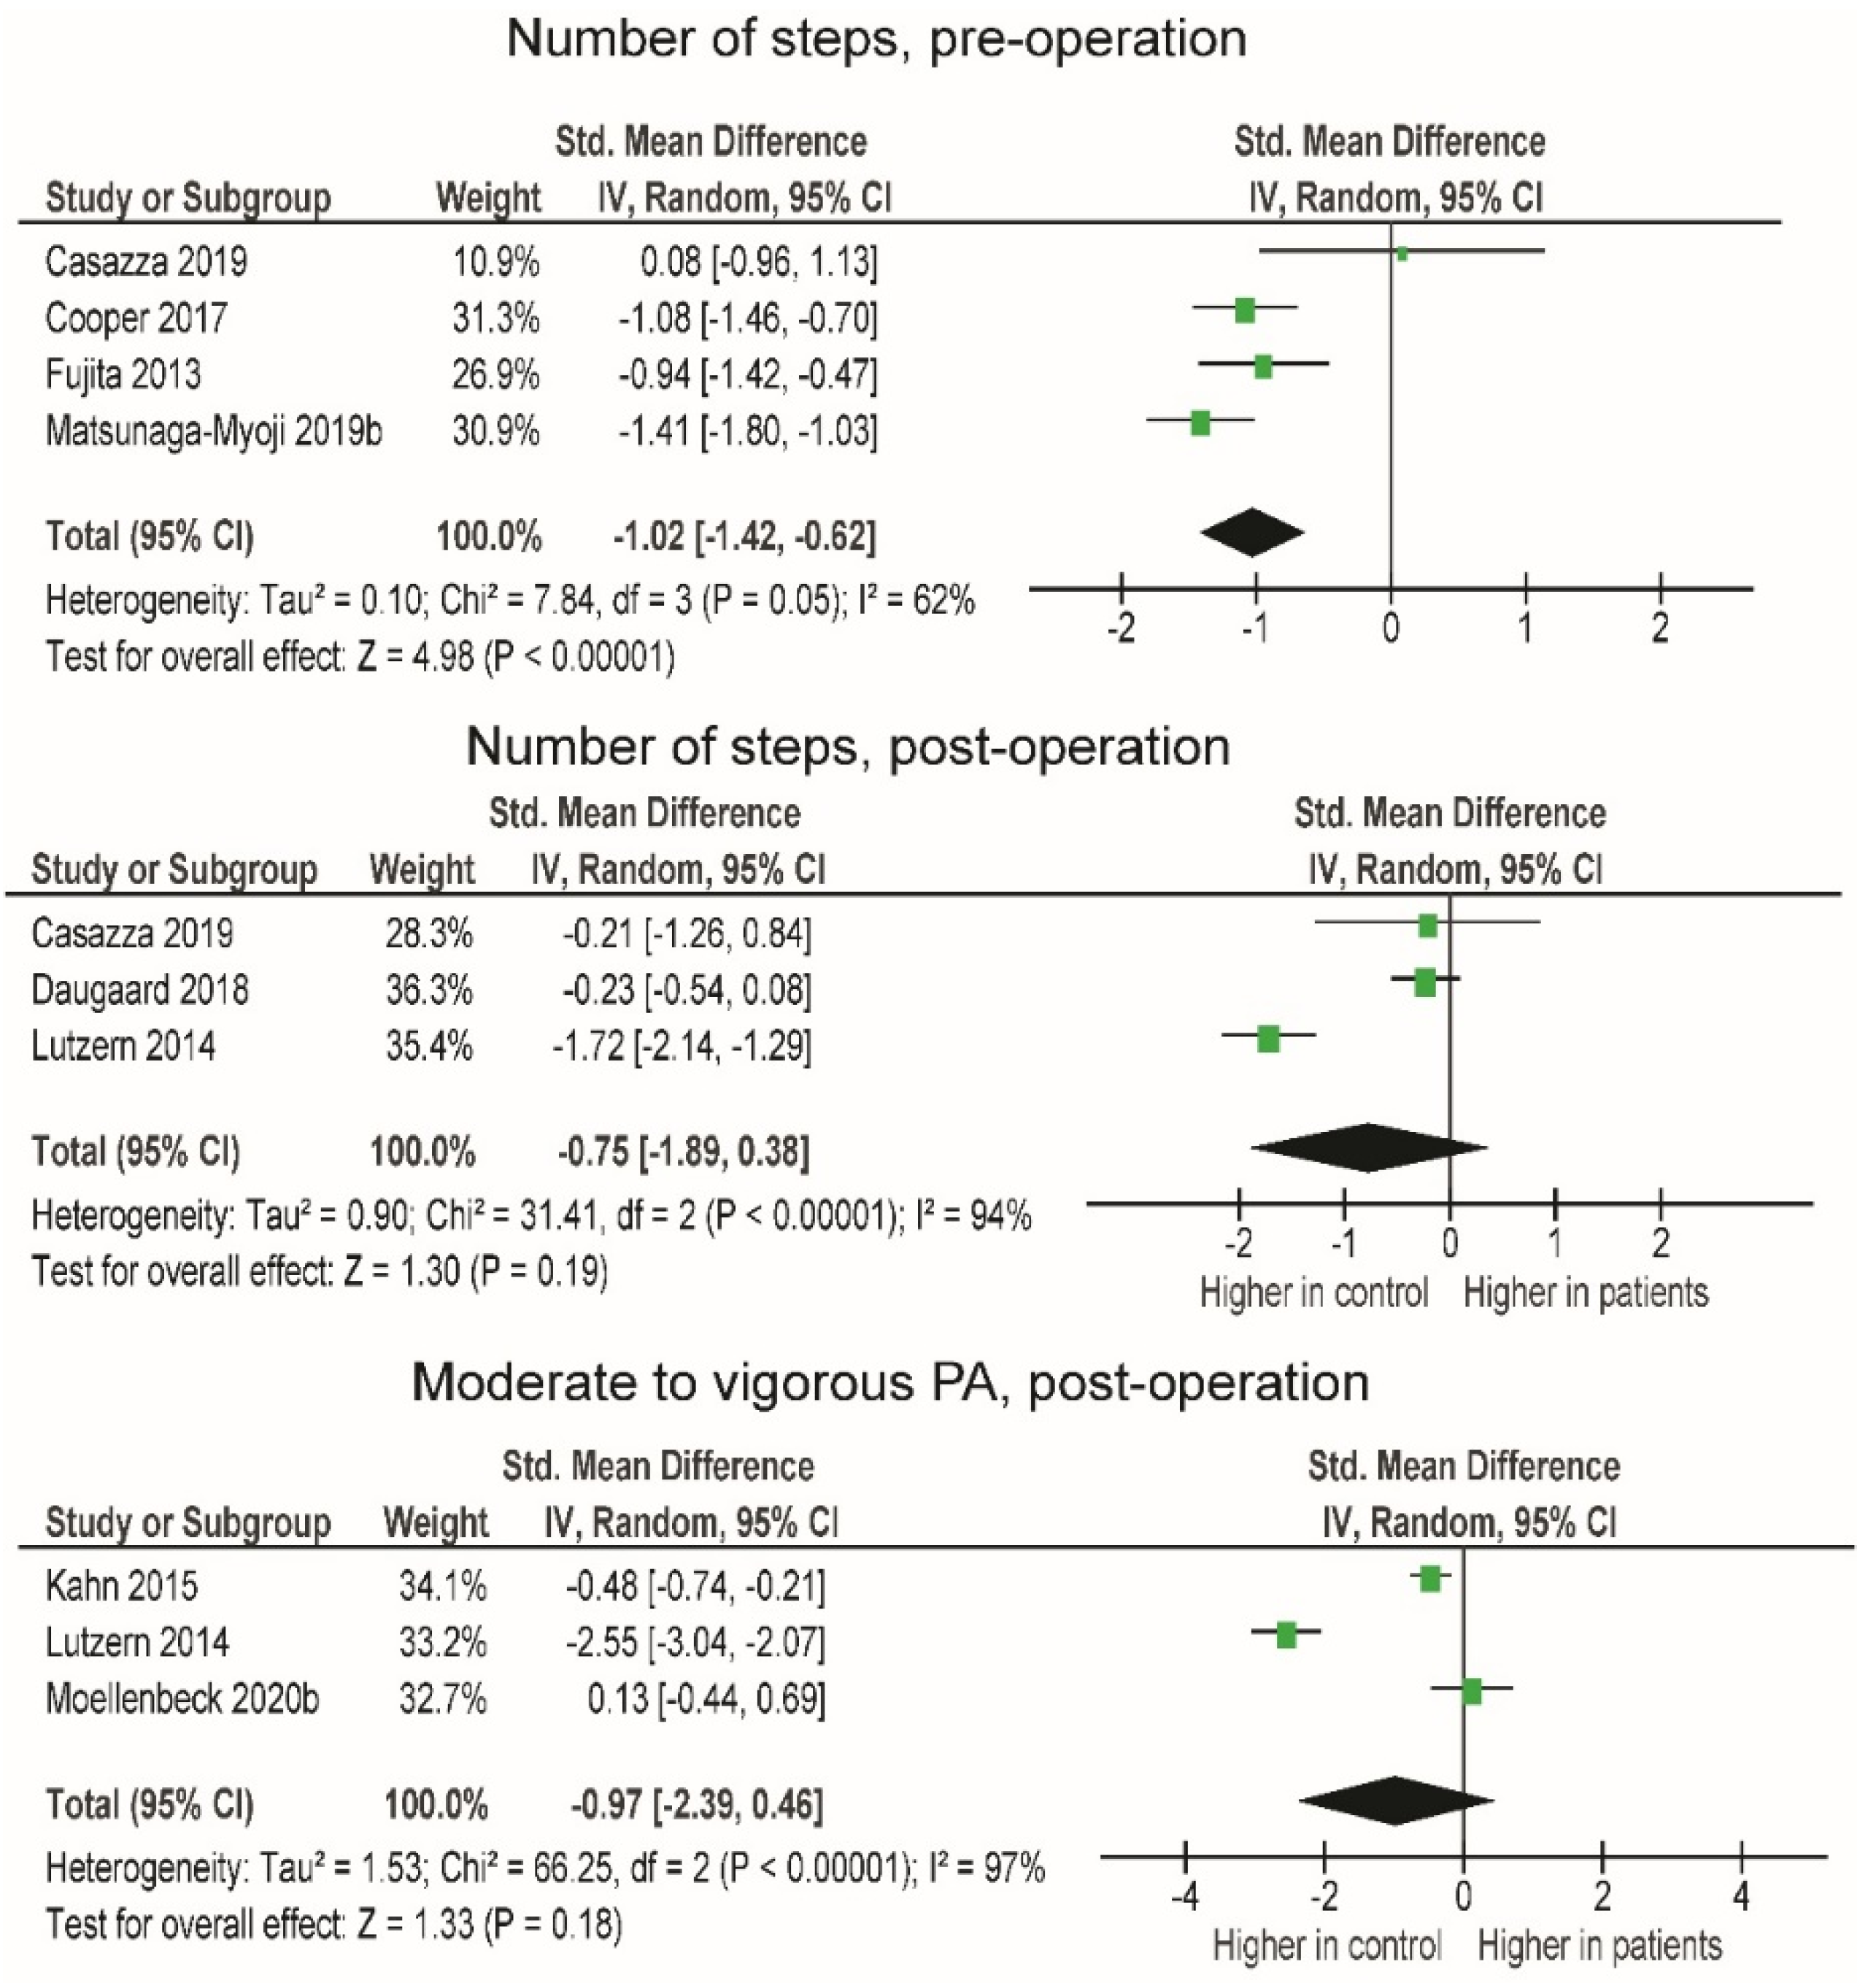
3.1. Comparison of PA between Patients and Healthy Individuals Pre- and Post-Operation
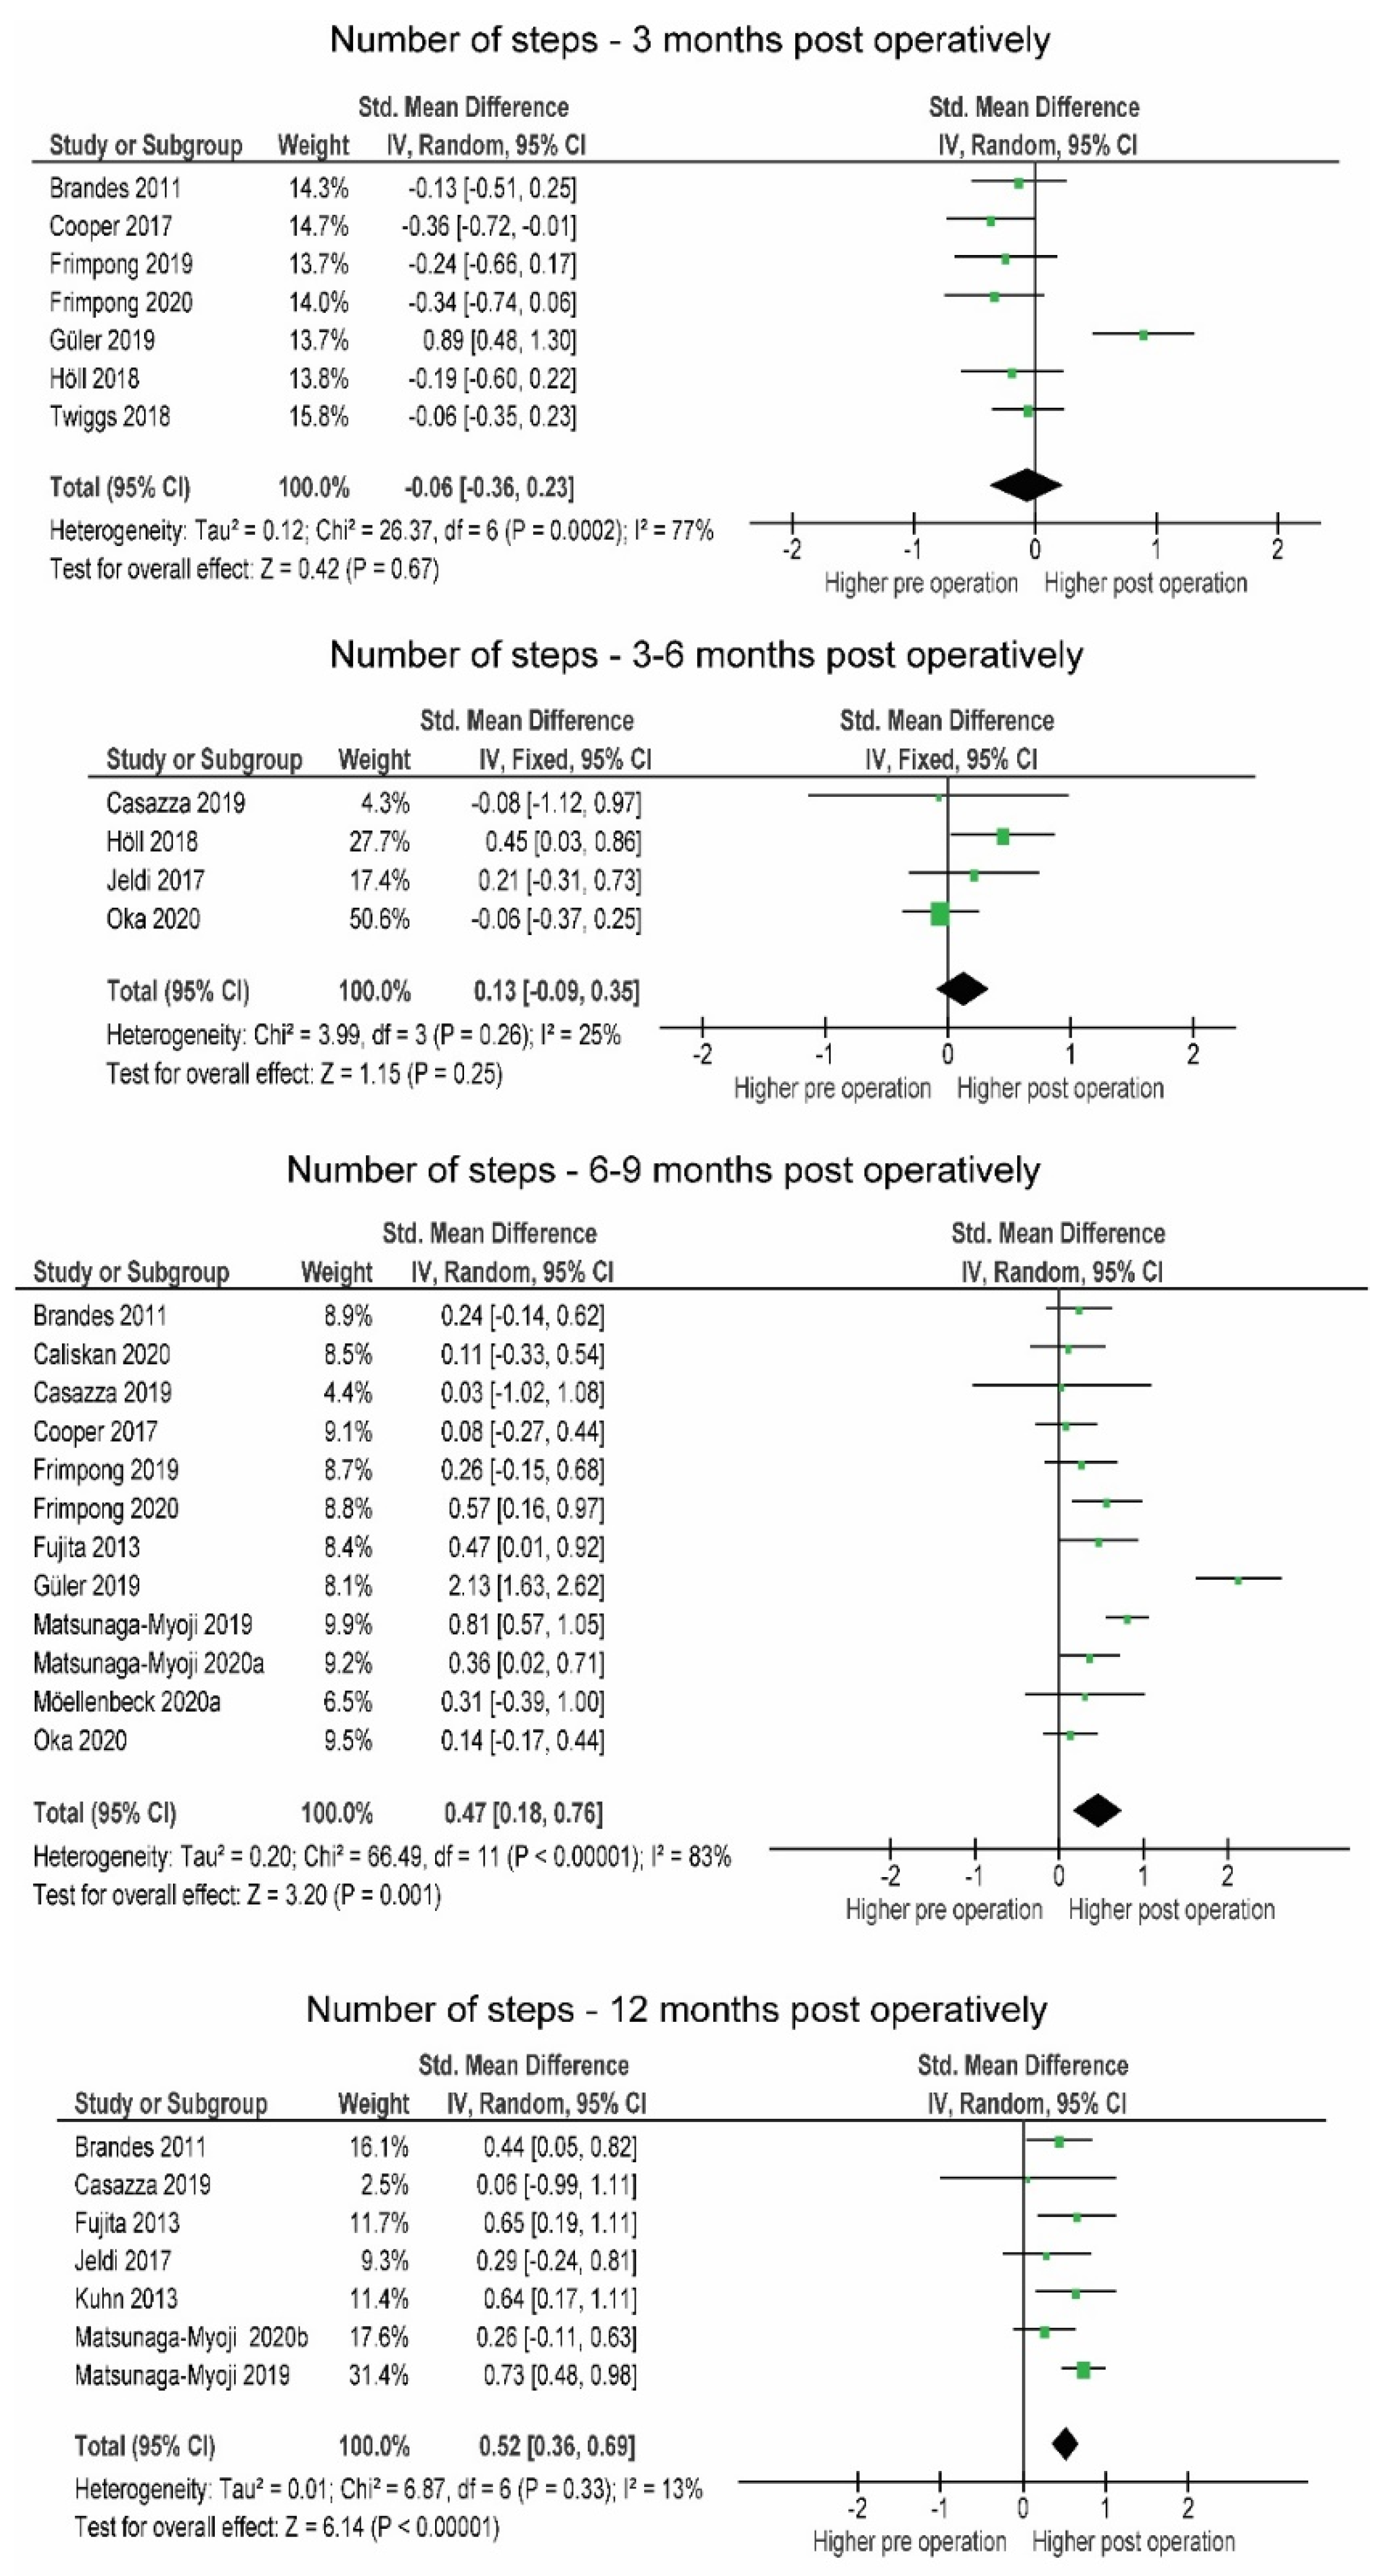
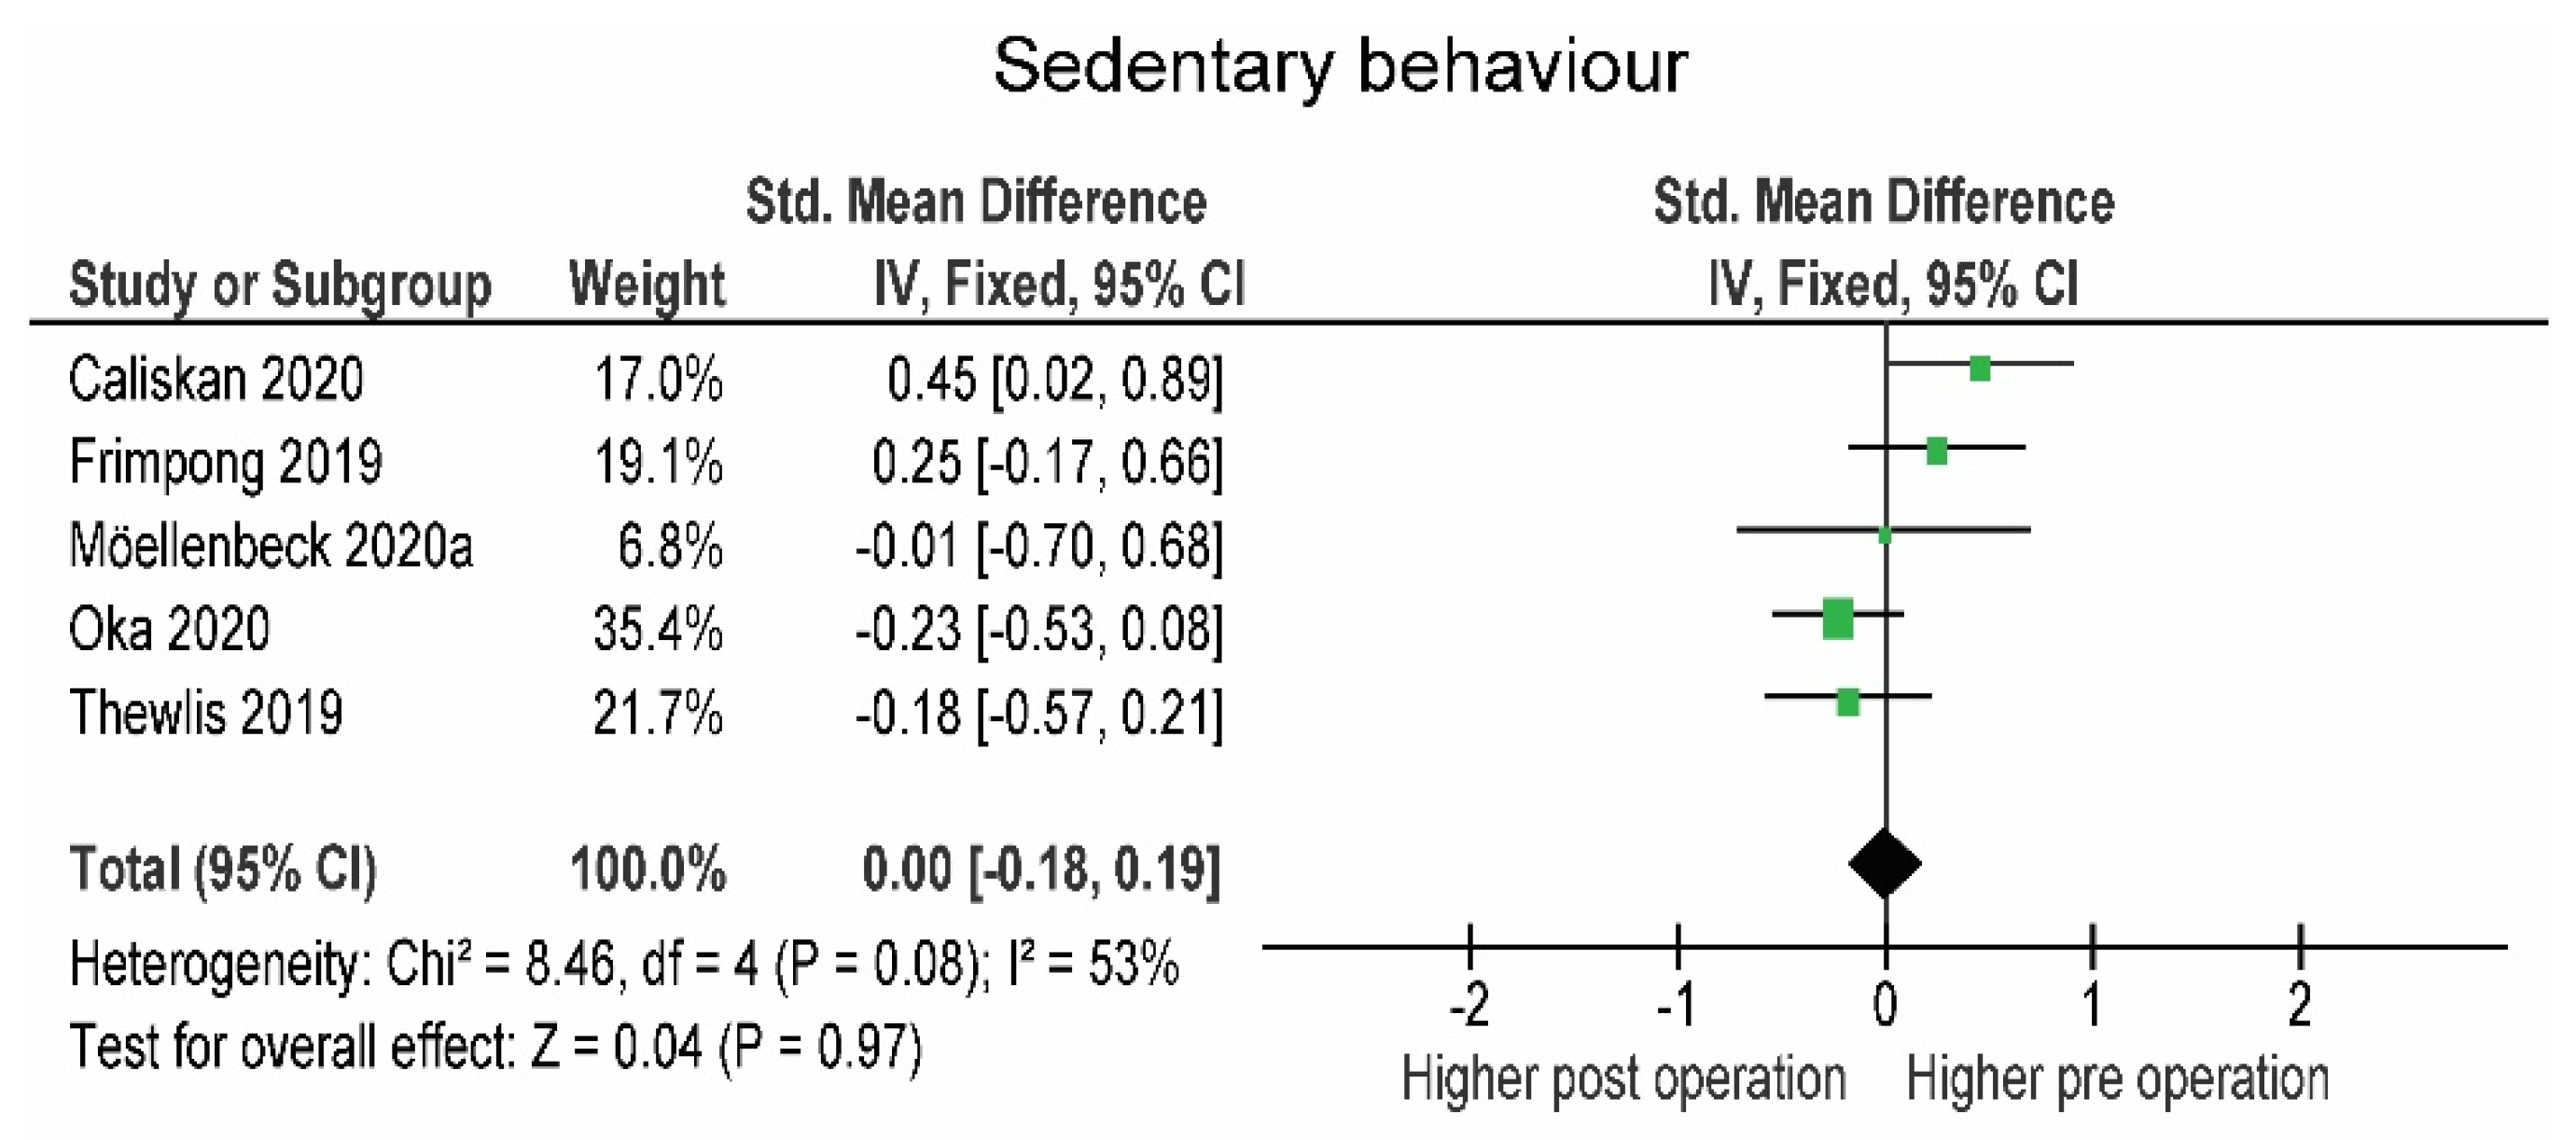
3.2. Comparison of PA and SB in Patients Pre- and Post-Operation
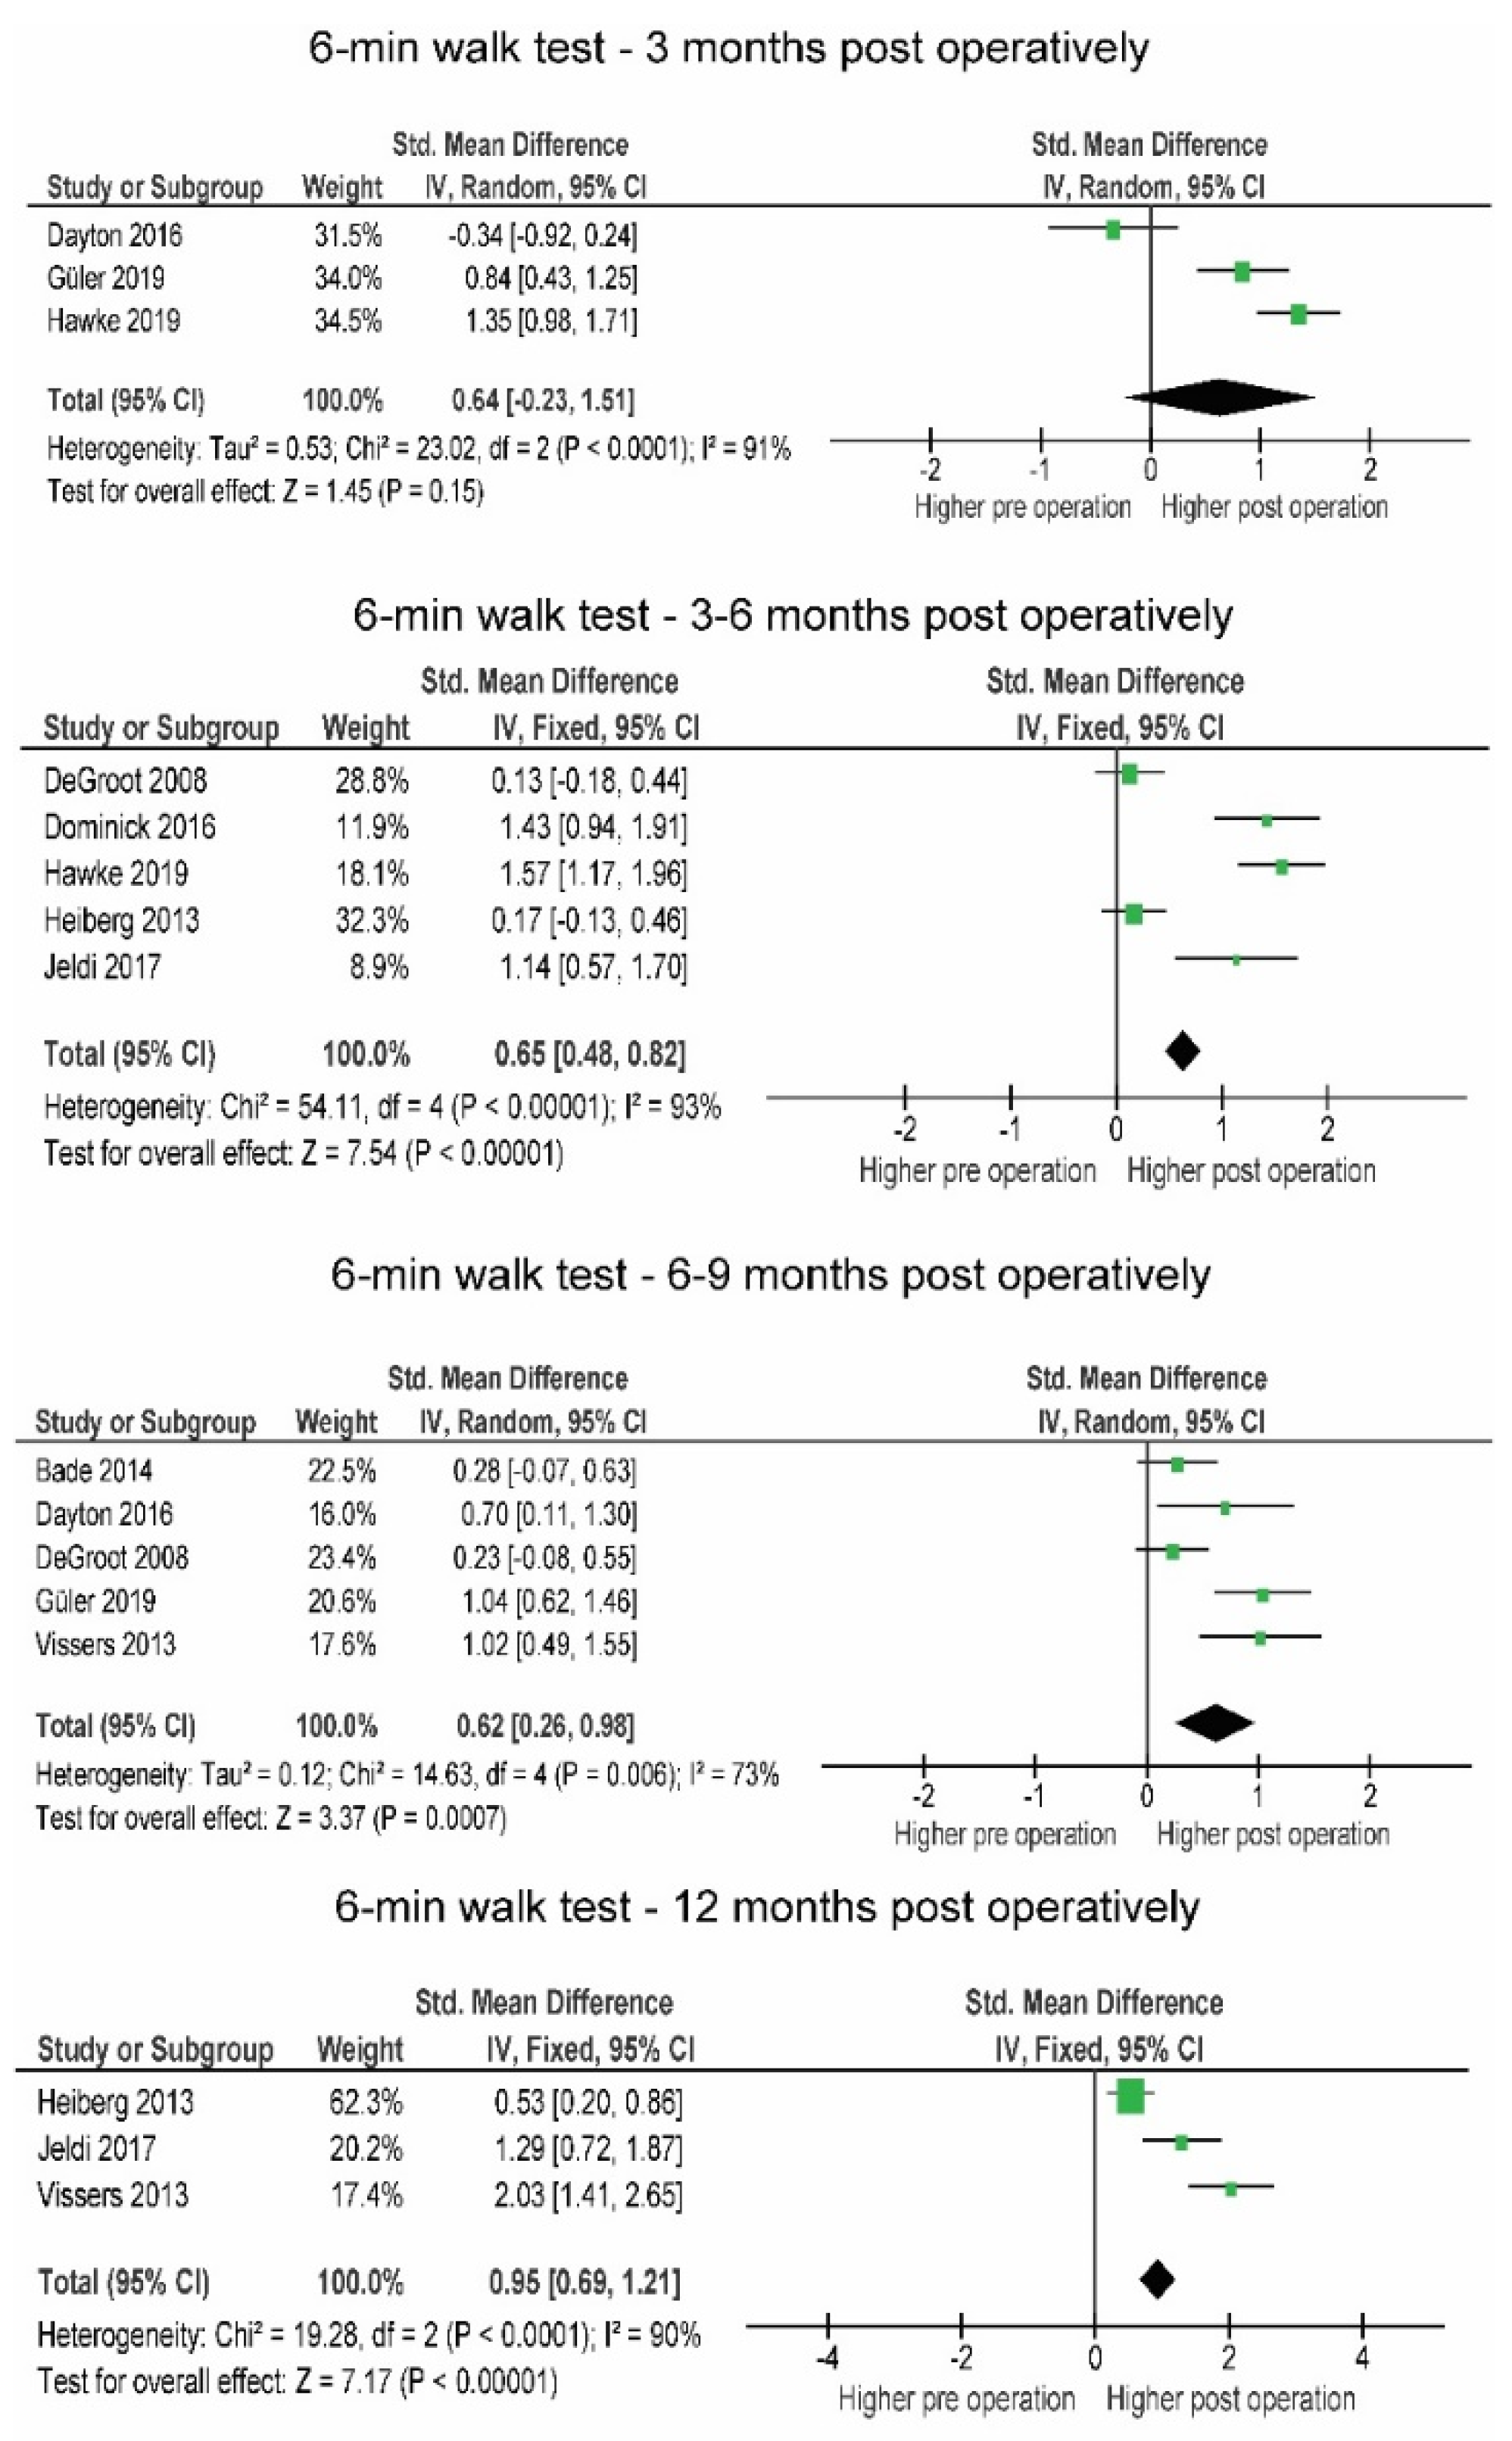
3.3. Comparison of Functional Performance in Patients Pre- and Post-Operation
3.4. Sensitivity Analyis
4. Discussion
4.1. Comparison of PA between Patients and Healthy Subjects Pre- and 12 Months Post-Operation
4.2. Comparison in PA, SB and Performance of Patients Pre- and Post-Operation
4.2.1. Post-Operative Changes in PA
4.2.2. Post-Operative Changes in SB
4.2.3. Post-Operative Changes in Functional Performance
4.2.4. Coherent Interpretation of PA, SB and Functional Performance Changes
5. Conclusions
Supplementary Materials
Author Contributions
Funding
Data Availability Statement
Conflicts of Interest
References
- Picavet, H.S.J. Prevalence of self reported musculoskeletal diseases is high. Ann. Rheum. Dis. 2003, 62, 644–650. [Google Scholar] [CrossRef]
- Smith, T.; Latham, S.; Maskrey, V.; Blyth, A. Patients’ perceptions of physical activity before and after joint replacement: A systematic review with meta-ethnographic analysis. Postgrad. Med. J. 2015, 91, 483–491. [Google Scholar] [CrossRef]
- Kurtz, S.M.; Ong, K.L.; Schmier, J.; Zhao, K.; Mowat, F.; Lau, E. Primary and Revision Arthroplasty Surgery Caseloads in the United States from 1990 to 2004. J. Arthroplast. 2009, 24, 195–203. [Google Scholar] [CrossRef]
- Sadoghi, P.; Leithner, A.; Labek, G. Overcoming Boundaries of Worldwide Joint Arthroplasty Registers: The European Arthroplasty Register Minimal Dataset. J. Arthroplast. 2013, 28, 1327–1328. [Google Scholar] [CrossRef]
- Nilsdotter, A.K.; Toksvig-Larsen, S.; Roos, E. Knee arthroplasty: Are patients’ expectations fulfilled? Acta Orthop. 2009, 80, 55–61. [Google Scholar] [CrossRef]
- Paxton, R.J.; Melanson, E.L.; Stevens-Lapsley, J.E.; Christiansen, C.L. Physical activity after total knee arthroplasty: A critical review. World J. Orthop. 2015, 6, 614–622. [Google Scholar] [CrossRef] [PubMed]
- Waldstein, W.; Kolbitsch, P.; Koller, U.; Boettner, F.; Windhager, R. Sport and physical activity following unicompartmental knee arthroplasty: A systematic review. Knee Surg. Sports Traumatol. Arthrosc. 2017, 25, 717–728. [Google Scholar] [CrossRef] [PubMed]
- World Health Organization. Global Status Report on Noncommunicable Diseases; World Health Organization: Geneva, Switzerland, 2010; Volume 176. [Google Scholar]
- Fiuza-Luces, C.; Garatachea, N.; Berger, N.A.; Lucia, A. Exercise is the Real Polypill. Physiology 2013, 28, 330–358. [Google Scholar] [CrossRef]
- Pareja-Galeano, H.; Garatachea, N.; Lucia, A. Exercise as a Polypill for Chronic Diseases; Elsevier BV: Amsterdam, The Netherlands, 2015; Volume 135, pp. 497–526. [Google Scholar]
- Bull, F.C.; Al-Ansari, S.S.; Biddle, S.; Borodulin, K.; Buman, M.P.; Cardon, G.; Carty, C.; Chaput, J.-P.; Chastin, S.; Chou, R.; et al. World Health Organization 2020 guidelines on physical activity and sedentary behaviour. Br. J. Sports Med. 2020, 54, 1451–1462. [Google Scholar] [CrossRef] [PubMed]
- Koolhaas, C.M.; Dhana, K.; van Rooij, F.J.A.; Schoufour, J.D.; Hofman, A.; Franco, O. Physical activity types and health-related quality of life among middle-aged and elderly adults: The Rotterdam Study. J. Nutr. Health Aging 2018, 22, 246–253. [Google Scholar] [CrossRef] [PubMed]
- Beale, S.J.; Bending, M.W.; Trueman, P.; Naidoo, B. Should we invest in environmental interventions to encourage physical activity in England? An economic appraisal. Eur. J. Public Health 2012, 22, 869–873. [Google Scholar] [CrossRef]
- Hagberg, L.A.; Lindholm, L. Review Article: Cost-effectiveness of healthcare-based interventions aimed at improving physical activity. Scand. J. Public Health 2006, 34, 641–653. [Google Scholar] [CrossRef]
- Kastelic, K.; Šarabon, N. Comparison of Self-Reported Sedentary Time on Weekdays with an Objective Measure (activPAL). Meas. Phys. Educ. Exerc. Sci. 2019, 23, 227–236. [Google Scholar] [CrossRef]
- Frimpong, E.; McVeigh, J.A.; Meiring, R.M. Sedentary Behavior in Patients With Knee Osteoarthritis Before and After Total Knee Arthroplasty: A Systematic Review. J. Aging Phys. Act. 2018, 26, 671–681. [Google Scholar] [CrossRef]
- Mills, K.; Falchi, B.; Duckett, C.; Naylor, J. Minimal change in physical activity after lower limb joint arthroplasty, but the outcome measure may be contributing to the problem: A systematic review and meta-analysis. Physiotherapy 2019, 105, 35–45. [Google Scholar] [CrossRef]
- Paxton, E.W.; Torres, A.; Love, R.M.; Barber, T.C.; Sheth, D.S.; Inacio, M. Total joint replacement: A multiple risk factor analysis of physical activity level 1–2 years postoperatively. Acta Orthop. 2016, 87, 44–49. [Google Scholar] [CrossRef]
- Withers, T.M.; Lister, S.; Sackley, C.; Clark, A.; Smith, T.O. Is there a difference in physical activity levels in patients before and up to one year after unilateral total hip replacement? A systematic review and meta-analysis. Clin. Rehabil. 2016, 31, 639–650. [Google Scholar] [CrossRef] [PubMed]
- Vissers, M.; Bussmann, J.; De Groot, I.; Verhaar, J.; Reijman, M. Walking and chair rising performed in the daily life situation before and after total hip arthroplasty. Osteoarthr. Cartil. 2011, 19, 1102–1107. [Google Scholar] [CrossRef]
- Almeida, G.J.; Terhorst, L.; Irrgang, J.J.; Fitzgerald, G.K.; Jakicic, J.M.; Piva, S.R. Responsiveness of Physical Activity Measures Following Exercise Programs after Total Knee Arthroplasty. J. Exerc. Sports Orthop. 2017, 4, 1–8. [Google Scholar] [CrossRef] [PubMed]
- WHO. More Active People for a Healthier World. J. Policy Model. 2018, 28, 615–627. [Google Scholar]
- Page, M.J.; McKenzie, J.E.; Bossuyt, P.M.; Boutron, I.; Hoffmann, T.C.; Mulrow, C.D.; Shamseer, L.; Tetzlaff, J.M.; Akl, E.A.; Brennan, S.E.; et al. The PRISMA 2020 statement: An updated guideline for reporting systematic reviews. Int. J. Surg. 2021, 88, 105906. [Google Scholar] [CrossRef] [PubMed]
- Higgins, J.; Green, S. Chapter 22: Overview of reviews. Cochrane handbook for systematic reviews of interventions. Cochrane Database Syst. Rev. 2008, 187–235. [Google Scholar]
- Harbour, R.; Miller, J. A new system for grading recommendations in evidence based guidelines. BMJ 2001, 323, 7308. [Google Scholar] [CrossRef]
- Wan, X.; Wang, W.; Liu, J.; Tong, T. Estimating the sample mean and standard deviation from the sample size, median, range and/or interquartile range. BMC Med. Res. Methodol. 2014, 14, 135. [Google Scholar] [CrossRef]
- Moher, D.; Liberati, A.; Tetzlaff, J.; Altman, D.G.; The PRISMA Group. Ítems de referencia para publicar Revisiones Sistemáticas y Metaanálisis: La Declaración PRISMA. Rev. Española Nutr. Hum. Y Dietética 2014, 18, 172. [Google Scholar] [CrossRef]
- Bade, M.J.; Kittelson, J.M.; Kohrt, W.M.; Stevens-Lapsley, J.E. Predicting Functional Performance and Range of Motion Outcomes After Total Knee Arthroplasty. Am. J. Phys. Med. Rehabil. 2014, 93, 579–585. [Google Scholar] [CrossRef]
- Brandes, M.; Ringling, M.; Winter, C.; Hillmann, A.; Rosenbaum, D. Changes in physical activity and health-related quality of life during the first year after total knee arthroplasty. Arthritis Rheum. 2010, 63, 328–334. [Google Scholar] [CrossRef]
- Caliskan, E.; Igdir, V.; Dogan, O.; Bicimoglu, A. Primary total knee replacement leads to an increase in physical activity but no changes in overall time of sedentary behaviour: A retrospective cohort study using an accelerometer. Int. Orthop. 2020, 44, 2597–2602. [Google Scholar] [CrossRef]
- Casazza, G.A.; Lum, Z.C.; Giordani, M.; Meehan, J.P. Total Knee Arthroplasty: Fitness, Heart Disease Risk, and Quality of Life. J. Knee Surg. 2019, 33, 884–891. [Google Scholar] [CrossRef] [PubMed]
- Cooper, N.A.; Rakel, B.A.; Zimmerman, M.B.; Tonelli, S.M.; Herr, K.A.; Clark, C.; Noiseux, N.O.; Callaghan, J.J.; Sluka, K. Predictors of multidimensional functional outcomes after total knee arthroplasty. J. Orthop. Res. 2017, 35, 2790–2798. [Google Scholar] [CrossRef]
- Daugaard, R.; Tjur, M.; Sliepen, M.; Lipperts, M.; Grimm, B.; Mechlenburg, I. Are patients with knee osteoarthritis and patients with knee joint replacement as physically active as healthy persons? J. Orthop. Transl. 2018, 14, 8–15. [Google Scholar] [CrossRef] [PubMed]
- Dayton, M.R.; Judd, D.L.; Hogan, C.A.; Stevens-Lapsley, J. Performance-Based Versus Self-Reported Outcomes Using the Hip Disability and Osteoarthritis Outcome Score After Total Hip Arthroplasty. Am. J. Phys. Med. Rehabil. 2016, 95, 132–138. [Google Scholar] [CrossRef] [PubMed]
- De Groot, I.B.; Bussmann, H.J.; Stam, H.J.; Verhaar, J.A. Small Increase of Actual Physical Activity 6 Months After Total Hip or Knee Arthroplasty. Clin. Orthop. Relat. Res. 2008, 466, 2201–2208. [Google Scholar] [CrossRef]
- Dominick, G.M.; Zeni, J.A.; White, D.K. Association of Psychosocial Factors With Physical Activity and Function After Total Knee Replacement: An Exploratory Study. Arch. Phys. Med. Rehabil. 2016, 97, S218–S225. [Google Scholar] [CrossRef]
- Frimpong, E.; McVeigh, J.A.; Van Der Jagt, D.; Mokete, L.; Kaoje, Y.S.; Tikly, M.; Meiring, R.M. Light intensity physical activity increases and sedentary behavior decreases following total knee arthroplasty in patients with osteoarthritis. Knee Surg. Sports Traumatol. Arthrosc. 2018, 27, 2196–2205. [Google Scholar] [CrossRef] [PubMed]
- Frimpong, E.; van der Jagt, D.R.; Mokete, L.; Pietrzak, J.; Kaoje, Y.S.; Smith, A.; McVeigh, J.A.; Meiring, R.M. Improvements in Objectively Measured Activity Behaviors Do Not Correlate with Improvements in Patient-Reported Outcome Measures Following Total Knee Arthroplasty. J. Arthroplast. 2020, 35, 712–719.e4. [Google Scholar] [CrossRef]
- Fujita, K.; Makimoto, K.; Tanaka, R.; Mawatari, M.; Hotokebuchi, T. Prospective study of physical activity and quality of life in Japanese women undergoing total hip arthroplasty. J. Orthop. Sci. 2013, 18, 45–53. [Google Scholar] [CrossRef] [PubMed]
- Güler, T.; Sivas, F.; Yurdakul, F.G.; Çelen, E.; Utkan, A.; Başkan, B.; Bodur, H.; Özkurt, B. Early improvement in physical activity and function after total hip arthroplasty: Predictors of outcomes. Turk. J. Phys. Med. Rehabil. 2019, 65, 379–388. [Google Scholar] [CrossRef]
- Hawke, L.J.; Shields, N.; Dowsey, M.M.; Choong, P.F.M.; Taylor, N.F. Physical activity levels after hip and knee joint replacement surgery: An observational study. Clin. Rheumatol. 2018, 38, 665–674. [Google Scholar] [CrossRef]
- Heiberg, K.E.; Ekeland, A.; Bruun-Olsen, V.; Mengshoel, A.M. Recovery and Prediction of Physical Functioning Outcomes During the First Year After Total Hip Arthroplasty. Arch. Phys. Med. Rehabil. 2013, 94, 1352–1359. [Google Scholar] [CrossRef]
- Höll, S.; Blum, A.; Gosheger, G.; Dieckmann, R.; Winter, C.; Rosenbaum, D. Clinical outcome and physical activity measured with StepWatch 3™ Activity Monitor after minimally invasive total hip arthroplasty. J. Orthop. Surg. Res. 2018, 13, 1–5. [Google Scholar] [CrossRef]
- Jeldi, A.J.; Deakin, A.H.; Allen, D.J.; Granat, M.H.; Grant, M.; Stansfield, B.W. Total Hip Arthroplasty Improves Pain and Function but Not Physical Activity. J. Arthroplast. 2017, 32, 2191–2198. [Google Scholar] [CrossRef] [PubMed]
- Kahn, T.L.; Schwarzkopf, R. Does Total Knee Arthroplasty Affect Physical Activity Levels? Data from the Osteoarthritis Initiative. J. Arthroplast. 2015, 30, 1521–1525. [Google Scholar] [CrossRef] [PubMed]
- Ko, V.; Naylor, J.M.; Harris, I.A.; Crosbie, J.; Yeo, A.E. The six-minute walk test is an excellent predictor of functional ambulation after total knee arthroplasty. BMC Musculoskelet. Disord. 2013, 14, 145. [Google Scholar] [CrossRef] [PubMed]
- Kuhn, M.; Harris-Hayes, M.; Steger-May, K.; Pashos, G.; Clohisy, J.C. Total Hip Arthroplasty in Patients 50 Years or Less. J. Arthroplast. 2013, 28, 872–876. [Google Scholar] [CrossRef] [PubMed]
- Lin, B.A.; Thomas, P.; Spiezia, F.; Loppini, M.; Maffulli, N. Changes in daily physical activity before and after total hip arthroplasty. A pilot study using accelerometry. Surgeon 2013, 11, 87–91. [Google Scholar] [CrossRef] [PubMed]
- Lützner, C.; Kirschner, S.; Lützner, J. Patient Activity After TKA Depends on Patient-specific Parameters. Clin. Orthop. Relat. Res. 2014, 472, 3933–3940. [Google Scholar] [CrossRef] [PubMed]
- Lützner, C.; Beyer, F.; Kirschner, S.; Lützner, J. How Much Improvement in Patient Activity Can Be Expected After TKA? Orthopedics 2016, 39, S18–S23. [Google Scholar] [CrossRef] [PubMed]
- Matsunaga-Myoji, Y.; Fujita, K.; Ide, S.; Tabuchi, Y.; Mawatari, M. Improved levels of physical activity in patients over 75 years following total knee arthroplasty. J. Orthop. Surg. 2019, 27, 1–5. [Google Scholar] [CrossRef]
- Matsunaga-Myoji, Y.; Fujita, K.; Ide, S.; Tabuchi, Y.; Mawatari, M.; Makimoto, K. Changes in actual daily physical activity and patient-reported outcomes up to 2 years after total knee arthroplasty with arthritis. Geriatr. Nurs. 2020, 41, 949–955. [Google Scholar] [CrossRef] [PubMed]
- Matsunaga-Myoji, Y.; Fujita, K.; Makimoto, K.; Tabuchi, Y.; Mawatari, M.; Matsunaga, Y. Three-Year Follow-Up Study of Physical Activity, Physical Function, and Health-Related Quality of Life After Total Hip Arthroplasty. J. Arthroplast. 2019, 35, 198–203. [Google Scholar] [CrossRef]
- Moellenbeck, B.; Horst, F.; Gosheger, G.; Theil, C.; Seeber, L.; Kalisch, T. Sedentary Behavior in Older Patients before and after Total Hip Arthroplasty: A Prospective Cohort Study. Healthcare 2020, 8, 346. [Google Scholar] [CrossRef]
- Moellenbeck, B.; Horst, F.; Gosheger, G.; Theil, C.; Seeber, L.; Kalisch, T. Does Total Hip or Knee Arthroplasty Have an Effect on the Patients’ Functional or Behavioral Outcome and Health-Related Quality of Life of the Affected Partners? J. Arthroplast. 2021, 36, 885–891. [Google Scholar] [CrossRef]
- Oka, T.; Ono, R.; Tsuboi, Y.; Wada, O.; Kaga, T.; Tamura, Y.; Yamamoto, Y.; Mizuno, K. Effect of preoperative sedentary behavior on clinical recovery after total knee arthroplasty: A prospective cohort study. Clin. Rheumatol. 2019, 39, 891–898. [Google Scholar] [CrossRef] [PubMed]
- Rezzadeh, K.; Behery, O.A.; Kester, B.S.; Long, W.J.; Schwarzkopf, R. The Effect of Total Knee Arthroplasty on Physical Activity and Body Mass Index: An Analysis of the Osteoarthritis Initiative Cohort. Geriatr. Orthop. Surg. Rehabil. 2019, 10, 2151459318816480. [Google Scholar] [CrossRef] [PubMed]
- Thewlis, D.; Bahl, J.S.; Fraysse, F.; Curness, K.; Arnold, J.; Taylor, M.; Callary, S.; Solomon, L. Objectively measured 24-hour activity profiles before and after total hip arthroplasty. Bone Jt. J. 2019, 101-B, 415–425. [Google Scholar] [CrossRef]
- Tobinaga, T.; Obayashi, S.; Miyamoto, R.; Oba, K.; Abe, N.; Tsukamoto, S.; Ogawa, M.; Tochigi, Y.; Oka, K.; Ozeki, S. Factors influencing life-space mobility change after total knee arthroplasty in patients with severe knee osteoarthritis. J. Phys. Ther. Sci. 2019, 31, 889–894. [Google Scholar] [CrossRef] [PubMed][Green Version]
- Twiggs, J.; Salmon, L.; Kolos, E.; Bogue, E.; Miles, B.; Roe, J. Measurement of physical activity in the pre- and early post-operative period after total knee arthroplasty for Osteoarthritis using a Fitbit Flex device. Med. Eng. Phys. 2018, 51, 31–40. [Google Scholar] [CrossRef]
- Vissers, M.; Bussmann, J.; de Groot, I.; Verhaar, J.; Reijman, M. Physical functioning four years after total hip and knee arthroplasty. Gait Posture 2013, 38, 310–315. [Google Scholar] [CrossRef]
- Guedes, R.C.; Dias, J.M.D.; Dias, R.C.; Borges, V.S.; Lustosa, L.P.; Rosa, N.M.B. Total hip arthroplasty in the elderly: Impact on functional performance. Braz. J. Phys. Ther. 2011, 15, 123–130. [Google Scholar] [CrossRef]
- De Luca, M.L.; Ciccarello, M.; Martorana, M.; Infantino, D.; Mauro, G.L.; Bonarelli, S.; Benedetti, M.G. Pain monitoring and management in a rehabilitation setting after total joint replacement. Medicine 2018, 97, e12484. [Google Scholar] [CrossRef]
- Pinto, P.R.; McIntyre, T.; Araújo-Soares, V.; Almeida, A.; Ferrero, R. Persistent pain after total knee or hip arthroplasty: Differential study of prevalence, nature, and impact. J. Pain Res. 2013, 6, 691–703. [Google Scholar] [CrossRef] [PubMed]
- Arnold, J.B.; Walters, J.L.; Ferrar, K. Does Physical Activity Increase After Total Hip or Knee Arthroplasty for Osteoarthritis? A Systematic Review. J. Orthop. Sports Phys. Ther. 2016, 46, 431–442. [Google Scholar] [CrossRef] [PubMed]
- Loyd, B.J.; Stackhouse, S.; Dayton, M.; Hogan, C.; Bade, M.; Stevens-Lapsley, J. The relationship between lower extremity swelling, quadriceps strength, and functional performance following total knee arthroplasty. Knee 2019, 26, 382–391. [Google Scholar] [CrossRef]
- Vissers, M.M.; Bussmann, J.B.; Verhaar, J.; Arends, L.R.; Furlan, A.; Reijman, M. Recovery of Physical Functioning After Total Hip Arthroplasty: Systematic Review and Meta-Analysis of the Literature. Phys. Ther. 2011, 91, 615–629. [Google Scholar] [CrossRef]
- Witjes, S.; Gouttebarge, V.; Kuijer, P.P.F.; van Geenen, R.; Poolman, R.; Kerkhoffs, G.M.M.J. Return to Sports and Physical Activity After Total and Unicondylar Knee Arthroplasty: A Systematic Review and Meta-Analysis. Sports Med. 2016, 46, 269–292. [Google Scholar] [CrossRef]
- Cook, J.R.; Warren, M.; Ganley, K.J.; Prefontaine, P.; Wylie, J.W. A comprehensive joint replacement program for total knee arthroplasty: A descriptive study. BMC Musculoskelet. Disord. 2008, 9, 154. [Google Scholar] [CrossRef]
- Hylkema, T.H.; Brouwer, S.; Kooijman, C.M.; De Vries, A.J.; Breukelman, F.; Dekker, H.; Almansa, J.; Kuijer, P.P.F.M.; Bulstra, S.K.; Stevens, M. Accelerometer Measured Sedentary and Physical Activity Behaviors of Working Patients after Total Knee Arthroplasty, and their Compensation Between Occupational and Leisure Time. J. Occup. Rehabil. 2021, 31, 350–359. [Google Scholar] [CrossRef]
- Peter, W.F.; Nelissen, R.; Vlieland, T.V. Guideline Recommendations for Post-Acute Postoperative Physiotherapy in Total Hip and Knee Arthroplasty: Are They Used in Daily Clinical Practice? Musculoskelet. Care 2014, 12, 125–131. [Google Scholar] [CrossRef]
- Christiansen, M.B.; Thoma, L.; Master, H.; Voinier, D.; Schmitt, L.A.; Ziegler, M.L.; LaValley, M.P.; White, D.K. Feasibility and Preliminary Outcomes of a Physical Therapist–Administered Physical Activity Intervention After Total Knee Replacement. Arthritis Rheum. 2020, 72, 661–668. [Google Scholar] [CrossRef] [PubMed]
- Paxton, R.J.; Forster, J.E.; Miller, M.J.; Gerron, K.L.; Stevens-Lapsley, J.; Christiansen, C.L. A Feasibility Study for Improved Physical Activity After Total Knee Arthroplasty. J. Aging Phys. Act. 2018, 26, 7–13. [Google Scholar] [CrossRef] [PubMed]
- Pellegrini, C.A.; Chang, R.W.; Dunlop, D.D.; Conroy, D.E.; Lee, J.; Van Horn, L.; Spring, B.; Cameron, K.A. Comparison of a Patient-Centered Weight Loss Program starting before versus after knee replacement: A pilot study. Obes. Res. Clin. Pract. 2018, 12, 472–478. [Google Scholar] [CrossRef] [PubMed]
- White, D.K.; Tudor-Locke, C.; Felson, D.; Gross, K.D.; Niu, J.; Nevitt, M.; Lewis, C.E.; Torner, J.; Neogi, T. Walking to Meet Physical Activity Guidelines in Knee Osteoarthritis: Is 10,000 Steps Enough? Arch. Phys. Med. Rehabil. 2013, 94, 711–717. [Google Scholar] [CrossRef] [PubMed]


| Study | Study Design | Pre-Operative Descriptive Statistics | Type and Location of Arthroplasty | Outcome | Measurement | Main Conclusions |
|---|---|---|---|---|---|---|
| Bade 2014 [28] | Prospective observational study | n = 64 sex = 50% F, 50% M; age = 64.6 ± 8.5 BMI = 30.6 ± 4.8 | Tricompartmental, cemented TKA with the medial parapatellar approach. | Performance: 6MWT, TUG | Pre: 1–2 weeks Post: 6 months | Acute post-operative TUG performance can be used for establishing a prognosis. |
| Brandes 2011 [29] | Prospective observational study | n = 53 sex = 63% F; 27% M age = 65.8 ± 5.8 BMI = 30.7 ± 4.1 | Cemented and uncemented TKA. | SB and PA: tri-axial DynaPort Activity Monutor (McRoberts); Step activity monitor (OrhoCare Innovations) | Pre: 1–2 weeks Post: 2 months, 6 months, 12 months | The activity level post treatment seems to be influenced by physical activity behavior prior to surgery rather than by the treatment itself. |
| Caliskan 2020 [30] | Prospective observational study | n = 36 sex = 86% F; 14% M age = 67.3 ± 7.7 BMI = 33.2 ± 5.9 | Primary TKA. | SB and PA: ActiCal (Philips Respironics) | Pre: 1 week Post: 6 months | No change in sedentary behavior time, increased light physical activity and moderate to vigorous activity. |
| Casazza 2019 [31] | Prospective control study | n = 7 sex = 5 F; 2 M age = 55.6 ± 3.5 BMI = 32.8 ± 1.5 | Primary TKA. | SB and PA: Sensewear Pro 3 (BodyMedia) | Non-significant trends towards improved CDV fitness and activity levels 12 months after surgery. | |
| Cooper 2017 [32] | Prospective control study | n = 62 sex = 58% F; 42% M age = 60.5 ± 10.3 BMI = 33.3 ± 6.7 | TKA. | SB and PA: single axis accelerometer (PAL Technologies). | Pre: Post: 6 weeks, 6 months | Daily function only returns to the pre-operative level after six months. |
| Daugaard 2018 [33] | Cross-section study | n = 52 sex = 50% F; 50% M age = 62 ± 9.6 BMI = N/A | Primary unilateral total or unicompartmental knee replacement surgery. | SB and PA: tri-axial accelerometer X16-mini (GCdataconcepts) and AX3 (Axivity) | Post: at least 5 years | Knee OA and treatment with joint replacement hardly affect health-related general activity but affects specific behavior. |
| Dayton 2016 [34] | Prospective observational study | n = 23 sex = 16 F; 7 M age = 61.4 ± 8.3 BMI = 29.2 ± 5.1 | Primary unilateral posterior approach THA due to OA. Between June 2010 and August 2011. | Performance: 6 MVT, TUG | Pre: 2 weeks Post: 1 month, 6 months | Performance seems to increase 6 months post-operation. |
| De Groot 2008 [35] | Prospective observational study | n = 44 TKA; n = 36 THA sex = TKA: 55% F, 45% M; THA: 64%F; 36% M age = TKA: 62.1 ± 9.7; THA: 61.5 ± 12.8 BMI = TKA: 26.6 ± 4.2; THA: 32.1 ± 5.3 | Posterolateral approach THA. TKA procedures using computer navigation (Brainlab, Faldkirchen, Germayn) were performed. | SB and PA: Activity monitor accelerometer (AM) | Pre: 2 months Post: 3 months, 6 months | Patients did not adopt a more active lifestyle 6 months after surgery despite improvements in other aspects of physical functioning. |
| Dominick 2018 [36] | Prospective observational study | n = 41 sex = 68.3% F; 31.7% M age = 65.4 ± 7.9 BMI = 34.4 ± 7.7 | Primary elective TKA for knee OA. | Performance: 6 MVT | Post: 1 month, 3 months | There is a complex and poorly understood relationship between thoughts, behaviors and physical impairments. |
| Frimpong 2019 [37] | Sub-study of prospective observational study | n = 49 sex = 90% F; 10% M age = 62.8 ± 8.6 BMI = 33.8 ± 7.1 | Primary TKA. | SB and PA: GTX3 (ActiGraph) | Pre: 2 weeks Post: 6 weeks, 6 months | Objectively measured light physical activity increase and sedentary behavior decreased 6 months after TKA. |
| Frimpong 2020 [38] | Prospective observational study | n = 45 sex = 93% F; 7% M age = 63.8 ± 8.8 BMI = 34.6 ± 7.8 | Primary TKA from August 2015 to April 2017. | SB and PA: activPAL (PAL Technologies) | Pre: 2 weeks Post: 6 weeks, 6 months | Decreasing pain and reducing functional limitation have no effect on changes in activity behavior in obese patients with knee OA. |
| Fujita 2013 [39] | Prospective control study | n = 38 sex = 100% F age = 60.9 ± 9.1 BMI = 23.0 ± 3.6 | Primary THA for OA. | PA: Lifecoder SX pedometer (Suzuken) | Pre: 4 weeks Post: 6 months, 12 months | In the patients, all physical activity indicators improved significantly over time and reached 80–90% of those in the control group 12 months after THA. |
| Güler 2019 [40] | Prospective control study | n = 50 sex = 72% F; 28% M age = 57.1 ± 13 BMI = 29.2 ± 5.2 | Anterolateral approach THA with uncemented prothesis between October 2014 and October 2015. | PA: Pedometer TKS1257 (BTM life) | Pre: NA Post: 6 weeks, 6 months | Patients with OA showed improved physical function and activity as early as six weeks and up to six months after THA. |
| Hawke 2019 [41] | Prospective observational study | n = 54 sex = 57% F; 43% M age = 67.8 ± 8 BMI = N/A | Primary total hip or knee joint replacement. | Performance: 6MWT, TUG | Post: 0 weeks, 6 weeks, 12 weeks | Walking performance increased after group-based therapy and continued to improve after group discharge. |
| Heiberg 2013 [42] | Prospective observational study | n = 88 sex = 58% F; 42% M age = 66 (64–68) BMI = 27 (26–27) | Primary THA from October 2008 to June 2010. | Performance: 6MWT | Pre: Post: 3 months, 12 months | After THA performance improved slowly through the first post-operative year. |
| Höll 2018 [43] | Prospective observational study | n = 46 sex = 54.4% F; 45.6% M age = 63.3 ± 10 BMI = 27.1 ± 4 | Minimal invasive, direct anterior approach THA. | PA and SB: Step-Watch 3TM Activity Monitor (Orthocare Innovations) | Pre: 1 week Post: 6 weeks, 3 months | Objectively measured PA takes longer than 6 weeks for significant improvements. |
| Jeldi 2017 [44] | Prospective observational study | n = 30 sex = 70% F; 30% M age = 67 (50–82) BMI = 31 (19–43) | Uncemented an cemented posterior approach THA. | PA and SB: activPAL3 (PAL Technologies) | Pre: within 2 weeks Post: 3 months, 12 months | No change in the volume of PA 12 months post-operation. |
| Kahn 2015 [45] | Cross section study | n = 63; n = 60 sex = 49.2% F; 50.8%; 50% F; 50% M age = 68.4 ± 8.2; 67.3 ± 8.7 BMI = 29.2 ± 4.8; 31.1 ± 5.3 | Primary TKA. | PA and SB: ActiGraph GT1M (ActiGraph) | Pre: 552.6 ± 358.9 days Post: 624.8 ± 420.6 days | No significant difference in physical activity levels between the OA and TKA group. |
| Ko 2013 [46] | Randomized control study | n = 32 sex = 56% F; 44% M age = 66.7 (64.3–69.2) BMI = 30.8 (27.6–34.9) | Primary TKA. | Performance: 6MWT, TUG | Post: 12 to 18 months | Controls performed significantly better in both the TUG and 6MWT. |
| Kuhn 2013 [47] | Prospective observational study | n = 37 sex = 68% F; 32% M age = 42.1 ± 7.2 BMI = 29 ± 5.6 | Primary THA. | PA and SB: StepWatch Activity Monitor 3.0 (Cyma Corp.) | Pre: NA Post: 1.3 ± 0.2 years | Significant improvement in physical activity level and intensity was observed in patients. |
| Lin 2013 [48] | Prospective observational study | n = 12 sex = 100% F age = 58.2 ± 3.7 BMI = 23.4 ± 4.1 | THA using Secur-Fit Plus Max stem (Stryker), Trident Acetabular Shell (Stryker) and Trident Polyethylene Bearing (Stryker) implants. | PA and SB: RT3 accelerometer (StayHealthy) | Pre: 1 month Post: 6 months | Patients did not develop a more active lifestyle, but they increased the amount of moderate and vigorous activities after surgery. |
| Lützner 2014 [49] | Prospective observational study | n = 97 sex = 46.4% F; 53.6% M age = 68.9 (67.2–70.6) BMI = 31.3 (30.3–32.3) | Unconstrained TKA between March 2009 and September 2011. | PA and SB: activPAL (PAL Technologies) | Pre: 1 week Post: 12 months | Moderate improvement in the total number of steps, but no change in daily walking time. |
| Lützner 2016 [50] | Prospective observational study | n = 221 sex = 56.6% F; 43.4% M age = 68.1 ± 9.5 BMI = 31.3 ± 4.9 | Unconstrained bicondylar TKA. | PA and SB: activPAL (PAL Technologies) | Pre: 1 weekPost: 12 months | MVPA and the number of steps were significantly increased 12 months follow up. |
| Matsunaga-Myoji 2019 [51] | Prospective control study | n = 66 sex = 83% F; 17% M age = 73.3 ± N/A BMI = N/A | Primary TKA between March 2010 and November 2013. | PA and SB: Lifecorder EX (Suzuken Co.) | Pre: 1 month Post: 6 months | TKA in older patients led to an increase in the amount of PA. |
| Matsunaga-Myoji 2020a [52] | Prospective observational study | n = 153 sex = 84.1% F; 15.9% M age = 61.8 ± 7.9 BMI = 23 ± 3.5 | Primary TKA between March 2010 and November 2013. | PA and SB: Lifecorder EX (Suzuken Co.) | Pre: 1 month Post: 6 months, 24 months | MVPA and the number of steps was significantly increased 1 year after the operation. |
| Matsunaga-Myoji 2020b [53] | Prospective observational study | n = 58 sex = 84.5% F; 15.5% M age = 72.6 ± 6 BMI = 26.1 ± 4.4 | Primary THA between October 2010 and November 2011. | PA and SB: Lifecorder EX (Suzuken Co.) | Pre: 1 month Post: 6 months, 46 months and 60 months | PA after 6 months exhibited pre-operation levels. Only MVPA increased between 2 and 6 months. Patients can expect PA to continue to improve up to 2 years after TKA. |
| Moellenbeck 2020a [54] | Prospective observational study | n = 16 sex = 43.8% F; 56.2% M age = 68.9 ± 6.8 BMI = 26.4 ± 4.3 | Elective THA. | PA and SB: ActiGraph wGTX3-BT Firmware 1.9.2 (ActiGraph LLC) | Pre: NA Post: 8.9 ± 2.3 months | Sedentary behavior did not show any post-operative change, even though short interruptions of sedentary activity were taken into account. |
| Moellenbeck 2020b [55] | Prospective observational study | n = 24 sex = 54% F; 46% M age = 69.4 ± 7.2 BMI = 26.6 ± 3.8 | Conventional TKA or THA. | PA and SB: ActiGraph wGTX3-BT Firmware 1.9.2 (ActiGraph LLC) | Pre: 2–3 weeks Post: 12.4 ± 1.2 months | The habitual activity of patients stayed the same one year after the operation. |
| Oka 2020 [56] | Prospective observational study | n = 82 sex = 82% F; 18% M age = 72.1 ± 5.9 BMI = 26.1 ± 3.7 | Primary TKA with medial parapatellar approach between June 2016 and June 2019. | PA and SB: Active Style Pro HJA-350IT (Omron Healthcare) | Pre: 1 month Post: 3 months and 6 months | Physical activity level was not increased after operation. |
| Rezzadeh 2019 [57] | Prospective observational study | n = 18 sex = 50% F; 50% M age = 66.3 ± 9.4 BMI = 28.7 ± 4.5 | Unilateral TKA. | PA and SB: Accelerometer (not described) | Pre: 185.8 ± 141.6 days Post: 544.2 ± 141.6 days | No significant difference between post-operative and pre-operative patients. |
| Thewlis 2019 [58] | Prospective observational study | n = A: 29; B: 4; C: 18 sex = NA age =A: 63 (24–87); B: 69 (64–77); C: 65 (41–83) BMI = A: 30.8 (21.4–40.7); B: 23.6 (22.8–24.4); C: 28.9 (18.6–40.0); n = 58 | Primary THA between August 2016 and February 2018. | PA and SB: Wrist worn accelerometer (GeneActiv) | Pre: within 4 weeks Post: 2 weeks, 6 weeks, 12 weeks, 26 weeks | Physical activity did not significantly increase after operation. |
| Tobinaga 2019 [59] | Prospective observational study | sex = 84.5% F;15.5% M age = 74.6 ± 6.5 BMI = 26.3 ± 4.2 | Unilateral TKA. | Performance: TUG | Pre: NA Post: 3 months | Performance was significantly increased after 3 months. |
| Twiggs 2018 [60] | Prospective observational study | n = 91 sex = 50.5% F; 49.5% M age = 67.5 ± 13.1 BMI = 30.1 ± 6.3 | TKA over 21 months period between December 2013 and September 2015. | PA and SB: tri-axial accelerometer FitBit Flex | Pre: 2 weeks Post: 1 day, 6 weeks | The number of steps did not increase after 6 weeks post-operation. |
| Vissers 2013 [61] | Prospective observational study | n = 44 sex = 59.1% F; 40.9% M age = 63.8 ± 9.4 BMI = 29.7 ± 5 | Posterolateral approach THA. TKA procedures using computer navigation (Brainlab, Faldkirchen, Germayn) were performed. | PA and SB: Rotterdam Activity Monitor—AM (Vitaport Technology Temec Instruments) | Pre: 2 months Post: 6 months, 48 months | Performance was significantly increased after the operation. |
| Time after the Operation | Variable | SMD (95% CI) * | Studies (Participants) | Effect Size | p | I2 | Raw Difference (If Applicable) |
|---|---|---|---|---|---|---|---|
| Pre-operation | Number of steps | −1.02 | 4 (344) | Very large | <0.001 | 62% | −2892.2 steps/day |
| 12 months post-operation | MVPA | −0.97 (−2.39, 0.46) | 3 (641) | Very large | 0.180 | 97% | / |
| Number of steps | −0.75 (−1.89, 0.38) | 3 (372) | Large | 0.190 | 94% | −2671.2 steps/day |
| Variable | SMD (95% CI) * | Studies (Participants) | Effect Size | p-Value | I2 | Raw Difference (If Applicable) |
|---|---|---|---|---|---|---|
| <3 months post-operation | ||||||
| Number of steps | −0.06 (−0.36, 0.23) | 7 (792) | Small | 0.670 | 77% | −196.7 steps/day |
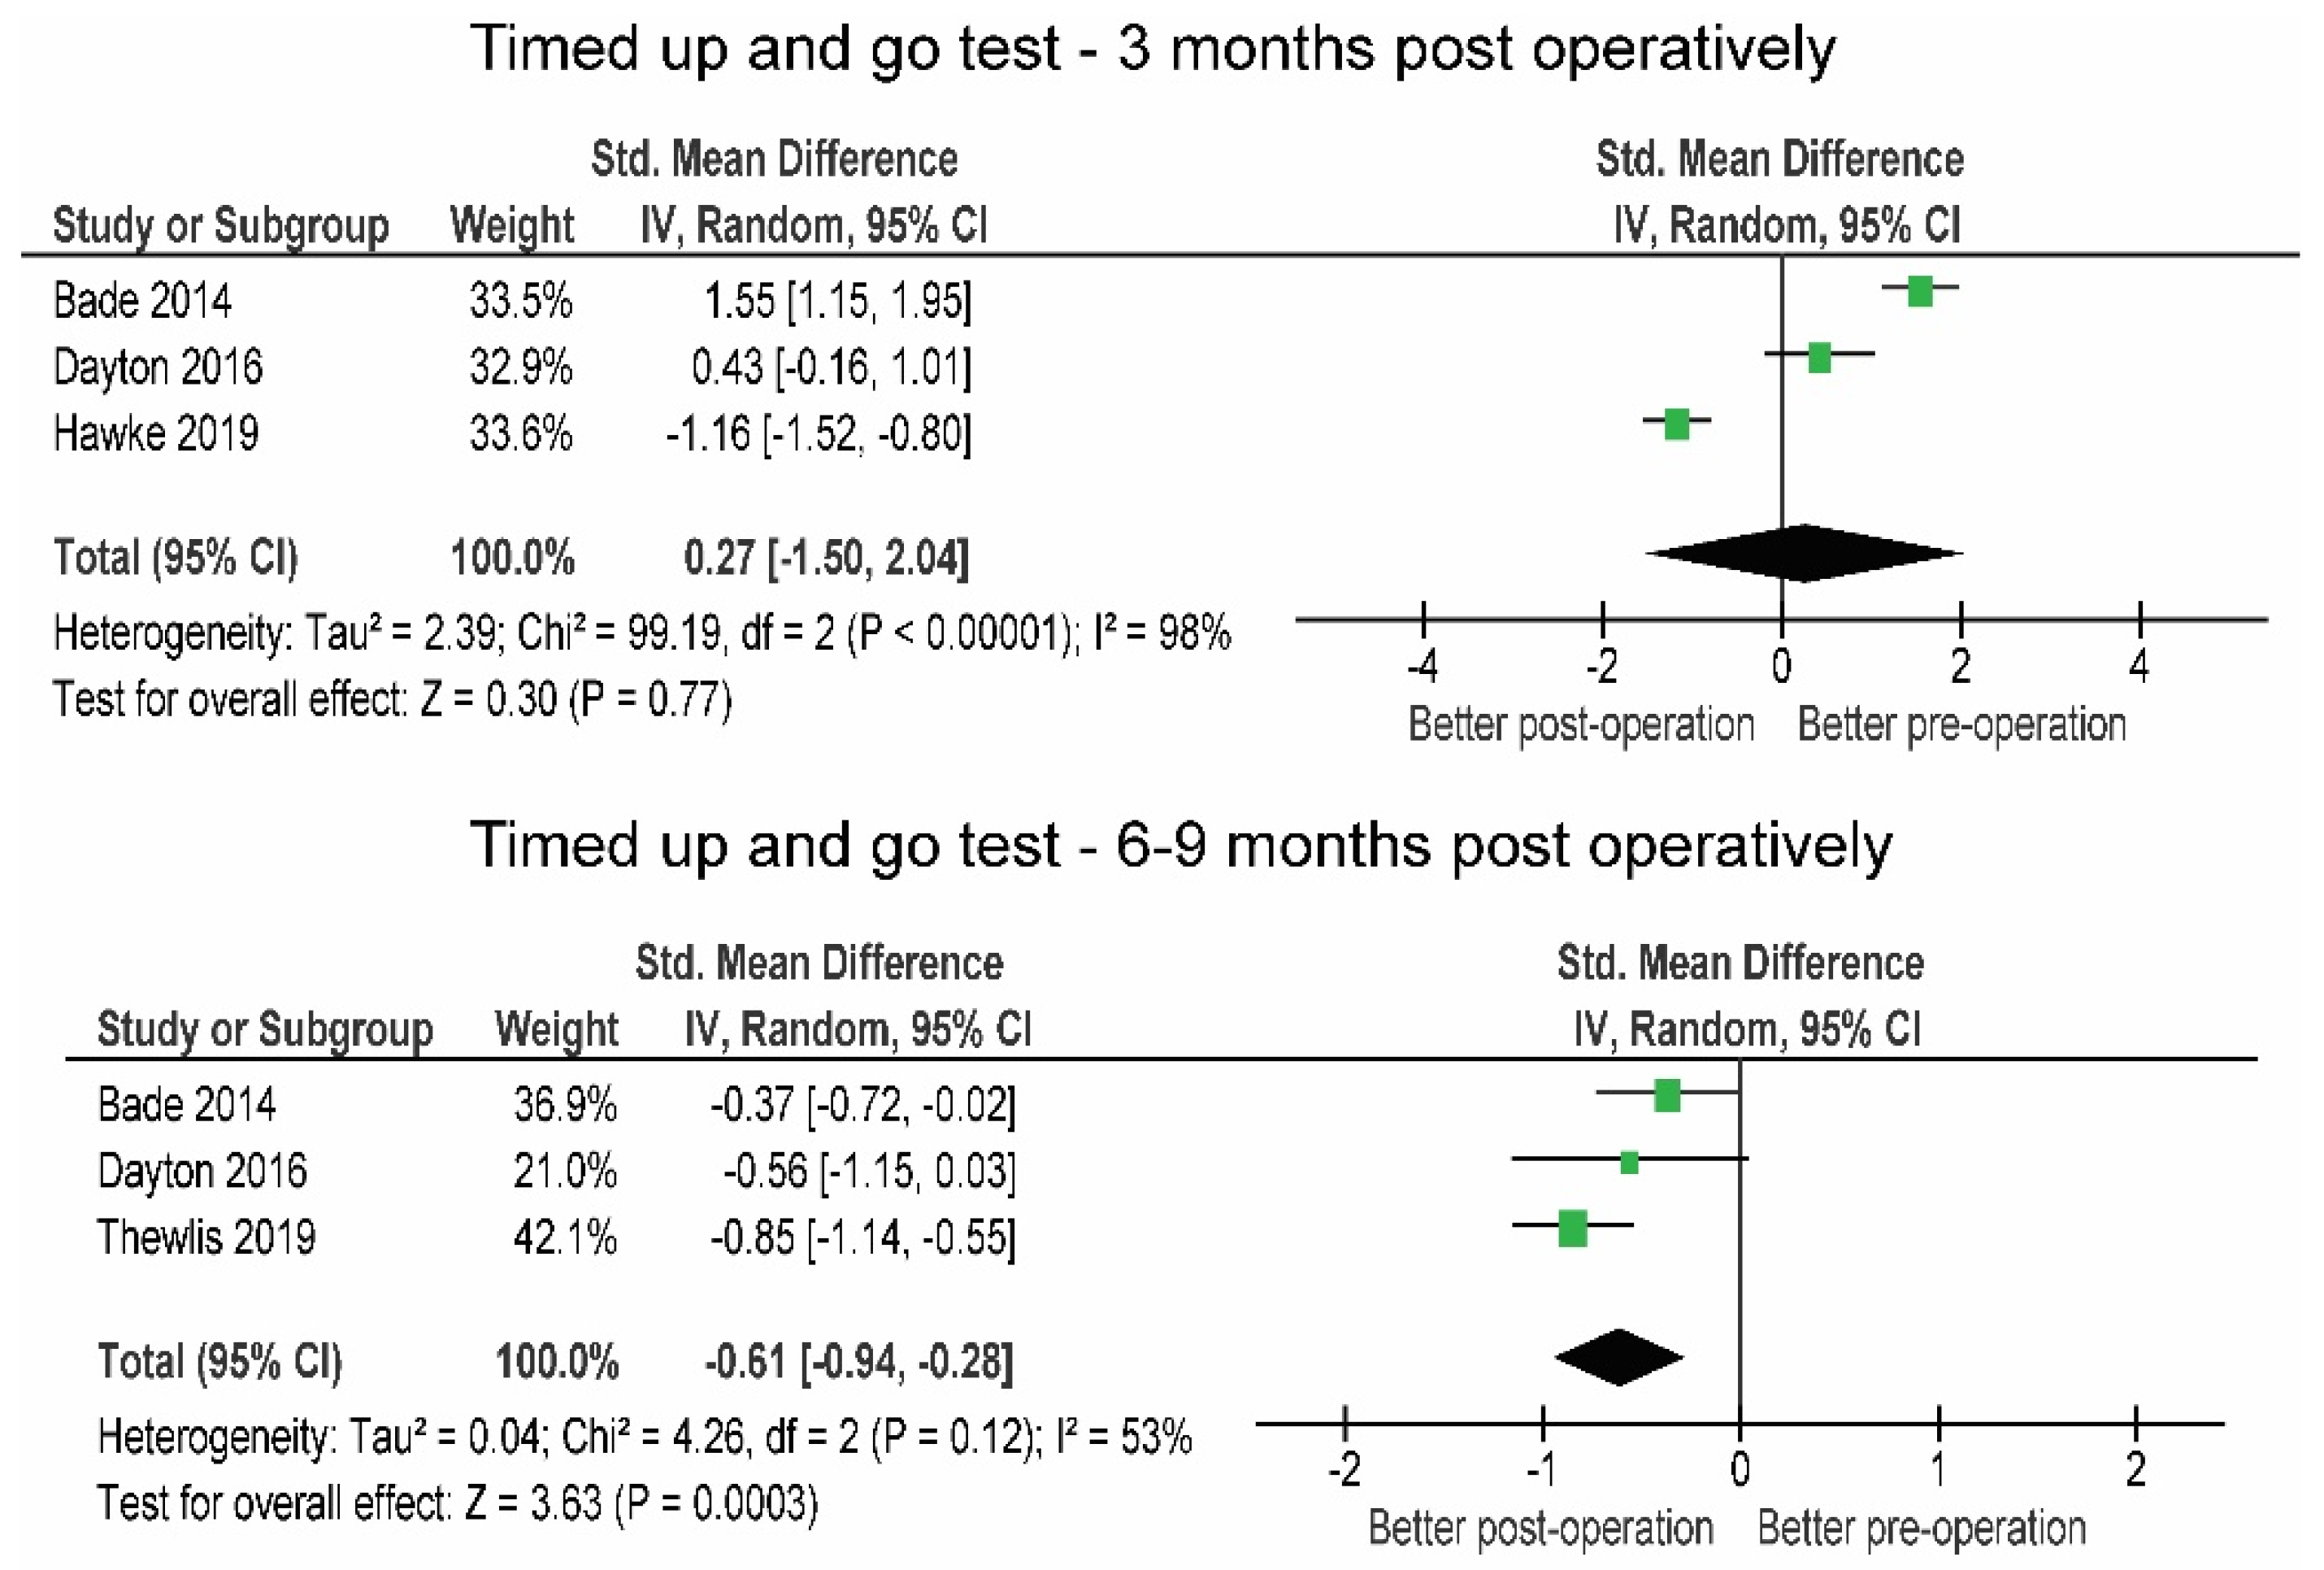
| Timed up and go test | 0.27 (−1.50, 2.04) | 3 (314) | Small | 0.770 | 98% | +1.58 s |
| 6 Minute Walk Test | 0.64 (−0.23, 1.51) | 4 (478) | Moderate | 0.150 | 91% | +59.9 m |
| 3–6 months post-operation | ||||||
| Moderate to vigorous physical activity | 0.12 (−0.25, 0.48) | 3 (301) | Small | 0.530 | 55% | / |
| Number of steps | 0.15 (−0.12, 0.42) | 4 (327) | Small | 0.390 | 25% | +373.8 steps/day |
| 6 Minute Walk Test | 0.65 (0.48, 0.82) | 5 (605) | Large | <0.01 | 93% | +90.2 m |
| 6–9 months post-operation | ||||||
| Moderate to vigorous physical activity | 0.33 (0.20, 0.46) | 9 (923) | Moderate | <0.001 | 42% | / |
| Light-intensity physical activity | 0.14 (0.06, 0.35) | 8 (889) | Small | 0.160 | 49% | / |
| Sedentary behavior | −0.00 (−0.18, 0.19) | 5 (473) | Small | 0.790 | 53% | −3.72 min/day |
| Number of steps | 0.47 (0.18, 0.76) | 12 (1418) | Moderate | <0.001 | 83% | +1064.1 steps/day |
| Timed-up and go test | −0.61 (−0.94, −0.28) | 3 (364) | Large | <0.001 | 53% | −1.91 s |
| 6 Minute Walk Test | 0.62 (0.26, 0.98) | 5 (493) | Large | <0.001 | 73% | +71.84 m |
| >12 months post-operation | ||||||
| Moderate to vigorous physical activity | 0.70 (0.53, 0.87) | 3 (573) | Large | <0.001 | 0% | |
| Number of steps | 0.52 (0.36, 0.69) | 7 (707) | Moderate | <0.001 | 13% | +1425.3 steps/say |
Publisher’s Note: MDPI stays neutral with regard to jurisdictional claims in published maps and institutional affiliations. |
© 2021 by the authors. Licensee MDPI, Basel, Switzerland. This article is an open access article distributed under the terms and conditions of the Creative Commons Attribution (CC BY) license (https://creativecommons.org/licenses/by/4.0/).
Share and Cite
Sašek, M.; Kozinc, Ž.; Löfler, S.; Hofer, C.; Šarabon, N. Objectively Measured Physical Activity, Sedentary Behavior and Functional Performance before and after Lower Limb Joint Arthroplasty: A Systematic Review with Meta-Analysis. J. Clin. Med. 2021, 10, 5885. https://doi.org/10.3390/jcm10245885
Sašek M, Kozinc Ž, Löfler S, Hofer C, Šarabon N. Objectively Measured Physical Activity, Sedentary Behavior and Functional Performance before and after Lower Limb Joint Arthroplasty: A Systematic Review with Meta-Analysis. Journal of Clinical Medicine. 2021; 10(24):5885. https://doi.org/10.3390/jcm10245885
Chicago/Turabian StyleSašek, Matic, Žiga Kozinc, Stefan Löfler, Christian Hofer, and Nejc Šarabon. 2021. "Objectively Measured Physical Activity, Sedentary Behavior and Functional Performance before and after Lower Limb Joint Arthroplasty: A Systematic Review with Meta-Analysis" Journal of Clinical Medicine 10, no. 24: 5885. https://doi.org/10.3390/jcm10245885
APA StyleSašek, M., Kozinc, Ž., Löfler, S., Hofer, C., & Šarabon, N. (2021). Objectively Measured Physical Activity, Sedentary Behavior and Functional Performance before and after Lower Limb Joint Arthroplasty: A Systematic Review with Meta-Analysis. Journal of Clinical Medicine, 10(24), 5885. https://doi.org/10.3390/jcm10245885