Article

The Interaction Between the asb5a and asb5b Subtypes Jointly Regulates the L-R Asymmetrical Development of the Heart in Zebrafish

by
Wanbang Zhou
1,2,†,
Wanwan Cai
1,2,†,
Yongqing Li
1,
Luoqing Gao
1,
Xin Liu
1,
Siyuan Liu
1,
Junrong Lei
2,
Jisheng Zhang
2,
Yuequn Wang
1,
Zhigang Jiang
1,
Xiushan Wu
1,
Xiongwei Fan
1,
Fang Li
1,
Lan Zheng
2,* and
Wuzhou Yuan
1,*
1
The Laboratory of Heart Development Research, College of Life Science, Hunan Normal University, Changsha 410081, China
2
Laboratory of Physical Fitness and Exercise Rehabilitation of Hunan Province, College of Physical Education, Hunan Normal University, Changsha 410012, China
*
Authors to whom correspondence should be addressed.
These authors contributed equally to this work.
Int. J. Mol. Sci. 2025, 26(6), 2765; https://doi.org/10.3390/ijms26062765
Submission received: 28 February 2025 / Revised: 17 March 2025 / Accepted: 17 March 2025 / Published: 19 March 2025
(This article belongs to the Section Molecular Biology)

Abstract

:
The asb5 gene, a member of the Asb protein subfamily characterized by six ankyrin repeat domains, is highly conserved and comprises two subtypes, asb5a and asb5b, in zebrafish. Our previous research has demonstrated that a deficiency of the asb5 gene significantly impairs early cardiac contractile function, highlighting its close relationship with heart development. Zebrafish asb5 expression was disrupted by both morpholino (MO) antisense oligomer-mediated knockdown and a CRISPR-Cas9 system. A high-throughput RNA-Seq analysis was used to analyze the possible molecular regulatory mechanism of asb5 gene deletion leading to left–right (L-R) asymmetry defects in the heart. Whole-mount in situ hybridization (WISH) was conducted to evaluate gene expression patterns of Nodal signaling components and the positions of heart organs. Heart looping was defective in zebrafish asb5 morphants. Rescue experiments in the asb5-deficiency group (inactivating both asb5a and asb5b) demonstrated that the injection of either asb5a-mRNA or asb5b-mRNA alone was insufficient to rectify the abnormal L-R asymmetry of the heart. In contrast, the simultaneous injection of both asb5a-mRNA and asb5b-mRNA successfully rescued the morphological phenotype. A high-throughput RNA-Seq analysis of embryos at 48 h post fertilization (hpf) revealed that numerous genes associated with L-R asymmetry exhibited expression imbalances in the asb5-deficiency group. WISH further confirmed that the expression of genes such as fli1a, acta1b, hand2, has2, prrx1a, notch1b, and foxa3 were upregulated, while the expression of mei2a and tal1 was downregulated. These results indicated that loss of the asb5 gene in zebrafish led to the disordered development of L-R asymmetry in the heart, resulting in an imbalance in the expression of genes associated with the regulation of L-R asymmetry. Subsequently, we examined the expression patterns of classical Nodal signaling pathway-related genes using WISH. The results showed that the midline barrier factor gene lefty1 was downregulated at early stages in the asb5-deficiency group, and the expression of spaw and lefty2, which are specific to the left lateral plate mesoderm (LPM), was disrupted. This study reveals that the two subtypes of the asb5 gene in zebrafish, asb5a and asb5b, interact and jointly regulate the establishment of early cardiac L-R asymmetry through the Nodal-spaw-lefty signaling pathway.

1. Introduction

Nearly all thoracic and abdominal organs of vertebrates exhibit L-R asymmetry in their anatomy, placement, and, in some cases, physiology. This pronounced L-R asymmetry of visceral organs is recognized as being dependent on left- and right-side-specific gene expression cascades during early embryogenesis [1]. The proper establishment of the L-R axis is crucial for organogenesis in vertebrates [2]. Although the asymmetric patterns of gene expression vary among species, a conserved feature across all examined animal species is the production of the secreted TGFβ-like factor, Nodal (or a Nodal homolog), in the left lateral plate mesoderm [3]. Nodal, a ligand within the TGFβ protein family, serves as a primary regulator of L-R axis establishment. Following its role in mesoderm patterning, nodal is expressed in the embryonic node and the left lateral plate mesoderm in species such as mouse, zebrafish, chick and Xenopus [4,5,6]. In zebrafish, the first identified Nodal homolog gene is southpaw (spaw), which encodes a novel member of the nodal-related class of proteins, a subfamily within the transforming growth factor β superfamily of secreted factors [7]. Spaw is expressed in the left LPM to activate the Nodal pathway within the left side of the heart [8]. The downstream targets of spaw include pitx2, lefty1 and lefty2 [9]. Lefty1 is expressed at the midline in zebrafish and functions as a `molecular midline barrier’, preventing the propagation of Nodal from the left to the right LPM [10]. The absence of lefty1 results in bilateral expression of nodal, lefty2, and pitx2 in mice [11]. At early somite stages, nodal and lefty2 are co-expressed in the left lateral plate mesoderm [12]. The regulation of Nodal signaling also involves negative feedback, whereby Nodal ligands induce the synthesis of their own antagonists, the Lefty1 and Lefty2 proteins [7,12]. In vertebrate embryos, the typical lateralization of the heart loop is known as rightward or dextro-looping (D-loop). Conversely, the abnormal lateralization process that results in a mirror-image configuration is termed the leftward or levo-looping (L-loop). Additionally, the linearization of the heart is described as no-looping (N-loop). Numerous studies have demonstrated that the laterality of the heart loop, as well as that of other developing organs, is regulated by the molecular L-R signaling cascades previously mentioned [13,14,15].
The Asb family members exhibit a relatively divergent N-terminal domain, followed by a variable number of ankyrin repeats and a C-terminal SOCS box [16]. Of particular interest is the subfamily of six-ankyrin repeat domain-containing Asb proteins, which includes Asb5, Asb9, Asb11, and Asb13. These proteins exhibit remarkable evolutionary conservation and play a role in mediating compartment size expansion, such as regulating the sizes of the brain and muscle compartments [17]. Currently, the biological functions of Asb5 remain poorly understood. However, it has been reported that Asb5 is a novel protein implicated in the initiation of arteriogenesis [18]. In zebrafish, asb5 is categorized into two subtypes: asb5a and asb5b. The asb5a is located on chromosome 14 and comprises 6 exons and 5 introns, with a full-length cDNA of 915 bp that encodes 232 amino acids. The Asb5a protein features three evolutionarily conserved ANK functional domains and one SOCS-box domain. In contrast, asb5b is situated on chromosome 1 and comprises 7 exons and 6 introns, with a full-length cDNA of 1545 bp that encodes 328 amino acids. The Asb5b protein contains six evolutionarily conserved ANK functional domains and one SOCS-box domain.
Our previous work revealed that the early expression patterns of the two subtypes, asb5a and asb5b, are similar. Both are broadly expressed starting from the high cap stage of embryonic development [19], suggesting that they may play regulatory roles in early embryonic development. After completely knocking out the asb5a gene in zebrafish using CRISPR/Cas9 technology [20,21], the homozygous embryos did not show any abnormalities. Using morpholino interference technology [22,23] to further knock down the expression of asb5b in asb5a-/- zebrafish resulted in abnormal cardiac contraction function.
In this study, we found that at the 48 hpf embryo stage, inactivating both asb5a and asb5b (the asb5-deficiency group) resulted in an abnormal phenotype characterized by cardiac L-R asymmetry compared to other groups. The heart exhibited variations in looping, which were categorized as normal right looping, non-looping, and reversed left looping. We confirmed that the two subtypes of asb5, asb5a, and asb5b, interact genetically and jointly regulate the establishment of early cardiac L-R asymmetry patterns via the Nodal-spaw-lefty signaling pathway.

2. Results

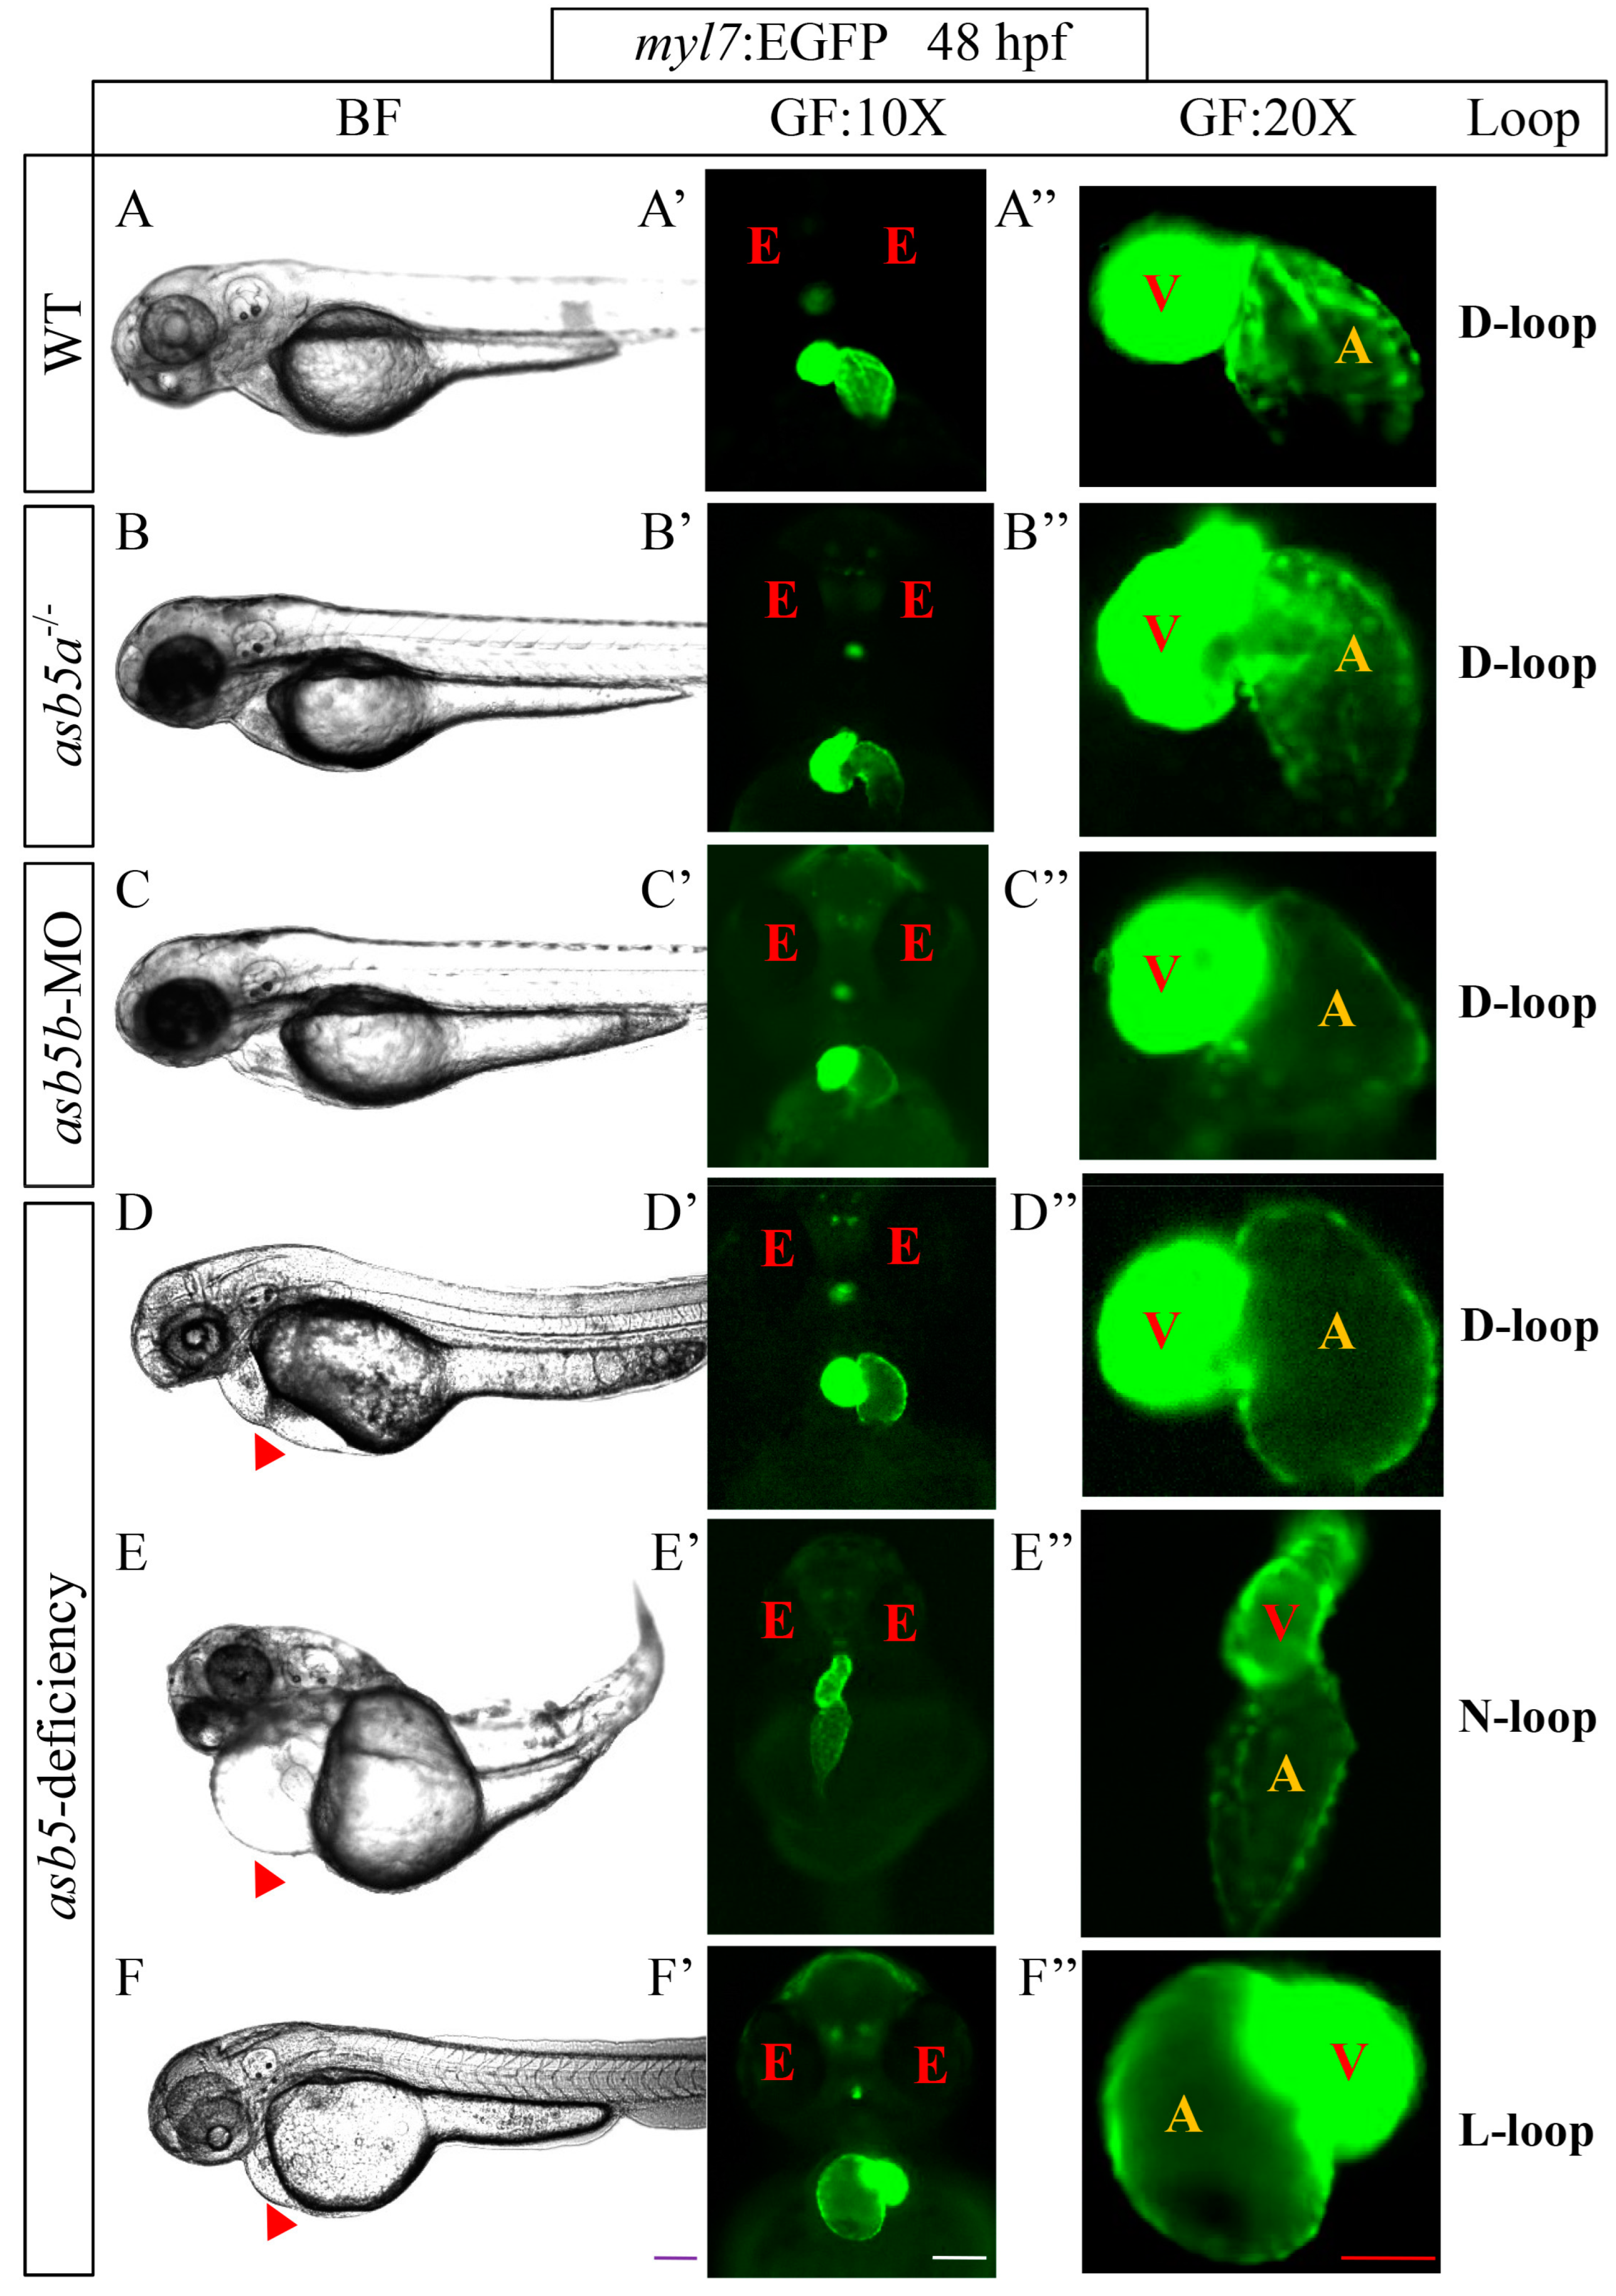
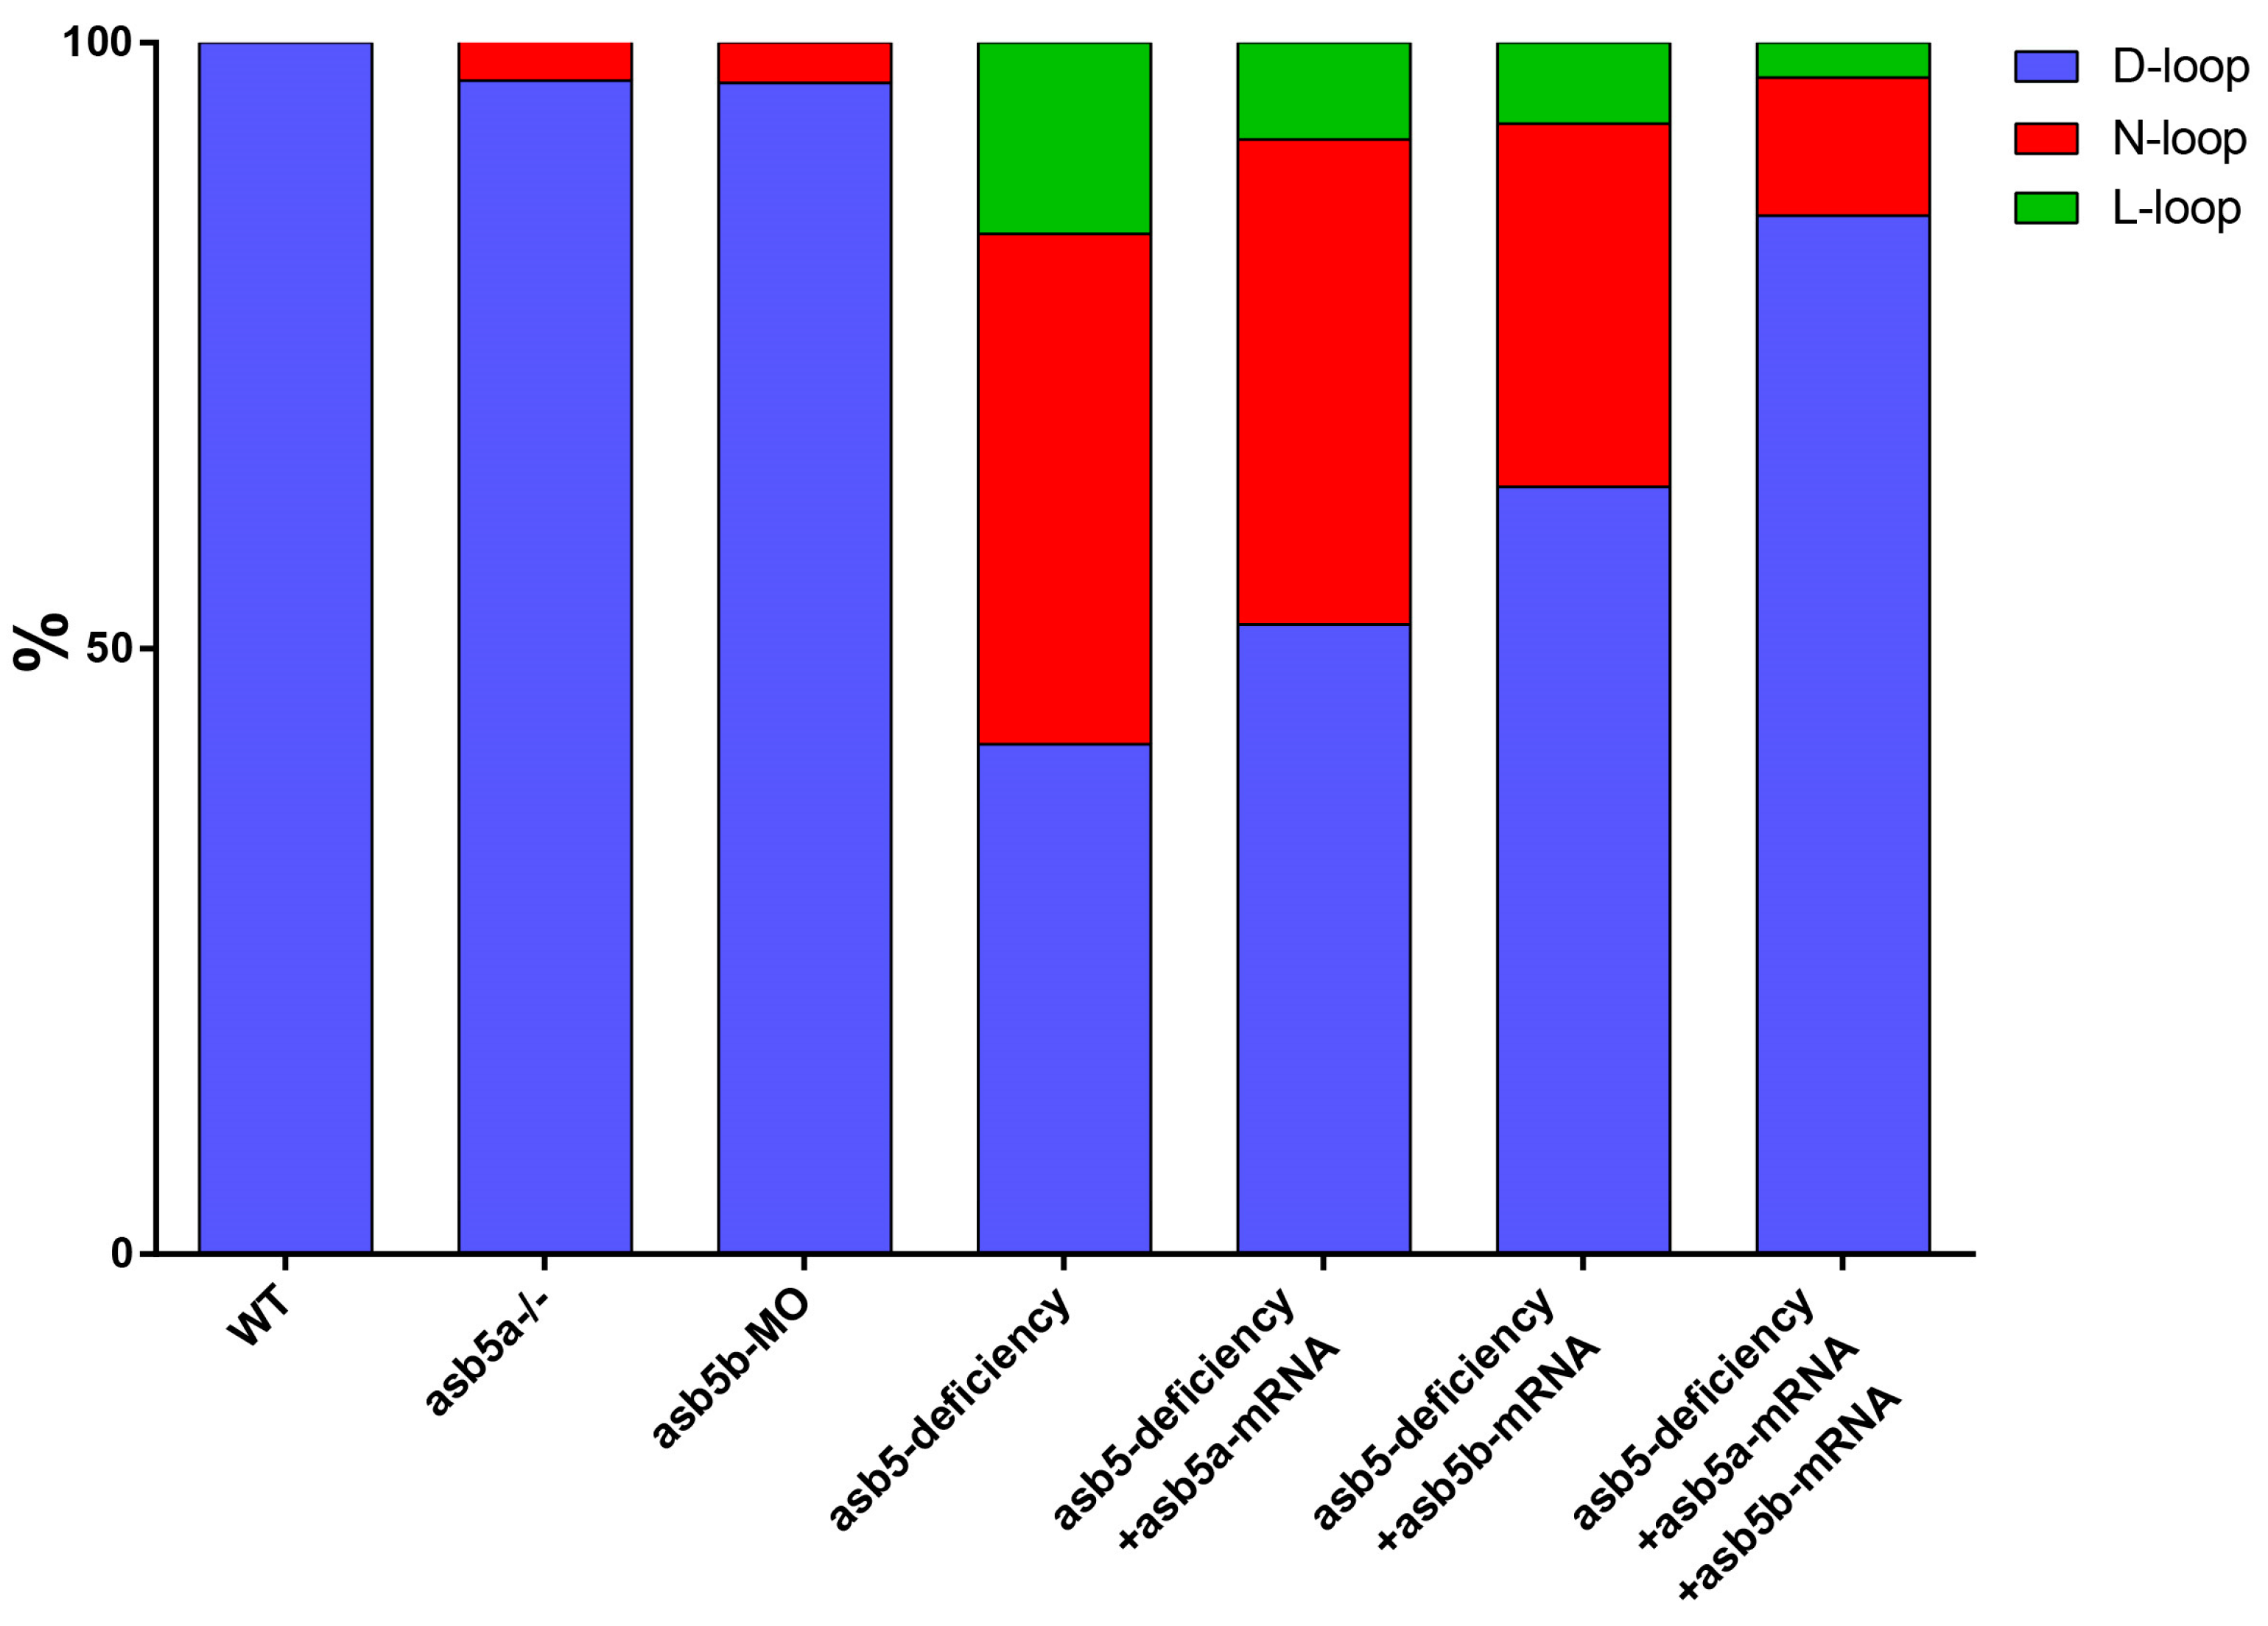
2.1. Loss of asb5 Disrupts Heart L-R Asymmetry Development in Zebrafish Embryos

As mentioned in our previous article [19], we successfully generated asb5a-/- knockout homozygous line, asb5b-MO knockdown line, and asb5-deficiency line (simultaneous knockdown of asb5b in asb5a-/- homozygous embryos line) in zebrafish using CRISPR/Cas9 knockout technology and morpholino interference technology (Figures S4 and S5). By combining with the myl7:EGFP transgenic zebrafish line, which specifically expresses green fluorescent protein in cardiac tissue [24], we observed that the embryos in the asb5-deficiency group at the 48 hpf stage exhibited pericardial edema (indicated by the red triangular arrow in Figure 1) and abnormal cardiac looping. Three distinct patterns of cardiac looping were identified: D-loop, N-loop, and L-loop (Figure 1). Subsequently, we employed a high-speed EM-CCD camera to capture a 10 s video at 130 frames per second and analyzed the recorded footage using the Semi-automatic Heartbeat Analysis software program (Version 3.4.0.0) [25]. By extracting individual frames from the video (each measuring 1300 × 600 pixels), we further confirmed that the asb5-deficiency group exhibited abnormal looping phenotypes (Figure 2). These findings suggest that the concurrent loss of asb5a and asb5b subtypes in zebrafish disrupts the normal pattern of L-R asymmetry during early heart development.

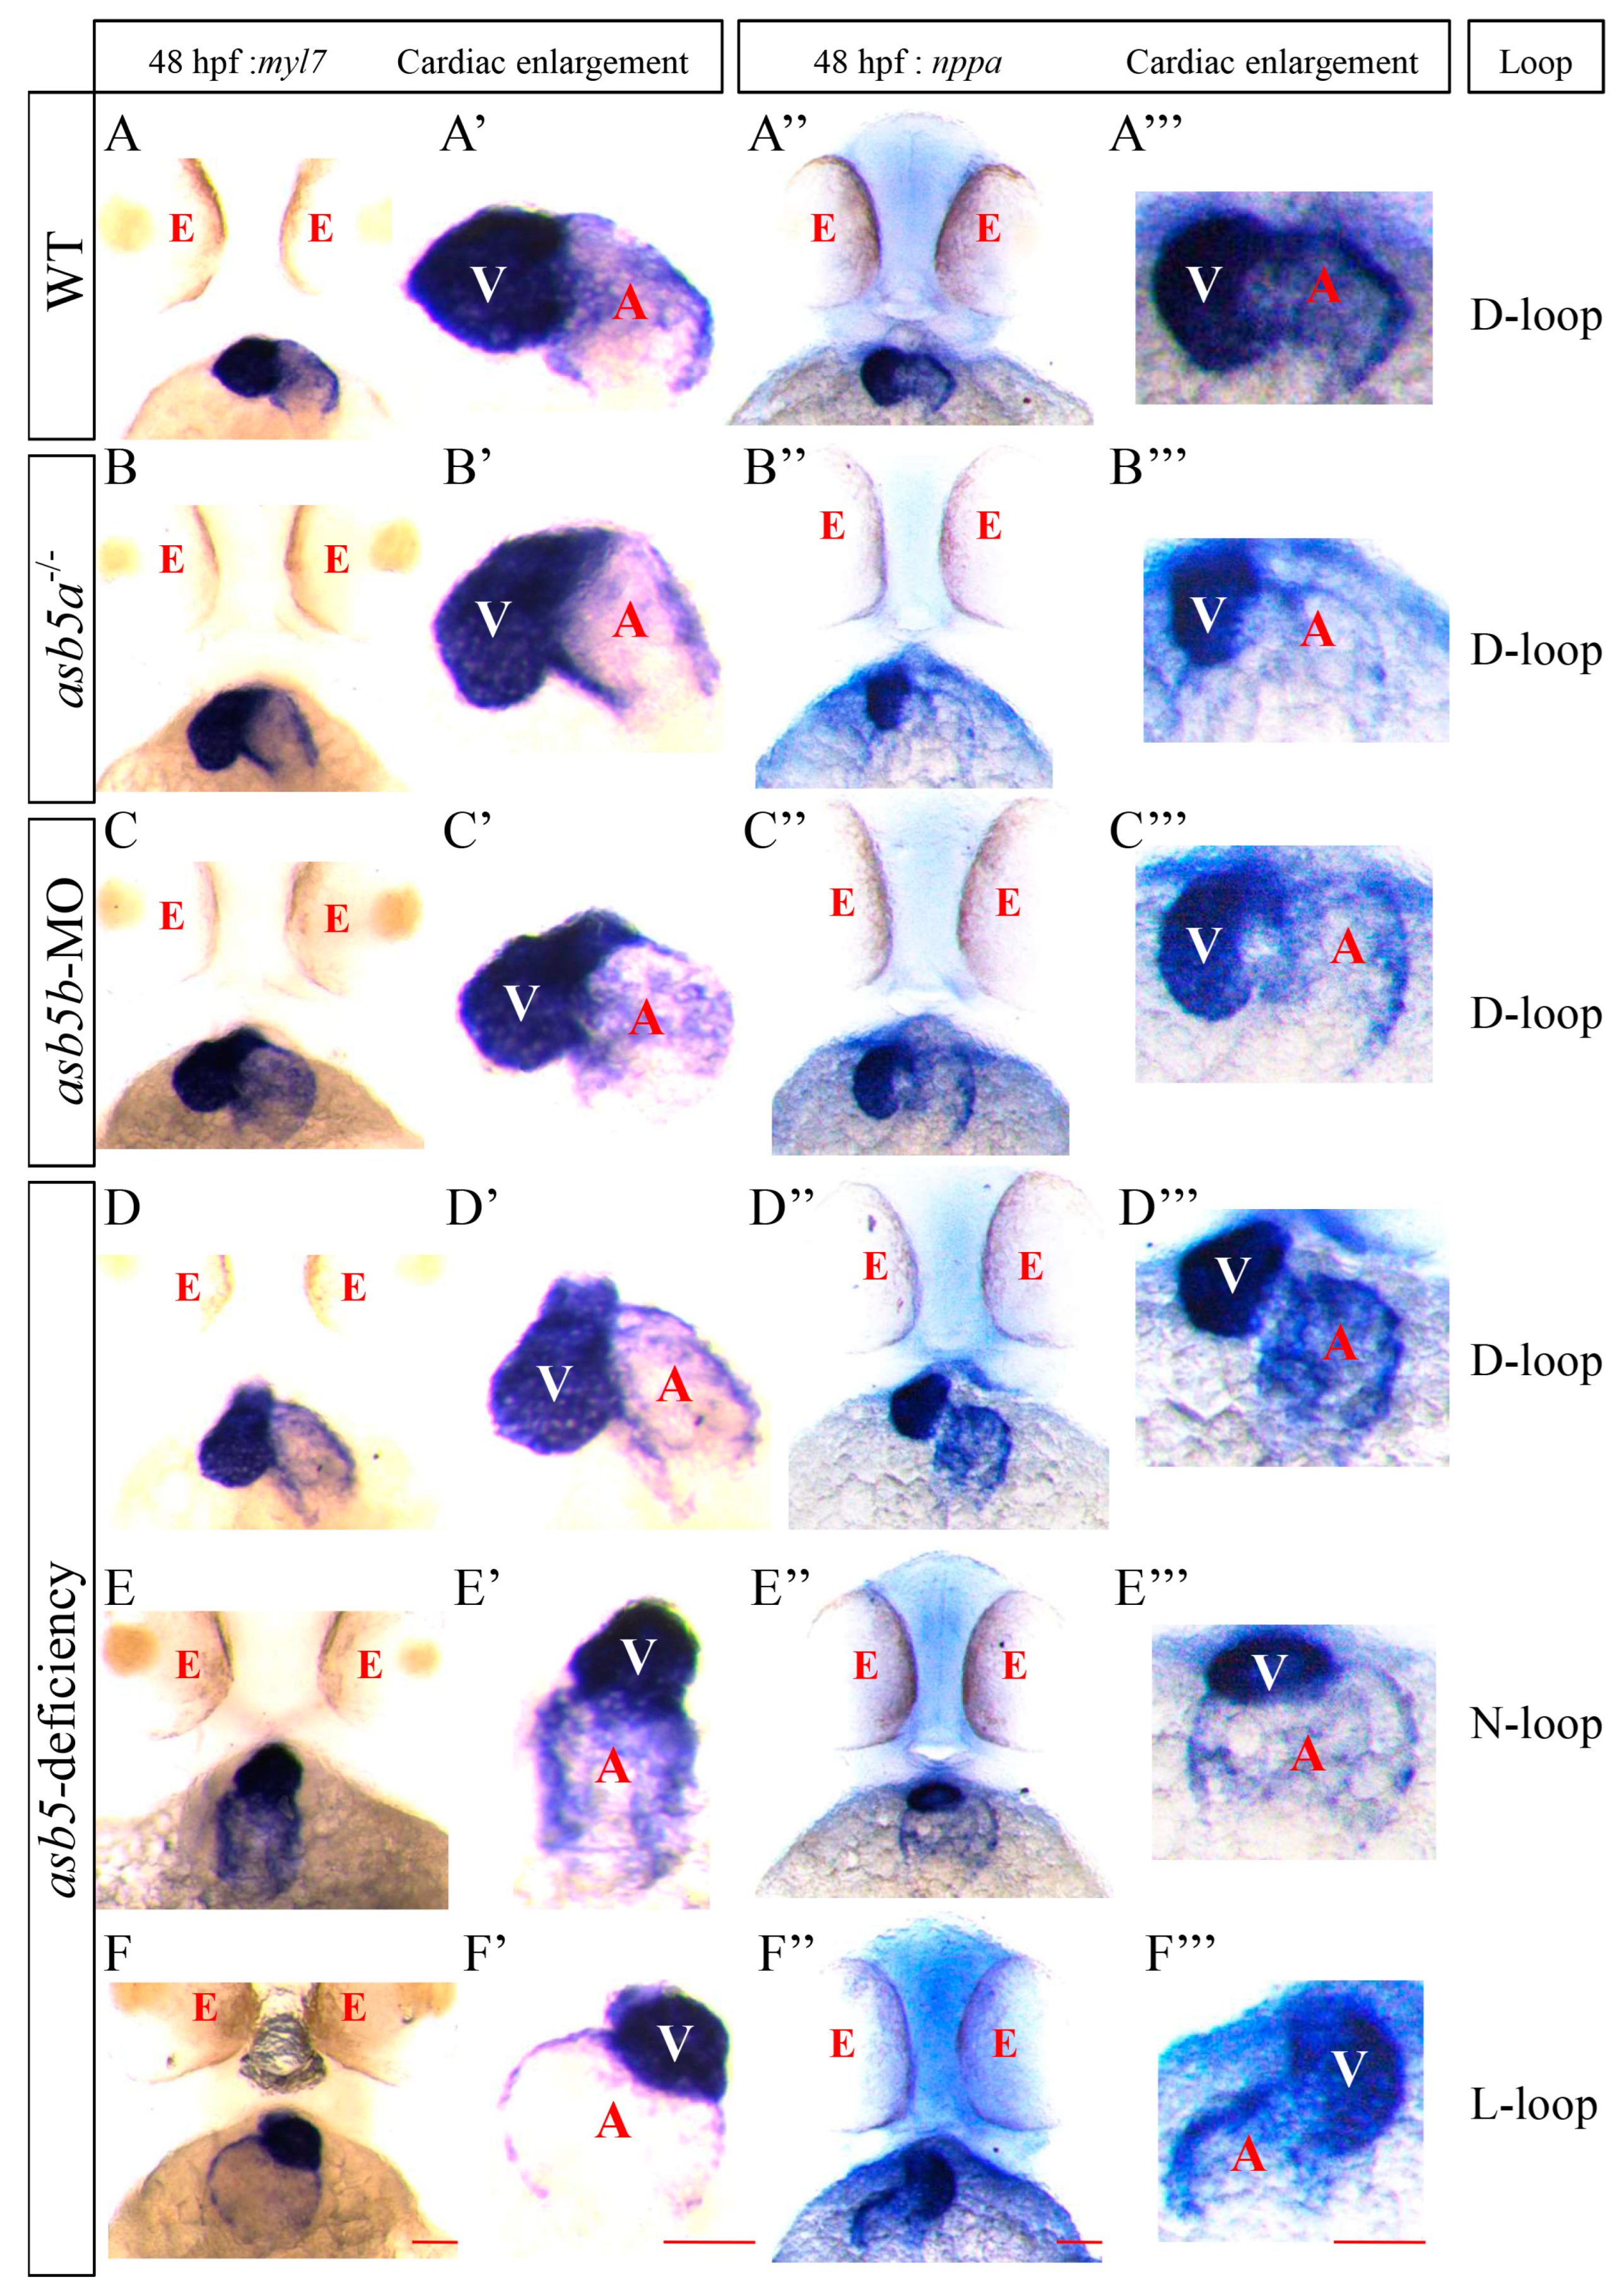
2.2. WISH Results Indicating Loss of asb5 Leads to Abnormal Cardiac Looping

To ascertain that the L-R asymmetry defects observed in the asb5-deficient group are not merely coincidental or induced by environmental factors, we employed WISH to analyze the expression of heart-specific genes myl7 (myosin, light chain 7) [26] and nppa (natriuretic peptide A) [27] in zebrafish embryos at 48 hpf. Our findings revealed that, at 48 hpf, the asb5-deficiency group exhibited three distinct patterns of cardiac looping: normal D-loop, non-looping N-loop, and reverse L-loop (Figure 3). This finding suggests that the disruption of cardiac asymmetry patterns observed in asb5-deficient zebrafish at 48 hpf is not a chance occurrence, further highlighting the crucial role of the asb5 gene in establishing early cardiac asymmetry patterns.

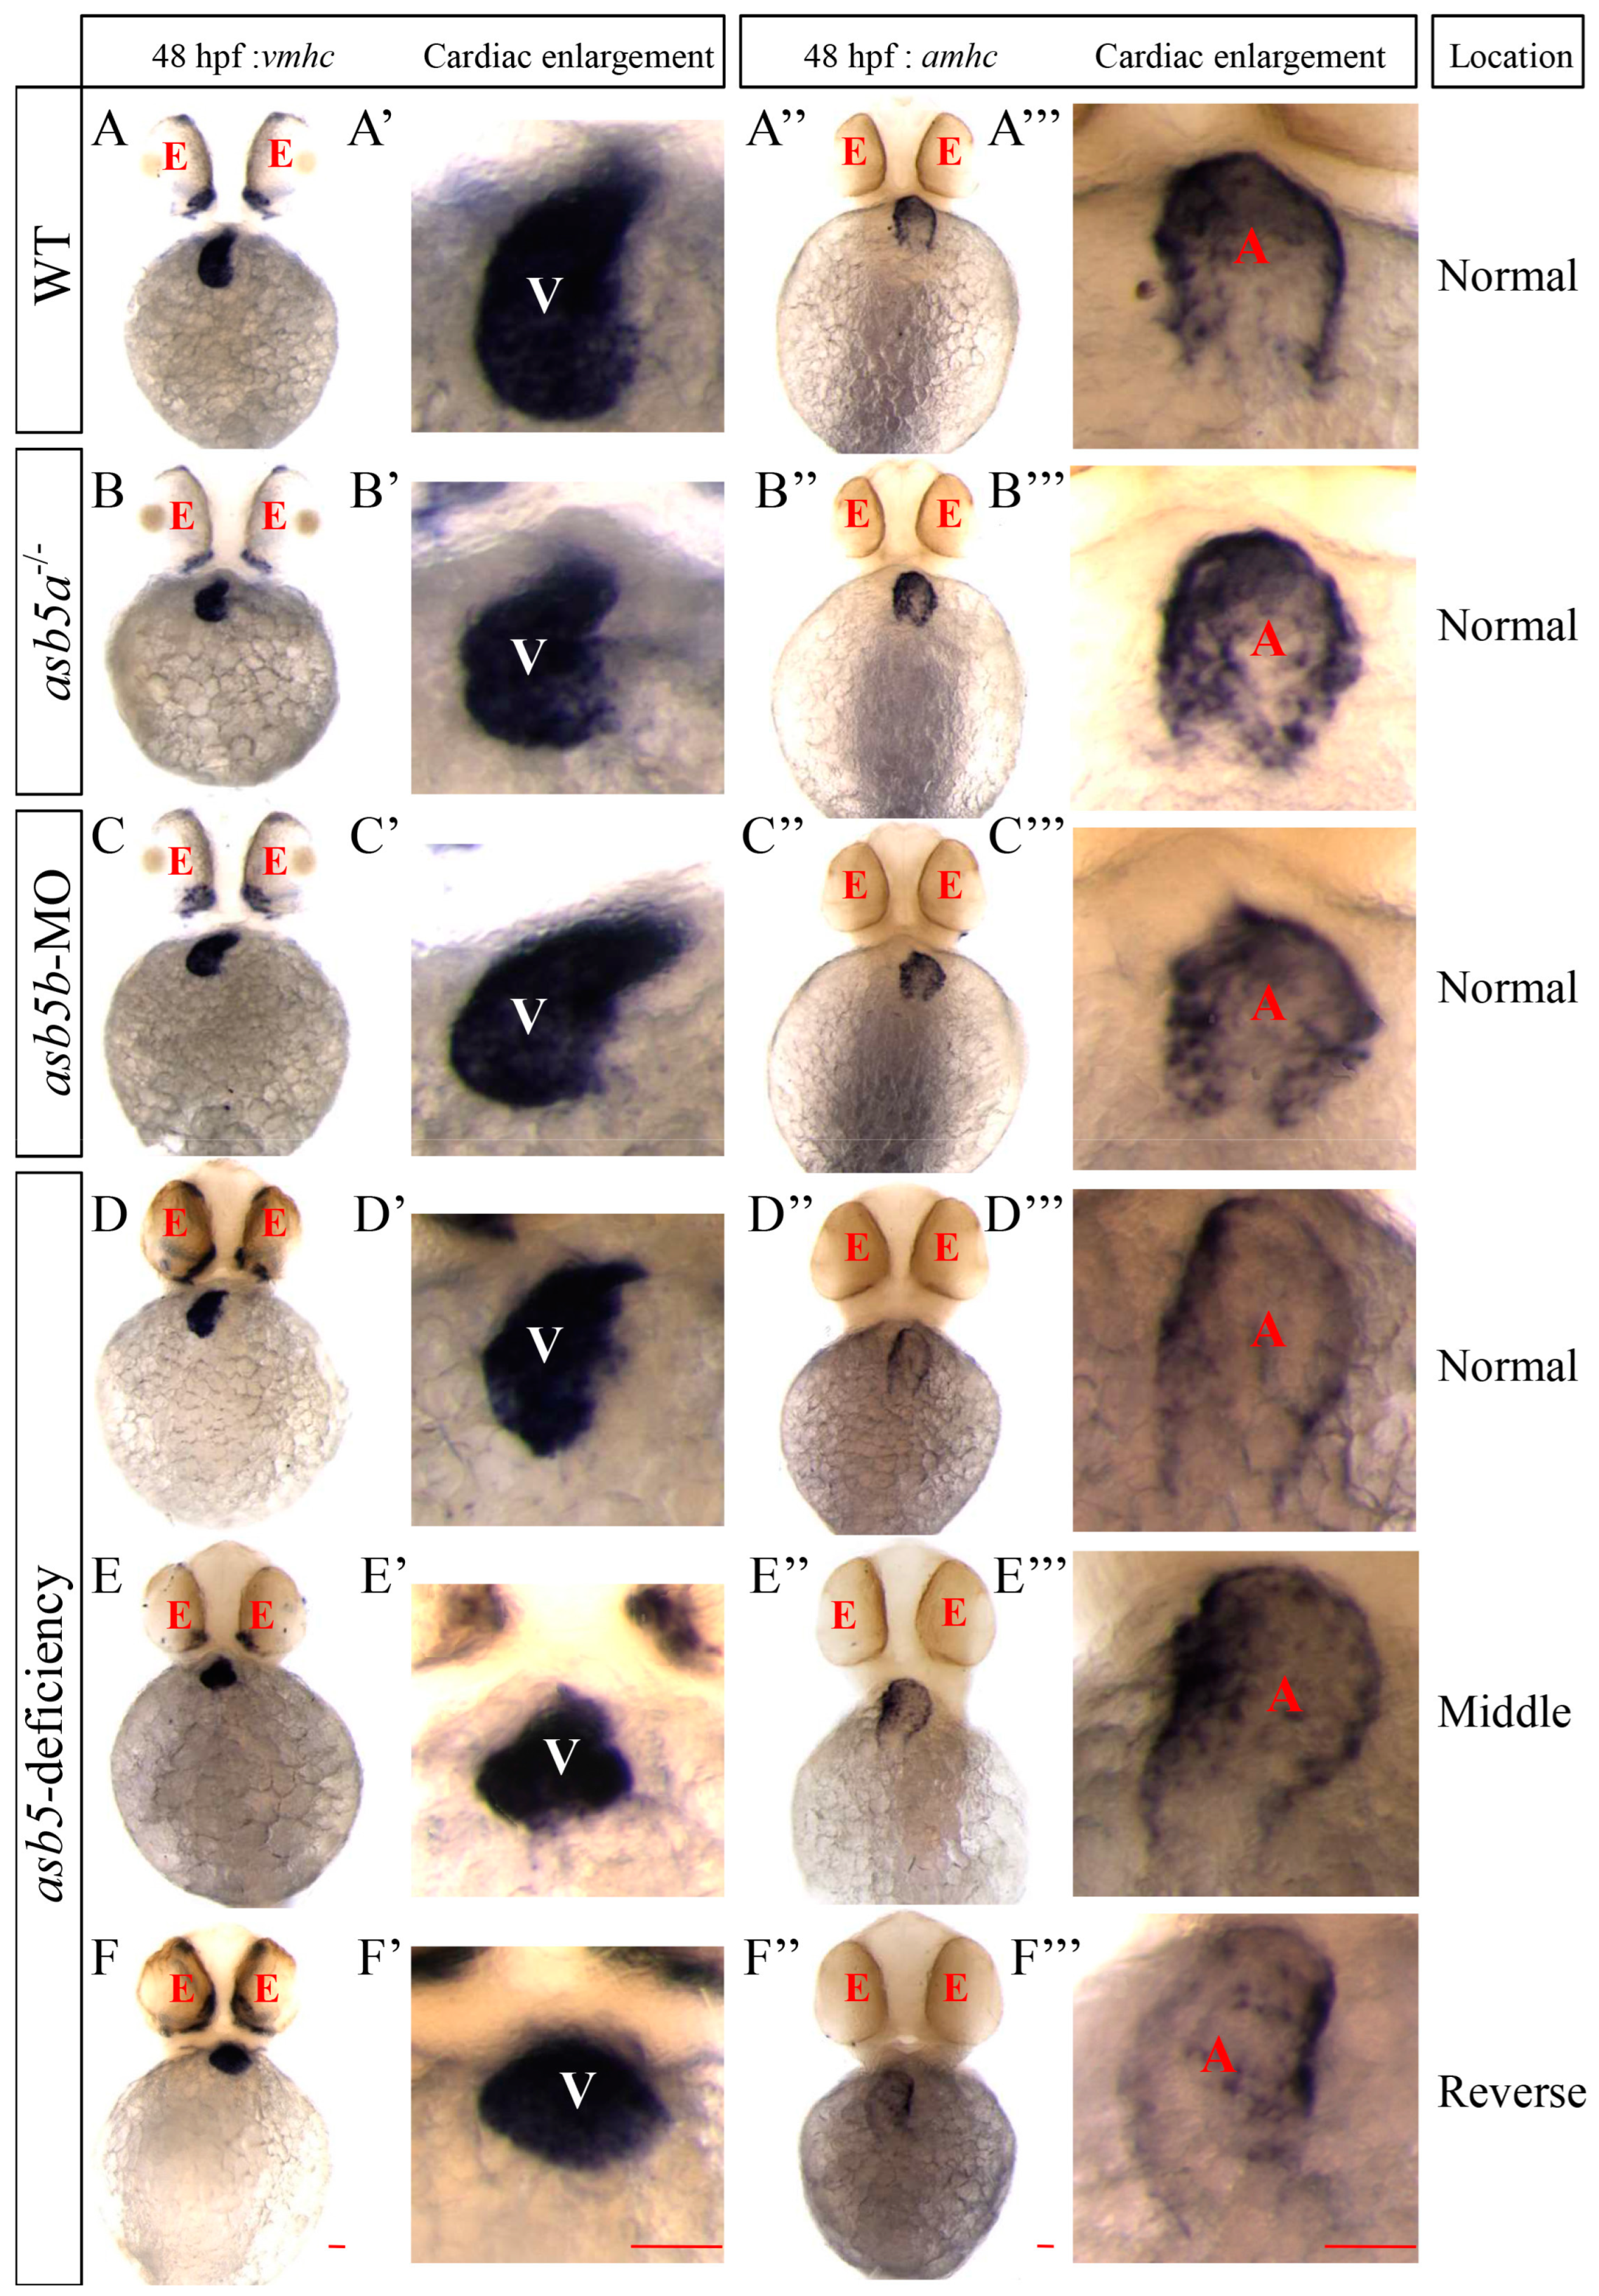
2.3. The Atria and Ventricles in the asb5-Deficiency Group Are Normally Differentiated

To determine whether the observed cardiac asymmetry defect in the asb5-deficiency group was due to defects in the differentiation of ventricular or atrial tissue, WISH was performed on 48 hpf, embryos using vmhc (ventricle-specific marker gene) [28,29] and amhc (atrium-specific marker gene) [30,31] probes. The results indicated that vmhc was expressed on the left side of the midline in wild-type, asb5a-/-, and asb5b-MO embryos (viewed with the belly up position), while expression in the asb5-deficiency group was random, exhibiting three distinct patterns: Normal arrangement, Middle alignment, and Reverse arrangement (Figure 4A–F,A′–F′). Similarly, amhc was expressed on the right side of the midline in wild-type, asb5a-/-, and asb5b-MO embryos (also viewed belly up) with random expression observed in the asb5-deficiency group, which displayed the same three patterns: Normal arrangement, Middle alignment, and Reverse arrangement (Figure 4A″–F″,A′′′–F′′′). These findings suggest that the L-R asymmetry defect phenotype of the heart following the loss of asb5 is not attributable to abnormal differentiation of the ventricular and atrial tissues, but rather to their abnormal positional arrangement.

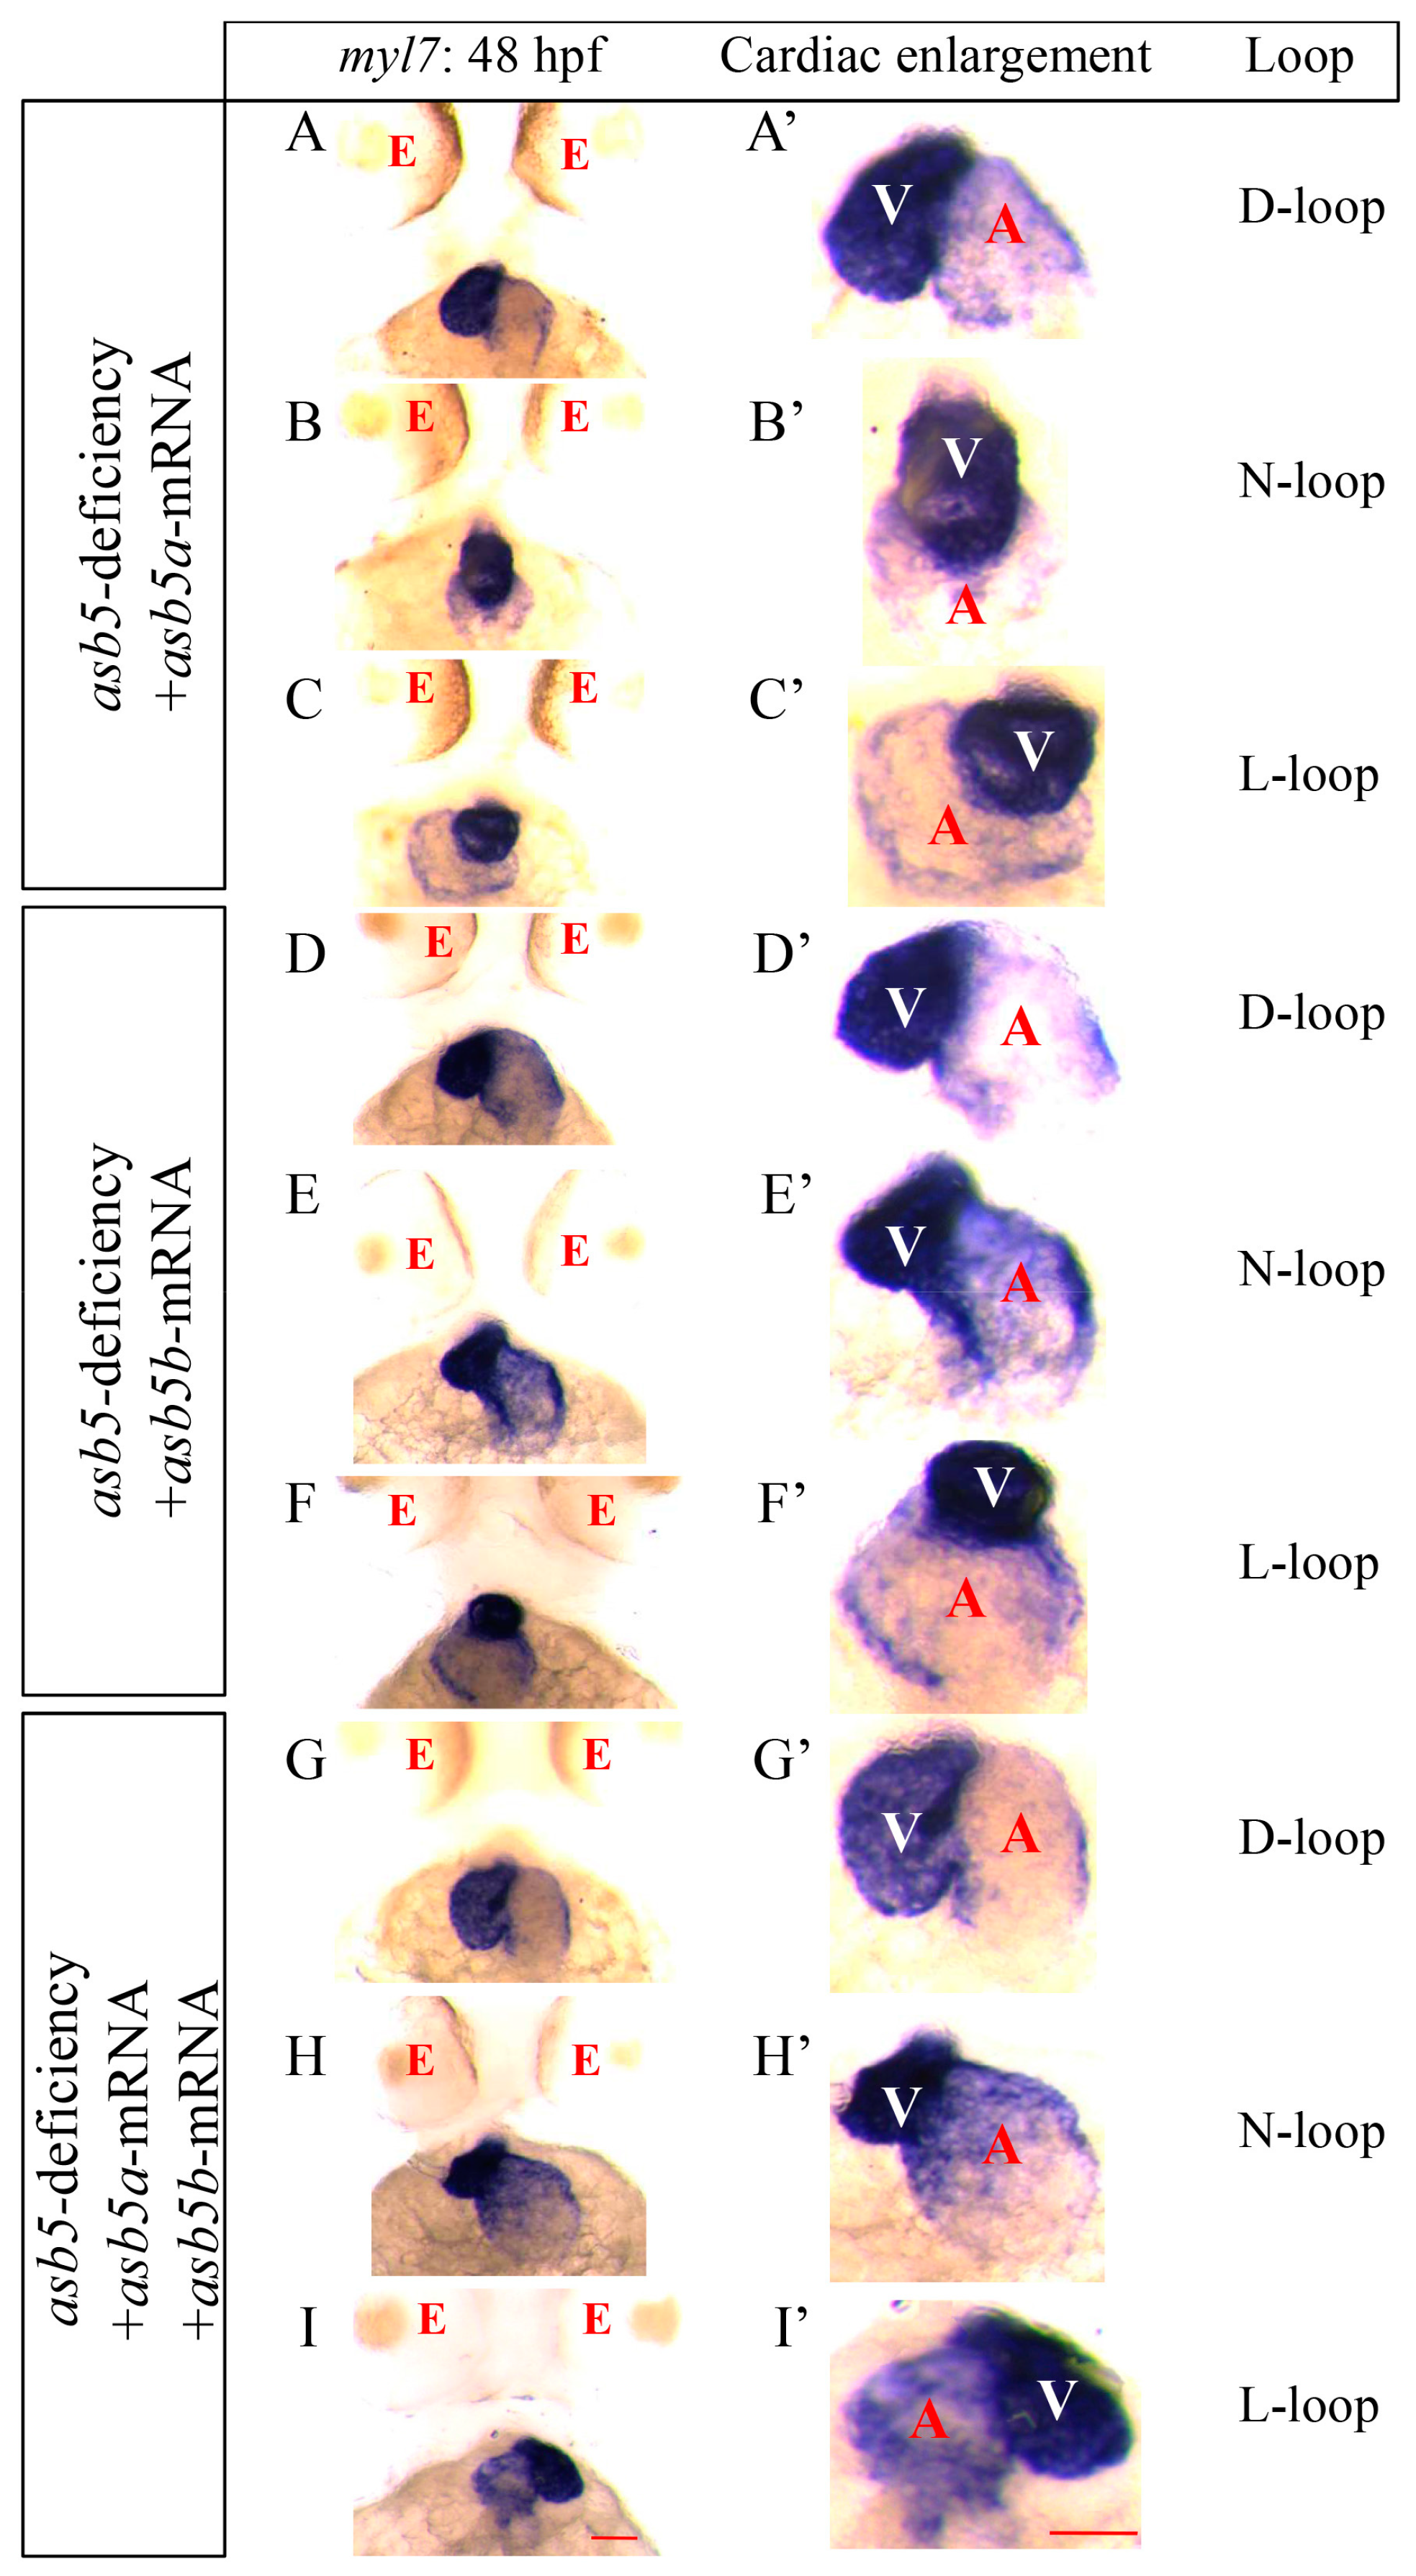
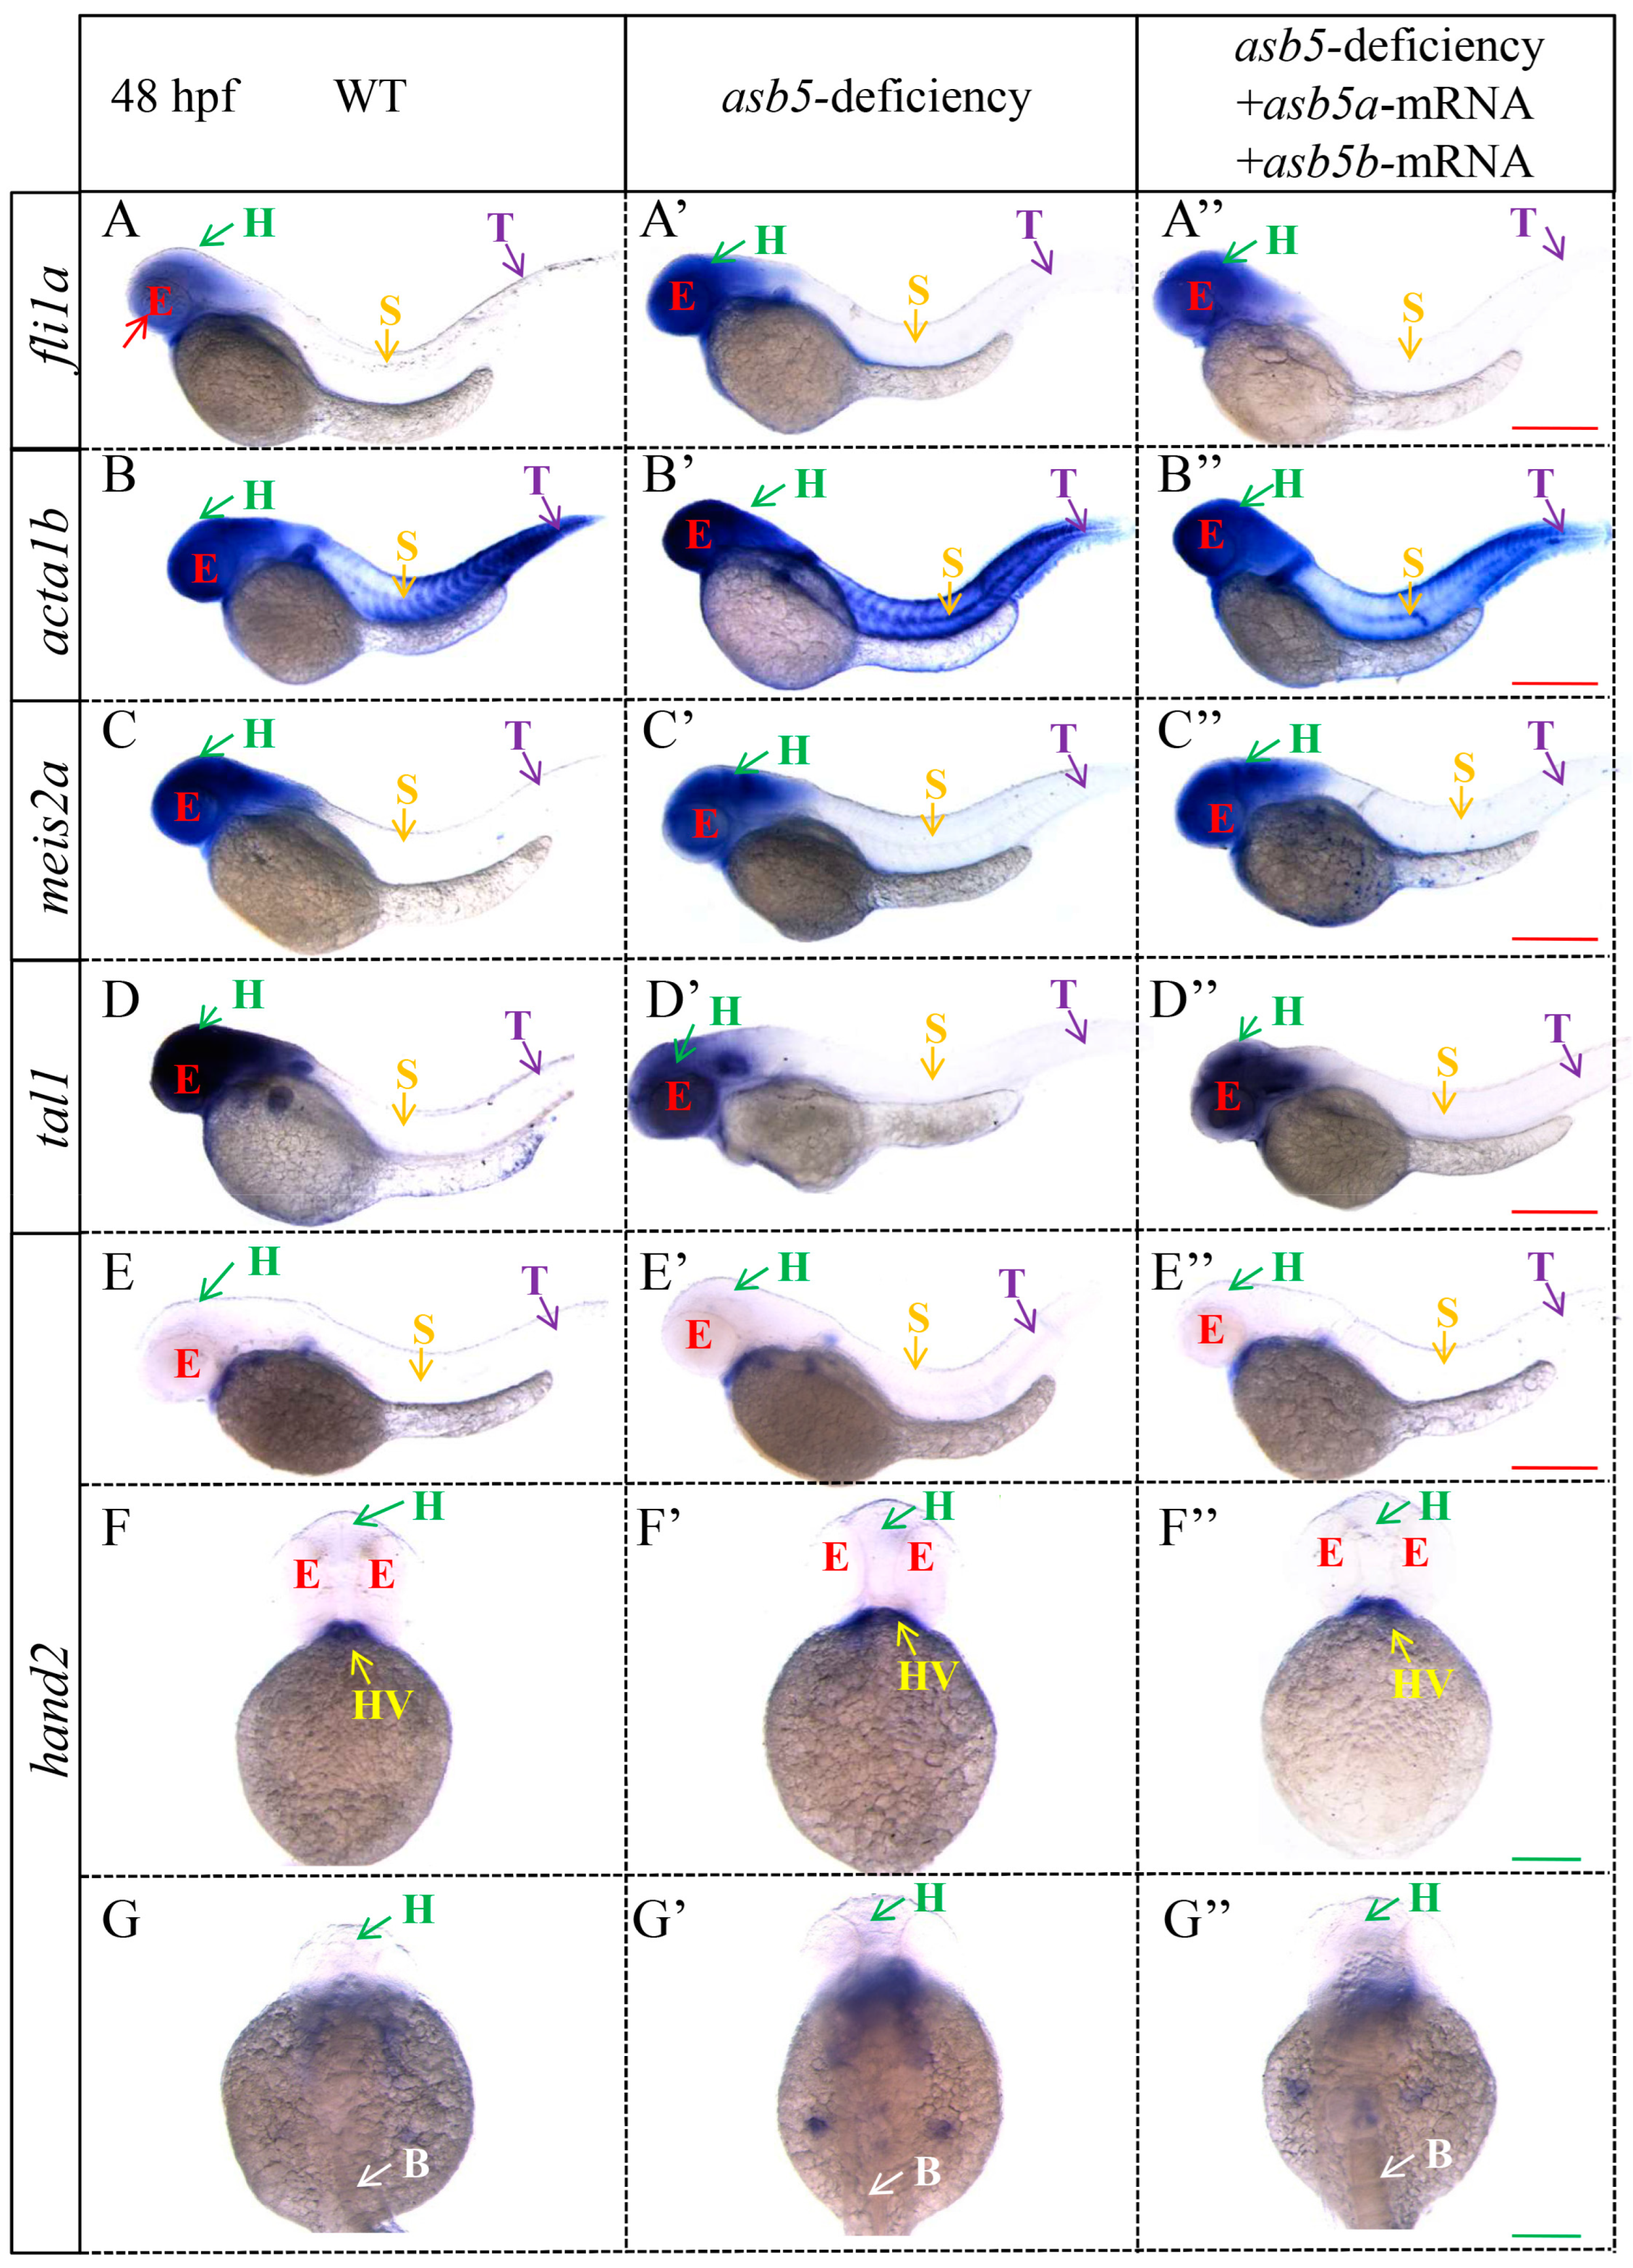
2.4. Simultaneous Injection of asb5a and asb5b mRNA Can Effectively Rescue the Circularization Abnormal Phenotype in the asb5-Deficiency Group

To eliminate the possibility that cardiac looping deformities were due to off-target effects or environmental factors, we conducted subsequent rescue experiments within the asb5-deficiency group. The results demonstrated that the injection of either asb5a-mRNA or asb5b-mRNA alone did not effectively rescue the asymmetric defect phenotype. In contrast, the simultaneous injection of asb5a-mRNA and asb5b-mRNA successfully rescued the L-R asymmetry defect in the heart (Figure 5). Statistical analyses confirmed that the circularization abnormalities in the asb5-deficient group were effectively rescued (Figure 6). These findings further substantiate that the early L-R asymmetry defects in the heart were indeed a consequence of the deletion of the asb5 gene.

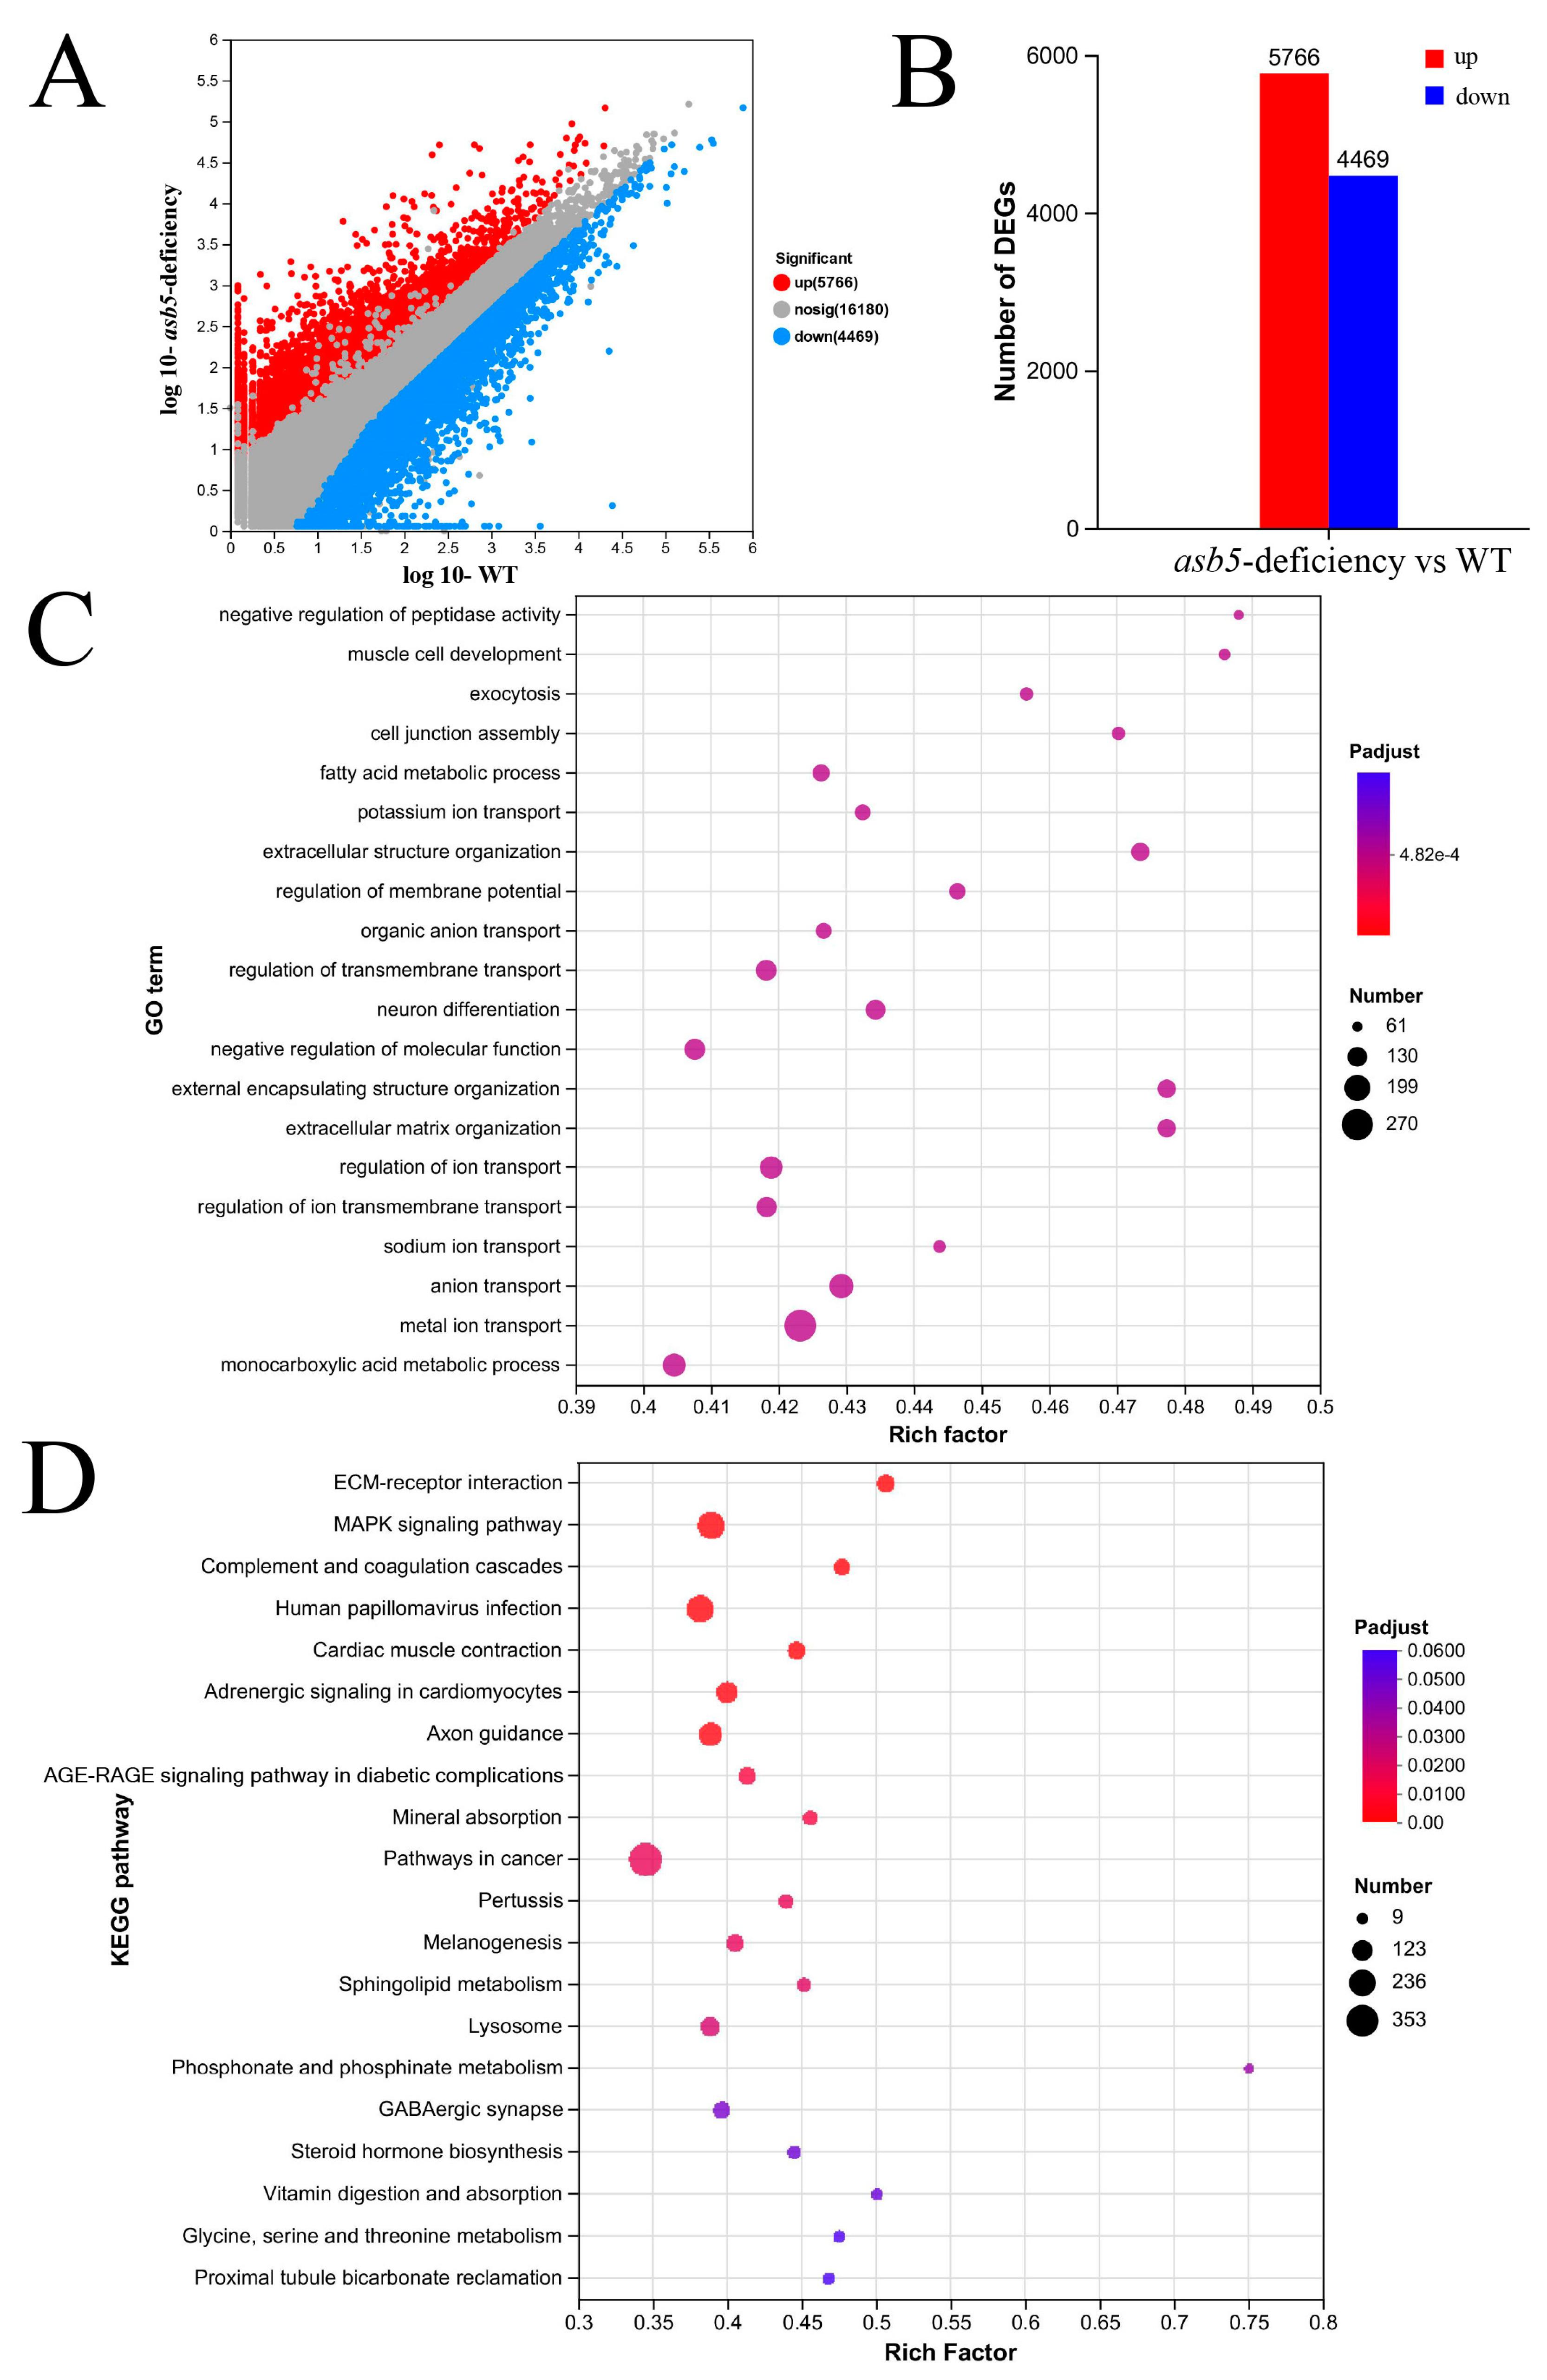
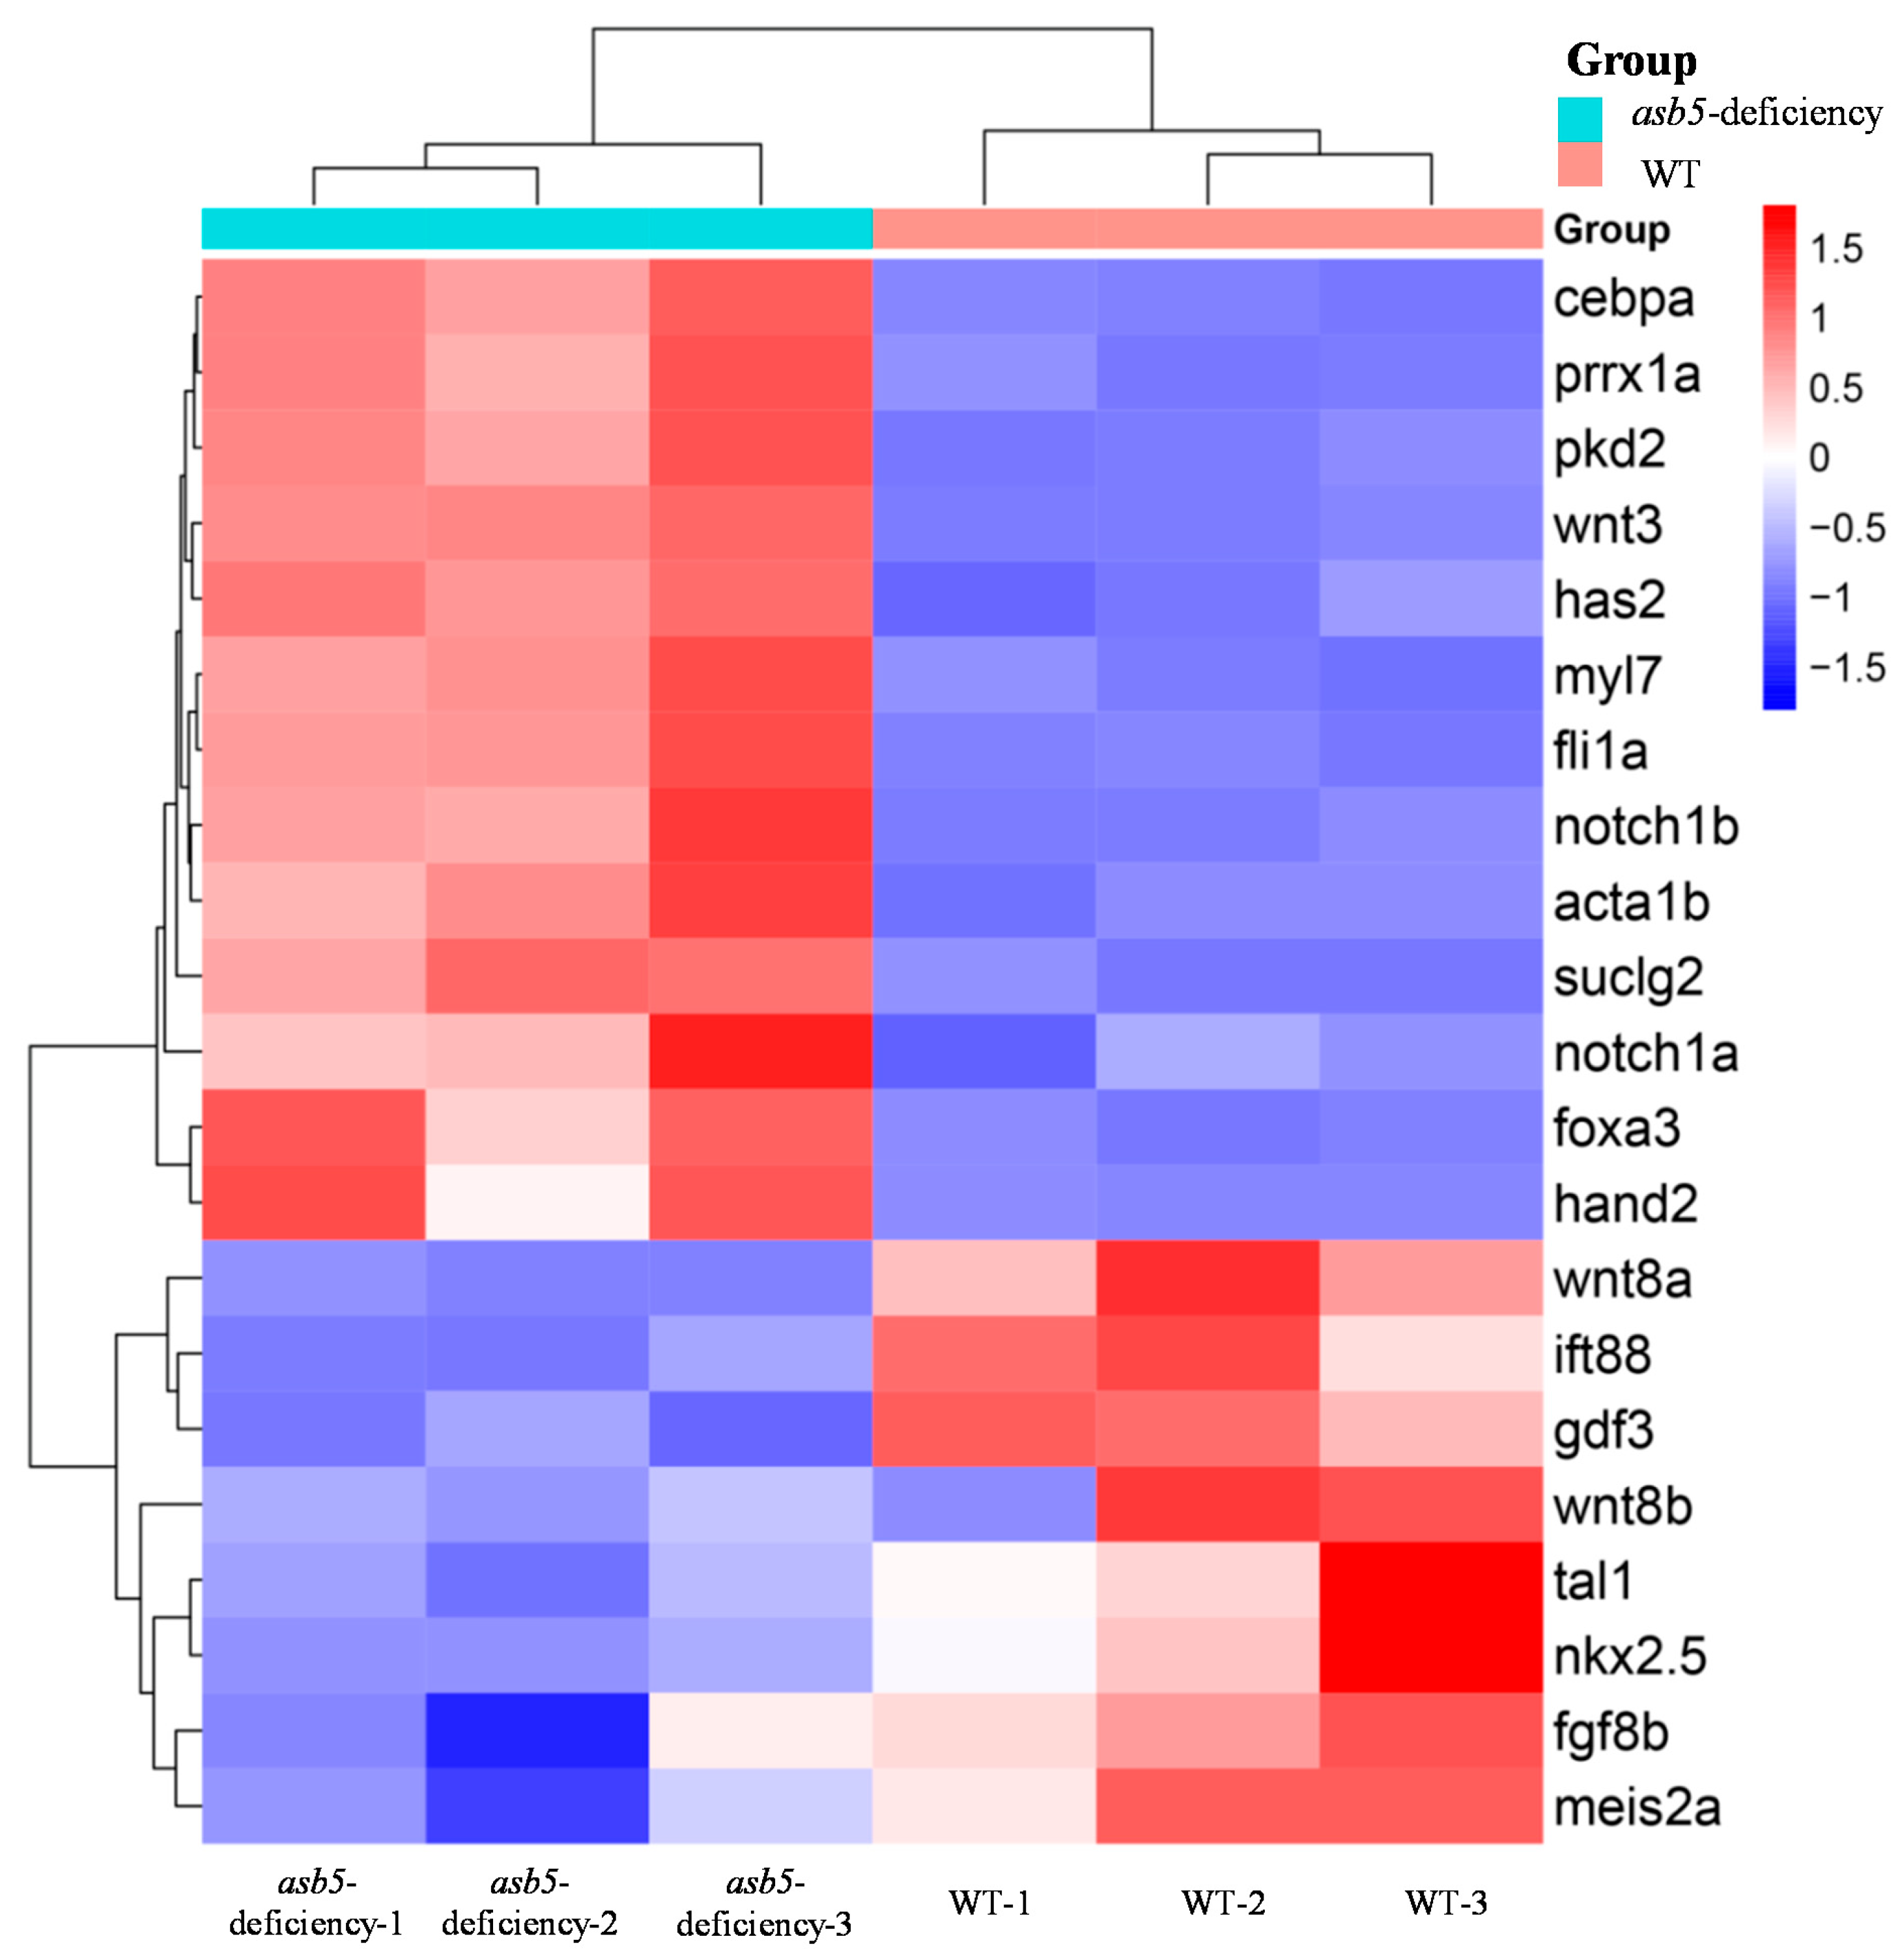
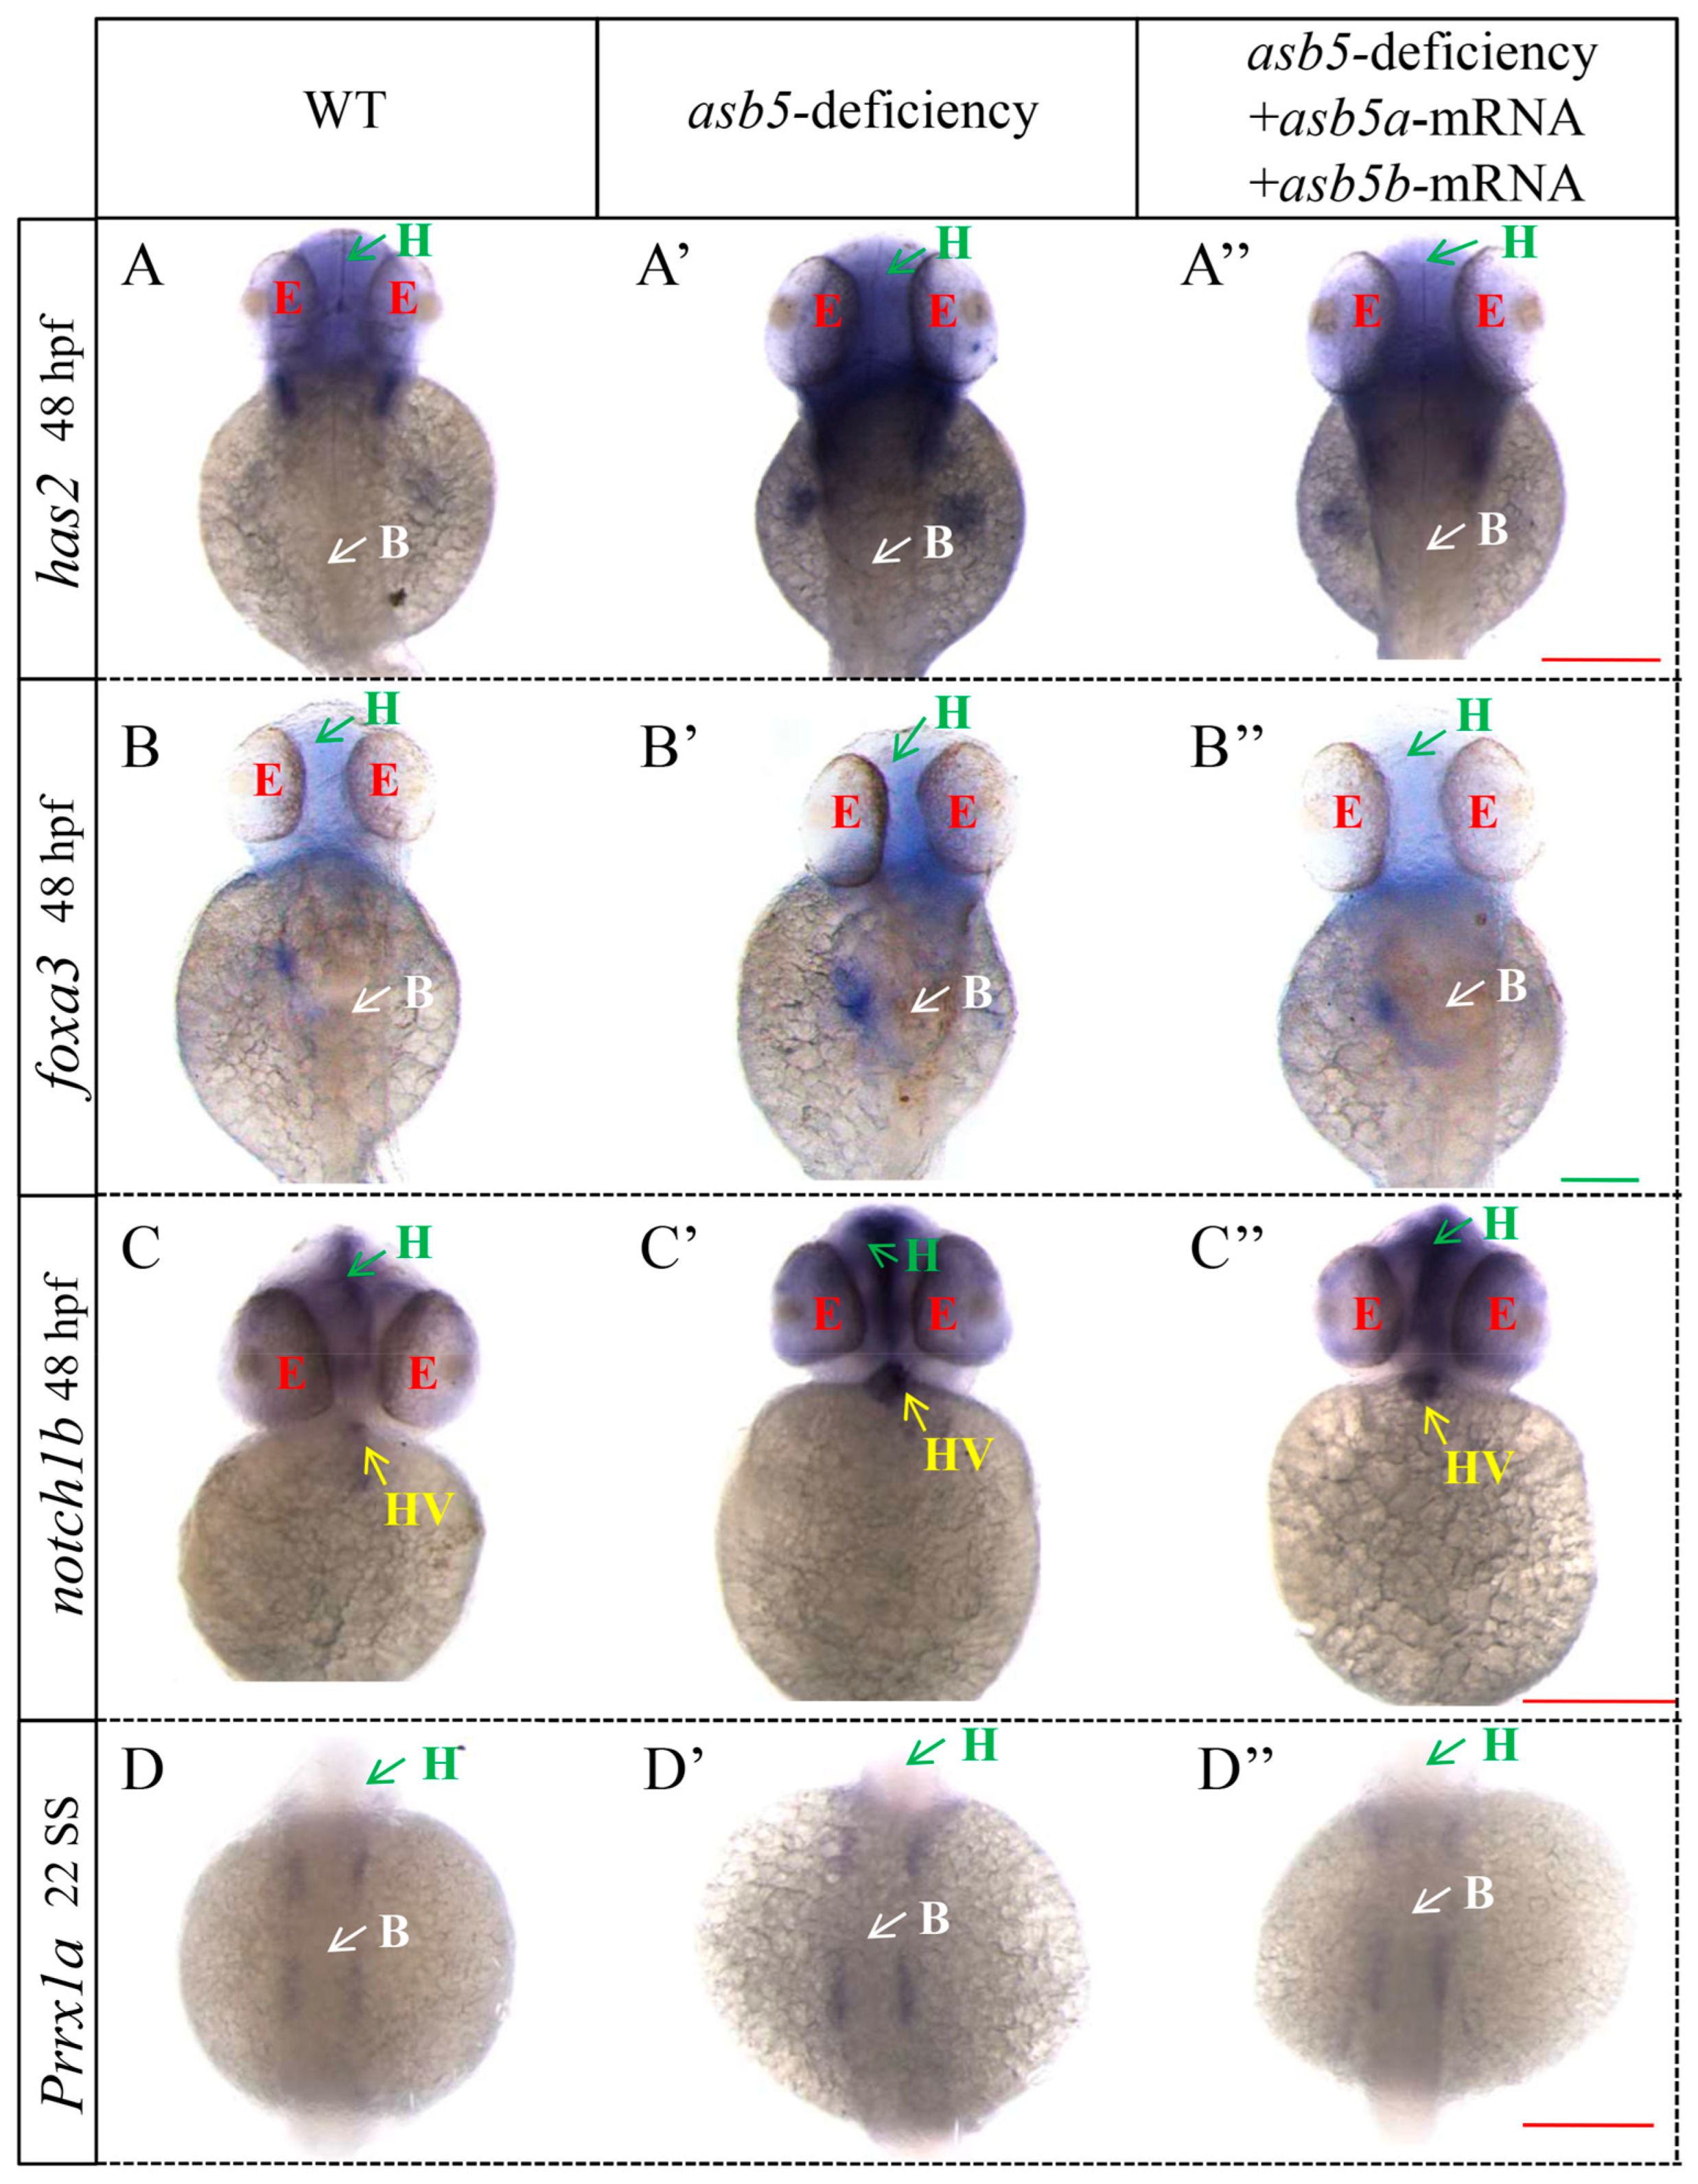
2.5. Loss of asb5 Affects the Expression of Genes Related to L-R Asymmetric Development

To investigate the mechanism linking the asb5 gene to L-R asymmetric development, we performed RNA-Seq high-throughput sequencing on 48 hpf zebrafish embryos from both the WT group and the asb5-deficient group (Figure 7). The results indicated that, compared to the WT group, the asb5-deficient group exhibited 5766 upregulated genes and 4469 downregulated genes (Figure 7A,B). Gene Ontology (GO) enrichment and Kyoto Encyclopedia of Genes and Genomes (KEGG) enrichment analyses highlighted the top 20 ranked entries (Figure 7C,D). Notably, the pathways related to extracellular matrix–receptor interaction, MAPK signaling, and adrenergic signaling in cardiomyocytes were closely associated with L-R asymmetric development. This finding aligns with the established role of structural ECM proteins and their integrin receptors in the development of the L-R axis of asymmetry in vertebrates [32]. Furthermore, our transcriptome results suggest that the hyperactivation of MAPK signaling mediated by Noonan syndrome and LEOPARD syndrome Shp2 variants may impair cilia function in Kupffer’s vesicle, leading to defects in L-R asymmetry and early cardiac development [33]. Additionally, adrenergic signaling facilitated by an increase in intracellular free calcium, may play a role in the asymmetric morphogenesis of visceral organs in Xenopus embryos [34].
A further analysis of the RNA-seq data revealed that, compared to the WT group, the asb5-deficiency group exhibited an imbalance in the expression of numerous genes associated with L-R asymmetric development (Figure 8, Supplementary File S2). Notably, the expressions of cebpa [35,36], prrx1a [2,37], pkd2 [38,39], wnt3 [40], has2 [41], myl7, fli1a [42,43], notch1b [44,45], acta1b [46,47], suclg2 [48], notch1a [49], foxa3 [50,51], and hand2 [52] were significantly upregulated (Figure 8, Red). In contrast, the expressions of wnt8a [53], ift88 [54,55], gdf3 [56,57], wnt8b [58], tal1 [59,60], nkx2.5 [61,62], fgf8b [63], and meis2a [64] were significantly downregulated (Figure 8, Blue). WISH was subsequently conducted, confirming that fli1a, acta1b, hand2, has2, prrx1a, notch1b, and foxa3 were significantly upregulated, while meis2a and tal1 were significantly downregulated (Figure 9 and Figure 10).

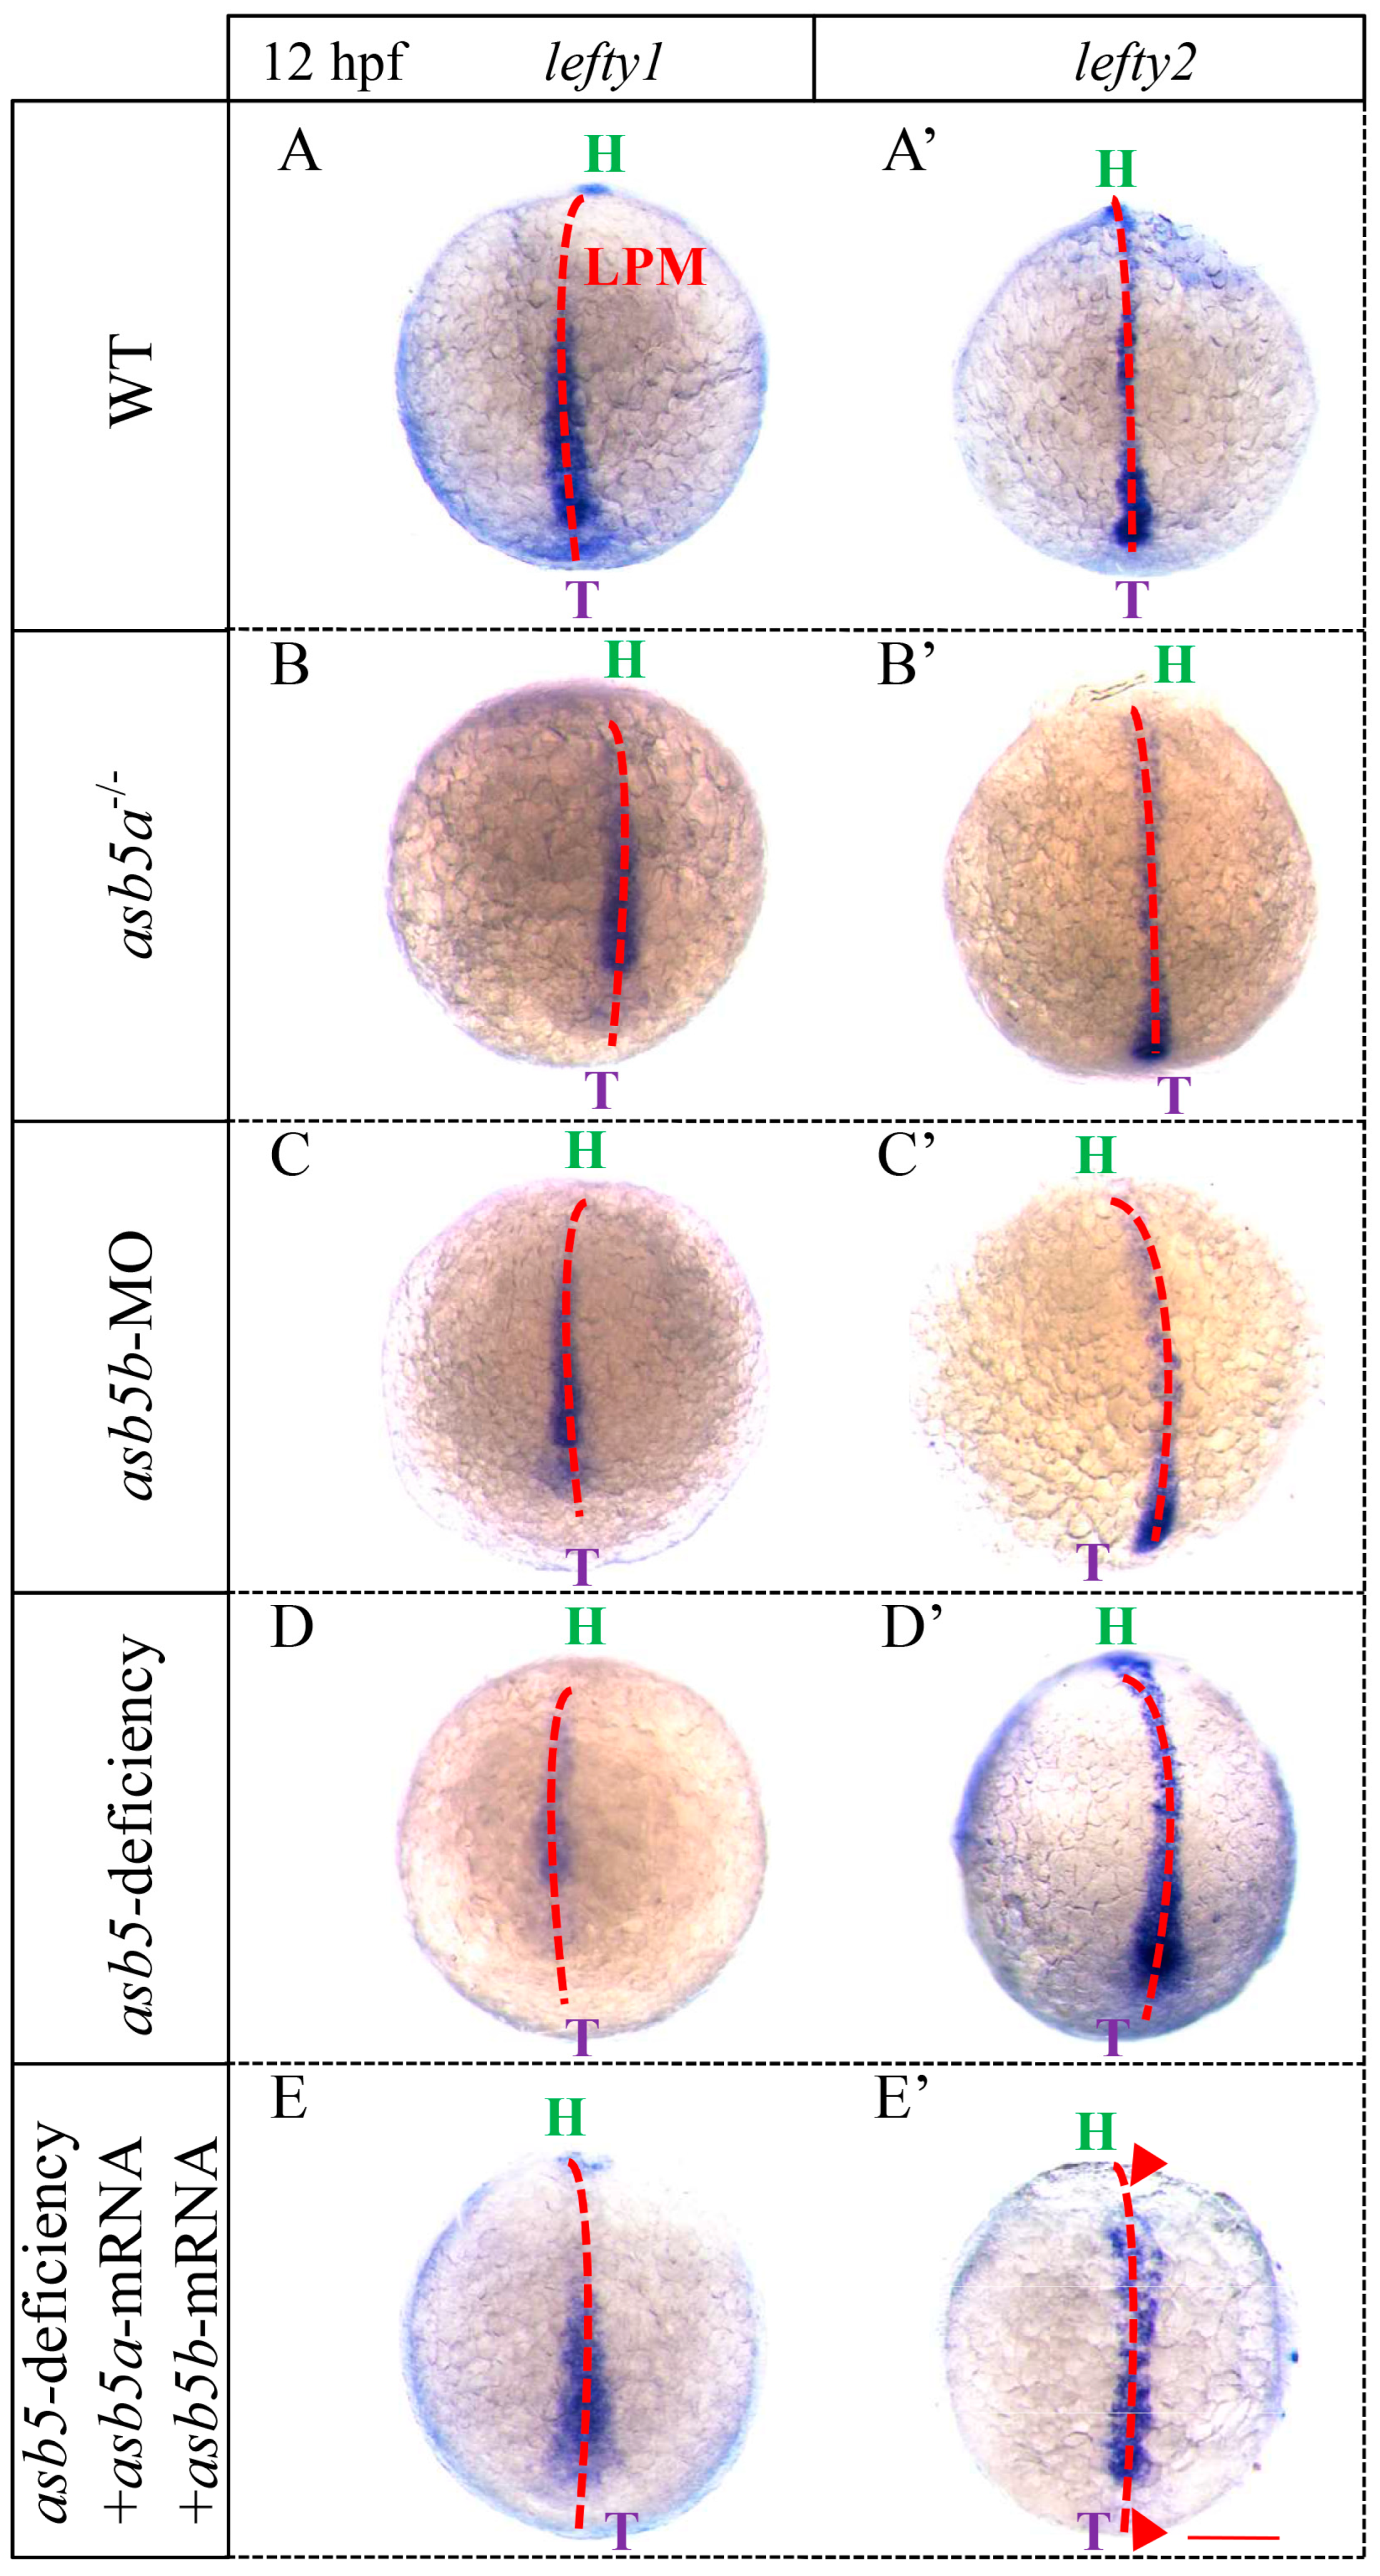
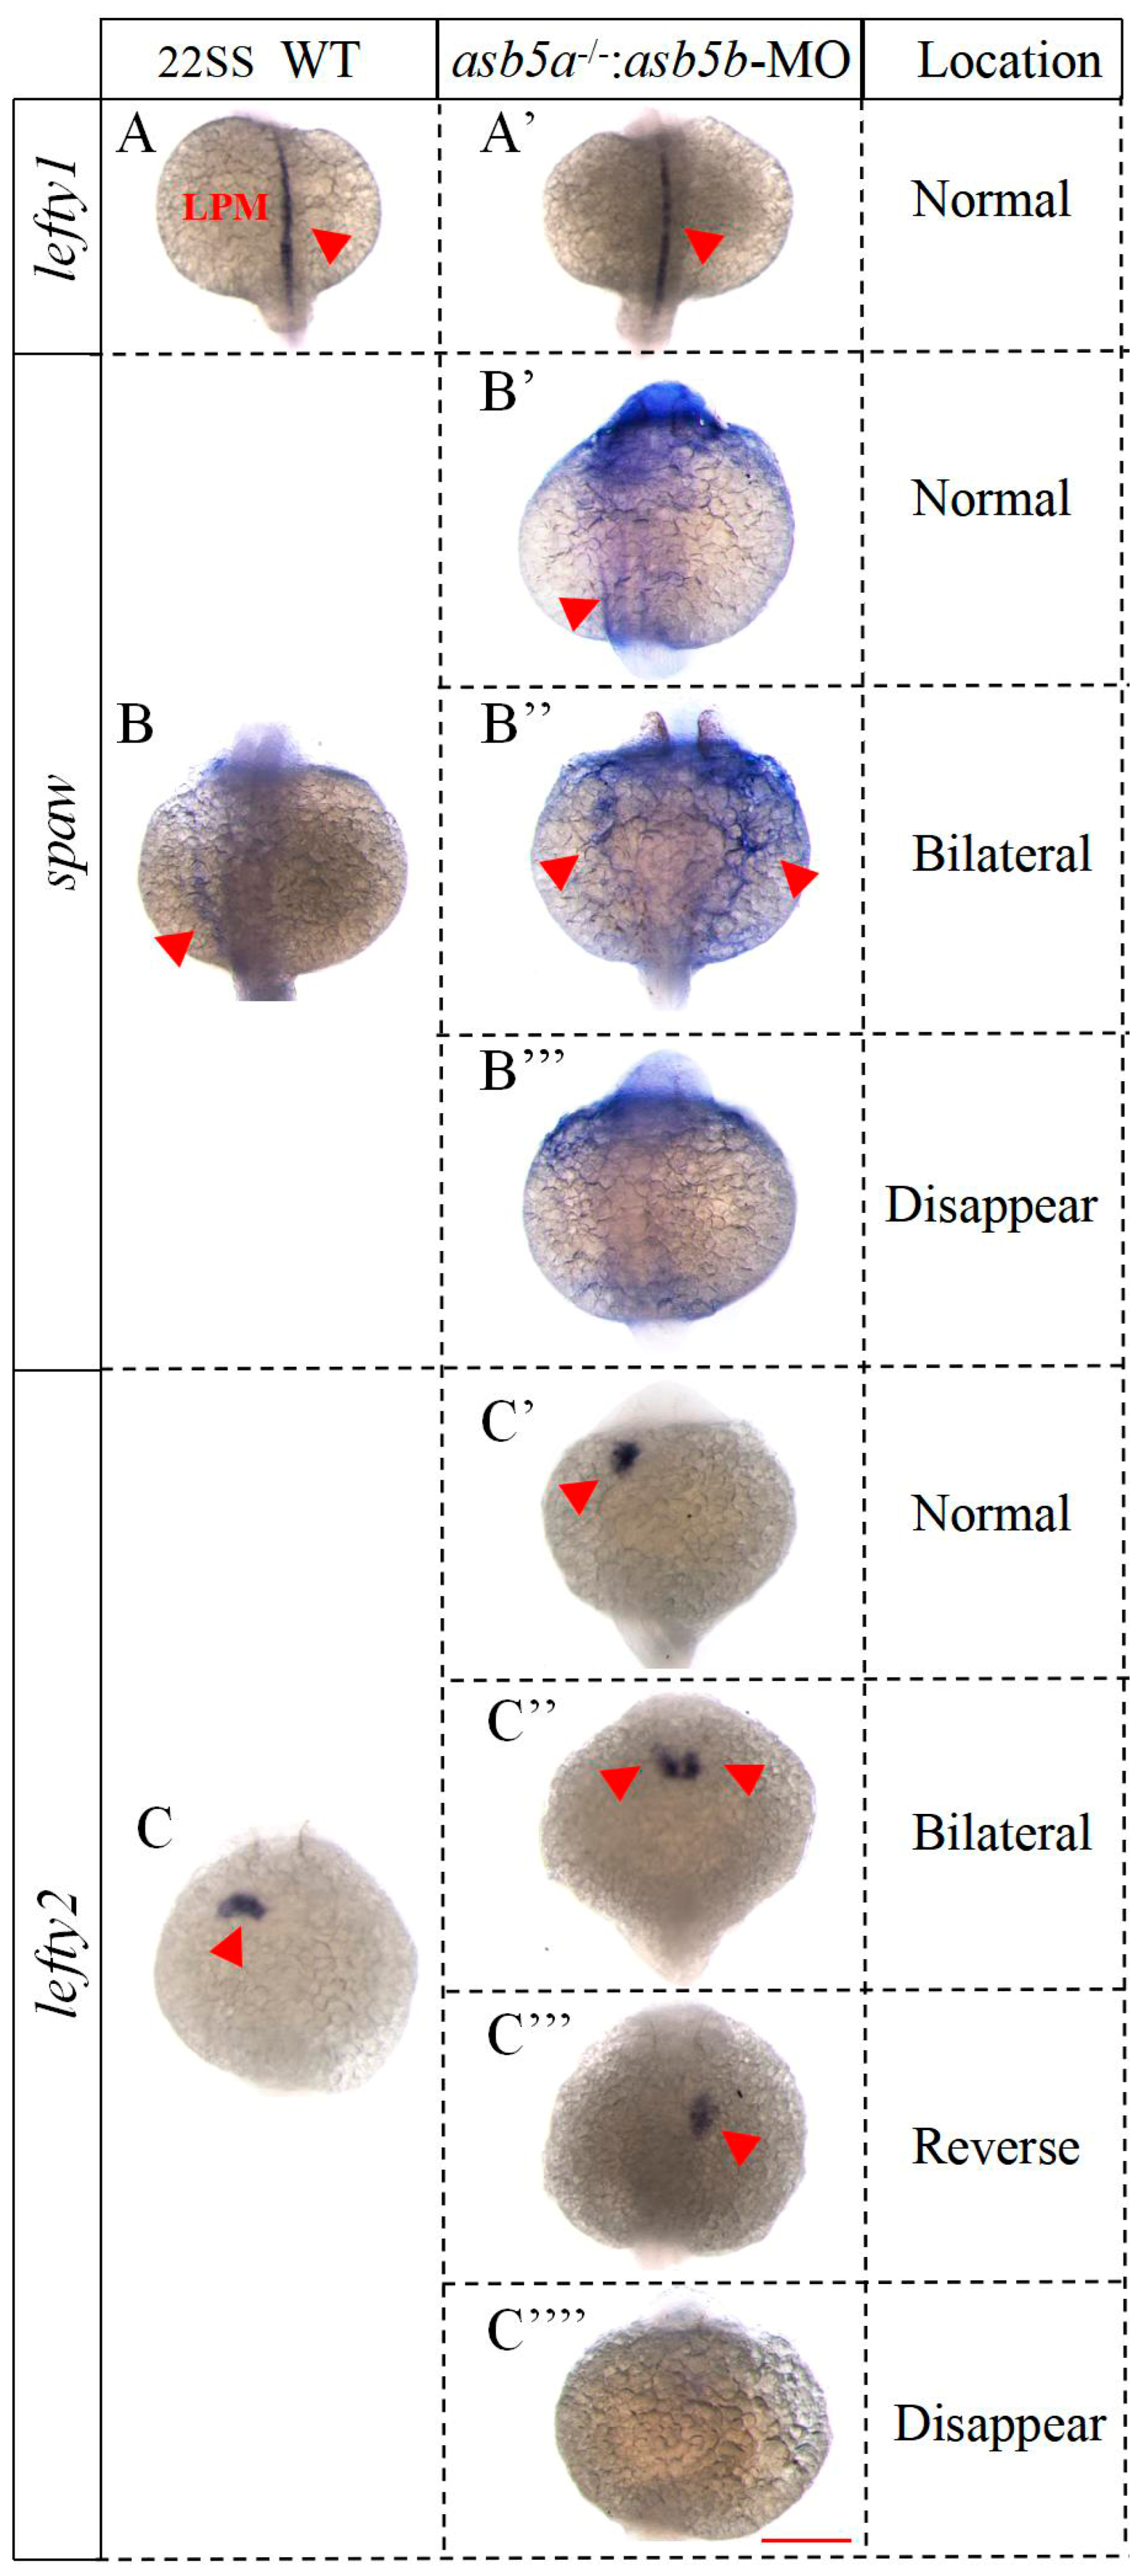
2.6. Nodal Signaling-Related Genes Are Expressed Imbalanced in the asb5-Deficiency Group

The above results demonstrated that at 48 hpf during zebrafish embryonic development, the asb5-deficiency group displayed abnormal cardiac L-R asymmetry, accompanied by an imbalance in the expression of genes associated with asymmetric development. Subsequently, we aimed to investigate whether this abnormality is linked to the Nodal signaling pathway, which plays a crucial role in the development of L-R asymmetry at earlier stages. We noted that in zebrafish, the Nodal protein homolog gene is spaw, expressed laterally on the left LMP. spaw subsequently regulates the expression of downstream target genes lefty1 and lefty2, which act as antagonists to spaw and can also exert negative feedback to modulate spaw expression [7,11,12]. Consequently, we conducted WISH experiments to assess the expression of these genes at earlier stages. The results revealed that lefty1 and lefty2 were specifically expressed in the LPM of the embryonic dorsal region in WT zebrafish at 12 hpf embryonic development. In contrast, lefty1 expression in the asb5-deficiency group was significantly downregulated, while lefty2 was significantly upregulated. Notably, this altered expression pattern was effectively rescued by the co-injection of asb5a-mRNA and asb5b-mRNA (Figure 11). At the 22 somite stage (SS) of embryonic development, lefty1 continued to be expressed at the midline in the asb5-deficiency group, showing no significant differences compared to the WT group (Figure 12A–A′). Typically, spaw is expressed in the LPM with a left-sided bias (Figure 12B); however, in the asb5-deficiency group, three distinct expression patterns were observed: Normal, Bilateral, and Disappeared expression (Figure 12B′–B′′′). In the WT group at the 22 SS, lefty2 is specifically expressed on the left side of the LPM (Figure 12C). In contrast, the asb5-deficiency group exhibited four expression patterns: Normal, Bilateral, Reverse, and Disappeared expression (Figure 12C′–C′′′′). In summary, following the inactivation of the two subtypes of asb5 in zebrafish, the Nodal homolog gene spaw demonstrated random expression or the absence of expression, while its downstream target gene lefty1 was downregulated and lefty2 was upregulated, also demonstrating random distribution (Figure S6). These findings suggest that the two isoforms of asb5, asb5a and asb5b, may regulate the expression of spaw, lefty1, and lefty2 via the Nodal signaling pathway, which is essential for establishing the early cardiac asymmetry pattern in zebrafish.

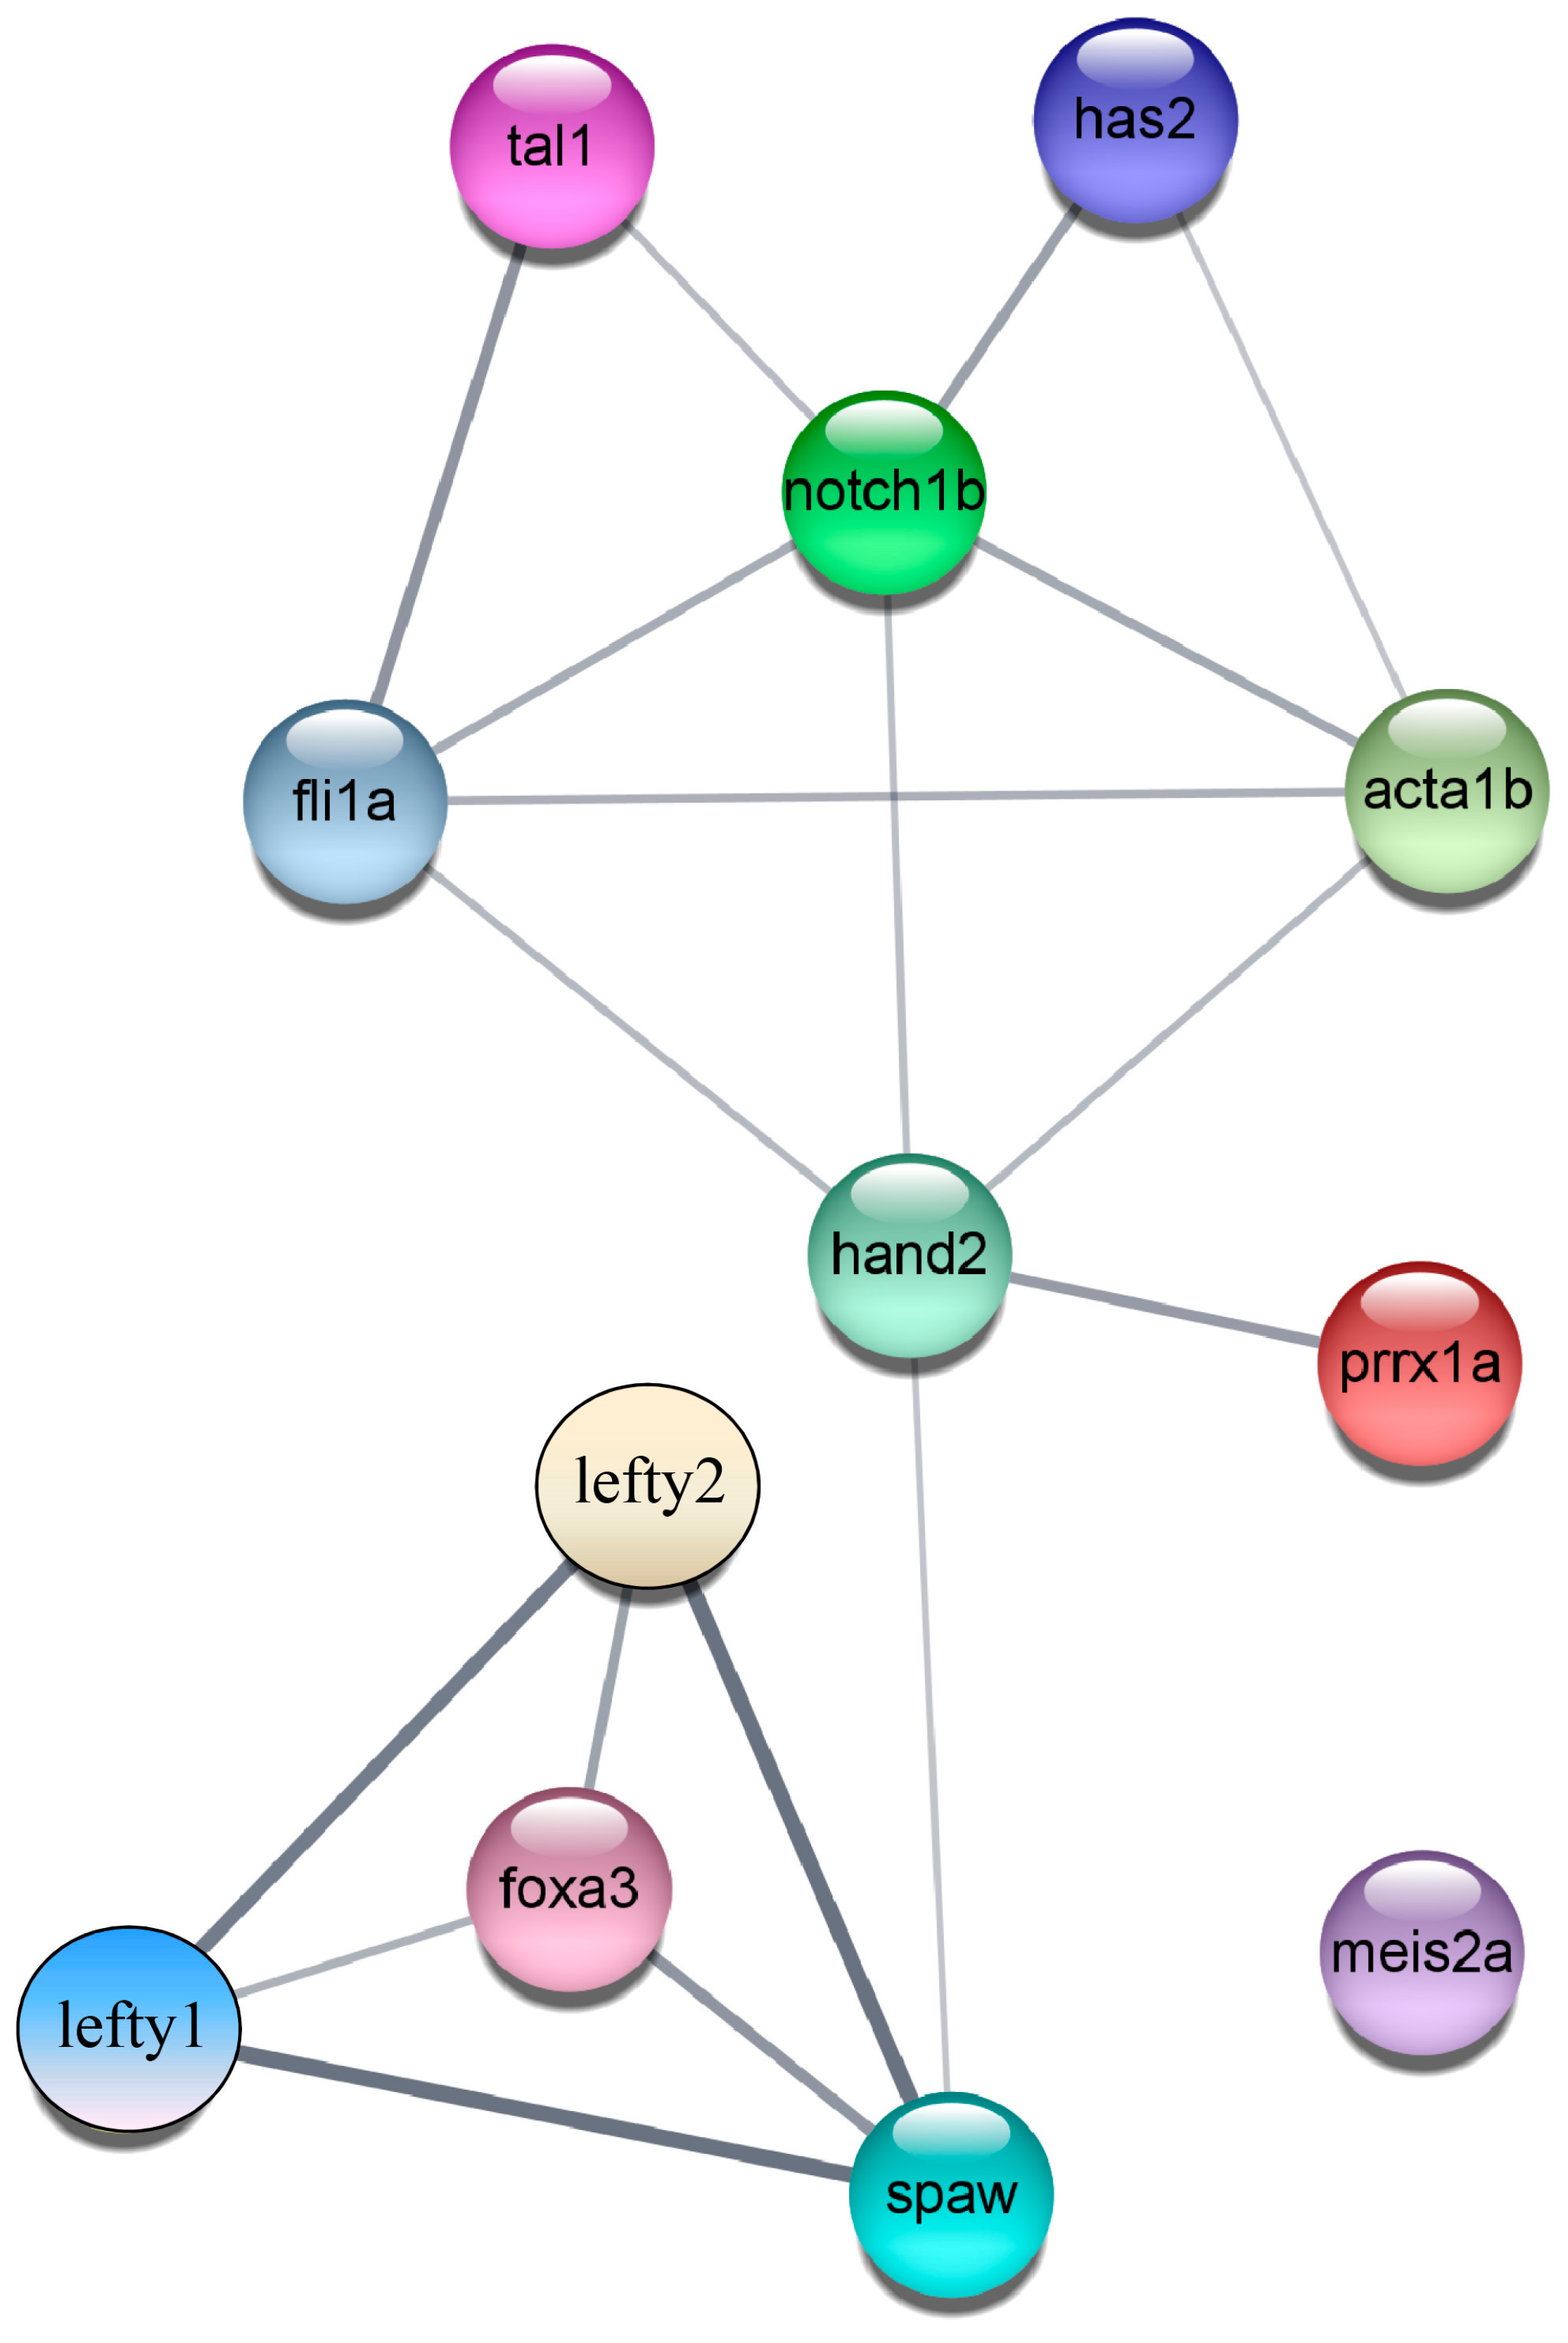
2.7. Construction of the PPI (Protein–Protein Interaction) Regulatory Network Diagram

Based on the results presented, we found that under normal circumstances, the Nodal gene spaw is expressed in the left LPM and activates the Nodal signaling pathway on the left side of the heart [8]. However, following the inactivation of both the asb5a and asb5b genes, the Nodal signaling pathway associated with L-R asymmetric development is altered. The Nodal protein homolog gene spaw begins to exhibit random expression, leading to a significant downregulation of its downstream target gene lefty. Lefty1 acts as a `molecular midline barrier’ at the midline, preventing Nodal propagation from the left to the right LPM [10]. Subsequently, the expression of the laterality gene lefty2 becomes unbalanced, resulting in the dysregulation of a series of genes linked to L-R asymmetric development. To investigate this further, we utilized the STRING database (version 11.0b) [65,66] and Cytoscape software (version 3.9.1) [67,68] to construct a unified regulatory PPI network diagram of these 12 differentially expressed genes. Our analysis revealed that the regulation of these genes can be broadly categorized into three modules: First, following the loss of asb5, the earliest laterality gene spaw exhibits unbalanced expression, resulting in a significant downregulation of the downstream gene lefty1. The absence of lefty1 disrupts the midline barrier, allowing the left-sided specific factor lefty2 to cross the midline and express randomly. Consequently, the proper pattern of the early lateral Nodal signaling pathway is disrupted, affecting the correct expression of foxa3, which is a specific marker for the liver, intestine, and pancreas [50,51]. Secondly, the loss of asb5 leads to an imbalance in the expression of left-sided spaw and right-sided prrx1a, which impacts the expression of the early cardiac marker gene hand2. This disruption results in an imbalance in the expression of genes associated with cardiac valve development, vascular endothelial formation, and skeletal muscle development, including fli1a, tal1, has2, notch1b, and acta1b. Furthermore, the downregulation of meis2a following the loss of asb5 may directly influence the establishment of the heart’s L-R asymmetry pattern (Figure 13).

3. Discussion

Previous research conducted by our team demonstrated that the application of CRISPR/Cas9 and morpholino techniques to inactivate the expression of asb5 in zebrafish (asb5-deficiency group) led to a phenotype characterized by abnormal cardiac contraction. This finding underscores the critical role of asb5 in sustaining normal heart function during development. In this study, we observed cardiac looping abnormalities at 48 hpf in the asb5-deficiency group, providing the first evidence that the asb5 gene is significant for maintaining the L-R asymmetrical development of the early heart in zebrafish.
Initially, we utilized the myl7:EGFP zebrafish line as a background to observe cardiac looping abnormalities at 48 hpf in the asb5-deficiency group. This observation was subsequently confirmed through analysis using the Semi-automatic Heartbeat Analysis software program (Version 3.4.0.0). To eliminate the possibility that these deformities arose from environmental factors (such as water quality, food, and pH), we repeated the experiments and randomly collected 48 hpf embryos from various groups for WISH. The results indicated that the asb5-deficiency group exhibited three distinct cardiac looping phenotypes—D-loop, N-loop, and L-loop—when assessed with the myl7 and nppa probes, in comparison to the other groups. This finding confirmed that the absence of asb5 in zebrafish indeed resulted in abnormalities in early cardiac looping. In situ hybridization results utilizing vmhc and amhc probes demonstrated that the differentiation of ventricular and atrial tissues was normal; however, their positions displayed random distributions (Normal arrangement, Middle alignment, and Reverse arrangement). Furthermore, rescue experiments were conducted, revealing that only the simultaneous injection of asb5a and asb5b mRNA effectively rescued the cardiac looping abnormality phenotype in the asb5-deficiency group. In summary, the deletion of asb5 in zebrafish results in abnormalities in the early L-R asymmetrical development of the heart. Subsequently, RNA-Seq results revealed an expression imbalance in a series of genes associated with L-R asymmetrical development in the asb5-deficiency group. WISH experiments confirmed the expression imbalance of 12 genes (fli1a, acta1b, hand2, has2, prrx1a, notch1b, foxa3, meis2a, and tal1). We then investigated whether this gene expression imbalance was closely related to the early regulatory Nodal signaling pathway that governs L-R asymmetrical development. The expression levels of classic marker genes for the Nodal signaling pathway spaw, lefty1, and lefty2 were assessed. The WISH results indicated that these three genes exhibited abnormal expression following the deletion of asb5.
Meis2a is expressed in the gill arches of zebrafish and exhibits a similar expression pattern to meis2b. The literature indicates that meis2b mutant zebrafish display cardiac circulation defects and a reduced heart rate.
Spaw [69] is recognized as the earliest confirmed nodal homologous gene associated with L-R asymmetry, typically expressed in the left LPM. It subsequently regulates the expression of its downstream target genes, lefty1 and lefty2. The Nodal signaling pathway is highly conserved on the left side during embryonic development, and its proper regulation is essential for L-R asymmetric development. Lefty1 is expressed at the midline, functioning as a “molecular midline barrier” that prevents the propagation of Nodal from the left to the right LPM [10]. The downregulation of lefty1 disrupts this midline barrier, enabling the expression of the laterality gene lefty2 to cross the midline and manifest in the right LPM. Foxa3 [70,71] serves as a marker gene for the liver, intestine, and pancreas. Alterations in the upstream Nodal signaling pathway can result in the mislocalization of visceral organs and may also influence the expression of foxa3. The prrx1a gene in zebrafish [72,73] exhibits stronger expression in the right LPM compared to the left. The bmp4-prrx1a signaling axis plays a critical role in regulating L-R asymmetric development on the right side of the midline.
Additionally, hand2 is crucial for heart development, with its expression primarily localized to the right side of the heart tube. And zebrafish atrioventricular valve formation necessitates the transition from epithelial to mesenchymal cells. The Notch signaling pathway, BMP signaling pathway, and Wnt signaling pathway collaborate to facilitate the EMT, with genes such as notch1b, bmp4, and has2 playing critical roles in this process [74,75]. Tal1 has been identified as a key factor in early endothelial growth, regulating the formation of intercellular junctions and the maintenance of endocardial characteristics [76]. Fli1a is recognized as a marker gene for vascular development in zebrafish [31,32], while acta1b is involved in regulating skeletal muscle development in zebrafish. The changes in the abovementioned genes may have affected the normal development of blood vessels, endocardium, and valves in the heart tissue, ultimately resulting in the abnormal L-R asymmetry of the heart.
Through an analysis of the preliminary PPI network depicted in Figure 13 and a review of the existing literature, we constructed a probable molecular regulatory network influencing early cardiac L-R asymmetry in zebrafish (Figure 14). We hypothesize that asb5 deficiency may impact the early cardiac L-R asymmetric development in zebrafish through three primary pathways: First, the loss of asb5 leads to the dysregulation of meis2a expression, which may directly contribute to the early L-R asymmetric development of the heart. Second, asb5 deficiency disrupts spaw expression, resulting in significant downregulation of the downstream target gene lefty1, thereby compromising the midline barrier. Consequently, the expression of spaw and lefty2 on the left side crosses the midline barrier to the right side of the LPM, ultimately leading to errors in the conserved Nodal signaling pathway on the left side and the dysregulation of foxa3. Finally, the absence of asb5 results in an imbalance in the expression of prrx1a on the right side, a gene that is typically expressed at low levels on the left side and at high levels on the right side, where it participates in the bmp4-prrx1a signaling pathway. Additionally, hand2 is highly expressed on the right side during embryonic development, potentially co-regulating right-sided Bmp4 signaling to facilitate L-R asymmetric development. The disruption of these L-R signaling pathways may lead to an imbalance in the expression of a series of genes involved in heart valve development, vascular endothelial development and skeletal muscle development, ultimately severely affecting the early asymmetric development of the heart (Figure 14).
In summary, our study has preliminarily confirmed the critical role of the asb5 gene in the early L-R asymmetric development of the heart in zebrafish. The deficiency of asb5 disrupts the expression of genes associated with the L-R axis, thereby affecting the morphogenesis of early cardiac looping. This finding offers significant insights for further research into the molecular regulatory mechanisms of this gene in heart development and enhances the understanding of potential therapeutic targets for early congenital heart disease.

4. Materials and Methods

4.1. Zebrafish Strain Rearing and Breeding

The AB zebrafish strain and the myl7:EGFP strain, which specifically expresses green fluorescent protein in cardiac tissue, were maintained at a constant temperature of 28.5 °C in a water circulation system. For zebrafish breeding, two females and three males were placed into hybrid bars, with clear plastic partitions used for overnight separation. The partitions were removed around 09:00 am the following day to facilitate mating, egg laying, and subsequent embryo collection.

4.2. Imaging Technique and Image Analysis

An Axiocam from Zeiss Company was utilized to capture and analyze the hearts of myl7:EGFP zebrafish at 48 hpf. To minimize zebrafish movement, a 6% methylcellulose solution was employed. Image processing was performed using the Zeiss AxioVision 3.0.6 software package ((Zeiss Company, Jena, Germany) in conjunction with Adobe Photoshop. A high-speed EM-CCD camera recorded the zebrafish heartbeats at a rate of 130 frames per second for a duration of 10 s, utilizing a 20× objective lens. Subsequently, the recorded heartbeat movie was analyzed with the Semi-automatic Heartbeat Analysis software program. Each frame of the movie, with a resolution of 1300 × 600 pixels, was extracted to examine the cardiac looping morphology during early development. Fluorescence imaging of WISH-stained zebrafish embryos was conducted using a Leica M205FA microscope (Wetzlar, Germany), with a 10% methylcellulose solution employed to immobilize the stained embryos. All in situ hybridization images were captured using the Leica Application Kit imaging software program (version 3.2.0).

4.3. Synthesis of RNA Probes and WISH in Embryos

To prepare the mRNA antisense probe, a segment of the mRNA sequence corresponding to the gene was amplified using reverse transcription polymerase chain reaction (RT-PCR). The forward and reverse primers, which include the T7 promoter sequence, are detailed in Table S1. The purified RT-PCR products served as the transcription template for synthesizing digoxigenin-labeled antisense RNA probes via in vitro transcription, utilizing the Riboprobe® System-T7 transcription kit (P1440, Promega, Madison, WI, USA) and the ROACH DIG RNA Labeling Mix (REF 11277073910, Roche, Basel, Switzerland). Zebrafish embryos at specific developmental stages were fixed overnight in 4% paraformaldehyde and subsequently stored in 100% methanol. WISH was employed to detect the spatial distribution and expression levels of the gene.

4.4. In Vitro Synthesis of Cap-Modified mRNA for asb5a and asb5b

To prepare cap-modified mRNA, the complete coding sequence (CDS) of the gene was amplified using RT-PCR. The forward and reverse primers, which include the T7 promoter sequence, are detailed in Table S2. The purified RT-PCR products were ligated into the pXT7 empty vector to construct an overexpression plasmid (Figures S1–S3). Following single enzyme digestion of the overexpression plasmids, they served as the transcription template for synthesizing cap-modified, active mRNA via in vitro transcription, utilizing the Riboprobe® System-T7 transcription kit (P1440, Promega, Madison, WI, USA) and Ribo m7G Cap Analog (P1712, Promega, Madison, WI, USA).

4.5. RNA-Seq Transcriptome Analysis

Collect 48 hpf zebrafish embryos, with 50 embryos per tube constituting one biological replicate, and store them at −80 °C. Each dataset in the RNA-seq analysis is derived from a biological replicate consisting of 50 embryos. The RNA-seq sequencing was performed by Majorbio, and the RNA-seq data analysis was conducted using the free online Majorbio Cloud platform (www.majorbio.com). DEGs were analyzed using DESeq, with the screening criteria established as follows: |log2 fold change| > 2.0 and a significance p-value < 0.05.

4.6. Construction of PPI Network and Module Screening

The PPI network was constructed using STRING version 11.0b (available at https://string-db.org/, accessed on 2 June 2022) in conjunction with Cytoscape (version 3.7.1).

4.7. Statistical Analyses

The results are the mean ± SEM. Data were analyzed using Student’s t-test or a one-way ANOVA. Significance was defined as p < 0.05.

5. Conclusions

In conclusion, our results indicate that the asb5 gene plays an important role in the early heart development of zebrafish and is crucial for the normal maintenance of the L-R asymmetric development of the heart, providing new targets and directions for the clinical diagnosis and treatment of zebrafish heart diseases.

Supplementary Materials

The following supporting information can be downloaded at: https://www.mdpi.com/article/10.3390/ijms26062765/s1.

Author Contributions

Conceptualization, W.Z. and W.C.; writing—original draft preparation, W.Z., W.C., Y.L., L.G., L.Z. and W.Y.; writing—review and editing, W.Z., W.C., X.L., S.L., L.Z. and W.Y.; experiments, W.Z., W.C., L.G., J.L. and J.Z.; bioinformatic analyses, W.Z., W.C., Y.W., Z.J., X.W., X.F. and F.L.; statistical analyses, W.Z., W.C., Y.L., L.Z. and W.Y.; funding acquisition, W.Y., L.Z., Z.J., Y.L., Y.W., X.F. and F.L. All authors have read and agreed to the published version of the manuscript.

Funding

This research was funded by the National Natural Science Foundation of China (81970324, 81370451, 81800289, 31872315, 81670290, 81470377, and 32371182), the Hunan Provincial Natural Science Foundation of China (No. 2023JJ30396), Science and Technology Project of Hunan Provincial Department of Education (No. 24B0076), Supported by Hunan Provincial Innovation Foundation For Postgraduate (CX20230526), and the National first-class courses from the Chinese Ministry of Education (2020110536, 2023220356).

Institutional Review Board Statement

The animal study protocol was approved by the Biomedical Research Ethics Committee of Hunan Normal University (protocol code 2022/545; approved 14 December 2022).

Data Availability Statement

All data generated or analyzed during this study are included in the article/Supplementary Material. Further inquiries can be directed to the corresponding authors.

Acknowledgments

The authors thank Xiushan Wu, Yongqing Li, and Wuzhou Yuan from the Laboratory of Heart Development Research of Hunan Normal University for providing the experimental platform, and to Huaping Xie from Hunan International Joint Laboratory of Animal Intestinal Ecology and Health, Laboratory of Animal Nutrition and Human Health, College of Life Sciences, Hunan Normal University for providing the experimental platform, which provided convenience for some of the experiments in this study. The authors also thank Yan Shi from Guangdong Cardiovascular Institute, Guangdong Provincial People’s Hospital and Guangdong Academy of Medical Sciences for providing reagents and consumables for some experiments in this study.

Conflicts of Interest

The authors declare no conflicts of interest.

Abbreviations

The following abbreviations are used in this manuscript
MOMorpholino
HpfHours post fertilization
WTWild type
WISHWhole-mount in situ hybridization
LPMLateral plate mesoderm
L-RLeft–right
D-loopDextro-looping
N-loopNo looping
L-loopLevo-looping
RT-PCRReverse transcription polymerase chain reaction
CDSCoding sequence
DEGsDifferentially expressed genes
PPIProtein–protein interaction
GOGene Ontology
KEGGKyoto Encyclopedia of Genes and Genomes
SSSomite stage

References

  1. Mercola, M. Left-Right Asymmetry: Nodal Points. J. Cell Sci. 2003, 116, 3251–3257. [Google Scholar] [CrossRef] [PubMed]
  2. Ibañes, M.; Izpisúa Belmonte, J.C. Left-right axis determination. J. Wiley Interdiscip. Rev. Syst. Biol. Med. 2009, 1, 210–219. [Google Scholar] [CrossRef]
  3. Vo, B.T.; Khan, S.A. Expression of nodal and nodal receptors in prostate stem cells and prostate cancer cells: Autocrine effects on cell proliferation and migration. J. Prostate. 2011, 71, 1084–1096. [Google Scholar] [CrossRef] [PubMed]
  4. Montague, T.G.; Gagnon, J.A.; Schier, A.F. Conserved Regulation of Nodal-Mediated Left-Right Patterning in Zebrafish and Mouse. Development 2018, 145, dev171090. [Google Scholar] [CrossRef] [PubMed]
  5. Blum, M.; Ott, T. Animal Left-Right Asymmetry. Curr. Biol. 2018, 28, R301–R304. [Google Scholar] [CrossRef]
  6. Grimes, D.T.; Patterson, V.L.; Luna-Arvizu, G.; Schottenfeld-Roames, J.; Irons, Z.H.; Burdine, R.D. Left-Right Asymmetric Heart Jogging Increases the Robustness of Dextral Heart Looping in Zebrafish. Dev. Biol. 2020, 459, 79–86. [Google Scholar] [CrossRef]
  7. Long, S.; Ahmad, N.; Rebagliati, M. The Zebrafish Nodal-Related Gene Southpaw is Required for Visceral and Diencephalic Left-Right Asymmetry. Development 2003, 130, 2303–2316. [Google Scholar] [CrossRef]
  8. de Campos-Baptista, M.I.M.; Holtzman, N.G.; Yelon, D.; Schier, A.F. Nodal Signaling Promotes the Speed and Directional Movement of Cardiomyocytes in Zebrafish. Dev. Dyn. 2008, 237, 3624–3633. [Google Scholar] [CrossRef]
  9. Lahvic, J.L.; Ji, Y.; Marin, P.; Zuflacht, J.P.; Springel, M.W.; Wosen, J.E.; Davis, L.; Hutson, L.D.; Amack, J.D.; Marvin, M.J. Small Heat Shock Proteins are Necessary for Heart Migration and Laterality Determination in Zebrafish. Dev. Biol. 2013, 384, 166–180. [Google Scholar] [CrossRef]
  10. Lenhart, K.F.; Lin, S.-Y.; Titus, T.A.; Postlethwait, J.H.; Burdine, R.D. Two Additional Midline Barriers Function with Midline Lefty1 Expression to Maintain Asymmetric Nodal Signaling during Left-Right Axis Specification in Zebrafish. Development 2011, 138, 4405–4410. [Google Scholar] [CrossRef]
  11. Meno, C.; Shimono, A.; Saijoh, Y.; Yashiro, K.; Mochida, K.; Ohishi, S.; Noji, S.; Kondoh, H.; Hamada, H. Lefty-1 Is Required for Left-Right Determination as a Regulator of Lefty-2 and Nodal. Cell 1998, 94, 287–297. [Google Scholar] [CrossRef] [PubMed]
  12. Meno, C.; Gritsman, K.; Ohishi, S.; Ohfuji, Y.; Heckscher, E.; Mochida, K.; Shimono, A.; Kondoh, H.; Talbot, W.S.; Robertson, E.J.; et al. Mouse Lefty2 and Zebrafish Antivin Are Feedback Inhibitors of Nodal Signaling during Vertebrate Gastrulation. Mol. Cell 1999, 4, 287–298. [Google Scholar] [CrossRef]
  13. Ruiz-Lozano, P.; Ryan, A.K.; Izpisua-Belmonte, J.C. Left-Right Determination. Trends Cardiovasc. Med. 2000, 10, 258–262. [Google Scholar] [CrossRef]
  14. Mercola, M.; Levin, M. Left-Right Asymmetry Determination in Vertebrates. Annu. Rev. Cell Dev. Biol. 2001, 17, 779–805. [Google Scholar] [CrossRef]
  15. Männer, J. On Rotation, Torsion, Lateralization, and Handedness of the Embryonic Heart Loop: New Insights from a Simulation Model for the Heart Loop of Chick Embryos. Anat. Rec. A Discov. Mol. Cell Evol. Biol. 2004, 278, 481–492. [Google Scholar] [CrossRef] [PubMed]
  16. Debrincat, M.A.; Zhang, J.-G.; Willson, T.A.; Silke, J.; Connolly, L.M.; Simpson, R.J.; Alexander, W.S.; Nicola, N.A.; Kile, B.T.; Hilton, D.J. Ankyrin Repeat and Suppressors of Cytokine Signaling Box Protein Asb-9 Targets Creatine Kinase B for Degradation. J. Biol. Chem. 2007, 282, 4728–4737. [Google Scholar] [CrossRef]
  17. Liu, P.; Verhaar, A.P.; Peppelenbosch, M.P. Signaling Size: Ankyrin and SOCS Box-Containing ASB E3 Ligases in Action. Trends Biochem. Sci. 2019, 44, 64–74. [Google Scholar] [CrossRef]
  18. Boengler, K.; Pipp, F.; Fernandez, B.; Richter, A.; Schaper, W.; Deindl, E. The Ankyrin Repeat Containing SOCS Box Protein 5: A Novel Protein Associated with Arteriogenesis. Biochem. Biophys. Res. Commun. 2003, 302, 17–22. [Google Scholar] [CrossRef] [PubMed]
  19. Cai, W.; Wang, Y.; Luo, Y.; Gao, L.; Zhang, J.; Jiang, Z.; Fan, X.; Li, F.; Xie, Y.; Wu, X.; et al. Asb5a/Asb5b Double Knockout Affects Zebrafish Cardiac Contractile Function. Int. J. Mol. Sci. 2023, 24, 16364. [Google Scholar] [CrossRef]
  20. Kamachi, Y.; Kawahara, A. CRISPR-Cas9-Mediated Genome Modifications in Zebrafish. Methods Mol. Biol. 2023, 2637, 313–324. [Google Scholar] [CrossRef]
  21. Daniel, J.G.; Yu, X.; Ferguson, A.C.; Shavit, J.A. CRISPR/Cas9-Mediated Genome Editing in Zebrafish. Methods Mol. Biol. 2023, 2631, 371–380. [Google Scholar] [CrossRef]
  22. Bill, B.R.; Petzold, A.M.; Clark, K.J.; Schimmenti, L.A.; Ekker, S.C. A Primer for Morpholino Use in Zebrafish. Zebrafish 2009, 6, 69–77. [Google Scholar] [CrossRef] [PubMed]
  23. Bedell, V.M.; Westcot, S.E.; Ekker, S.C. Lessons from Morpholino-Based Screening in Zebrafish. Brief. Funct. Genomics 2011, 10, 181–188. [Google Scholar] [CrossRef]
  24. Zhao, G.; Zhu, Y.; Hu, J.; Gao, M.; Hong, Y. L-Selenomethionine Induces Zebrafish Embryo Cardiovascular Defects via down-Regulating Expression of Lrp2b. Chemosphere 2022, 290, 133351. [Google Scholar] [CrossRef] [PubMed]
  25. Ocorr, K.; Fink, M.; Cammarato, A.; Bernstein, S.; Bodmer, R. Semi-Automated Optical Heartbeat Analysis of Small Hearts. J. Vis. Exp. 2009, 31, 1435. [Google Scholar] [CrossRef]
  26. Zhang, Y.; Peng, R.; Wang, H. Identification and Genetic Analysis of Rare Variants in Myosin Family Genes in 412 Han Chinese Congenital Heart Disease Patients. Mol. Genet. Genomic Med. 2022, 10, e2041. [Google Scholar] [CrossRef]
  27. Gong, J.; Chai, L.; Xu, G.; Ni, Y.; Liu, D. The Expression of Natriuretic Peptide Receptors in Developing Zebrafish Embryos. Gene Expr. Patterns 2018, 29, 65–71. [Google Scholar] [CrossRef]
  28. Park, J.-S.; Kim, H.-S.; Kim, J.-D.; Seo, J.; Chung, K.-S.; Lee, H.-S.; Huh, T.-L.; Jo, I.; Kim, Y.-O. Isolation of a Ventricle-Specific Promoter for the Zebrafish Ventricular Myosin Heavy Chain (Vmhc) Gene and Its Regulation by GATA Factors during Embryonic Heart Development. Dev. Dyn. 2009, 238, 1574–1581. [Google Scholar] [CrossRef]
  29. Jin, D.; Ni, T.T.; Hou, J.; Rellinger, E.; Zhong, T.P. Promoter Analysis of Ventricular Myosin Heavy Chain (Vmhc) in Zebrafish Embryos. Dev. Dyn. 2009, 238, 1760–1767. [Google Scholar] [CrossRef]
  30. Zhu, Y.; Song, F.; Gu, J.; Wu, L.; Wu, W.; Ji, G. Paroxetine Induced Larva Zebrafish Cardiotoxicity through Inflammation Response. Ecotoxicol. Environ. Saf. 2023, 260, 115096. [Google Scholar] [CrossRef]
  31. Fujii, T.; Tsunesumi, S.; Yamaguchi, K.; Watanabe, S.; Furukawa, Y. Smyd3 Is Required for the Development of Cardiac and Skeletal Muscle in Zebrafish. PLoS ONE 2011, 6, e23491. [Google Scholar] [CrossRef] [PubMed]
  32. Pulina, M.V.; Hou, S.-Y.; Mittal, A.; Julich, D.; Whittaker, C.A.; Holley, S.A.; Hynes, R.O.; Astrof, S. Essential Roles of Fibronectin in the Development of the Left-Right Embryonic Body Plan. Dev. Biol. 2011, 354, 208–220. [Google Scholar] [CrossRef] [PubMed]
  33. Bonetti, M.; Paardekooper Overman, J.; Tessadori, F.; Noël, E.; Bakkers, J.; den Hertog, J. Noonan and LEOPARD Syndrome Shp2 Variants Induce Heart Displacement Defects in Zebrafish. Development 2014, 141, 1961–1970. [Google Scholar] [CrossRef]
  34. Toyoizumi, R.; Kobayashi, T.; Kikukawa, A.; Oba, J.; Takeuchi, S. Adrenergic Neurotransmitters and Calcium Ionophore-Induced Situs Inversus Viscerum in Xenopus Laevis Embryos. Dev. Growth Differ. 1997, 39, 505–514. [Google Scholar] [CrossRef]
  35. Wu, M.; Xu, Y.; Li, J.; Lian, J.; Chen, Q.; Meng, P.; Lu, T.; Xie, H.; Zhang, W.; Xu, J.; et al. Genetic and Epigenetic Orchestration of Gfi1aa-Lsd1-Cebpa in Zebrafish Neutrophil Development. Development 2021, 148, dev199516. [Google Scholar] [CrossRef] [PubMed]
  36. Al Qaryoute, A.; Fallatah, W.; Dhinoja, S.; Raman, R.; Jagadeeswaran, P. Role of microRNAs and Their Downstream Target Transcription Factors in Zebrafish Thrombopoiesis. Sci. Rep. 2023, 13, 16066. [Google Scholar] [CrossRef]
  37. Ocaña, O.H.; Coskun, H.; Minguillón, C.; Murawala, P.; Tanaka, E.M.; Galcerán, J.; Muñoz-Chápuli, R.; Nieto, M.A. A right-handed signalling pathway drives heart looping in vertebrates. J. Nature. 2017, 549, 86–90. [Google Scholar] [CrossRef]
  38. Liu, X.; Zhang, R.; Fatehi, M.; Wang, Y.; Long, W.; Tian, R.; Deng, X.; Weng, Z.; Xu, Q.; Light, P.E.; et al. Regulation of PKD2 Channel Function by TACAN. J. Physiol. 2023, 601, 83–98. [Google Scholar] [CrossRef]
  39. Schottenfeld, J.; Sullivan-Brown, J.; Burdine, R.D. Zebrafish Curly up Encodes a Pkd2 Ortholog That Restricts Left-Side-Specific Expression of Southpaw. Development 2007, 134, 1605–1615. [Google Scholar] [CrossRef]
  40. Little, R.B.; Norris, D.P. Right, left and cilia: How asymmetry is established. Semin. Cell Dev. Biol. 2021, 110, 11–18. [Google Scholar] [CrossRef]
  41. Veerkamp, J.; Rudolph, F.; Cseresnyes, Z.; Priller, F.; Otten, C.; Renz, M.; Schaefer, L.; Abdelilah-Seyfried, S. Unilateral Dampening of Bmp Activity by Nodal Generates Cardiac Left-Right Asymmetry. Dev. Cell 2013, 24, 660–667. [Google Scholar] [CrossRef]
  42. Liu, Z.; Liu, F. Cautious Use of Fli1a:EGFP Transgenic Zebrafish in Vascular Research. Biochem. Biophys. Res. Commun. 2012, 427, 223–226. [Google Scholar] [CrossRef] [PubMed]
  43. Carra, S.; Gaudenzi, G.; Dicitore, A.; Cantone, M.C.; Plebani, A.; Saronni, D.; Zappavigna, S.; Caraglia, M.; Candeo, A.; Bassi, A.; et al. Modeling Lung Carcinoids with Zebrafish Tumor Xenograft. Int. J. Mol. Sci. 2022, 23, 8126. [Google Scholar] [CrossRef]
  44. Hsu, J.J.; Vedula, V.; Baek, K.I.; Chen, C.; Chen, J.; Chou, M.I.; Lam, J.; Subhedar, S.; Wang, J.; Ding, Y.; et al. Contractile and Hemodynamic Forces Coordinate Notch1b-Mediated Outflow Tract Valve Formation. JCI Insight 2019, 5, e124460. [Google Scholar] [CrossRef] [PubMed]
  45. Donat, S.; Lourenço, M.; Paolini, A.; Otten, C.; Renz, M.; Abdelilah-Seyfried, S. Heg1 and Ccm1/2 Proteins Control Endocardial Mechanosensitivity during Zebrafish Valvulogenesis. eLife 2018, 7, e28939. [Google Scholar] [CrossRef]
  46. Chen, Y.; Li, J.; Zhou, Q.; Liu, Z.; Li, Q. Hexavalent Chromium Amplifies the Developmental Toxicity of Graphene Oxide during Zebrafish Embryogenesis. Ecotoxicol. Environ. Saf. 2021, 208, 111487. [Google Scholar] [CrossRef]
  47. Ulloa, P.E.; Rincón, G.; Islas-Trejo, A.; Araneda, C.; Iturra, P.; Neira, R.; Medrano, J.F. RNA Sequencing to Study Gene Expression and SNP Variations Associated with Growth in Zebrafish Fed a Plant Protein-Based Diet. Mar. Biotechnol. 2015, 17, 353–363. [Google Scholar] [CrossRef]
  48. Li, J.; Gao, F.; Zhao, Y.; He, L.; Huang, Y.; Yang, X.; Zhou, Y.; Yu, L.; Zhao, Q.; Dong, X. Zebrafish Znfl1s Regulate Left-Right Asymmetry Patterning through Controlling the Expression of Fgfr1a. J. Cell Physiol. 2019, 234, 1987–1995. [Google Scholar] [CrossRef] [PubMed]
  49. Ji, C.; Guo, X.; Dong, X.; Ren, J.; Zu, Y.; Li, W.; Zhang, Q. Notch1a Can Widely Mediate Innate Immune Responses in Zebrafish Larvae Infected with Vibrio Parahaemolyticus. Fish. Shellfish. Immunol. 2019, 92, 680–689. [Google Scholar] [CrossRef]
  50. Seiliez, I.; Thisse, B.; Thisse, C. FoxA3 and Goosecoid Promote Anterior Neural Fate through Inhibition of Wnt8a Activity before the Onset of Gastrulation. Dev. Biol. 2006, 290, 152–163. [Google Scholar] [CrossRef]
  51. Wu, Y.; Li, W.; Yuan, M.; Liu, X. The Synthetic Pyrethroid Deltamethrin Impairs Zebrafish (Danio Rerio) Swim Bladder Development. Sci. Total Environ. 2020, 701, 134870. [Google Scholar] [CrossRef] [PubMed]
  52. Thomas, T.; Yamagishi, H.; Overbeek, P.A.; Olson, E.N.; Srivastava, D. The bHLH Factors, dHAND and eHAND, Specify Pulmonary and Systemic Cardiac Ventricles Independent of Left-Right Sidedness. Dev. Biol. 1998, 196, 228–236. [Google Scholar] [CrossRef] [PubMed]
  53. Lin, X.; Xu, X. Distinct Functions of Wnt/Beta-Catenin Signaling in KV Development and Cardiac Asymmetry. Development 2009, 136, 207–217. [Google Scholar] [CrossRef]
  54. Sukumaran, S.; Perkins, B.D. Early Defects in Photoreceptor Outer Segment Morphogenesis in Zebrafish Ift57, Ift88 and Ift172 Intraflagellar Transport Mutants. Vision. Res. 2009, 49, 479–489. [Google Scholar] [CrossRef]
  55. Lunt, S.C.; Haynes, T.; Perkins, B.D. Zebrafish Ift57, Ift88, and Ift172 Intraflagellar Transport Mutants Disrupt Cilia but Do Not Affect Hedgehog Signaling. Dev. Dyn. 2009, 238, 1744–1759. [Google Scholar] [CrossRef] [PubMed]
  56. Pelliccia, J.L.; Jindal, G.A.; Burdine, R.D. Gdf3 Is Required for Robust Nodal Signaling during Germ Layer Formation and Left-Right Patterning. eLife 2017, 6, e28635. [Google Scholar] [CrossRef]
  57. Bisgrove, B.W.; Su, Y.-C.; Yost, H.J. Maternal Gdf3 Is an Obligatory Cofactor in Nodal Signaling for Embryonic Axis Formation in Zebrafish. eLife 2017, 6, e28534. [Google Scholar] [CrossRef]
  58. Kelly, G.M.; Greenstein, P.; Erezyilmaz, D.F.; Moon, R.T. Zebrafish Wnt8 and Wnt8b Share a Common Activity but Are Involved in Distinct Developmental Pathways. Development 1995, 121, 1787–1799. [Google Scholar] [CrossRef]
  59. Bussmann, J.; Bakkers, J.; Schulte-Merker, S. Early Endocardial Morphogenesis Requires Scl/Tal1. PLoS Genet. 2007, 3, e140. [Google Scholar] [CrossRef]
  60. Zhang, Q.; Xu, H.; Zhao, W.; Zheng, J.; Sun, L.; Luo, C. Zygotic Vsx1 Plays a Key Role in Defining V2a Interneuron Sub-Lineage by Directly Repressing Tal1 Transcription in Zebrafish. Int. J. Mol. Sci. 2020, 21, 3600. [Google Scholar] [CrossRef]
  61. Harrington, J.K.; Sorabella, R.; Tercek, A.; Isler, J.R.; Targoff, K.L. Nkx2.5 Is Essential to Establish Normal Heart Rate Variability in the Zebrafish Embryo. Am. J. Physiol. Regul. Integr. Comp. Physiol. 2017, 313, R265–R271. [Google Scholar] [CrossRef] [PubMed]
  62. Tu, C.-T.; Yang, T.-C.; Tsai, H.-J. Nkx2.7 and Nkx2.5 Function Redundantly and Are Required for Cardiac Morphogenesis of Zebrafish Embryos. PLoS ONE 2009, 4, e4249. [Google Scholar] [CrossRef]
  63. Roussigne, M.; Blader, P.; Wilson, S.W. Breaking Symmetry: The Zebrafish as a Model for Understanding Left-Right Asymmetry in the Developing Brain. Dev. Neurobiol. 2012, 72, 269–281. [Google Scholar] [CrossRef]
  64. Guerra, A.; Germano, R.F.; Stone, O.; Arnaout, R.; Guenther, S.; Ahuja, S.; Uribe, V.; Vanhollebeke, B.; Stainier, D.Y.; Reischauer, S. Distinct Myocardial Lineages Break Atrial Symmetry during Cardiogenesis in Zebrafish. eLife 2018, 15, e32833. [Google Scholar] [CrossRef] [PubMed]
  65. Szklarczyk, D.; Gable, A.L.; Lyon, D.; Junge, A.; Wyder, S.; Huerta-Cepas, J.; Simonovic, M.; Doncheva, N.T.; Morris, J.H.; Bork, P.; et al. STRING V11: Protein-Protein Association Networks with Increased Coverage, Supporting Functional Discovery in Genome-Wide Experimental Datasets. Nucleic Acids Res. 2019, 47, D607–D613. [Google Scholar] [CrossRef]
  66. Szklarczyk, D.; Kirsch, R.; Koutrouli, M.; Nastou, K.; Mehryary, F.; Hachilif, R.; Gable, A.L.; Fang, T.; Doncheva, N.T.; Pyysalo, S.; et al. The STRING Database in 2023: Protein-Protein Association Networks and Functional Enrichment Analyses for Any Sequenced Genome of Interest. Nucleic Acids Res. 2023, 51, D638–D646. [Google Scholar] [CrossRef] [PubMed]
  67. Doncheva, N.T.; Morris, J.H.; Gorodkin, J.; Jensen, L.J. Cytoscape StringApp: Network Analysis and Visualization of Proteomics Data. J. Proteome Res. 2019, 18, 623–632. [Google Scholar] [CrossRef]
  68. Shannon, P.; Markiel, A.; Ozier, O.; Baliga, N.S.; Wang, J.T.; Ramage, D.; Amin, N.; Schwikowski, B.; Ideker, T. Cytoscape: A Software Environment for Integrated Models of Biomolecular Interaction Networks. Genome Res. 2003, 13, 2498–2504. [Google Scholar] [CrossRef]
  69. Smith, K.A.; Uribe, V. Getting to the Heart of Left-Right Asymmetry: Contributions from the Zebrafish Model. J. Cardiovasc. Dev. Dis. 2021, 8, 64. [Google Scholar] [CrossRef]
  70. Malaviya, R.; Zhou, Z.; Raymond, H.; Wertheimer, J.; Jones, B.; Bunting, R.; Wilkinson, P.; Madireddy, L.; Hall, L.; Ryan, M.; et al. Repeated exposure of house dust mite induces progressive airway inflammation in mice: Differential roles of CCL17 and IL-13. Pharmacol Res Perspect. 2021, 9, e00770–e00783. [Google Scholar] [CrossRef]
  71. Kaestner, K.H.; Hiemisch, H.; Schütz, G. Targeted disruption of the gene encoding hepatocyte nuclear factor 3gamma results in reduced transcription of hepatocyte-specific genes. Mol Cell Biol 1998, 18, 4245–4251. [Google Scholar] [CrossRef] [PubMed]
  72. Castroviejo, N.; Ocaña, O.H.; Rago, L.; Coskun, H.; Arcas, A.; Galcerán, J.; Nieto, M.A. Reply to: Zebrafish Prrx1a Mutants Have Normal Hearts. Nature 2020, 585, E17–E19. [Google Scholar] [CrossRef] [PubMed]
  73. Tessadori, F.; de Bakker, D.E.M.; Barske, L.; Nelson, N.; Algra, H.A.; Willekers, S.; Nichols, J.T.; Crump, J.G.; Bakkers, J. Zebrafish Prrx1a Mutants Have Normal Hearts. Nature 2020, 585, E14–E16. [Google Scholar] [CrossRef] [PubMed]
  74. McCulley, D.J.; Kang, J.O.; Martin, J.F.; Black, B.L. BMP4 Is Required in the Anterior Heart Field and Its Derivatives for Endocardial Cushion Remodeling, Outflow Tract Septation, and Semilunar Valve Development. Dev. Dyn. 2008, 237, 3200–3209. [Google Scholar] [CrossRef]
  75. Milan, D.J.; Giokas, A.C.; Serluca, F.C.; Peterson, R.T.; MacRae, C.A. Notch1b and Neuregulin Are Required for Specification of Central Cardiac Conduction Tissue. Development 2006, 133, 1125–1132. [Google Scholar] [CrossRef]
  76. Chung, Y.S.; Zhang, W.J.; Arentson, E.; Kingsley, P.D.; Palis, J.; Choi, K. Lineage Analysis of the Hemangioblast as Defined by FLK1 and SCL Expression. Development 2002, 129, 5511–5520. [Google Scholar] [CrossRef]
Figure 1. The impact of asb5a/asb5b deficiency on L-R asymmetry in cardiac development. (AF) Representative images of the pericardial cavity in various groups at 48 hpf during embryonic development; scale bar = 200 µm (side view). (A′F′) Representative images of heart positioning in different zebrafish groups at 48 hpf under the myl7:EGFP background; scale bar = 100 µm (belly up view); (A″F″) Magnified images of the atria and ventricles in various zebrafish groups at 48 hpf, also under the myl7:EGFP background, scale bar = 50 µm (belly up view). The red triangular arrows indicate areas of enlargement in the cardiac pericardial cavity. BF: bright field; GF: green fluorescence; 10X: field of view under a 10× microscope; 20X: field of view under a 20× microscope; red E: eyes; red V: ventricle; yellow A: atrium; D-loop: dextral looping; N-loop: no looping; L-loop: levo-looping.
Ijms 26 02765 g001
Figure 2. The morphological changes following the inactivation of asb5a/asb5b. The 10 s M-mode screenshot clearly displays the diastolic and systolic shapes of the ventricle and atrium. (AF) Schematic diagrams of cardiac looping during diastole of the ventricle in various groups of zebrafish at 48 hpf. (A′F′) Schematic diagrams of cardiac looping during ventricular systole in these same groups of zebrafish at 48 hpf. 20X: field of view under a 20× microscope; red V: ventricle; yellow A: atrium; D-loop: dextral looping; N-loop: no looping; L-loop: levo-looping.
Ijms 26 02765 g002
Figure 3. WISH analysis of heart looping at 48 hpf in the asb5-deficiency group, utilizing myl7 and nppa probes. (AF) Schematic diagrams of heart positions marked with myl7 probes in different groups at 48 hpf. (A′F′) Enlarged views of these heart positions as indicated by myl7 probes. (A″F″) Schematic diagrams of heart positions marked with nppa probes in various groups at 48 hpf. (A′′′F′′′) present enlarged views of these positions as indicated by nppa probes. Scale bar = 100 µm (belly up view). red E: eyes; white V: ventricle; red A: atrium; D-loop: dextral looping; N-loop: no looping; L-loop: levo-looping.
Ijms 26 02765 g003
Figure 4. WISH results using vmhc and amhc probes at 48 hpf in zebrafish embryos. (AF) Schematic representations of ventricular positions labeled by the vmhc probe across different groups at 48 hpf. (A′F′) Enlarged images of ventricular tissues labeled by the vmhc probe in these groups. (A″F″) Schematic representation of the atrial positions labeled by the amhc probe across various groups at 48 hpf. (A′′′F′′′) Enlarged images of atrial tissues labeled by the amhc probe in these groups. red E: eyes; white V: ventricle; red A: atrium; Normal: Normal position; Middle: Middle position; Reverse: Reverse position; Scale bar = 100 µm (belly up view).
Ijms 26 02765 g004
Figure 5. Rescue experiments conducted on the asb5-deficiency group marked by the myl7 probe in embryos at 48 hpf. (AC) Injection of asb5a-mRNA alone did not rescue the abnormal looping phenotype. (DF) Injection of asb5b-mRNA alone also failed to rescue the abnormal phenotype. Images (GI) show that the simultaneous injection of asb5a and asb5b-mRNA effectively rescued the phenotype in the asb5-deficiency group. Images (A′I′) present magnified images of the heart, marked by the myl7 probe, from various groups of embryos at 48 hpf. red E: eyes; white V: ventricle; red A: atrium; D-loop: dextral looping; N-loop: no looping; L-loop: levo-looping; Scale bar = 100 µm (belly up view).
Ijms 26 02765 g005
Figure 6. Statistical chart of rescue experiments conducted across various groups. WT: Wild-type control group. asb5a-/-: asb5a knockout homozygous group. asb5b-MO: asb5b knockdown group. asb5-deficiency: Simultaneous knockdown of asb5b group in asb5a-/- homozygous embryos (loss of asb5 group). asb5-deficiency + asb5a-mRNA: injection of asb5a-mRNA alone in the asb5-deficiency group. asb5-deficiency + asb5b-mRNA: injection of asb5b-mRNA alone in the asb5-deficiency group. asb5-deficiency + asb5a-mRNA + asb5b-mRNA: Simultaneous injection of asb5a-mRNA and asb5b-mRNA in the asb5-deficiency group (double rescue group). D-loop: dextral looping; N-loop: no looping; L-loop: levo-looping.
Ijms 26 02765 g006
Figure 7. The impact of asb5 loss on the transcriptome of 48 hpf zebrafish embryos. (A) The scatter plot displays expression differences for differentially expressed genes (DEGs), with blue dots indicating downregulated genes, red dots representing upregulated genes, and gray dots denoting genes with no significant expression differences across conditions (significance threshold: |log2FC| > 2.0 and p < 0.05). (B) The statistical chart summarizes expression differences for DEGs, where the red box highlights upregulated genes and the blue box indicates downregulated genes. (C) The bubble chart visualizes GO enrichment analysis for DEGs, with the vertical axis representing GO terms and the horizontal axis indicating the Rich factor, whereby a larger Rich factor signifies a higher degree of enrichment. The size of the bubbles corresponds to the number of genes/transcripts associated with each GO term, while the color of the dots corresponds to various ranges of Padjust. (D) The bubble chart depicts a KEGG pathway enrichment analysis for DEGs. The vertical axis lists the pathway names, while the horizontal axis indicates the Rich factor, where a larger Rich factor denotes a higher degree of enrichment. The size of the bubbles represents the number of genes in each pathway, and the color of the bubbles corresponds to varying ranges of Padjust.
Ijms 26 02765 g007
Figure 8. Summary chart of RNA-Seq data for the regulation of asymmetrically developing genes in 48 hpf zebrafish embryos. Heatmap of DEGs, where rows represent genes and columns represent samples. The red and blue colors indicate high and low expression levels, respectively, with darker colors denoting more pronounced significant differences.
Ijms 26 02765 g008
Figure 9. WISH results for genes associated with L-R asymmetric development in 48 hpf zebrafish embryos. Images (AA″) illustrate the WISH expression of fli1a in WT, asb5-deficient, and asb5-deficient +asb5a/asb5b-mRNA groups (side view). Images (BB″) display the WISH expression of acta1b across the different groups (side view). Images (CC″) show the WISH expression of meis2a in various groups (side view). Images (DD″) present the WISH expression of tal1 in different groups (side view). Images (EE″) display the WISH expression of hand2 across various groups (side view). Images (FF″) depict the WISH expression of hand2 in the multiple groups (abdominal view). Images (GG″) show the WISH expression of hand2 in different groups (back view). red E: eyes; green H: head; orange S: skeletal muscle; purple T: tail; yellow HV: heart valves; white B: back; Red scale bar = 500 µm; Green scale bar = 250 µm.
Ijms 26 02765 g009
Figure 10. WISH results for other genes related to L-R asymmetric development in zebrafish embryos at 48 hpf across various groups. Images (AA″) illustrate the WISH expression of has2 in WT, asb5-deficiency group, and asb5-deficiency group + asb5a/asb5b-mRNA group (back view). Images (BB″) show the WISH expression of foxa3 across different groups (back view). Images (CC″) depict the WISH expression of notch1b in various groups (abdominal view). Images (DD″) present the WISH expression of prrx1a in the same groups (abdominal view). 22 SS: 22 somite stage; green H: head; white B: back; red E: eyes; yellow HV: heart valves; Red scale bar = 500 µm; Green scale bar = 250 µm.
Ijms 26 02765 g010
Figure 11. WISH results utilizing lefty1 and lefty2 probes in embryos at 12 hpf across various groups. Images (AE) depict schematic diagrams illustrating lefty1 expression in the LPM of the embryos. Images (A′E′) show corresponding schematic diagrams for lefty2 expression in the LPM of the embryos. green H: head; purple T: tail; LPM: lateral plate mesoderm; red triangular arrow: indicates the region where lefty2 expression is downregulated following double rescue; Scale bar = 500 µm (back up view).
Ijms 26 02765 g011
Figure 12. WISH results in WT and the asb5-deficiency group zebrafish embryos at 22 SS. (AA′) The schematic diagram illustrates the expression of lefty1 in the LPM of the embryos. (BB′′′) This diagram depicts spaw expression in proximity to the LPM. In the WT group, spaw is localized on the left side of the LPM, whereas the asb5-deficiency group displays three distinct expression patterns: left-side expression, bilateral expression, and absence of expression. (CC′′′′) The schematic diagram shows lefty2 expression near the LPM in embryos. In the WT group, lefty2 is expressed on the left side of the LPM, while the asb5-deficiency group reveals four expression patterns: left-side expression, bilateral expression, reverse expression, and no expression. LPM: lateral plate mesoderm; Red triangular arrow: positive expression region; Scale bar = 500 µm (back up view).
Ijms 26 02765 g012
Figure 13. PPI regulatory network diagram. The PPI network comprises three modules, consisting of a total of 12 nodes and 18 edges.
Ijms 26 02765 g013
Figure 14. This molecular regulatory network diagram illustrates the influence of asb5a/asb5b on the L-R asymmetric development of the heart in zebrafish. V: ventricle; A: atrium; D-loop: dextral looping; N-loop: no looping; L-loop: levo-looping.
Ijms 26 02765 g014
Disclaimer/Publisher’s Note: The statements, opinions and data contained in all publications are solely those of the individual author(s) and contributor(s) and not of MDPI and/or the editor(s). MDPI and/or the editor(s) disclaim responsibility for any injury to people or property resulting from any ideas, methods, instructions or products referred to in the content.

