Article

Identification and Analysis of Cuticular Wax Biosynthesis Related Genes in Salicornia europaea Under NaCl Treatment

1
College of Forestry, Gansu Agricultural University, Lanzhou 730070, China
2
Lanzhou Institute of Husbandry and Pharmaceutical Science, Chinese Academy of Agricultural Sciences, Lanzhou 730050, China
3
College of Plant Protection, Gansu Agricultural University, Lanzhou 730070, China
*
Authors to whom correspondence should be addressed.
Int. J. Mol. Sci. 2025, 26(6), 2632; https://doi.org/10.3390/ijms26062632
Submission received: 7 December 2024 / Revised: 6 March 2025 / Accepted: 9 March 2025 / Published: 14 March 2025
(This article belongs to the Special Issue Transcription Factors in Plant Gene Expression Regulation)

Abstract

:
Salinity is a major environmental factor that adversely affects plant growth and production. Cuticular wax protects plants against external environmental stress. The relationship between cuticular wax biosynthesis and salt tolerance remains unclear in Salicornia europaea. This study examined the cuticle thickness, wax load, morphology, composition, and the expression of cuticular wax biosynthesis gene identification and expression. The results showed that 600 mM NaCl treatment enhanced the cuticle thickness and total wax load; crystal wax structures were also observed after NaCl treatment. The cuticular wax was mainly composed of fatty acids, alcohols, alkenes, and esters. The alcohol class accounted for the largest proportion, with docosanol (C25H54OSi) being the main specific alcohol compound, followed by fatty acids and alkanes. After a sequence database search, six fatty acyl-CoA reductases (FARs), sixteen wax synthase/diacylglycerol acyltransferases (WS/DGATs), three fatty alcohol oxidases (FAOs), five eceriferums (CERs), and eight mid-chain alkanes (MAHs) were identified as the putative wax biosynthesis enzymes. Their expression analysis revealed a differential response to 100 and 600 mM NaCl treatment and reached the highest level at 12 h or 48 h. The genes that were evidently upregulated with higher fold changes under salinity, such as SeFAR1, SeFAR2, and SeFAR3 are implied to synthesize primary alcohols, and SeWSs convert the primary alcohols to wax esters; SeCER1 and SeCER3 are also supposed to catalyze the conversion of aldehydes to alkanes while SeMAH7 catalyze alkanes to secondary alcohols in S. europaea in response to NaCl treatment. This study demonstrated that both the decarbonylation and acyl-reduction wax biosynthesis pathways may not be independent from each other.

1. Introduction

Abiotic stress, such as salinity, is one of the major limiting factors affecting plant growth and development and frequently result in reduced crop productivity worldwide [1]. Salinity affects about 11% of global irrigated lands and could lead to above 50% yield loss in salt-sensitive crop species including all important glycophytic crops [2]. In order to survive under salinity stress, plants have evolved comprehensive physiological, morphological, and genetic mechanisms to mitigate abiotic stress conditions [3,4]. Among the morphological mechanisms, cuticular wax thickening and cutinization of the aerial surfaces provide an essential barrier to protect plants from biotic and abiotic stress [5]. As a major component of the cuticle, cuticular wax is the outermost hydrophobic layer, serving as a barrier to restrain uncontrolled non-stomatal plant gas exchange. It also protects plant tissue from desiccation, extreme temperatures, increased UV radiation, pathogen infections, and mechanical damage, and greatly contributes to plant adaptation to salinity stress [6,7].
It is well-known that plant cuticular waxes are organic solvent-extractable complex mixtures of hydrophobic lipids, consisting mostly of very long-chain saturated fatty acids (VLCFAs) and derivatives. These VLCFAs include fatty acids (with a chain length of C20–C24), primary alcohols (C22–C40), alkanes (C21–C35), aldehydes (C24–C36), ketones (C21–C35), and diketones (C22–C36). There are different structures and compositions of cuticular waxes in different tissues and organs. Many environmental factors also considerably influence the wax composition in the same species [8]. Previous studies of Solanum lycopersicum epidermal wax revealed that the total cuticular wax on the stem had a higher content compared with that of the leaf [9]. Tissue wax analysis of Thellungiella salsuginea suggested that alkanes, ketones, and secondary alcohols (2-alcohols) were the main components in the cuticular wax of the leaves and stems, while alkanes and acids dominated in flowers [10]. Cuticular wax is synthesized on the outer membrane in the plastid of epidermal cells with the de novo C16 and C18 fatty acid synthesis. The C16 and C18 fatty acids serve as central intermediates for wax classes, and they are elongated to wax precursors of VLCFAs with C26 to C34 chains by a repeating reaction process via the fatty acid elongase (FAE) complex. Following elongation, wax components are finally generated by converting long-chain fatty acyl-CoAs via two pathways. The acyl-reduction pathway mediated by proteins encoded by CER4 and WSD1 generates primary alcohols and wax esters. As major wax components found in a wide range of plant species, the biosynthesis of primary alcohols is completed by the acyl-reduction pathway, in which fatty acyl-CoA reductase (FAR) converts fatty acyl-CoAs into primary alcohols. The decarbonylation pathway, involving the gene products of CER3, CER1, and MAH1, produces alkanes, aldehydes, secondary alcohols, and ketones [6]. The identification of these wax-related genes helps understand the production of cuticular wax and its functions.
Salicornia europaea is an annual succulent halophyte belonging to the Amaranthaceae family with extremely reduced leaves that are fairly richly branched, achieves a length of up to 35 cm, and grows luxuriantly under salt marshes (both inland and coastal) [11,12,13]. It is a potential alternative crop for saline water agriculture and the reclamation of saline lands [14]. As one of the highest salt-resistant plant species globally, the growth of this species can be promoted by 50 to 400 mM NaCl and can survive up to 1000 mM NaCl [15,16]. Thus, S. europaea is an exceedingly valuable model plant for researching mechanisms of salt tolerance [17,18]. Recently, several studies have identified wax biosynthesis-related genes in many plant species, for instance, in A. thaliana and Oryza sativa, 8 FARs were identified [19,20], 13 and 11 WSDs were identified in A. thaliana and cotton, respectively [21,22]. Moreover, 29 CERs were discovered in Ziziphus jujube, 34 CERs in Passiflora edulis, and 26 CERs in S. lycopersicum [23,24,25]. It is worth noting that, although some relevant evidence was obtained from several species, knowledge of wax related genes in S. europaea remains unclear. Therefore, the objective of this study was to provide a comprehensive insight into cuticular wax accumulation as well as the compounds and identify genes that are likely to be involved in the biosynthesis of wax in S. europaea under saline conditions.
To elucidate the relationship between cuticular wax biosynthesis and salt tolerance, we measured changes in the composition and accumulation of cuticular wax in S. europaea under NaCl treatment, and the expression patterns of key genes related to the cuticular wax biosynthesis were also identified. This study provides important gene resources for molecular breeding against salt stress.

2. Results

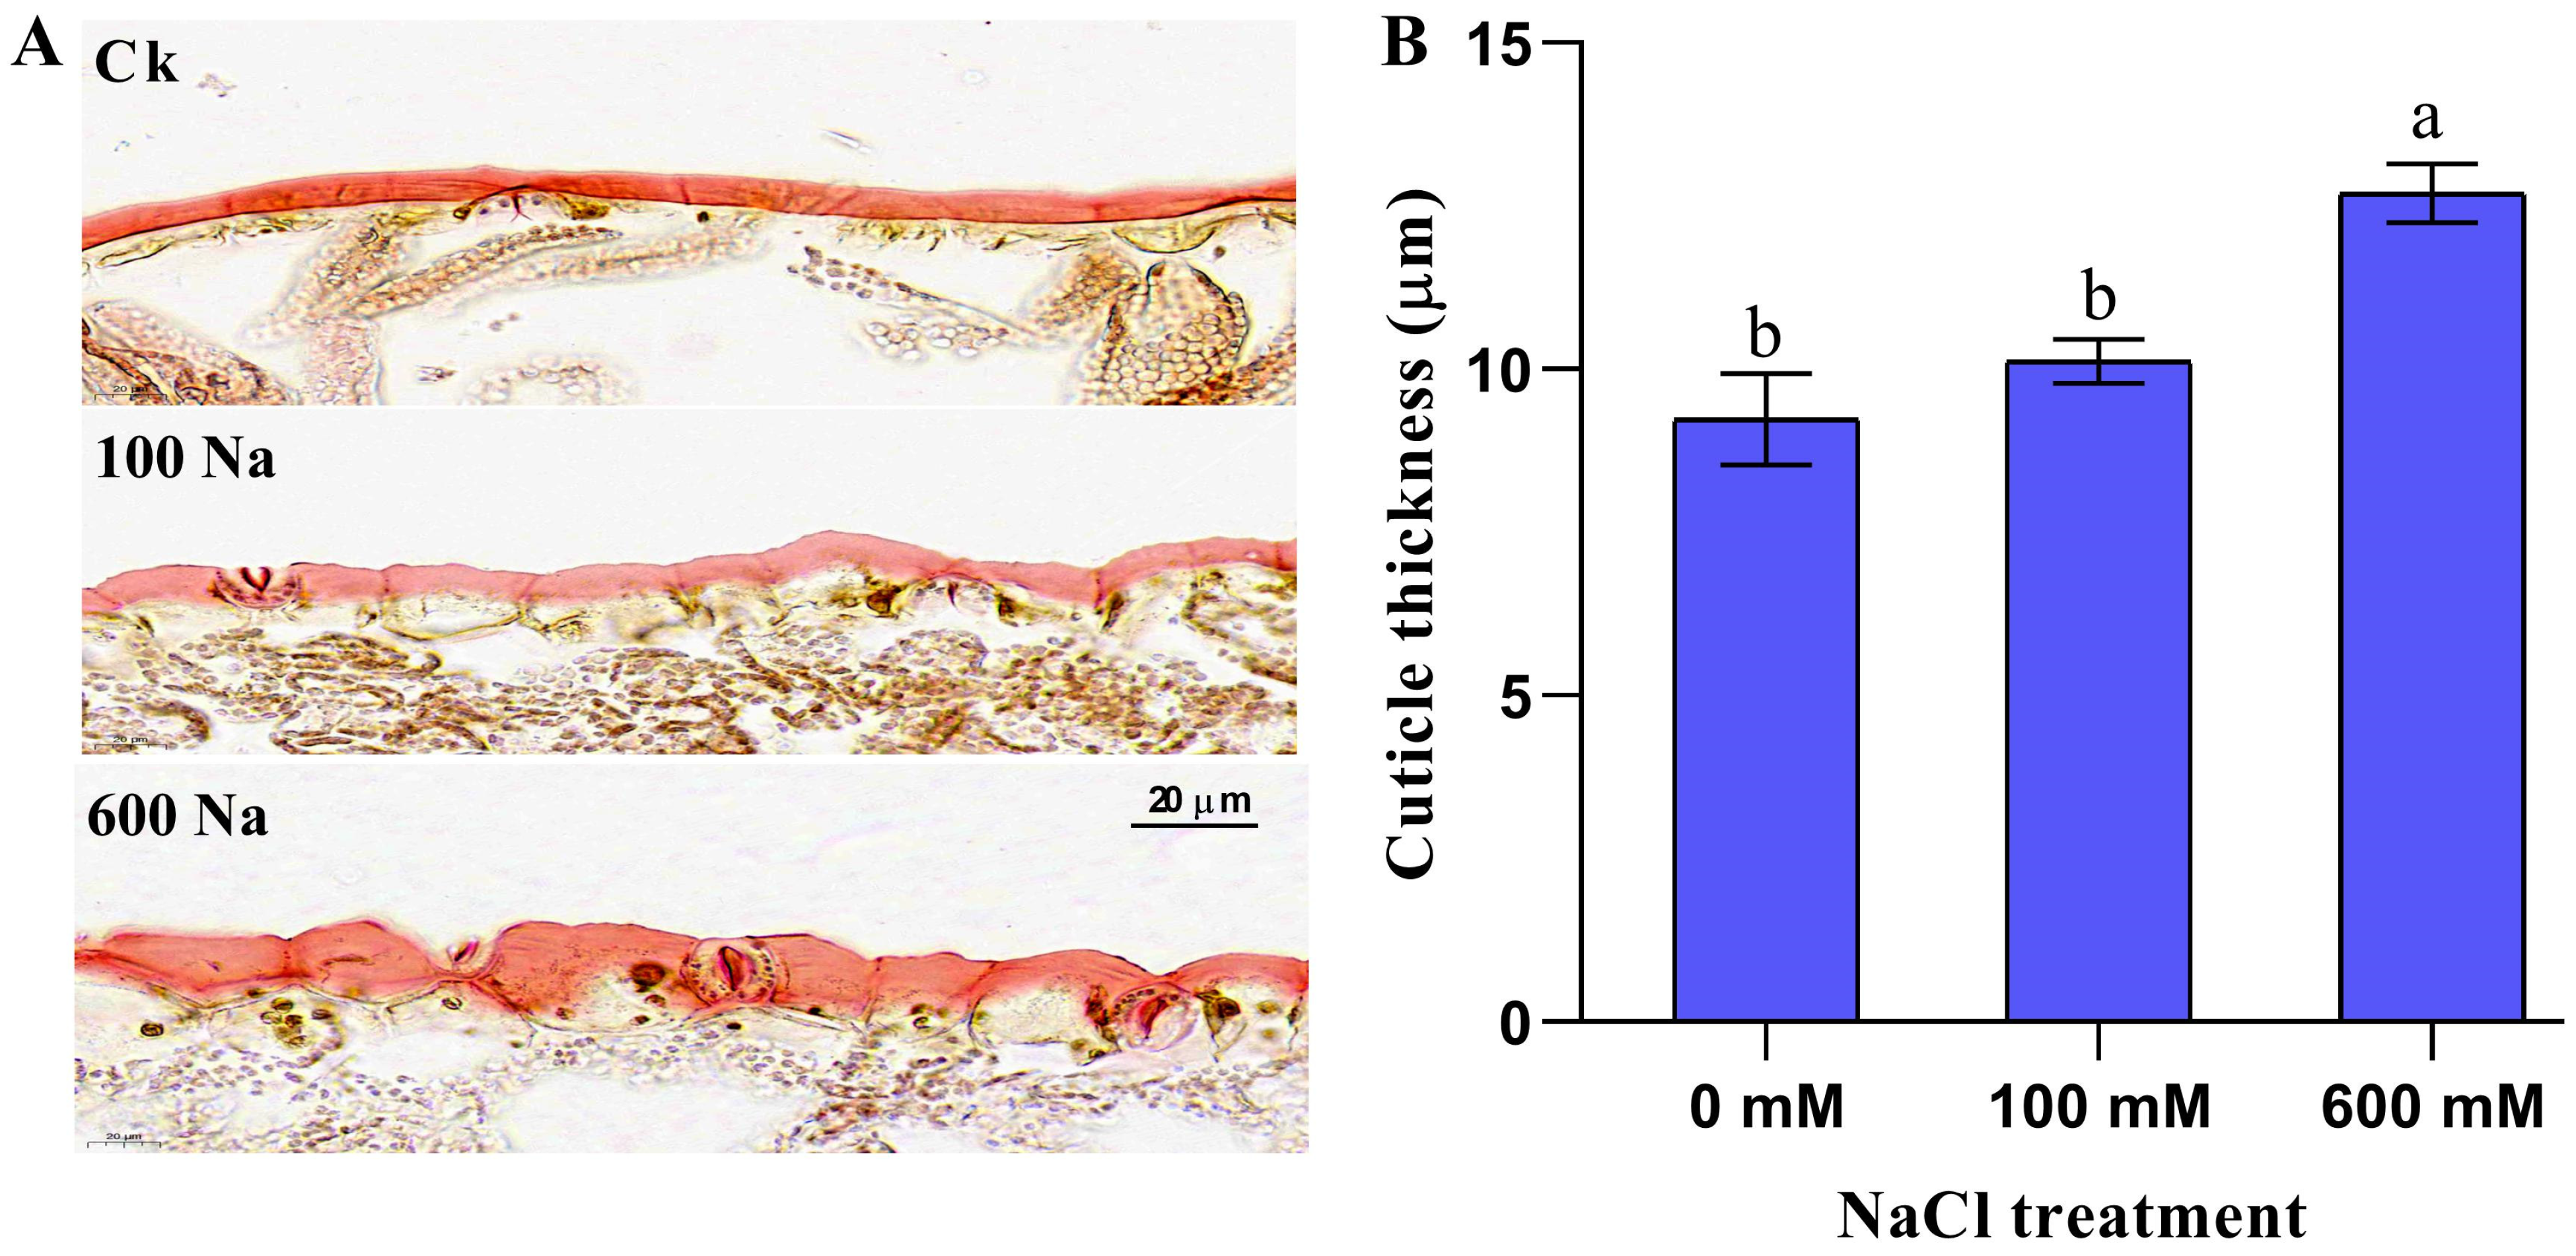
2.1. Shoot Cuticle Thickness Response to NaCl Treatment

To evaluate potential changes in S. europaea cuticle response to NaCl treatment, we used light microscopy to visualize the oil red stained cuticle, and the thickness was measured (Figure 1A). The application of NaCl to S. europaea significantly promoted the cuticle thickness (p < 0.05) with increasing NaCl treatment; 600 mM NaCl had the highest cuticle thickness compared to Ck, which was 37.5% increased (Figure 1B).

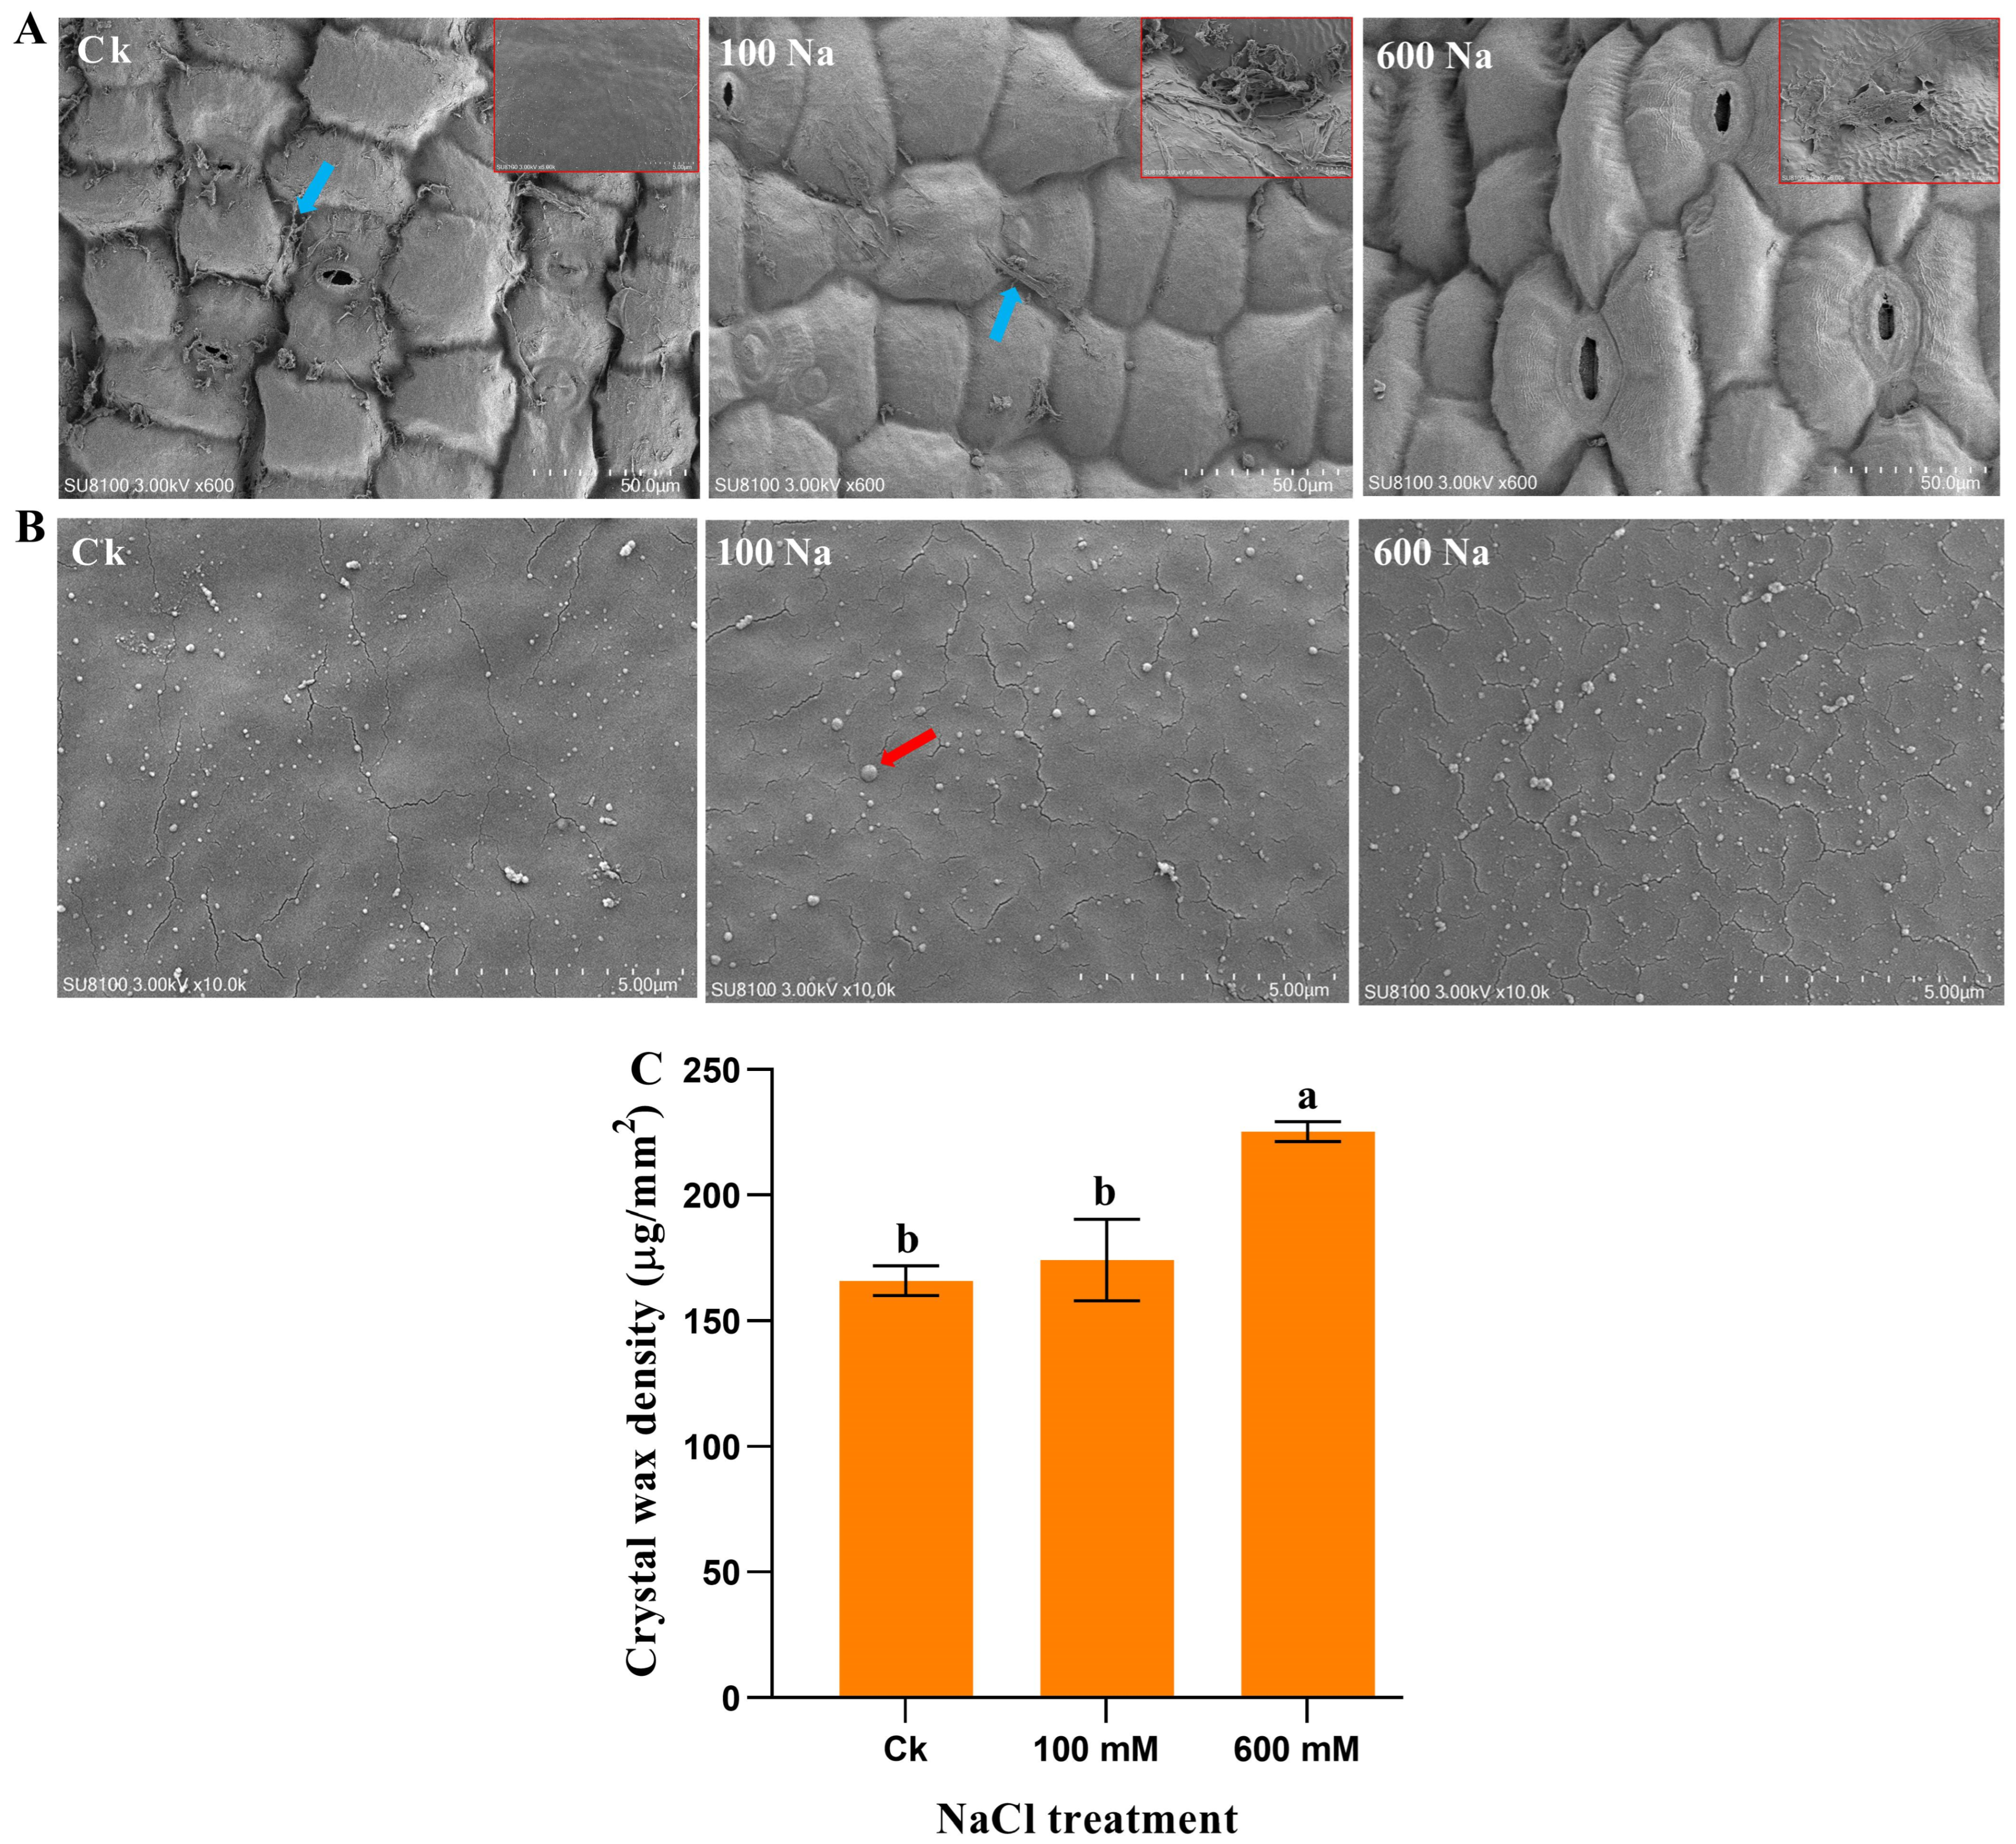
2.2. Cuticular Wax Morphology Under NaCl Treatment

In this section, we examine the effects of NaCl treatment on the morphology of cuticular wax in S. europaea. Using Scanning Electron Microscopy (SEM), we analyzed changes in the morphology of wax under varying NaCl concentrations. Visual inspection of the SEM results revealed that wax on the shoot surface without NaCl treatment easily dropped with the smooth epidermal cell surface when the resolution was increased. The wax of the 100 mM treated shoot also dropped, but appeared better than that in the Ck. A clear wax sheath stacked firmly to the shoot surface after the 600 mM treatment was observed, especially when the resolution was adjusted (Figure 2A). Wax crystal deposition was observed on the epidermis and the density on each surface was counted (Figure 2B). The treatment of NaCl enhanced the density of wax crystals, and 600 mM had a higher density of wax crystal deposition with a 1.36-fold increase compared to Ck (Figure 2C).

2.3. Wax Content and GC-MS Analysis of the Wax Composition in S. europaea

The total wax content was quantified in S. europaea under varying concentrations of NaCl to evaluate how salinity stress influenced the wax composition. The results demonstrated that there was no significant difference in the total wax content between the Ck and 100 mM treatment but was significantly higher in the 600 mM treatment compared with the Ck with a 35.8% increase (Figure 3A). The cuticle wax of S. europaea was mainly composed of fatty acids, alcohols, alkenes, and esters. In the Ck, 25.3% fatty acids, 46.8% alcohols, 23.9% alkenes, and 4.1% esters were accumulated; 100 mM accumulated 20.0% fatty acids, 55.6% alcohols, 20.2% alkenes, and 4.2% esters; and finally, 600 mM accrued 25.3% fatty acids, 36.8% alcohols, 23.7% alkenes, and 14.2% esters (Figure 3B). Among the NaCl treatments, 600 mM significantly (p < 0.05) promoted all compounds with 0.58-fold, 0.24-fold, 0.56-fold, and 4.5-fold compared with the Ck (Figure 3C).
The fatty acids ranged from C19 to C21 carbon atoms in length, and the main specific fatty acid compounds or monomers were palmitic acid (C19H40O2Si), α-linolenic acid (C21H38O2Si), linoleic acid (C21H40O2Si), and stearic acid (C21H44O2Si). After NaCl treatment, C19H40O2Si and C21H44O2Si were significantly (p < 0.05) promoted by 600 mM NaCl while C21H38O2Si and C21H40O2Si decreased with increasing NaCl compared to Ck. The alcohols ranged in carbon chain length from C21 to C36 and the specific compounds are octadecanol (C21H46OSi), eicosanol (C23H50OSi), docosanol (C25H54OSi), tricosanol (C26H56OSi), 1-tetracosanol (C27H58OSi), pentacosan-1-ol (C28H60OSi) 1-hexacosanol (C29H62OSi), and 1-octacosanol (C34H72OSi). When the effect of NaCl treatment was examined, C26H56OSi, C28H60OSi, C29H62OSi, and C34H72OSi were significantly promoted (p < 0.05) by the 600 mM NaCl treatment, while 100 mM NaCl significantly increased the content of C25H54OSi and C27H58OSi compared with Ck. Among the monomers of alcohols, C25H54OSi was the most accumulated compound under NaCl treatment. The alkanes and esters were composed of n-octadecane (C18H38) and decanedioic acid (C19H42O5Si3), respectively. The specific contents of alkane C18H38 and ester C19H42O5Si3 also increased significantly (p < 0.05) with the 600 mM NaCl treatment compared with the Ck (Figure 3D and Figure S1).

2.4. Identification of Cuticular Wax Biosynthesis Proteins in S. europaea

We conducted a sequence database search for the purpose of identifying key proteins involved in the cuticular wax biosynthesis of S. europaea under NaCl treatment. After the sequence database search, a total of 38 putative cuticle-associated enzymes were identified; six fatty acyl-CoA reductase (FAR) members, sixteen wax synthase/diacylglycerol acyltransferase (WS/DGAT) members, three fatty alcohol oxidase (FAO) members, five eceriferums (CERs) that encode aldehyde decarbonylase members, and eight mid-chain alkane (MAH) members. All the identified enzymes were renamed as SeFAR, SeWS, SeFAO, SeCER, and SeMAH.
The protein characteristics and subcellular localization were examined using ExPASy (https://web.expasy.org/protparam/, accessed on 20 August, 2024) and Cell-PLoc2.0 (http://www.csbio.sjtu.edu.cn/bioinf/Cell-PLoc-2/, accessed on 20 August 2024) online softwares. According to the analysis, the number of amino acids in SeFARs ranged from 488 to 606. The predicted molecular weights ranged from 55.23 to 68.79 kD, and the isoelectric points ranged from 8.35 to 8.85. The subcellular localization revealed that except for SeFAR1 and SeFAR6, which were localized in golgi apparatus, all the other members were in the chloroplast. The amino acid lengths of SeMAH ranged from 121 to 513. The predicted molecular weights ranged from 13.70 to 59.09 kD, and the isoelectric points ranged from 5.94 to 9.33. All the SeMAHs were localized in the endoplasmic reticulum. The SeCER amino acids were also from 114 to 625 in length, the predicted molecular weights ranged from 12.83 to 73.02 kD, and the isoelectric points ranged from 5.53 to 9.19. Except for SeCER5, which was localized in the chloroplast, all the other members were in the vacuole. For the SeWS amino acids, the lengths ranged from 153 to 541, the molecular weights of the predicted amino acids ranged from 16.56 to 60.68 kD, and the isoelectric points ranged from 6.39 to 9.43. The subcellular localization showed that the SeWSs were localized in the cytoplasm, cell membrane, chloroplast, nucleus, and peroxisome. Finally, the amino acids of SeFAO ranged from 729 to 813, the molecular weights ranged from 79.36 to 90.22 kD, and the isoelectric points ranged from 8.31 to 8.85. Except for SeFAO2, which was localized in the chloroplast and mitochondrion, the rest were in the chloroplast and vacuole (Table 1).

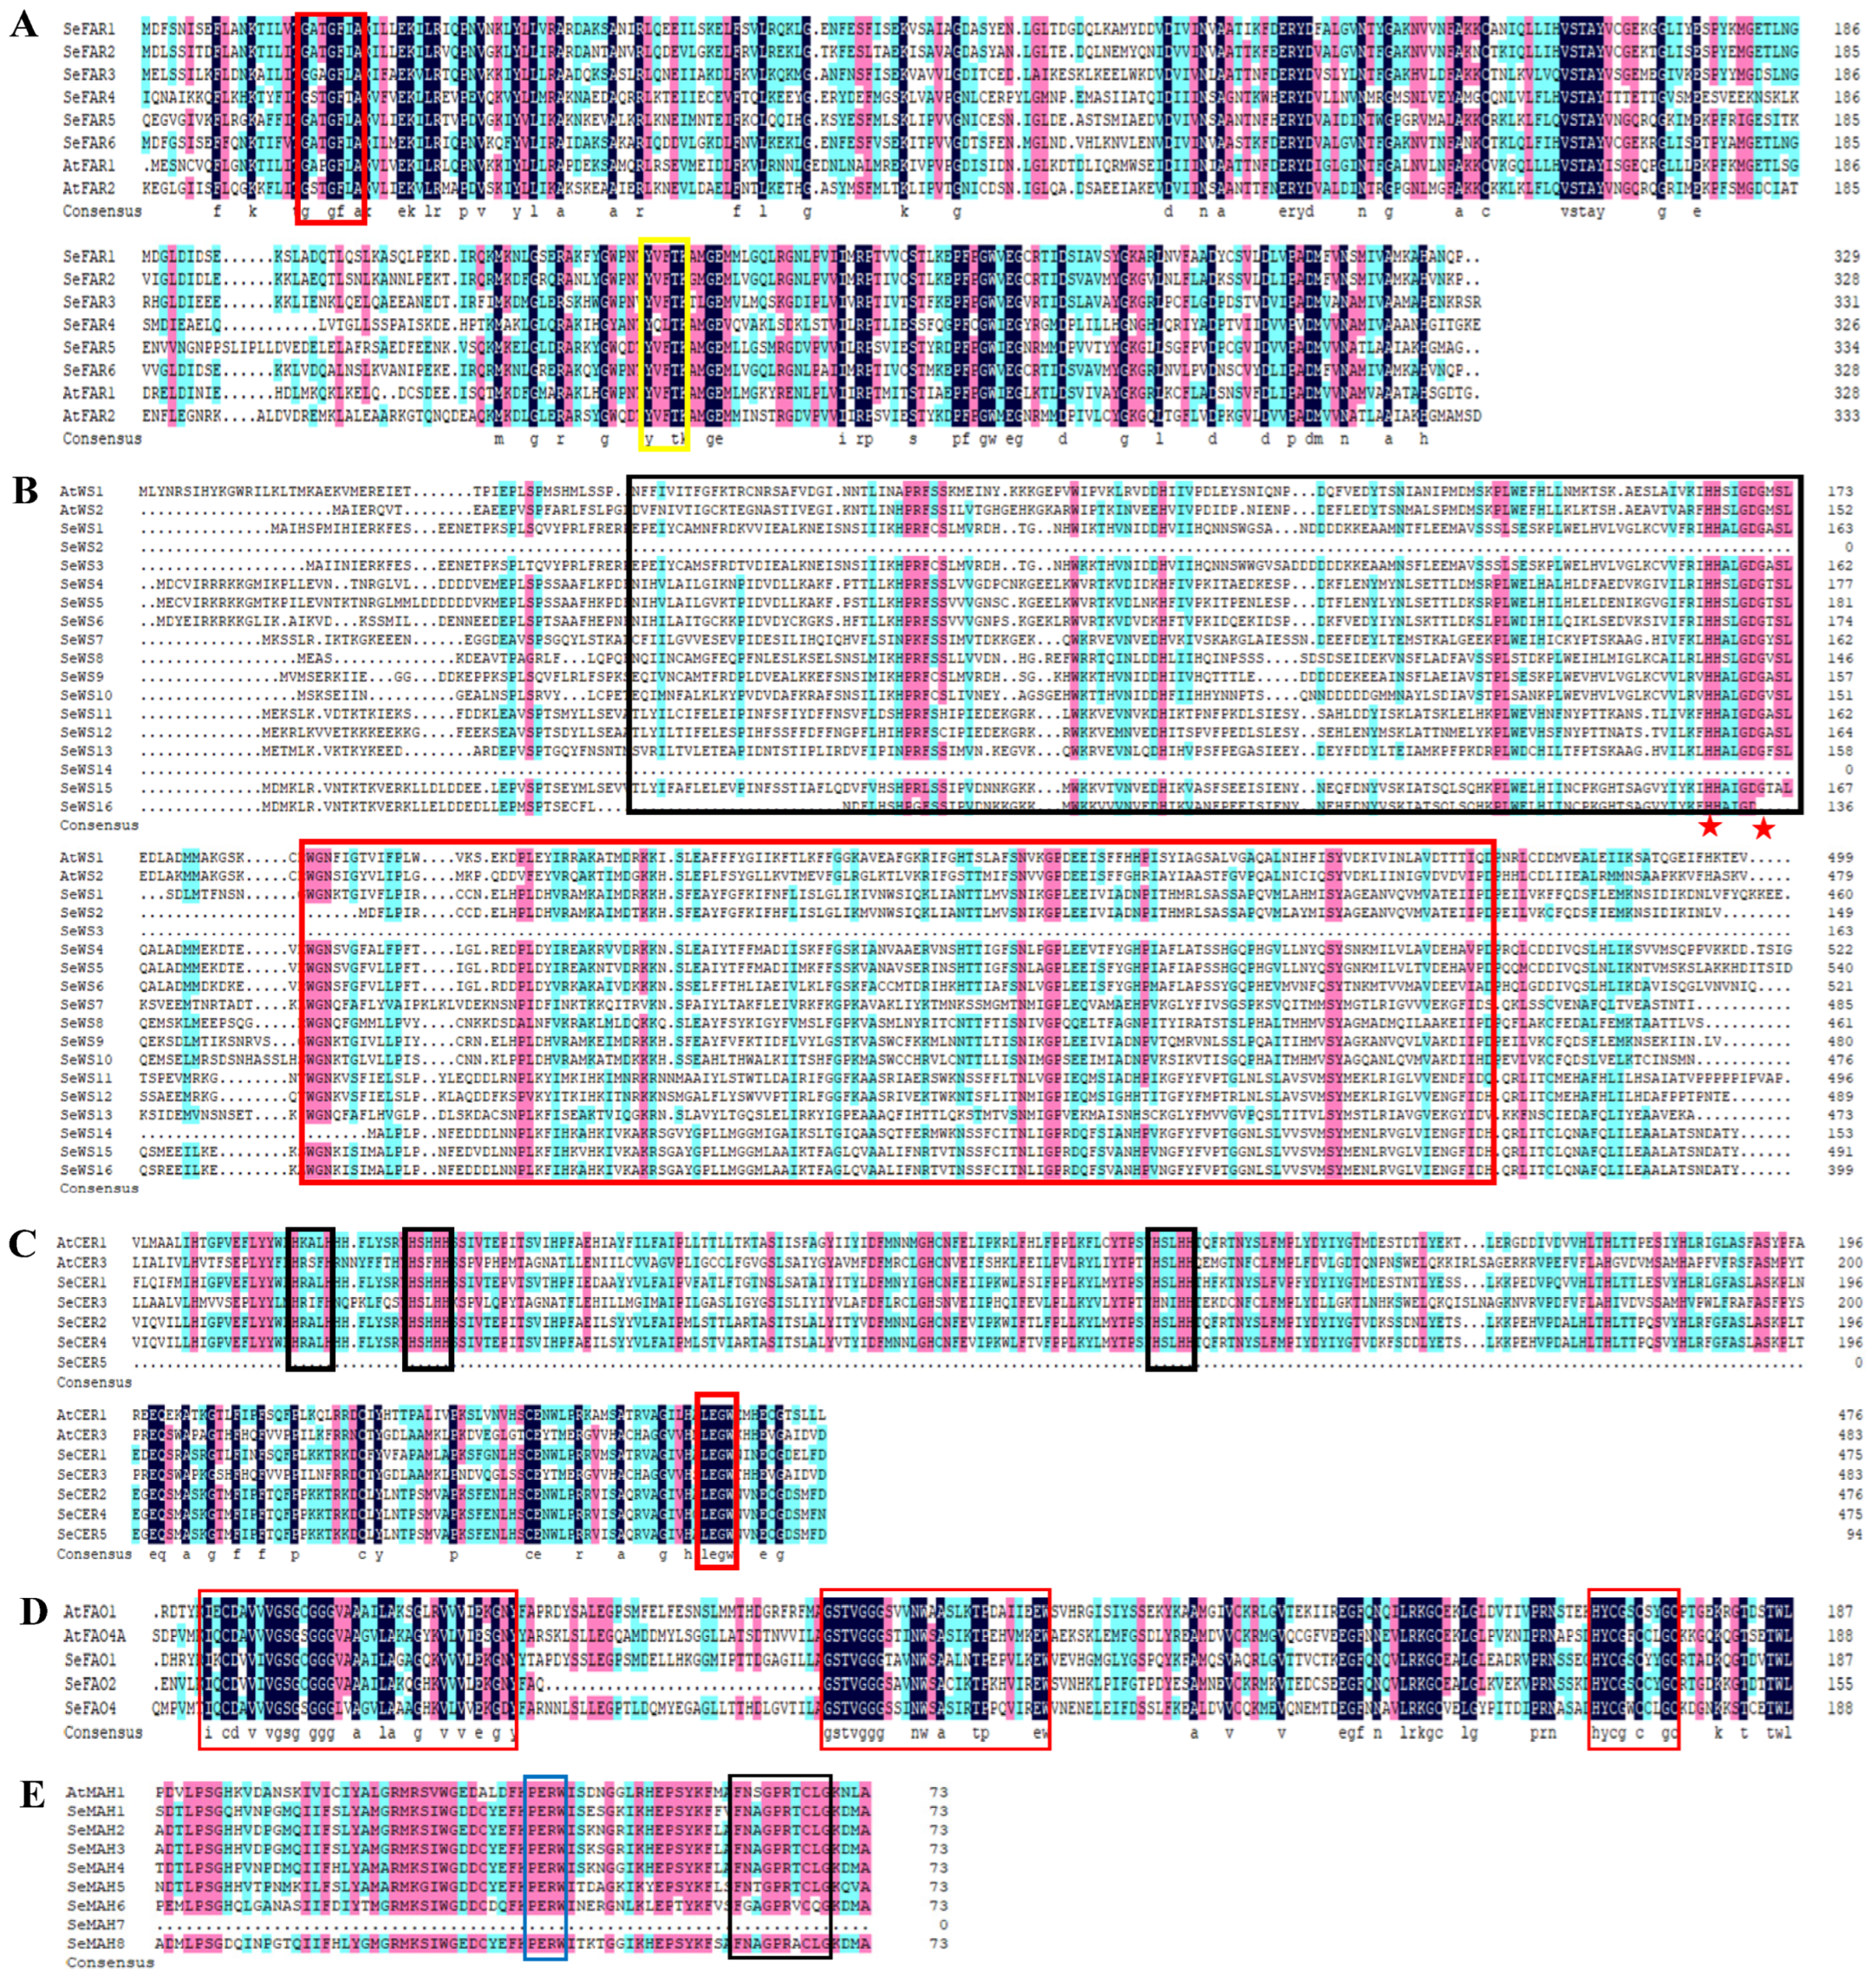
2.5. Multiple Sequence Alignment of Cuticular Wax Biosynthesis Proteins

To further characterize the wax enzymes of S. europaea, we carried out multiple sequence analysis using ClustalW in MEGA 5.0 software. The sequence alignment of the SeFARs of both the A. thaliana and S. europaea results contained the binding site motif GX2GX2(A) and the active site motif YX3K (Figure 4A). WES-acyltransf and DUF1298 domains were found in the SeWS proteins in the aligned sequence, with the conserved catalytic motif HHX3DG (Figure 4B). The presence of the flavin-binding site GXGXGGX and cytochrome c family heme-binding site CX2CX2GC were used to confirm the FAO family sequence (Figure 4C). For the CER protein sequence alignment, three His-rich motifs HX3H, HX2HH, HX2HH, and the LEGW motif were discovered as the clusters that characterized the CER proteins (Figure 4D). The PERF domain and heme-binding region were used to validate the MAH protein sequence; P-E-R-W and FX2GXRXCXG were revealed as the PERF domain and heme-binding region, respectively (Figure 4E).

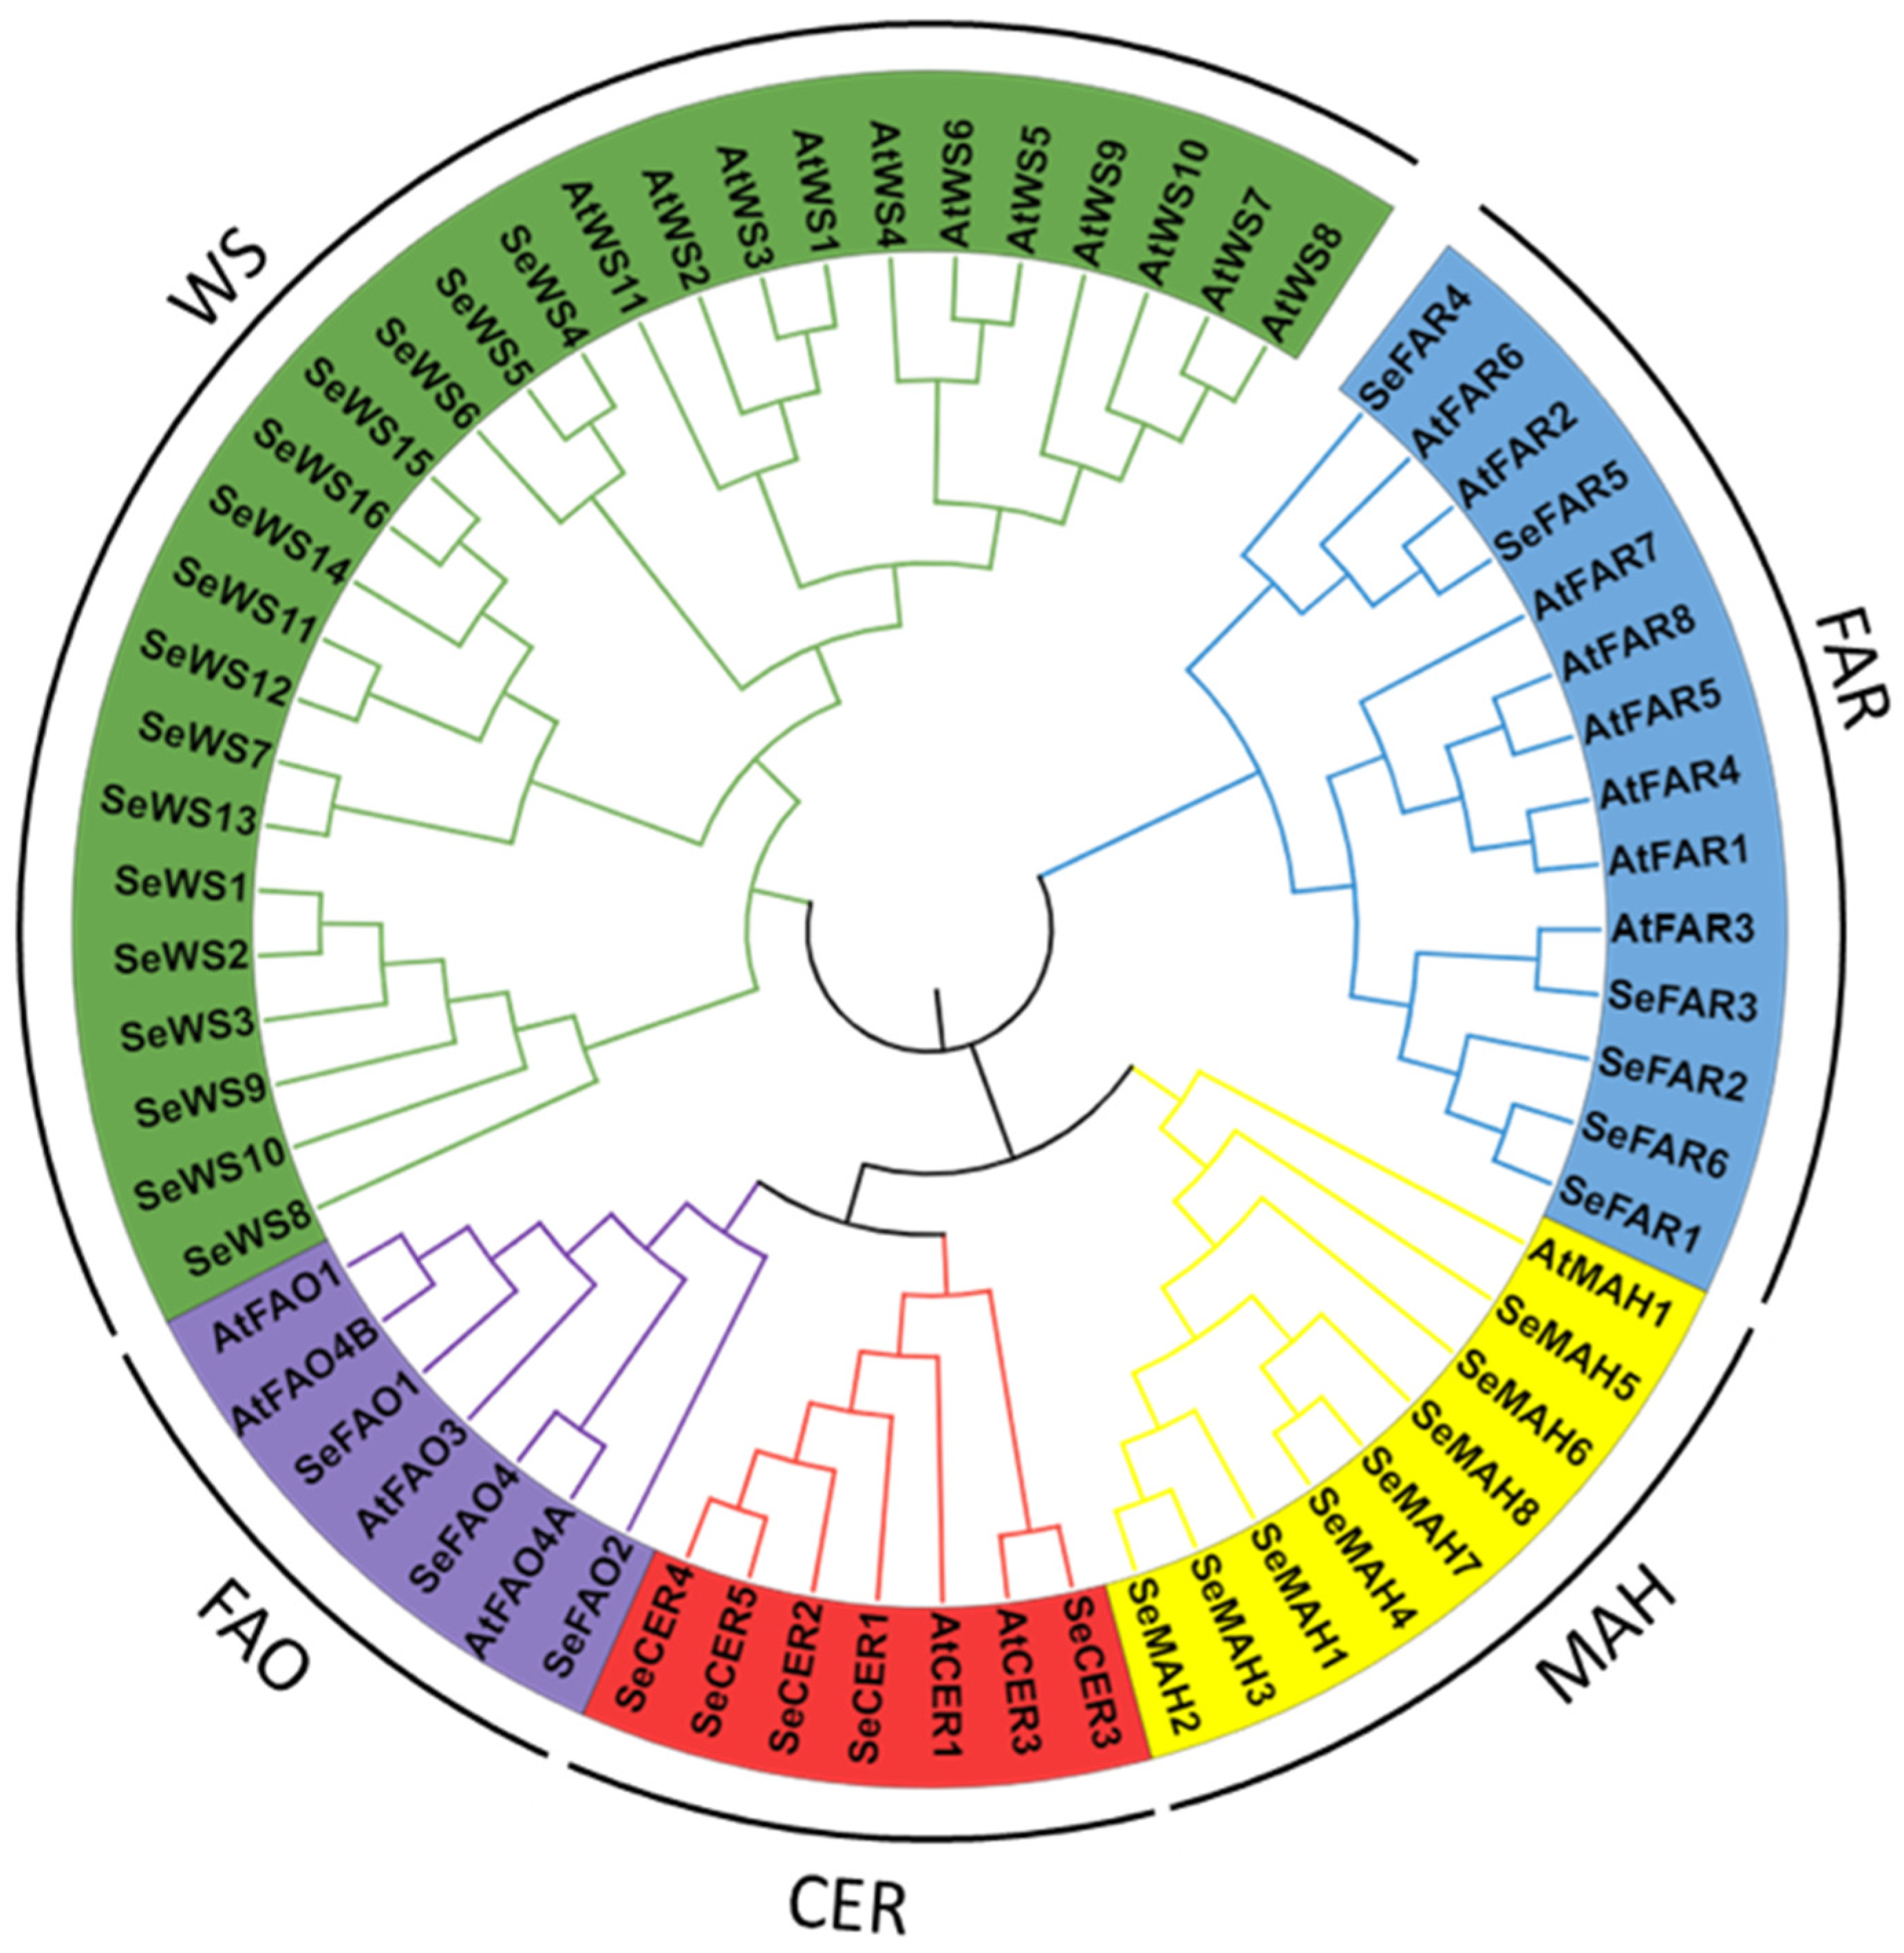
2.6. Phylogenetic Relationship

To determine if the putative proteins identified shared functional characteristics and phylogenetic relationships, a phylogenetic tree was constructed using MEGA 5.0 software. The phylogenetic tree revealed that A. thaliana FAR3 and S. europaea FAR3 shared high homology, while SeFAR5 was also a homolog of AtFAR2. WS proteins were clustered into three groups, with SeWS4, SeWS5, and SeWS6 sharing the same cluster with the AtWSs. Among the FAOs, all of the sequences shared one clade, with SeFAO4 and AtFAO4A sharing a homolog. Most SeCER proteins were clustered in one group, while SeCER3 was clustered with AtCER3, indicating their similar functions. Finally, the MAH proteins were clustered in one group (Figure 5).

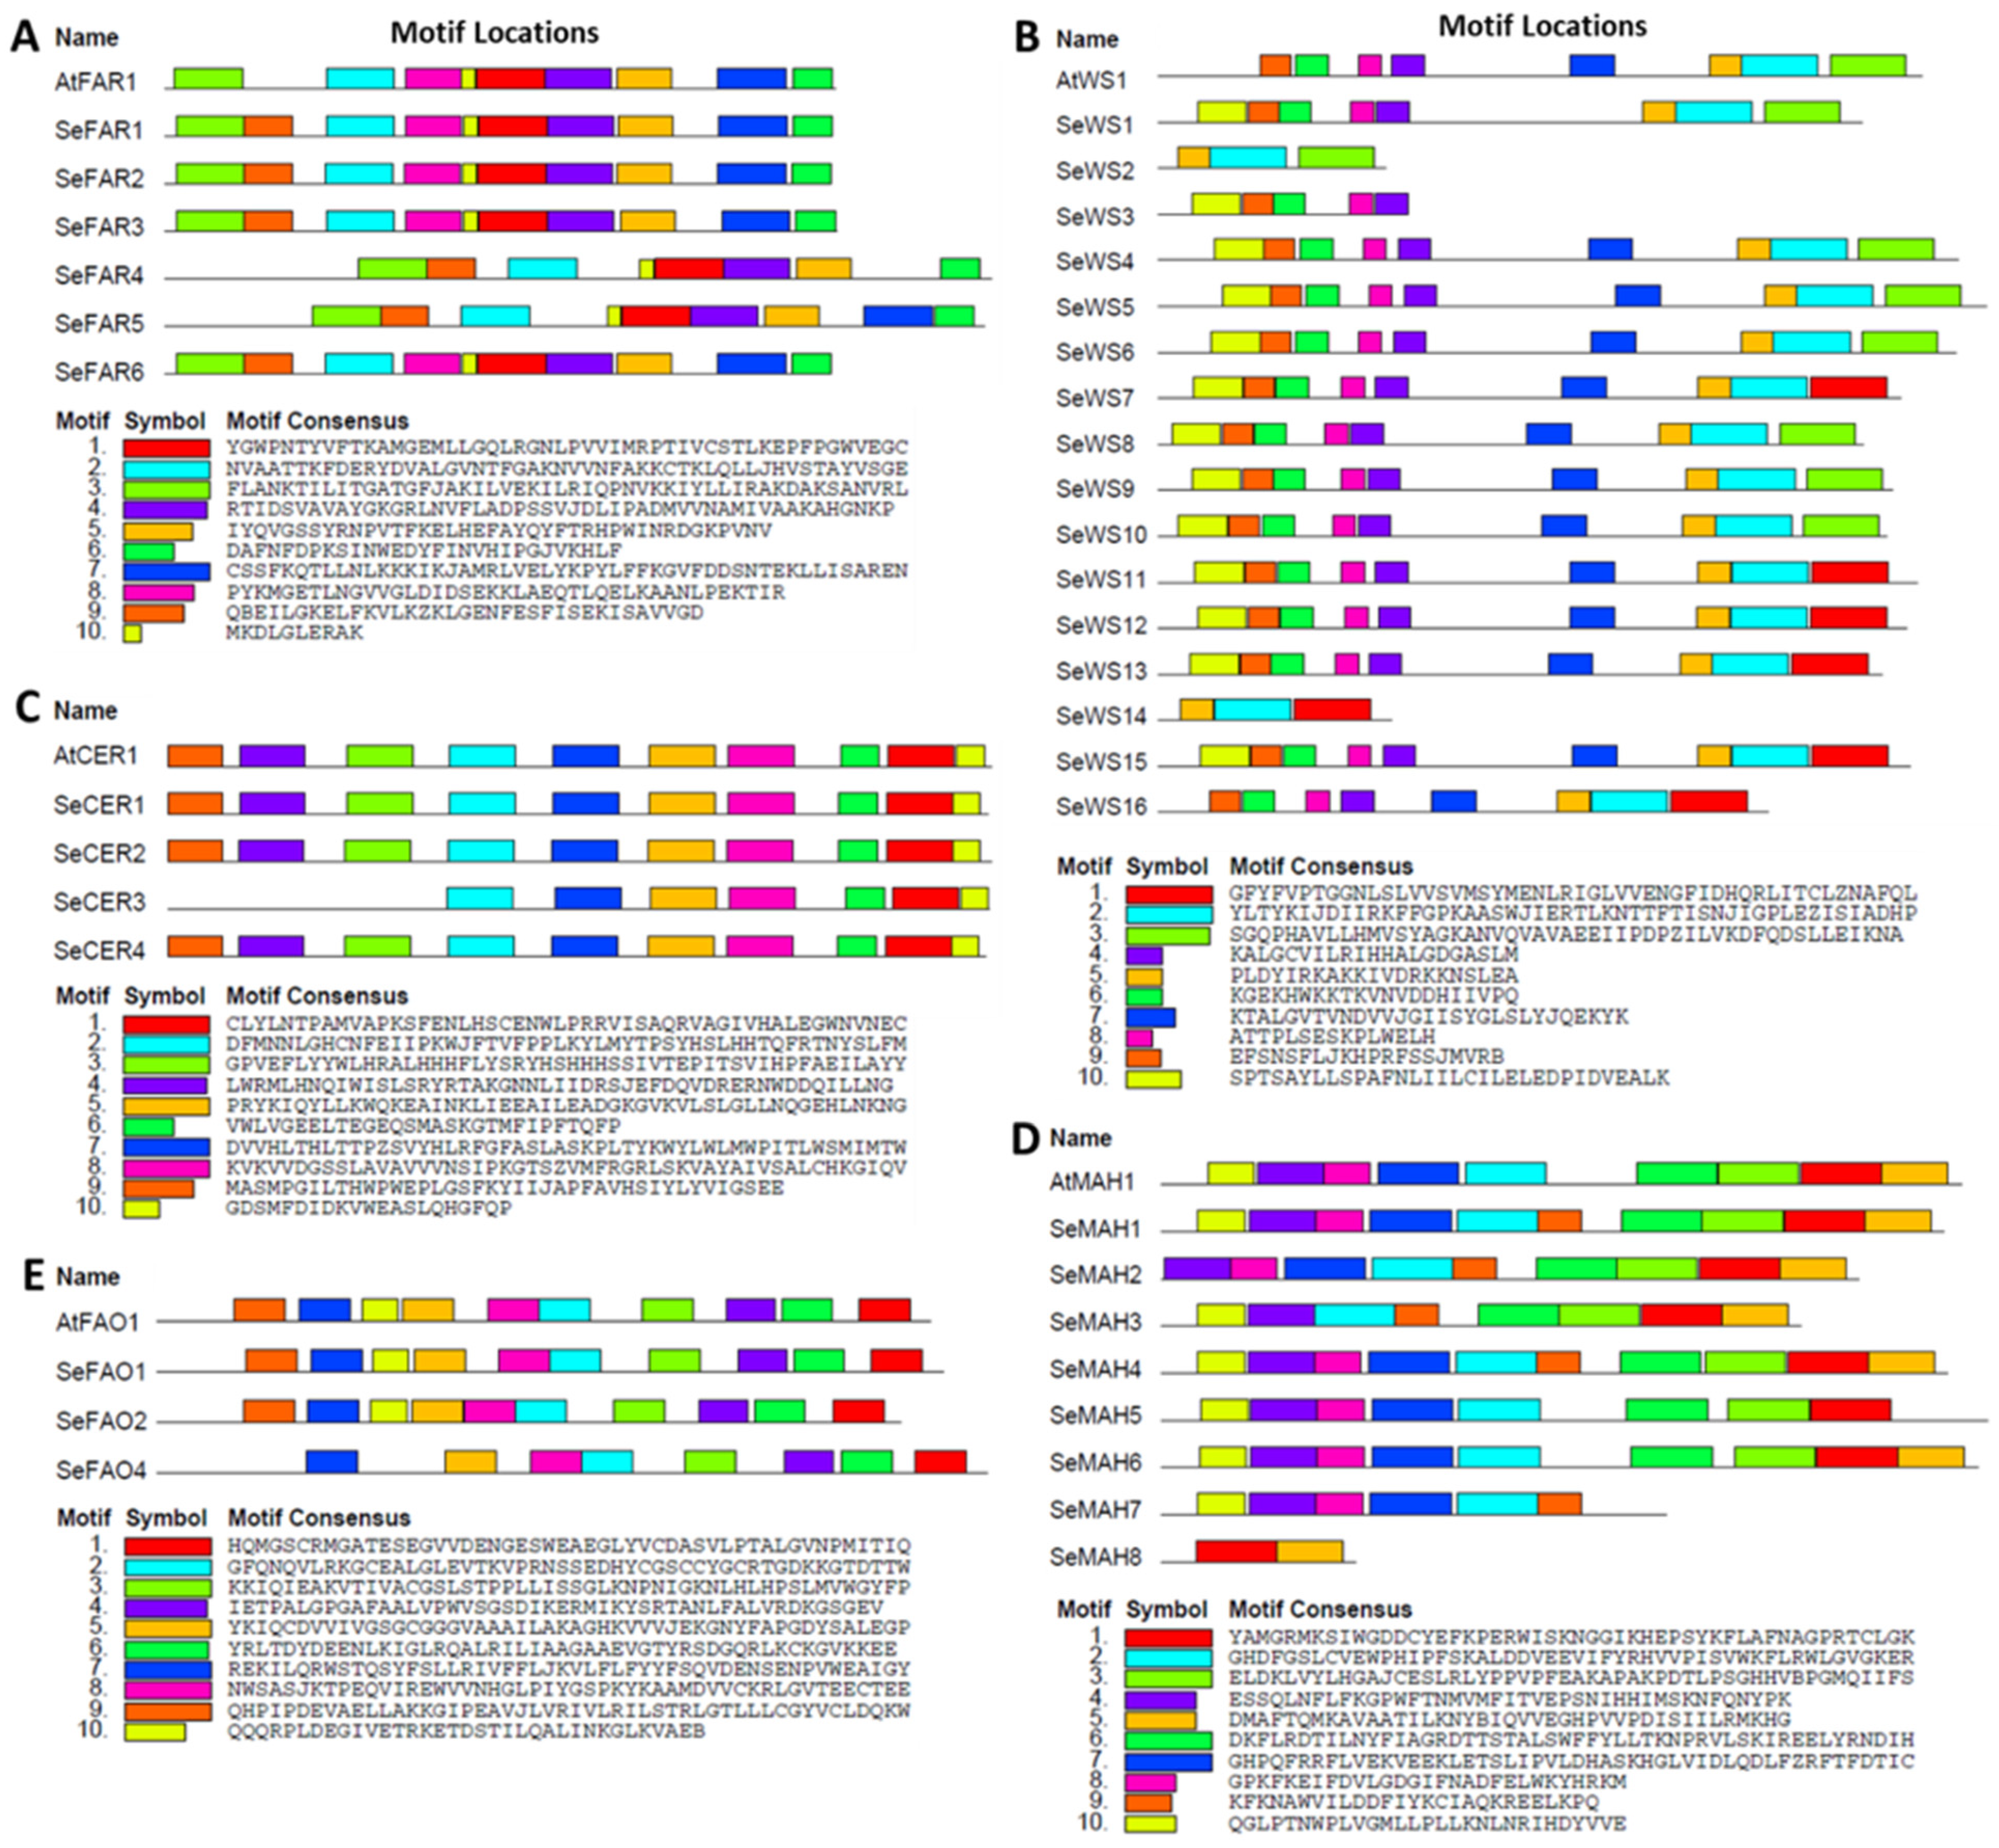
2.7. Conserved Motifs of Wax Biosynthesis Proteins in S. europaea

To understand the structure and functional characteristics of the key wax biosynthesis proteins, we identified conserved domains and motifs in the proteins of SeFARs, SeWSs, SeCERs, SeMAHs, and SeFAOs using the MEME search tool. The conserved motifs of SeFARs had high similarities, except for motif 8, which was missing in SeFAR4 and SeFAR5. Among the motifs, motif 3 contained the conserved binding site motif, and the active site motif was contained in motif 1 (Figure 6A). The conserved motifs of the SeWS proteins were either eight or nine in number, except for SeWS2, SeWS3, and SeWS14, which had three, five, and three motifs, respectively. The active site motif sequences were in motif 4 (Figure 6B). In the SeCER conserved motif distributions, except for SeCER3, all of the other members had all 10 motifs. The three His-rich motifs and the LEGW motif were also present in motif 2, motif 3, and motif 1, respectively (Figure 6C). Among the SeMAH members, only SeMAH1 and SeMAH4 contained all of the 10 conserved motifs, and both the PERF domain and heme-binding region sequence were conserved in motif 1 (Figure 6D). SeFAO4 contained only eight conserved motifs, but the other members contained all ten motifs. The flavin-binding site sequences were present in motif 5, while the cytochrome c family heme-binding site sequences were conserved in motif 2 (Figure 6E).

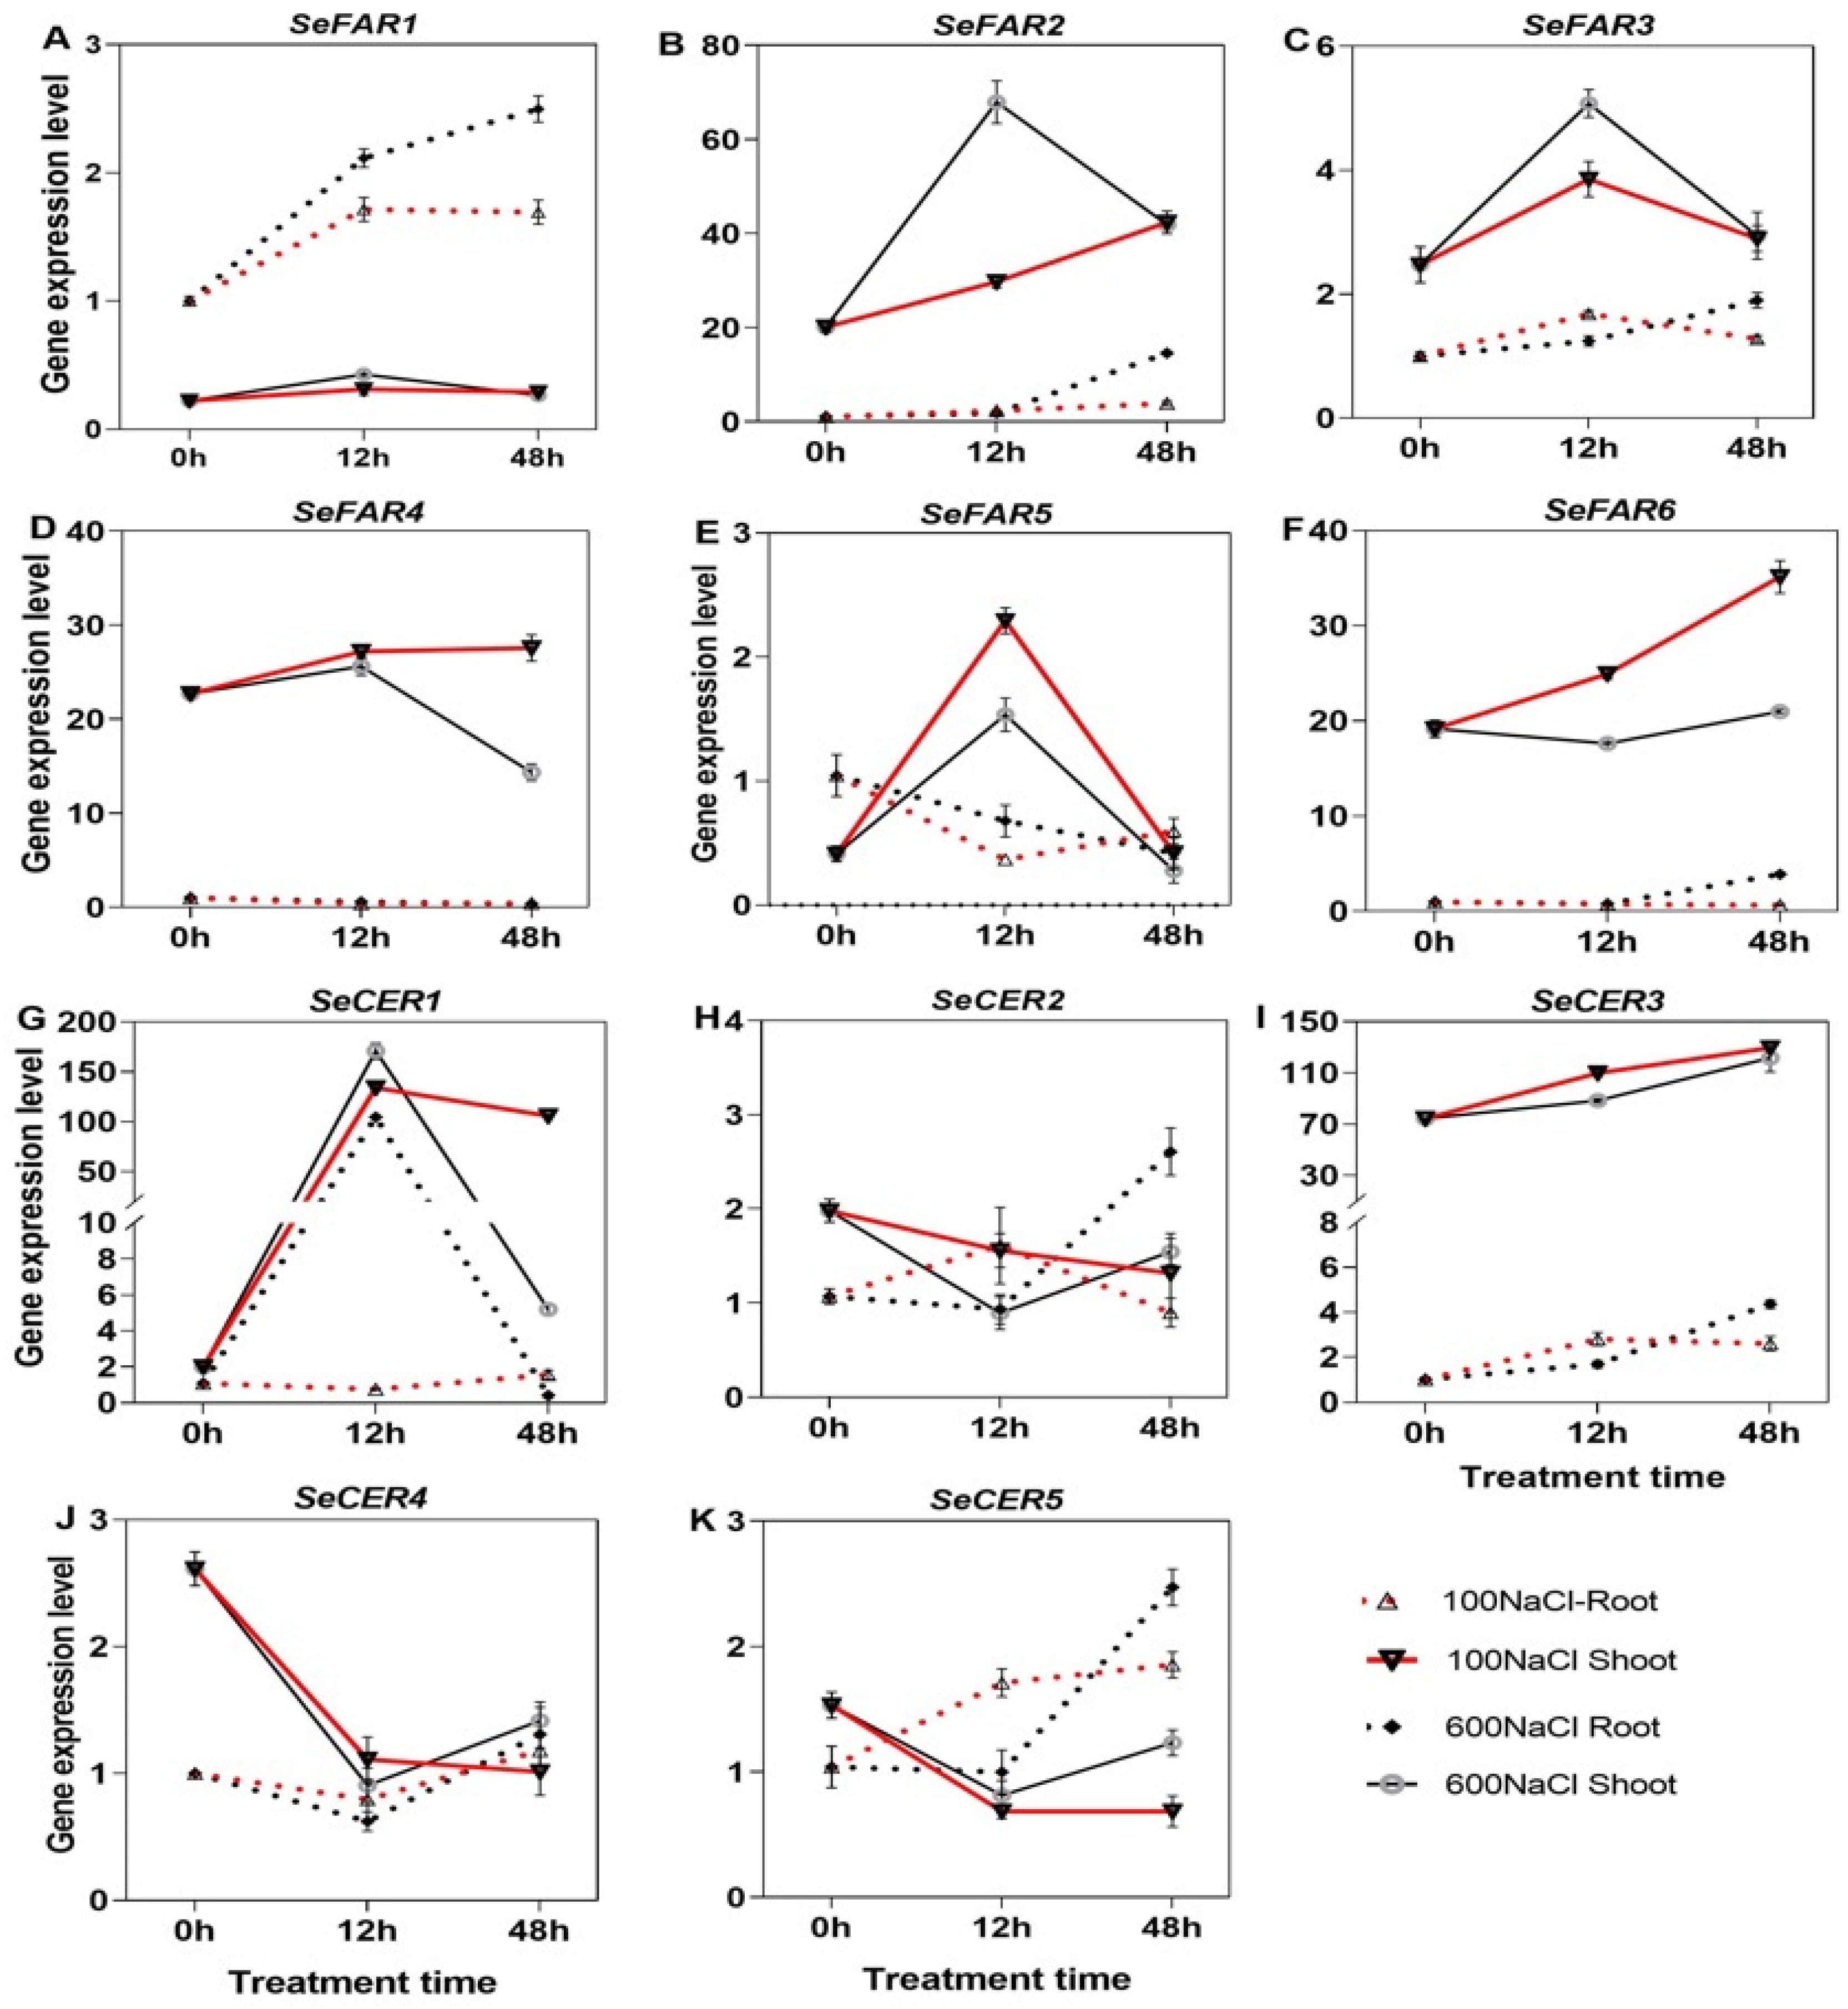
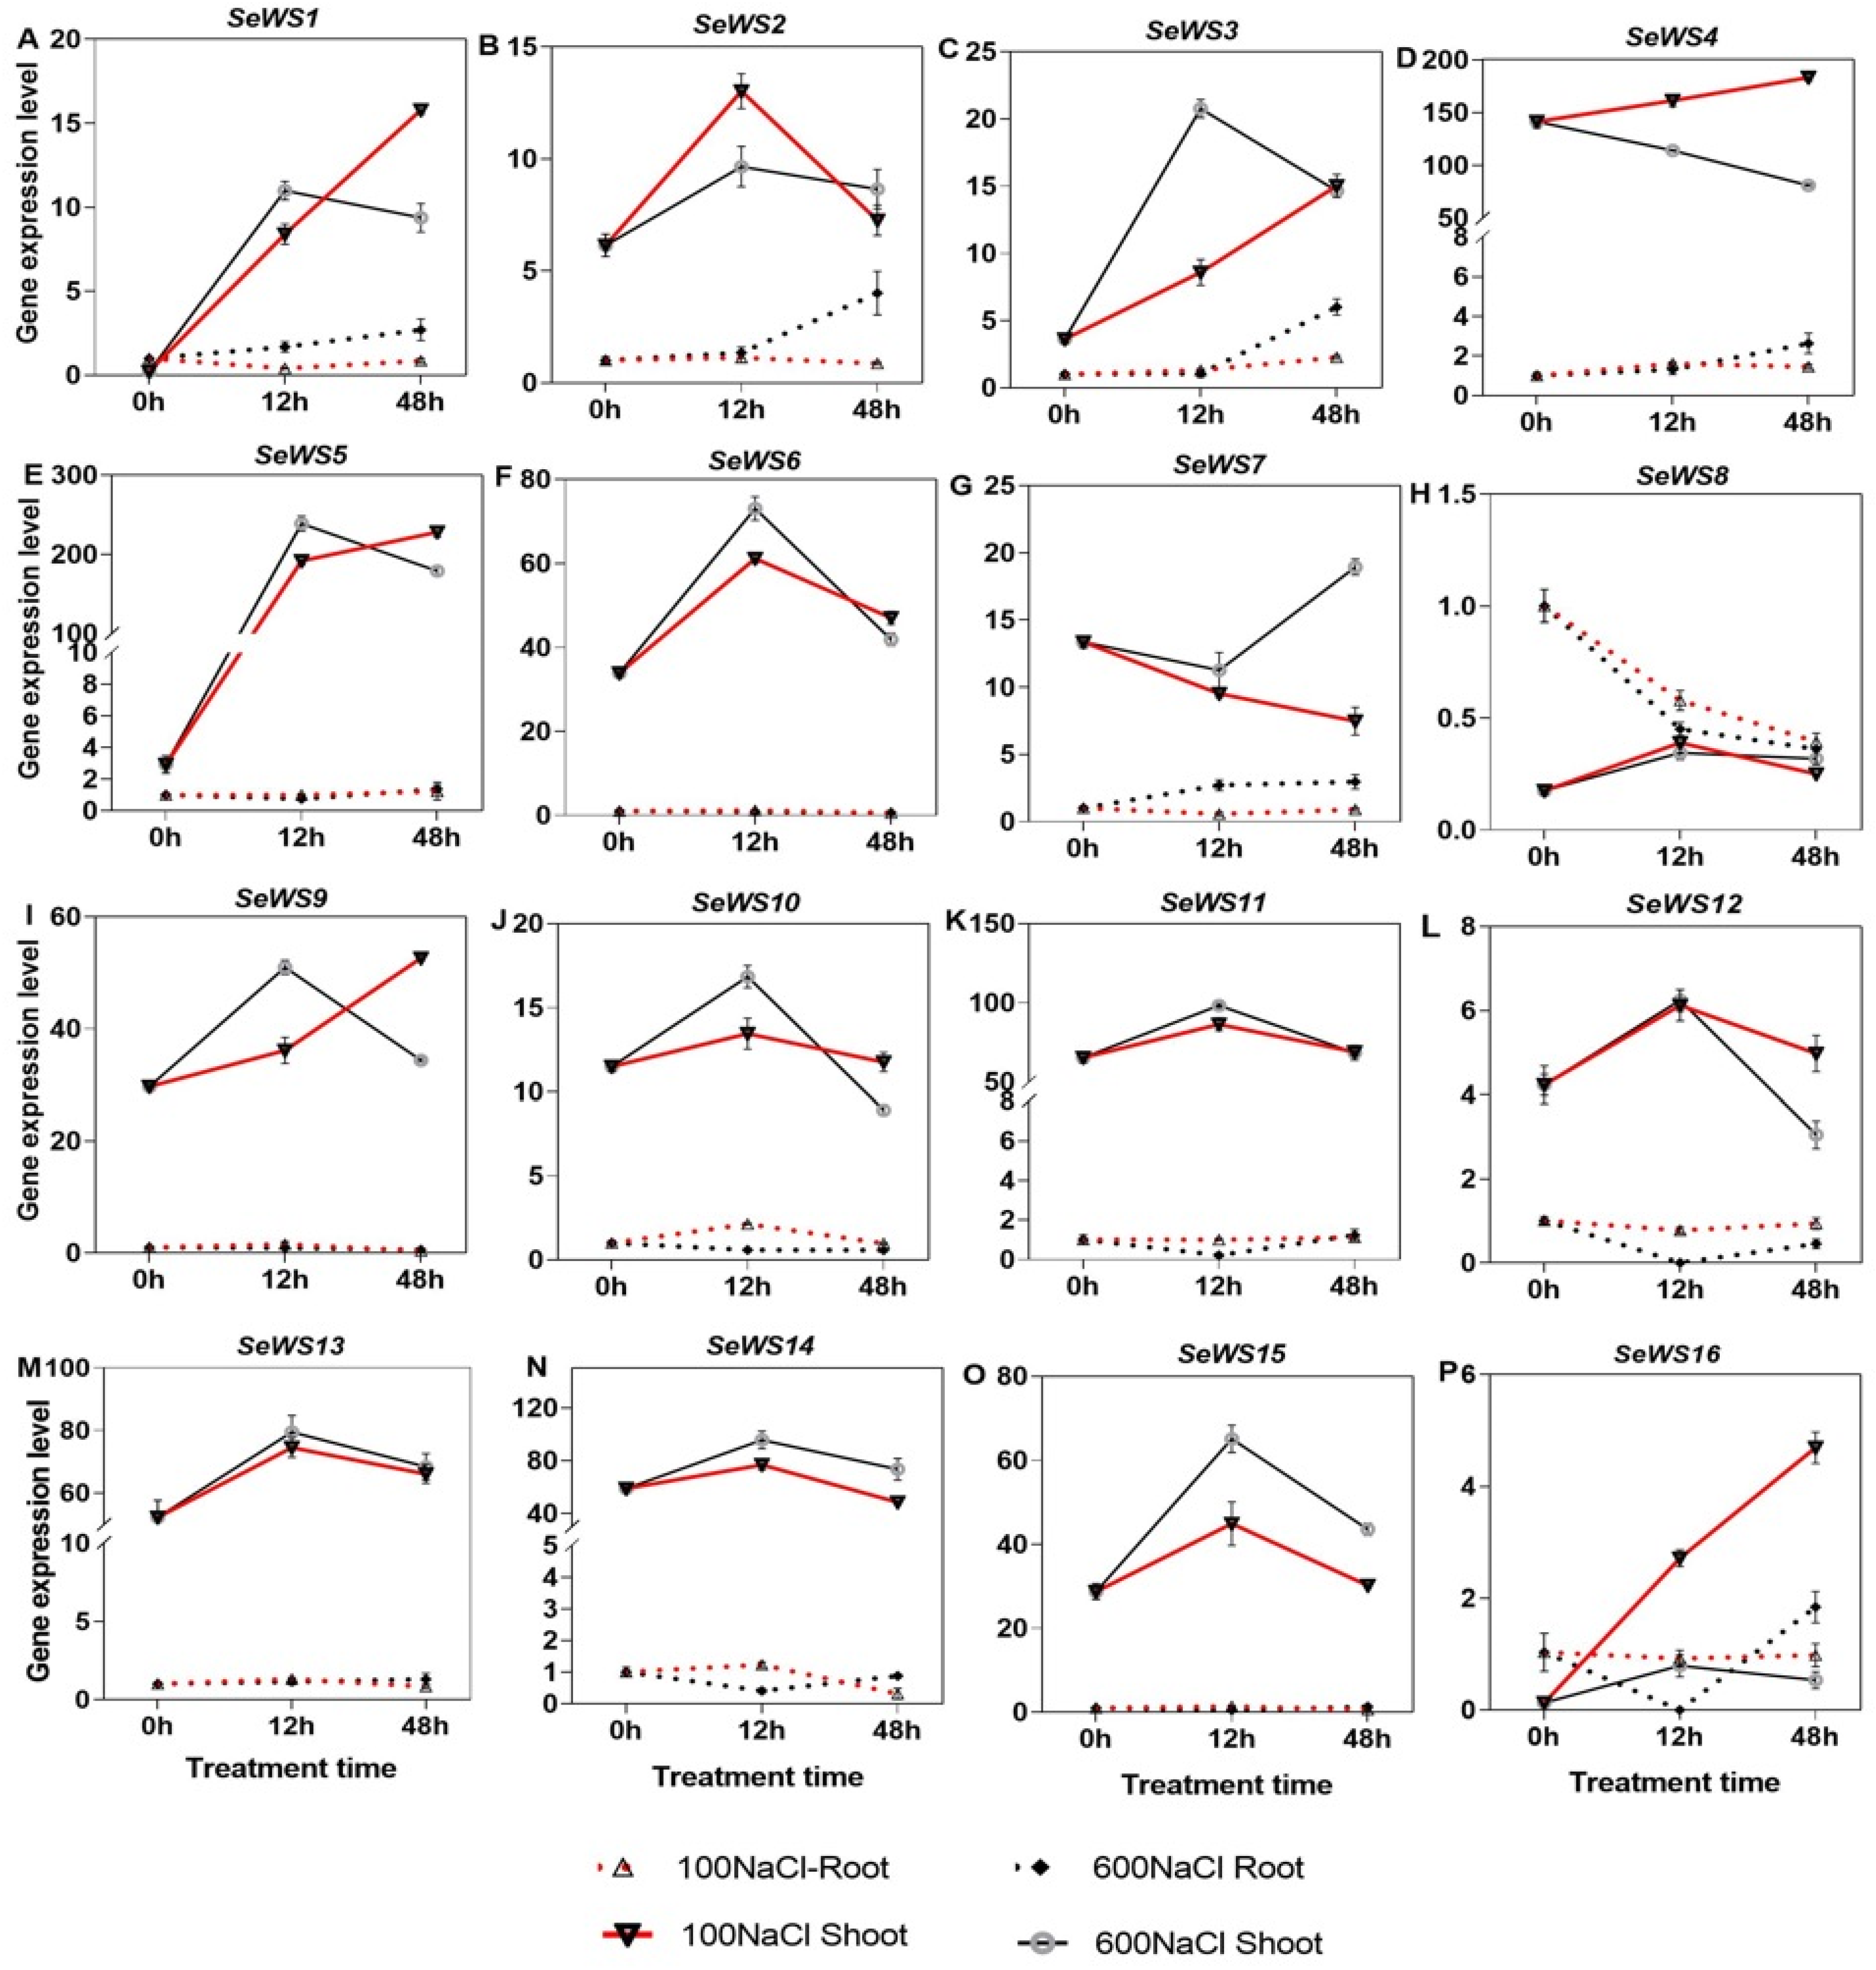
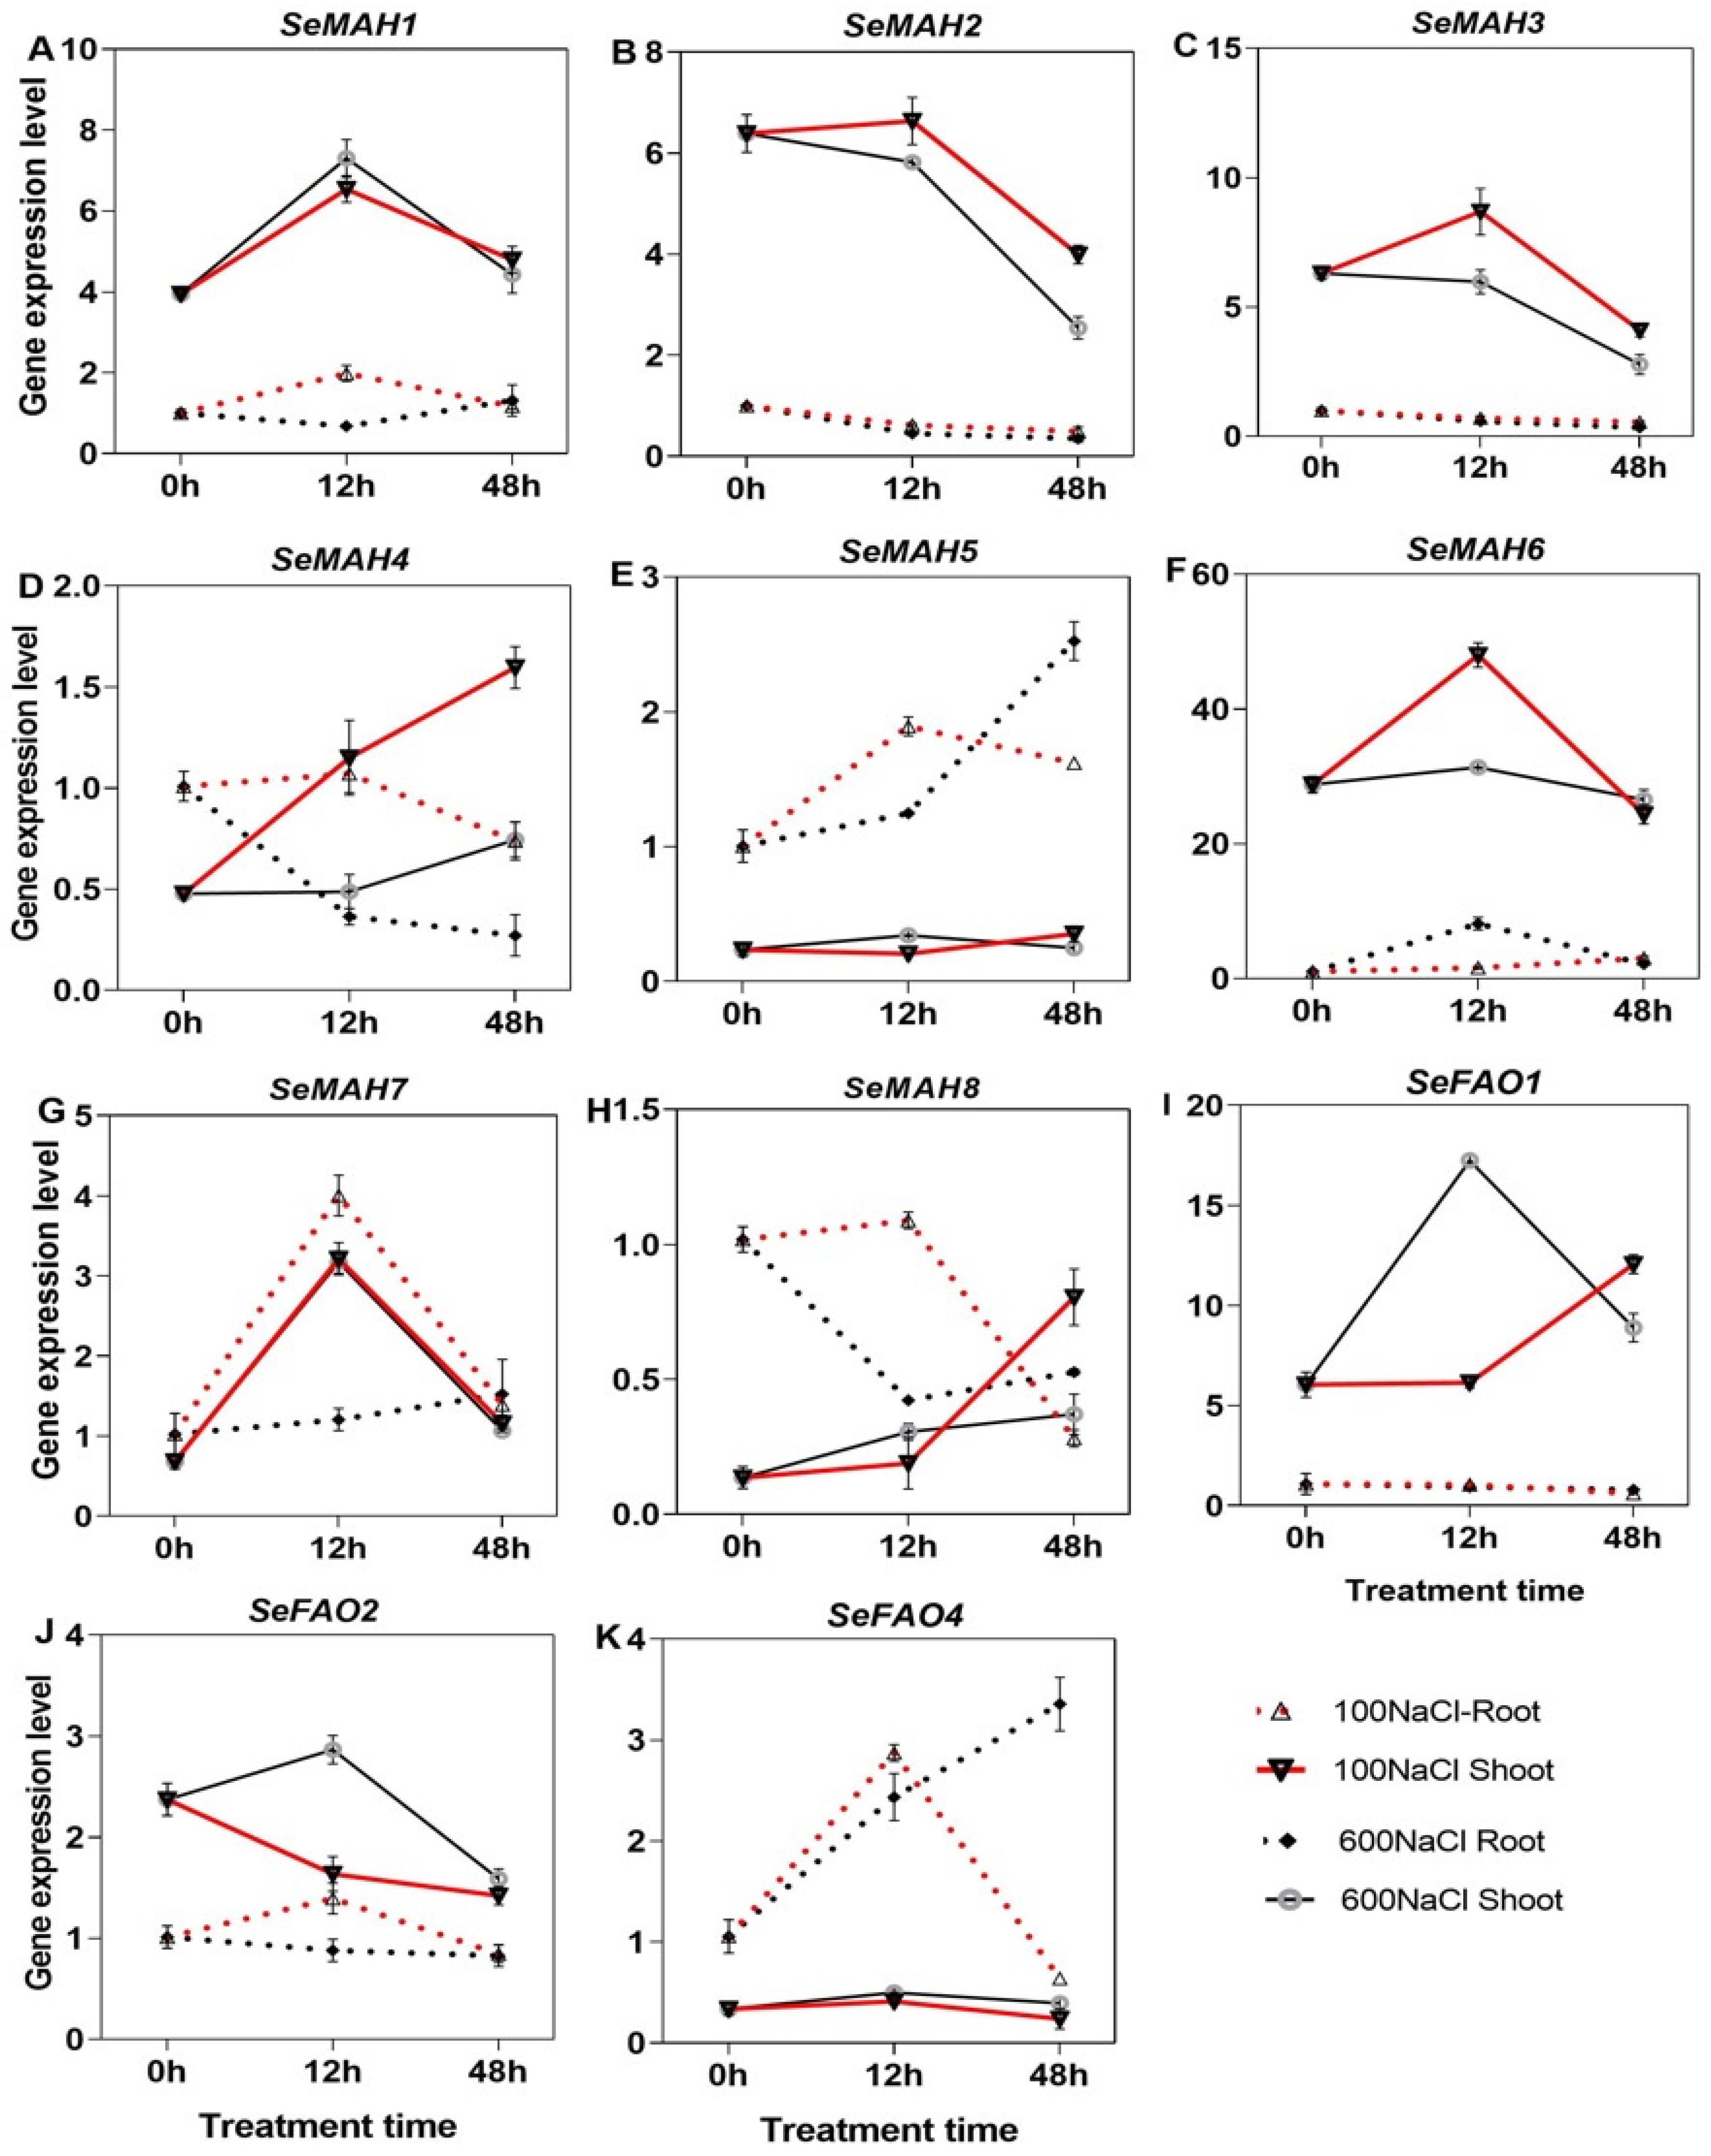
2.8. Expression of Wax Biosynthesis Genes Under NaCl Treatment

To investigate the expression pattern of the S. europaea wax biosynthesis genes (SeFAR, SeWS, SeMAH, SeFAO, and SeCER), we performed qRT-PCR analysis of the roots and shoots using specific primers. Several genes showed variations that were more extensive in expression during the different exposure periods as well as among the different tissues. The expression of SeFARs showed varied differential profiles under 100 and 600 mM at the 12 and 48 h periods in the shoot and root (Figure 7A–F). For instance, SeFAR1 was significantly expressed in the root and much higher under 600 mM NaCl at 48 h, while SeFAR2 and −3 were significantly expressed in shoot under 600 mM NaCl at 12 h. In addition, SeFAR2, and −6 in the shoot under 100 mM NaCl were increasingly expressed and peaked at 48 h, with fold increase of 1.1, and 0.8, respectively compared with the Ck (Figure 7B,D,F); the expression profiles of SeFAR5 was higher, with a 4.5-fold increase under 100 mM for 12 h of treatment compared with the Ck (Figure 7E). In the case of SeCER, the expression showed that SeCER1 was significantly upregulated in the shoot with 66.7-fold and 85.2-fold higher under 100 mM NaCl and 600 mM NaCl at 12 h, respectively. Also, the SeCER1 in root was expressed remarkably under 600 mM NaCl at 12 h with 96.7-fold increase compared with the Ck (Figure 7G). The increased expression of SeCER3 was significantly higher in the shoot than root, however, no significant difference was observed among the treatment times (Figure 7I). Similar expression patterns were observed between SeCER2 and SeCER5 (Figure 7H–K).
The expression profiles of 15 WS genes were significantly higher and one member was lower in the shoot than root under both NaCl contents (Figure 8A–P). The expression of SeWS2, −6, −10, −11, −12, −13, −14, and −15 in shoot was significantly enhanced by both NaCl concentrations at 12 h but decreased at 48 h. Moreover, the expression of SeWS1, −3, −5, −9, and −16 significantly increased then peaked under 100 mM NaCl at 48 h in the shoot; also, SeWS1, −3, and −5 recorded significant fold increase of 48.3, 4.7, and 80.5 under 600 mM NaCl at 12 h in the shoot compared with the Ck. Even though SeWS8 was higher in the root than shoot, it was downregulated at 48 h under both NaCl contents (Figure 8H,P).
The expression of SeMAH1, −2, −3, and −6 genes was evidently higher under both NaCl treatment in the shoot than root, for SeMAH5, the expression was more higher in the root than shoot (Figure 9A–C,F). The expression of SeMAH1, −2, −3, −6, and −7 in the shoot peaked highly at 12 h but dropped at 48 h of treatment period under100 mM NaCl concentration. SeMAH7 gene had the highest fold increase of 3.7 under 100 mM NaCl and 3.6 under 600 mM NaCl for 12 h in shoot compared with the Ck. The expression of SeMAH4 was upregulated under both NaCl contents at 48 h in the shoot. Among the SeFAO genes, SeFAO1 and −2 were more expressed in the shoot than root while SeFAO4 was more expressed in the root than shoot (Figure 9I–K).

3. Discussion

The cuticle, mainly composed of wax and cutin, is the outermost natural barrier in plants, which plays an important role in preventing water loss [26]. Salt stress has been shown to induce cuticle thickness and the accumulation of epidermal wax in plants [27,28,29]. This study suggested that the S. europaea shoot changed its cuticle thickness to enhance salt tolerance It is suggested that reduced epidermal permeability and enhanced water retention are perhaps achieved by increasing the total wax accumulation at a low concentration of salt stress. Nevertheless, our study concurrently enhanced the total wax load and content of wax compounds under high NaCl content, which might have reduced the epidermal permeability and increased the water use efficiency to resist NaCl stress. We also observed crystal wax structures in S. europaea, and the typology of wax was aligned with that proposed by Tomaszewski and Zieliński [30]. High NaCl treatment was suggested to enhance the density of the shoot surface crystal wax structures.
Wax constituents differ in various plant species; the cuticular wax of the A. thaliana stem is composed of a mixture of alkanes and ketones, with alcohols, aldehydes, and fatty acids accounting for less than 25% of the total [31]. In transgenic Medicago sativa leaves, alcohols constituted the highest wax constituents under abiotic stress [32]. In the case of S. europaea under NaCl treatment, the cuticular wax was composed of four compounds: alcohols, fatty acids, alkenes, and esters; 600 mM NaCl evidently enhanced their accumulation, respectively. After NaCl treatment, alcohols accounted for the largest component of the wax (73.7%), with C25H54OSi as the main alcohol component in S. europaea, suggesting their critical role in forming a thicker cuticular wax to combat salinity stress, giving their ability to form hydrophobic substances [33,34]. Fatty acids and alkanes are also reported to contribute to an impermeable cuticle barrier [4,10], and they constituted the second and third largest wax compounds in S. europaea under NaCl treatment.
Wax biosynthesis enzyme genes mediating wax accumulation in stress response have also been reported, however, it is still important to evaluate their genetic characteristics and roles in S. europaea under NaCl treatment. In this study, binding site motif G(A/S)(T/A)G(F/I/T/A) and an active site motif Y(V/Q/T)K were found to be present in SeFARs. Previous studies showed that similar motifs of FAR reported in five model plant species and the mutation of the two glycines (G), tyrosine (Y) and lysine (K) amino acid residues play a direct role in enzymatic activity [35,36]. In line with our study, two typical domains, WES-acyltransf and DUF1298, with conserved catalytic motif HHX3DG were also discovered in WS proteins [37,38,39]. The WES-acyltrans domain was reported to catalyze the reaction of CoA-dependent acyltransferase with fatty alcohol to form a wax ester [38]. Both histidines in the HHX3DG motif were also shown to be essential for wax ester synthase/acyl-CoA:diacylglycerol acyltransferase catalysis [37]. A. thaliana and Candida cloacae (fao1 and fao2) contain the consensus sequence for the cytochrome c family heme-binding and flavin-binding signatures, as discovered in S. europaea [40,41]. The three His-rich motifs (HX3H, HX2HH, and HX2HH) and the LEGW motif were contained in SeCERs that were similar to Chaudhary, et al. [42], and have been proposed for several integral membrane enzymes catalyzing desaturations and alkane hydroxylation [43].
The synthesis of plant wax consists of a series of complex biological processes in which multiple genes are involved. After identifying and conducting an expression analysis of the cuticle wax genes, the expression patterns were differentially regulated by NaCl treatment in the shoots and roots at different time points. FAR reduces VLCFA-CoAs to primary alcohols, which in turn act as intermediate metabolic end products to participate in the formation of cuticular wax [35]. The results of this study showed that the SeFAR genes were significantly expressed; SeFAR2, −3, and −5 had the highest expressions in the shoot under NaCl stress. The expression of AtFAR3/CER4 in A. thaliana was highly upregulated in the aerial organs and was responsible for the synthesis of primary alcohols and cuticular wax [44]. Interestingly, in this study, SeFAR3 had a close phylogenetic relationship with AtFAR3 and was also upregulated in the shoot under 600 mM NaCl treatment, indicating a conserved role in the synthesis of primary alcohols and cuticular wax in S. europaea. According to Domergue et al. [20], the expressions levels of the AtFAR1, AtFAR4, and AtFAR5 genes were increased in the root endodermal cells under high salt stress and were confirmed as alcohol-forming FARs; a similar phenomenon was observed in S. europaea FAR1, whose expression was also enhanced by high NaCl stress in the root than shoot, suggesting that SeFAR1 in the root may play a role in alcohol-formation or have other functions under NaCl treatment in S. europaea. The response of SeFARs to NaCl treatment may also contribute to the large amounts of alcohols content in in S. europaea. WS catalyzes the esterification of primary alcohols (produced by FARs) with acyl-CoAs to form wax esters [45] and is also a key player in the acyl reduction pathway of wax biosynthesis. The expression of 15 SeWS genes in S. europaea were upregulated in response to NaCl treatment in shoot than root; SeWS1, −3, and −5 responded to 600 mM NaCl with fold increase of 48.3, 4.7, and 80.5 compared with the Ck. The overexpressing of WSD1 in A. thaliana showed a higher deposition of epicuticular wax crystals and increased leaf and stem wax load under stress [46]. Therefore, it can be hypothesized that S. europaea WS genes, especially SeWS1, −3, and −5, might have a similar function to AtWSD1 and play a specific role in wax ester metabolism under NaCl stress; this may be attributed to the high esters content under 600 NaCl stress in S. europaea.
In the decarbonylation pathway of wax biosynthesis, CERs play core role in alkane biosynthesis. Under NaCl treatment, the S. europaea CERs were distinctively expressed, especially SeCER1, which was expressed increasingly with a fold change 66.6, 85.2, and 96.7 in the shoot and root with the different treatment times and NaCl contents. In A. thaliana, AtCER1 and AtCER3 are reported to catalyze the conversion of long-chain aldehydes to alkanes, a key step in wax biosynthesis, and thereby increase the overall wax load [6,47]. Interestingly, AtCER3 share close a phylogenetic relationship with SeCER3, indicating that they may have similar functions that might contribute to the high alkane content in S. europaea, especially under the 600 mM NaCl treatment. Furthermore, the expression of SlCER1 and SlCER3 was significantly upregulated in one-month-old S. lycopersicum plants under stress, and the overexpression of SlCER1-1 significantly increased very-long-chain (VLC) alkane biosynthesis and wax accumulation. MAH enzymes hydroxylate alkanes at the subterminal carbon to form secondary alcohols, for instance, AtMAH1 converts wax alkanes to secondary alcohols and ketones [6]. The expression of SeMAHs was differentially expressed under the NaCl contents, however, SeMAH7 was revealed to have 3.7and 3.6-fold increase in the shoot under 600 mM NaCl for 12 h period. This suggests that under NaCl treatment, SeMAHs, especially SeMAH7, possibly catalyze wax alkanes to secondary alcohols and ketones in S. europaea (Figure 10), as reported in A. thaliana [6]. The expression of SeMAH5 higher in the root than shoot possibly plays a different role rather than wax alkane conversion. However, we recommend further functional analysis for SeMAH5, and −7.
FAOs have been reported to catalyze the oxidization of alcohols to produce aldehydes, the second step of the alkane oxidation pathway [48]. In S. europaea, SeFAO1 and −2 expression was evidently enhanced by high NaCl in the shoot than root while SeFAO4 was more enhanced in the root than shoot. These results suggested that SeFAO1 and SeFAO4 are possibly involved in balancing primary alcohol and aldehyde accumulation and modulation. This study demonstrated that both the decarbonylation and acyl-reduction pathways may not be independent from each other (Figure 10), which was confirmed by Yang et al. [49]. However, detailed molecular functional research is needed for further exploration.

4. Materials and Methods

4.1. Plant Growth Conditions and Stress Treatments

Wild S. europaea seeds were surface sterilized, washed, and grown for 3 days (d) in a Petri dish layered with moist, aseptic filter paper under darkness. The plantlets were transferred to containers of sterilized sand, soaked in ½ Hoagland nutrient solution, and renewed every 3 d [50]. The plantlets were placed in a growth chamber with a day/night temperature of 25/22 °C with 65% relative humidity. The daily photoperiod was 16/8 h (light and darkness) with a light flux density of 600 μmol/m2·s for 4 weeks.
The 4-week-old seedlings with the same growth situation were divided into two treatment groups: the first group was used for cuticle thickness and wax composition analysis whereas the second group was used for the cuticle wax biosynthesis gene expression analysis. The first group was subjected to 0 (Ck), 100, and 600 mM of NaCl treatment with three replicates/treatment for 10 d. For the cuticle thickness and wax morphology, observation, the middle node (third node from bottom) of the shoot was collected and conserved in FAA and glutaraldehyde until used. For the wax composition analysis, the whole seedling was collected and dried until use. The second group of seedlings was exposed to 0, 100, and 600 mM NaCl treatment for 0, 12, and 48 h [51,52]. There were three seedlings/replicate and three replicates/treatment. The shoots and roots were collected separately and quickly frozen in liquid nitrogen and stored at −80 °C for subsequent gene expression analysis.

4.2. Scanning Electron Microscopy (SEM) Analysis

Cryogenic scanning electron microscopy (cryo-SEM) was used to view the cuticular wax crystallization patterns. Samples were adhered to the cryo-holder using carbon tape and cryo-adhesive and plunged into liquid nitrogen slush. A vacuum was pulled, and the sample was transferred to a Gatan Alto 2500 pre-chamber for cooling to about −170 °C. The samples were then sputter coated with platinum for 60–120 s at 40 mA (BAL-TEC Sputter Coater SCD 050, Scotia, NY, USA) and transferred to the microscope cryostage for imaging. Coated surfaces were imaged using a FEI Quanta 250 SEM (FEI Co., Hillsboro, OR, USA), and a voltage of 3.00 kV was maintained while imaging the samples.

4.3. Oil Red Staining Procedure for Cuticle Analysis

Oil Red at 0.4% (w/v) was dissolved in carbon tetrachloride. Samples were placed in a vial immersed with the oil red solution and stained for 5 min at room temperature with agitation. Samples were then rinsed with water for 5 min with agitation. The water rinse was repeated four times, as stain globules could remain on the substrate. Stained materials were mounted in glycerin on slides with coverslips and observed with light microscopy (Axio Imager M2; Zeiss, Oberkochen, Germany).

4.4. Determination of Cuticular Wax Composition

Shoot samples were submerged in 25 mL of chloroform at 60 °C, and then 40 μL of n-octadecane was added for standardization. Evaporated wax extracts were placed under nitrogen gas to dry, then 100 ul pyridine derivatization was added at 70 °C for 60 min and 100 ul O-bis (trimethylsilyl) trifluoroacetamide (BSTFA). These were blown dried with N2 gas and then dissolved with 1.5 mL chloroform. After being silylated, the wax composition was analyzed by GC-MS (SHIMADZU GC—2014) equipped with HP-5MS UI capillary column (30 m × 0.250 mm × 0.5 μm). The volume of the sample injected was 1 μL, and helium as the carrier gas was pumped with a flow rate of 1.0 mL/min. Initially, the temperature of the injection port was 290 °C. The column temperature condition was 50 °C for 5 min and then increased at 5 °C/min and kept for 20 min. For the mass spectral analysis, the spectral conditions were 70 eV ionization energy, transmission line, and the quaternal rod temperatures were 230 °C, 315 °C, and 150 °C, respectively, and the mass scan range was 33–500 m/z with a 5 scans/s scan speed under full-scan mode.
Then, the cuticle wax compounds were calculated using Sc ÷ Sp1 × Sp2/Wv × Cv × Df, where Sc is the standard concentration (μg/mL), Sp1 is the standard peak area, Sp2 is the sample peak area, Wv is the weighing volume (mm2), Cv is the constant volume (mL) and Df is the dilution factor.

4.5. Cuticular Wax Biosynthesis Protein Sequence Search

A. thaliana wax biosynthesis protein sequences were obtained from the Arabidopsis information resource (TAIR) database (http://www.arabidopsis.org/, accessed on 12 August 2024) and used as reference sequences. The wax biosynthesis-related enzymes of S. europaea was extracted from the Salocornia Genome website (www.salicorniadb.org, accessed on 12 August 2024) [53]. The sequences were analyzed using DNAMAN version 8 software, confirmed by an online BLAST search in the NCBI database (https://blast.ncbi.nlm.nih.gov/, accessed on 13 August 2024), and HMMER software version 3.3.2 [54] was used to authenticate the putative protein sequence with A. thaliana as a query with the e-value set to be less than 1 × 10⁵.

4.6. Analysis of Physicochemical Properties and Subcellular Localization of Proteins

The online analysis software ExPASy (https://web.expasy.org/protparam/, accessed on 20 August 2024) was used for the analysis of the S. europaea wax biosynthesis proteins, isoelectric point (pI), molecular weight (MW), and other physical and chemical information. Then, the protein subcellular localization prediction software Cell-PLoc2.0 (http://www.csbio.sjtu.edu.cn/bioinf/Cell-PLoc-2/, accessed on 20 August 2024) was used for the wax biosynthesis family protein sequence analysis of subcellular localization prediction.

4.7. Sequence Alignment, Phylogenetic, and Conservative Motif Analysis

All putative proteins were used to generate multiple protein sequence alignments by using the default settings of ClustalW in MEGA 5.0 software [55]. All of the identified S. europaea wax biosynthesis proteins including related members of A. thaliana were used for phylogenetic tree construction in MEGA 5.0 software [56], with the maximum likelihood method and 1000 bootstrap replications. The MEME (https://meme-suite.org/meme/tools/meme, accessed on 1 October 2024) website was used for the S. europaea wax biosynthesis protein conservative motif analysis.

4.8. RNA Extraction and RT-qPCR Analysis

The total RNA was extracted from approximately 100 mg of the frozen shoot and root tissue using the TransZol Up Plus RNA Kit, no. Lot#M31018 (TransGen Biotech Co., Ltd., Beijing, China) according to the manufacturer’s instructions. RNA quantity and quality were examined using a TGen Spectrophotometer (TianGen Biotech Co. Ltd., Beijing, China) using A260 nm/A280 nm and A260 nm/A230 nm ratios. The Evo M-MLV RT Kit, no. AG11705 (Accurate Biotechnology Co., Ltd., Hunan, China) was used to reverse transcribe the total RNA into cDNA and remove genomic DNA mixed in the cDNA as per the manufacturer’s protocol.
The MIQE guidelines [57] were used to perform the RT-qPCR analysis. Primers were designed based on the cDNA sequences using Primer 5 software (Table S1) and synthesized by TsingKe Biological Technology Co. Ltd., Xi’an, China. The Ubiquitin-conjugating (UBC) gene was used as a housekeeping/internal control gene [58], and the primer pair specificity was determined using qRT-PCR single peak melting curve analysis [57]. Three independent biological replicates were performed, and triplicate technical quantitative assays were performed using the Heiff® qPCR SYBR® Green Master Mix Kit (Yeasen Biotech Co. Ltd., Shanghai, China) according to the manufacturer’s protocol. The RT-qPCR analysis was performed using a QuantStudio™ 5 Real-Time PCR instrument (ABI, Life Technologies Holdings Pte. Ltd., Singapore). The relative expression was calculated according to the method of Livak and Schmittgen [59].

4.9. Data Analyses

The ImageJ software package (version 1.46r) was used to count the wax density with three SEM images as replicates per treatment. CaseViewer 2.4 software (3DHISTECH) was used to measure the cuticle thickness with a 20 µm image resolution; six sections were used as replicates. Duncan’s test in SPSS Statistics 20.0 was used for statistical analysis of all of the parameters measured.

5. Conclusions

High NaCl treatment enhanced the wax accumulation and cuticle thickness in S. europaea. Crystals wax structures were observed, and a high NaCl treatment was suggested to enhance the density of the crystal wax structures. The cuticle wax of the shoot was composed of alcohols, fatty acids, alkenes, and esters; the alcohols accounted for the largest component. After the sequence database search, six SeFARs, sixteen SeWSs, three SeFAOs, five SeCERs, and eight SeMAHs cuticular wax biosynthesis genes were identified in S. europaea. The expression analysis of these genes indicated significant differential expression patterns regulated by NaCl treatment among the different tissues, at time points of 0, 12, and 48 h. The expression of the various wax biosynthesis genes suggests that the salt stress response involves the induction of the acyl-reduction pathway and decarbonylation pathway.

Supplementary Materials

The following supporting information can be downloaded at: https://www.mdpi.com/article/10.3390/ijms26062632/s1.

Author Contributions

Conceptualization, H.D. and R.J.T.; Methodology, H.D.; Software, R.J.T.; Validation, Y.M.; Formal analysis, G.C.; Investigation, H.Y.; Data curation, R.J.T.; Writing—original draft preparation, R.J.T.; Writing—review and editing, S.B. and H.D.; Visualization, R.J.T.; Supervision, Y.L. and H.D.; Funding acquisition, Y.L. and H.D. All authors have read and agreed to the published version of the manuscript.

Funding

This research was funded by the Provincial Talent Project of Gansu Province (individual project, 2024), the Youth innovation of Chinese Academy of Agricultural Sciences (Y2023QC31), the Science and Technology Innovation Program of Lanzhou Institute of Husbandry and Pharmaceutical Science, Chinese Academy of Agricultural Sciences (CAAS-LMY-04), the Gansu Province University Industry Support Plan (2023 CYZC-46), and the Science and Technology Project of Gansu Province (25JRRA452).

Institutional Review Board Statement

Not applicable.

Informed Consent Statement

Not applicable.

Data Availability Statement

The data are contained within this article and Supplementary Materials.

Conflicts of Interest

The authors declare no conflicts of interest.

References

  1. Zhang, Z.; Li, X.; Wang, Y. Evaluation of salt tolerance of 59 alfalfa germplasm materials at seedling stage and screening of salt tolerance indexes. Acta Grassl. 2020, 28, 112–121. [Google Scholar]
  2. Zörb, C.; Geilfus, C.M.; Dietz, K.-J. Salinity and Crop Yield. Plant Biol. 2018, 21, 31–38. [Google Scholar] [CrossRef]
  3. Shaheenuzzamn, M.; Shi, S.; Sohail, K.; Wu, H.; Liu, T.; An, P.; Wang, Z.; Hasanuzzaman, M. Regulation of cuticular wax biosynthesis in plants under abiotic stress. Plant Biotechnol. Rep. 2021, 15, 1–12. [Google Scholar] [CrossRef]
  4. Zhang, P.; Zou, Y.; Song, B.; Zhou, M.; He, J.; Chen, Y.; Zhou, Y.; Xu, X. Cuticular lipids and associated gene expression analysis under NaCl stress in Thellungiella salsuginea. Physiol. Plant. 2022, 174, e13625. [Google Scholar] [CrossRef] [PubMed]
  5. Lee, S.B.; Suh, M.C. Advances in the understanding of cuticular waxes in Arabidopsis thaliana and crop species. Plant Cell Rep. 2015, 34, 557–572. [Google Scholar] [CrossRef]
  6. Bernard, A.; Joubès, J. Arabidopsis cuticular waxes: Advances in synthesis, export and regulation. Prog. Lipid Res. 2013, 52, 110–129. [Google Scholar] [CrossRef] [PubMed]
  7. Nawrath, C.; Schreiber, L.; Franke, R.B.; Geldner, N.; Reina-Pinto, J.J.; Kunst, L. Apoplastic diffusion barriers in Arabidopsis. Arab. Book/Am. Soc. Plant Biol. 2013, 11, e0167. [Google Scholar] [CrossRef]
  8. Xue, D.; Zhang, X.; Lu, X.; Chen, G.; Chen, Z.H. Molecular and evolutionary mechanisms of cuticular wax for plant drought tolerance. Front. Plant Sci. 2017, 8, 621. [Google Scholar] [CrossRef]
  9. Vogg, G.; Fischer, S.; Leide, J.; Emmanuel, E.; Jetter, R.; Levy, A.A.; Riederer, M. Tomato fruit cuticular waxes and their effects on transpiration barrier properties: Functional characterization of a mutant deficient in a very-long-chain fatty acid β-ketoacyl-CoA synthase. J. Exp. Bot. 2004, 55, 1401–1410. [Google Scholar] [CrossRef]
  10. Xu, X.; Xue, K.; Tang, S.; He, J.; Song, B.; Zhou, M.; Zou, Y.; Zhou, Y.; Jenks, M.A. The relationship between cuticular lipids and associated gene expression in above ground organs of Thellungiella salsugineum (Pall.) Al-Shehbaz & Warwick. Plant Sci. 2019, 287, 110200. [Google Scholar] [CrossRef]
  11. Lv, S.; Tai, F.; Guo, J.; Jiang, P.; Lin, K.; Wang, D.; Zhang, X.; Li, Y. Phosphatidylserine Synthase from Salicornia europaea Is Involved in Plant Salt Tolerance by Regulating Plasma Membrane Stability. Plant Cell Physiol. 2021, 62, 66–79. [Google Scholar] [CrossRef] [PubMed]
  12. Nie, L.; Feng, J.; Fan, P.; Chen, X.; Guo, J.; Lv, S.; Bao, H.; Jia, W.; Tai, F.; Jiang, P.; et al. Comparative proteomics of root plasma membrane proteins reveals the involvement of calcium signalling in NaCl-facilitated nitrate uptake in Salicornia europaea. J. Exp. Bot. 2015, 66, 4497–4510. [Google Scholar] [CrossRef]
  13. Singh, D.; Buhmann, A.K.; Flowers, T.J.; Seal, C.E.; Papenbrock, J. Salicornia as a crop plant in temperate regions: Selection of genetically characterized ecotypes and optimization of their cultivation conditions. AoB Plants 2014, 6, plu071. [Google Scholar] [CrossRef] [PubMed]
  14. Shpigel, M.; Ben-Ezra, D.; Shauli, L.; Sagi, M.; Ventura, Y.; Samocha, T.; Lee, J.J. Constructed wetland with Salicornia as a biofilter for mariculture effluents. Aquaculture 2013, 412, 52–63. [Google Scholar] [CrossRef]
  15. Lv, S.; Jiang, P.; Nie, L.; Chen, X.; Tai, F.; Wang, D.; Fan, P.; Feng, J.; Bao, H.; Wang, J. H+-pyrophosphatase from S alicornia europaea confers tolerance to simultaneously occurring salt stress and nitrogen deficiency in Arabidopsis and wheat. Plant Cell Environ. 2015, 38, 2433–2449. [Google Scholar] [CrossRef]
  16. Duan, H.; Tiika, R.J.; Tian, F.; Lu, Y.; Zhang, Q.; Hu, Y.; Cui, G.; Yang, H. Metabolomics analysis unveils important changes involved in the salt tolerance of Salicornia europaea. Front. Plant Sci. 2023, 13, 1097076. [Google Scholar] [CrossRef] [PubMed]
  17. Feng, J.; Wang, J.; Fan, P.; Jia, W.; Nie, L.; Jiang, P.; Chen, X.; Lv, S.; Wan, L.; Chang, S.; et al. High-throughput deep sequencing reveals that microRNAs play important roles in salt tolerance of euhalophyte Salicornia europaea. BMC Plant Biol. 2015, 15, 63. [Google Scholar] [CrossRef]
  18. Singh, D.; Jha, B. The isolation and identification of salt-responsive novel microRNAs from Salicornia brachiata, an extreme halophyte. Plant Biotechnol. Rep. 2014, 8, 325–336. [Google Scholar] [CrossRef]
  19. Zhou, D.; Ding, M.; Wen, S.; Tian, Q.; Zhang, X.; Fang, Y.; Xue, D. Characterization of the Fatty Acyl-CoA Reductase (FAR) Gene Family and Its Response to Abiotic Stress in Rice (Oryza sativa L.). Plants 2024, 13, 1010. [Google Scholar] [CrossRef]
  20. Domergue, F.; Vishwanath, S.J.; Joubès, J.; Ono, J.; Lee, J.A.; Bourdon, M.; Alhattab, R.; Lowe, C.; Pascal, S.; Lessire, R.; et al. Three Arabidopsis Fatty Acyl-Coenzyme A Reductases, FAR1, FAR4, and FAR5, Generate Primary Fatty Alcohols Associated with Suberin Deposition. Plant Physiol. 2010, 153, 1539–1554. [Google Scholar] [CrossRef]
  21. Rosli, R.; Chan, P.-L.; Chan, K.-L.; Amiruddin, N.; Low, E.-T.L.; Singh, R.; Harwood, J.L.; Murphy, D.J. In silico characterization and expression profiling of the diacylglycerol acyltransferase gene family (DGAT1, DGAT2, DGAT3 and WS/DGAT) from oil palm, Elaeis guineensis. Plant Sci. 2018, 275, 84–96. [Google Scholar] [CrossRef] [PubMed]
  22. Li, F.; Wu, X.; Lam, P.; Bird, D.; Zheng, H.; Samuels, L.; Jetter, R.; Kunst, L. Identification of the Wax Ester Synthase/Acyl-Coenzyme A:Diacylglycerol Acyltransferase WSD1 Required for Stem Wax Ester Biosynthesis in Arabidopsis. Plant Physiol. 2008, 148, 97–107. [Google Scholar] [CrossRef]
  23. Pan, F.; Li, X.; Zhong, D.; Lu, X.; Pan, C.; Hu, J.; Su, W.; Zhang, H.; Zhang, C.; Shi, L.; et al. Eceriferum Genes in Tomato (Solanum lycopersicum): Genome-Wide Identification and Expression Analysis Reveal Their Potential Functions during Domestication. Horticulturae 2023, 9, 748. [Google Scholar] [CrossRef]
  24. Rizwan, H.M.; Waheed, A.; Ma, S.; Li, J.; Arshad, M.B.; Irshad, M.; Li, B.; Yang, X.; Ali, A.; Ahmed, M.A.A. Comprehensive genome-wide identification and expression profiling of eceriferum (CER) gene family in passion fruit (Passiflora edulis) under fusarium kyushuense and drought stress conditions. Front. Plant Sci. 2022, 13, 898307. [Google Scholar] [CrossRef]
  25. Li, N.; Li, X.Z.; Song, Y.Q.; Yang, S.T.; Li, L.L. Genome-Wide Identification, Characterization, and Expression Profiling of the ECERIFERUM (CER) Gene Family in Ziziphus jujube. Russ. J. Plant Physiol. 2021, 68, 828–837. [Google Scholar] [CrossRef]
  26. Chen, G.; Komatsuda, T.; Ma, J.F.; Li, C.; Yamaji, N.; Nevo, E. A functional cutin matrix is required for plant protection against water loss. Plant Signal. Behav. 2011, 6, 1297–1299. [Google Scholar] [CrossRef]
  27. Mills, D.; Zhang, G.; Benzioni, A. Effect of different salts and of ABA on growth and mineral uptake in Jojoba shoots grown in vitro. J. Plant Physiol. 2001, 158, 1031–1039. [Google Scholar] [CrossRef]
  28. Liu, N.; Chen, J.; Wang, T.; Li, Q.; Cui, P.; Jia, C.; Hong, Y. Overexpression of WAX INDUCER1/SHINE1 Gene Enhances Wax Accumulation under Osmotic Stress and Oil Synthesis in Brassica napus. Int. J. Mol. Sci. 2019, 20, 4435. [Google Scholar] [CrossRef]
  29. Wen, X.; Geng, F.; Cheng, Y.; Wang, J. Ectopic expression of CsMYB30 from Citrus sinensis enhances salt and drought tolerance by regulating wax synthesis in Arabidopsis thaliana. Plant Physiol. Biochem. 2021, 166, 777–788. [Google Scholar] [CrossRef]
  30. Tomaszewski, D.; Zieliński, J. Epicuticular wax structures on stems and comparison between stems and leaves—A survey. Flora-Morphol. Distrib. Funct. Ecol. Plants 2014, 209, 215–232. [Google Scholar] [CrossRef]
  31. Chen, X.; Goodwin, S.M.; Boroff, V.L.; Liu, X.; Jenks, M.A. Cloning and Characterization of the WAX2 Gene of Arabidopsis Involved in Cuticle Membrane and Wax Production. Plant Cell 2003, 15, 1170–1185. [Google Scholar] [CrossRef] [PubMed]
  32. Zhang, J.Y.; Broeckling, C.D.; Blancaflor, E.B.; Sledge, M.K.; Sumner, L.W.; Wang, Z.Y. Overexpression of WXP1, a putative Medicago truncatula AP2 domain-containing transcription factor gene, increases cuticular wax accumulation and enhances drought tolerance in transgenic alfalfa (Medicago sativa). Plant J. 2005, 42, 689–707. [Google Scholar] [CrossRef] [PubMed]
  33. Koch, K.; Dommisse, A.; Barthlott, W. Chemistry and crystal growth of plant wax tubules of lotus (Nelumbo nucifera) and nasturtium (Tropaeolum majus) leaves on technical substrates. Cryst. Growth Des. 2006, 6, 2571–2578. [Google Scholar] [CrossRef]
  34. Borisjuk, N.; Peterson, A.A.; Lv, J.; Qu, G.; Luo, Q.; Shi, L.; Chen, G.; Kishchenko, O.; Zhou, Y.; Shi, J. Structural and biochemical properties of duckweed surface cuticle. Front. Chem. 2018, 6, 317. [Google Scholar] [CrossRef] [PubMed]
  35. Zhang, X.; Liu, Y.; Ayaz, A.; Zhao, H.; Lü, S. The Plant Fatty Acyl Reductases. Int. J. Mol. Sci. 2022, 23, 16156. [Google Scholar] [CrossRef]
  36. Zhang, S.; Wu, S.; Niu, C.; Liu, D.; Yan, T.; Tian, Y.; Liu, S.; Xie, K.; Li, Z.; Wang, Y.; et al. ZmMs25 encoding a plastid-localized fatty acyl reductase is critical for anther and pollen development in maize. J. Exp. Bot. 2021, 72, 4298–4318. [Google Scholar] [CrossRef]
  37. Stöveken, T.; Kalscheuer, R.; Steinbüchel, A. Both histidine residues of the conserved HHXXXDG motif are essential for wax ester synthase/acyl-CoA: Diacylglycerol acyltransferase catalysis. Eur. J. Lipid Sci. Technol. 2009, 111, 112–119. [Google Scholar] [CrossRef]
  38. Wang, H.-b.; Lv, X.-y.; Li, Y.-y.; Jiang, H. Identification and Expression Analysis of WSD (Wax Ester Synthase/Diacylglycerol Acyltransferase) Gene Family in Apple. Erwerbs-Obstbau 2023, 65, 633–644. [Google Scholar] [CrossRef]
  39. Zhang, N.; Mao, Z.; Luo, L.; Wan, X.; Huang, F.; Gong, Y. Two bifunctional enzymes from the marine protist Thraustochytrium roseum: Biochemical characterization of wax ester synthase/acyl-CoA:diacylglycerol acyltransferase activity catalyzing wax ester and triacylglycerol synthesis. Biotechnol. Biofuels 2017, 10, 185. [Google Scholar] [CrossRef]
  40. Vanhanen, S.; West, M.; Kroon, J.T.; Lindner, N.; Casey, J.; Cheng, Q.; Elborough, K.M.; Slabas, A.R. A consensus sequence for long-chain fatty-acid alcohol oxidases from Candida identifies a family of genes involved in lipid omega-oxidation in yeast with homologues in plants and bacteria. J. Biol. Chem. 2000, 275, 4445–4452. [Google Scholar] [CrossRef]
  41. Cheng, Q.; Liu, H.T.; Bombelli, P.; Smith, A.; Slabas, A.R. Functional identification of AtFao3, a membrane bound long chain alcohol oxidase in Arabidopsis thaliana. FEBS Lett. 2004, 574, 62–68. [Google Scholar] [CrossRef] [PubMed]
  42. Chaudhary, K.; Geeta, R.; Panjabi, P. Origin and diversification of ECERIFERUM1 (CER1) and ECERIFERUM3 (CER3) genes in land plants and phylogenetic evidence that the ancestral CER1/3 gene resulted from the fusion of pre-existing domains. Mol. Phylogenet. Evol. 2021, 159, 107101. [Google Scholar] [CrossRef] [PubMed]
  43. Darnet, S.; Bard, M.; Rahier, A. Functional identification of sterol-4α-methyl oxidase cDNAs from Arabidopsis thaliana by complementation of a yeast erg25 mutant lacking sterol-4α-methyl oxidation1. FEBS Lett. 2001, 508, 39–43. [Google Scholar] [CrossRef] [PubMed]
  44. Rowland, O.; Zheng, H.; Hepworth, S.R.; Lam, P.; Jetter, R.; Kunst, L. CER4 Encodes an Alcohol-Forming Fatty Acyl-Coenzyme A Reductase Involved in Cuticular Wax Production in Arabidopsis. Plant Physiol. 2006, 142, 866–877. [Google Scholar] [CrossRef]
  45. Round, J.; Roccor, R.; Li, S.-N.; Eltis, L.D. A Fatty Acyl Coenzyme A Reductase Promotes Wax Ester Accumulation in Rhodococcus jostii RHA1. Appl. Environ. Microbiol. 2017, 83, e00902–e00917. [Google Scholar] [CrossRef]
  46. Abdullah, H.; Rodriguez, J.; Salacup, J.; Castañeda, I.; Schnell, D.; Pareek, A.; Dhankher, O.P. Increased Cuticle Waxes by Overexpression of WSD1 Improves Osmotic Stress Tolerance in Arabidopsis thaliana and Camelina sativa. Int. J. Mol. Sci. 2021, 22, 5173. [Google Scholar] [CrossRef]
  47. Bernard, A.; Domergue, F.; Pascal, S.; Jetter, R.; Renne, C.; Faure, J.-D.; Haslam, R.P.; Napier, J.A.; Lessire, R.; Joubès, J. Reconstitution of Plant Alkane Biosynthesis in Yeast Demonstrates That Arabidopsis ECERIFERUM1 and ECERIFERUM3 Are Core Components of a Very-Long-Chain Alkane Synthesis Complex. Plant Cell 2012, 24, 3106–3118. [Google Scholar] [CrossRef]
  48. Goswami, P.; Chinnadayyala, S.S.R.; Chakraborty, M.; Kumar, A.K.; Kakoti, A. An overview on alcohol oxidases and their potential applications. Appl. Microbiol. Biotechnol. 2013, 97, 4259–4275. [Google Scholar] [CrossRef]
  49. Yang, X.; Cui, L.; Li, S.; Ma, C.; Kosma, D.K.; Zhao, H.; Lü, S. Fatty alcohol oxidase 3 (FAO3) and FAO4b connect the alcohol- and alkane-forming pathways in Arabidopsis stem wax biosynthesis. J. Exp. Bot. 2021, 73, 3018–3029. [Google Scholar] [CrossRef]
  50. Wei, J.; Tiika, R.J.; Ma, Y.; Yang, H.; Cui, G.; Tian, F.; Zhang, Y.; Duan, H.; Ma, R. Transcriptome-wide identification and analysis of the KT/HAK/KUP family in black goji under NaCl stress. Agron. J. 2022, 114, 2069–2080. [Google Scholar] [CrossRef]
  51. Tiika, R.J.; Wei, J.; Cui, G.; Ma, Y.; Yang, H.; Duan, H. Transcriptome-wide characterization and functional analysis of Xyloglucan endo-transglycosylase/hydrolase (XTH) gene family of Salicornia europaea L. under salinity and drought stress. BMC Plant Biol. 2021, 21, 491. [Google Scholar] [CrossRef] [PubMed]
  52. Lü, X.P.; Gao, H.J.; Zhang, L.; Wang, Y.P.; Shao, K.Z.; Zhao, Q.; Zhang, J.L. Dynamic responses of Haloxylon ammodendron to various degrees of simulated drought stress. Plant Physiol. Biochem. PPB 2019, 139, 121–131. [Google Scholar] [CrossRef]
  53. Salazar, O.R.; Chen, K.; Melino, V.J.; Reddy, M.P.; Hřibová, E.; Čížková, J.; Beránková, D.; Arciniegas Vega, J.P.; Cáceres Leal, L.M.; Aranda, M.; et al. SOS1 tonoplast neo-localization and the RGG protein SALTY are important in the extreme salinity tolerance of Salicornia bigelovii. Nat. Commun. 2024, 15, 4279. [Google Scholar] [CrossRef] [PubMed]
  54. Finn, R.D.; Clements, J.; Eddy, S.R. HMMER web server: Interactive sequence similarity searching. Nucleic Acids Res. 2011, 39, W29–W37. [Google Scholar] [CrossRef]
  55. Larkin, M.A.; Blackshields, G.; Brown, N.P.; Chenna, R.; McGettigan, P.A.; McWilliam, H.; Valentin, F.; Wallace, I.M.; Wilm, A.; Lopez, R.; et al. Clustal W and Clustal X version 2.0. Bioinformatics 2007, 23, 2947–2948. [Google Scholar] [CrossRef] [PubMed]
  56. Tamura, K.; Peterson, D.; Peterson, N.; Stecher, G.; Nei, M.; Kumar, S. MEGA5: Molecular evolutionary genetics analysis using maximum likelihood, evolutionary distance, and maximum parsimony methods. Mol. Biol. Evol. 2011, 28, 2731–2739. [Google Scholar] [CrossRef] [PubMed]
  57. Bustin, S.A.; Benes, V.; Garson, J.A.; Hellemans, J.; Huggett, J.; Kubista, M.; Mueller, R.; Nolan, T.; Pfaffl, M.W.; Shipley, G.L.; et al. The MIQE guidelines: Minimum information for publication of quantitative real-time PCR experiments. Clin. Chem. 2009, 55, 611–622. [Google Scholar] [CrossRef]
  58. Xiao, X.; Ma, J.; Wang, J.; Wu, X.; Li, P.; Yao, Y. Validation of suitable reference genes for gene expression analysis in the halophyte Salicornia europaea by real-time quantitative PCR. Front. Plant Sci. 2014, 5, 788. [Google Scholar] [CrossRef]
  59. Livak, K.J.; Schmittgen, T.D. Analysis of relative gene expression data using real-time quantitative PCR and the 2(-Delta Delta C(T)) Method. Methods 2001, 25, 402–408. [Google Scholar] [CrossRef]
Figure 1. S. europaea under NaCl treatment after 10 d. (A) Shoot cuticle stained with oil red and (B) Cuticle thickness. Ck indicates the control, 100 Na indicates 100 mM NaCl, and 600 Na indicates 600 mM NaCl. Values are the means ± SD, and the bars with different letters indicate significant differences at p < 0.05 (Duncan’s test). Scale bar = 20 μm.
Ijms 26 02632 g001
Figure 2. SEM images of the surface wax morphology of the S. europaea shoot. (A) Wax loss, (B) Wax crystal, and (C) Wax crystal density under NaCl treatment. The blue arrow indicates the dropping wax, red shows the crystal wax. Ck indicates the control (0 mM NaCl), 100 Na indicates 100 mM NaCl, and 600 Na indicates 600 mM NaCl. Values are the means ± SD, and bars with different letters indicate significant differences at p < 0.05 (Duncan’s test). Scale bar = 50 μm and 5 μm.
Ijms 26 02632 g002
Figure 3. NaCl-treatment on the S. europaea wax. (A) Total wax content, (B) Wax compounds distribution, (C) Wax compound content under NaCl treatment; values are the means ± SD and bars with different letters indicate significant differences among the NaCl treatments and wax compounds at p < 0.05 (Duncan’s test), (D) Specific wax compounds; C19H40O2Si (palmitic acid trimethylsilyl), C21H38O2Si (α-linolenic acid), C21H40O2Si (linoleic acid), C21H44O2Si (stearic acid), C21H46OSi (octadecanol), C23H50OSi (eicosanol), C25H54OSi (docosanol), C26H56OSi (tricosanol), C27H58OSi (1-tetracosanol), C28H60OSi (pentacosan-1-ol), C29H62OSi (1-hexacosanol), C34H72OSi (1-octacosanol), C18H38 (n-octadecane), and C19H42O5Si3 (decanedioic acid). Ck indicates the control, 100 Na indicates 100 mM NaCl, 600 Na indicates 600 mM NaCl, single asterisk indicates significance (p < 0.05), and a double asterisk indicates evidently significant (p < 0.01).
Ijms 26 02632 g003
Figure 4. Multiple sequence alignment. (A) Sequence alignment of the SeFAR proteins; sequence in the red box indicates the binding site motif and the yellow box shows the active site motif. (B) Sequence alignment of the SeWS/DGAT proteins; the black and red boxes indicate the WES-acyltransf and DUF1298 domains, and the red stars show the position of the active site motif. (C) Sequence alignment of the CER proteins, His-rich motifs are indicated in the black boxes, and the red box indicates the LEGW motif. (D) Sequence alignment of the FAO proteins, the flavin-binding, and cytochrome c family heme-binding sites are indicated in the red boxes. (E) Sequence alignment of the MAH proteins; the PERF domain and heme-binding region are indicated with blue and black boxes, respectively.
Ijms 26 02632 g004
Figure 5. Phylogenetic tree of the FAR, WS, FAO, CER, and MAH genes of A. thaliana and S. europaea.
Ijms 26 02632 g005
Figure 6. Distribution of conserved motifs. (A) SeFAR conserved motifs; (B) SeWS conserved motifs, (C) SeCER conserved motifs, (D) SeMAH conserved motifs, and (E) SeFAO conserved motifs. The different colored boxes represent different motifs and their position in each wax biosynthesis protein. Motifs are indicated by a colored box in the legend at the bottom (1–10).
Ijms 26 02632 g006
Figure 7. qRT-PCR expression of the SeFAR and SeCER genes in S. europaea. (AF) SeFARs and (GK) SeCER genes. Values are the means ± SD and the bars indicate error bars.
Ijms 26 02632 g007
Figure 8. qRT-PCR expression of the SeWS genes in S. europaea. (AP) SeWS1 to SeWS16. Values are the means ± SD and the bars indicate error bars.
Ijms 26 02632 g008
Figure 9. qRT-PCR expression of the SeMAH and SeFAO genes in S. europaea. (AH) SeMAHs and (IK) SeFAOs. Values are the means ± SD and the bars indicate error bars.
Ijms 26 02632 g009
Figure 10. Graphical model of wax biosynthesis under NaCl treatment in S. europaea. (A) Control and (B) NaCl treatment. Genes highlighted in red bold indicate significant expression, green highlighted words are wax compounds promoted by the wax biosynthesis genes, black bold arrows show the expressed gene promotion of wax compounds, and green lines indicate the wax compound contribution to the cuticular wax mixture.
Ijms 26 02632 g010
Table 1. Properties of the wax biosynthesis proteins and the subcellular localization prediction of S. europaea.
Protein NameGene IDAmino AcidsMolecular
Weight/kD
Theoretical
pI
Instability
Index (II)
Aliphatic
Index
Subcellular
Localization
SeFAR1>Seu_jg1952048955.607.9928.3496.50Golg
SeFAR2>Seu_jg1952148855.238.7622.97106.82Chlo
SeFAR3>Seu_jg829149256.028.6635.3197.05Chlo
SeFAR4>Seu_jg2535360668.798.3537.58100.02Chlo
SeFAR5>Seu_jg2326960066.798.8537.4885.07Chlo
SeFAR6>Seu_jg1951948855.278.8525.6998.81Golg
SeMAH1>Seu_jg1332848656.528.8129.1093.42ER
SeMAH2>Seu_jg2408043350.167.6829.4891.36ER
SeMAH3>Seu_jg2408139746.098.7628.6392.77ER
SeMAH4>Seu_jg2408648856.798.4531.6594.02ER
SeMAH5>Seu_jg2408951359.096.5638.8292.32ER
SeMAH6>Seu_jg1793650758.838.1036.3188.64ER
SeMAH7>Seu_jg1516131436.625.9433.2294.87ER
SeMAH8>Seu_jg1516212113.709.3325.9481.49ER
SeCER1>Seu_jg1448962273.028.9337.9994.77Vac
SeCER2>Seu_jg666762571.998.9332.36101.52Vac
SeCER3>Seu_jg1992262371.529.1935.87103.56Vac
SeCER4>Seu_jg666862071.379.0032.14100.13Vac
SeCER5>Seu_jg666911412.835.5347.0271.84Chlo
SeWS1>Seu_jg1281546051.995.8429.7597.87Cyto
SeWS2>Seu_jg1281614916.875.9128.51110.60Cm, Chlo, Nuc
SeWS3>Seu_jg1281816318.755.4238.0884.91Nuc
SeWS4>Seu_jg607952358.988.0637.2997.67Chlo
SeWS5>Seu_jg608054160.688.3639.1296.38Chlo
SeWS6>Seu_jg608152159.099.3130.2794.26Per
SeWS7>Seu_jg1807948553.909.1034.6190.19Chlo
SeWS8>Seu_jg2046746151.376.4736.8690.15Cm, Chlo, Nuc
SeWS9>Seu_jg2046848054.069.0631.77100.44Cm, Chlo
SeWS10>Seu_jg2046947653.238.7037.9794.98Chlo
SeWS11>Seu_jg2058349656.589.4338.1794.29Chlo
SeWS12>Seu_jg2058448955.689.2844.9687.48Chlo
SeWS13>Seu_jg2100947352.306.3945.6691.10Chlo
SeWS14>Seu_jg2113215316.868.6035.1498.82Cm, Chlo
SeWS15>Seu_jg2113349154.918.8638.3199.04Chlo
SeWS16>Seu_jg2113439944.858.7241.6196.74Chlo, Cyto
SeFAO1>Seu_jg2818577084.668.7035.6382.31Chlo, Vac
SeFAO2>Seu_jg351372979.368.8532.8387.34Chlo, Mito
SeFAO4>Seu_jg1262781390.228.3136.4781.64Chlo, Vac
Golg: Golgi apparatus, Chlo: chloroplast, ER: endoplasmic reticulum, Vac: vacuole, Per: peroxisome, Cm: cell membrane, Cyto: cytoplasm, Nuc: nucleus, Mito: mitochondrion.
Disclaimer/Publisher’s Note: The statements, opinions and data contained in all publications are solely those of the individual author(s) and contributor(s) and not of MDPI and/or the editor(s). MDPI and/or the editor(s) disclaim responsibility for any injury to people or property resulting from any ideas, methods, instructions or products referred to in the content.

