
Residential Proximity, Duration, and Health-Related Quality of Life: Insights from the Fernald Cohort


Abstract
:1. Introduction
2. Materials and Methods
2.1. Participants
2.2. Data Collection
2.3. Health-Related Quality of Life Tools and Scoring
2.4. Determinants of the HRQoL
2.5. Statistical Analysis
3. Results
3.1. Baseline Characteristics
3.2. Initial Questionnaire Characteristics
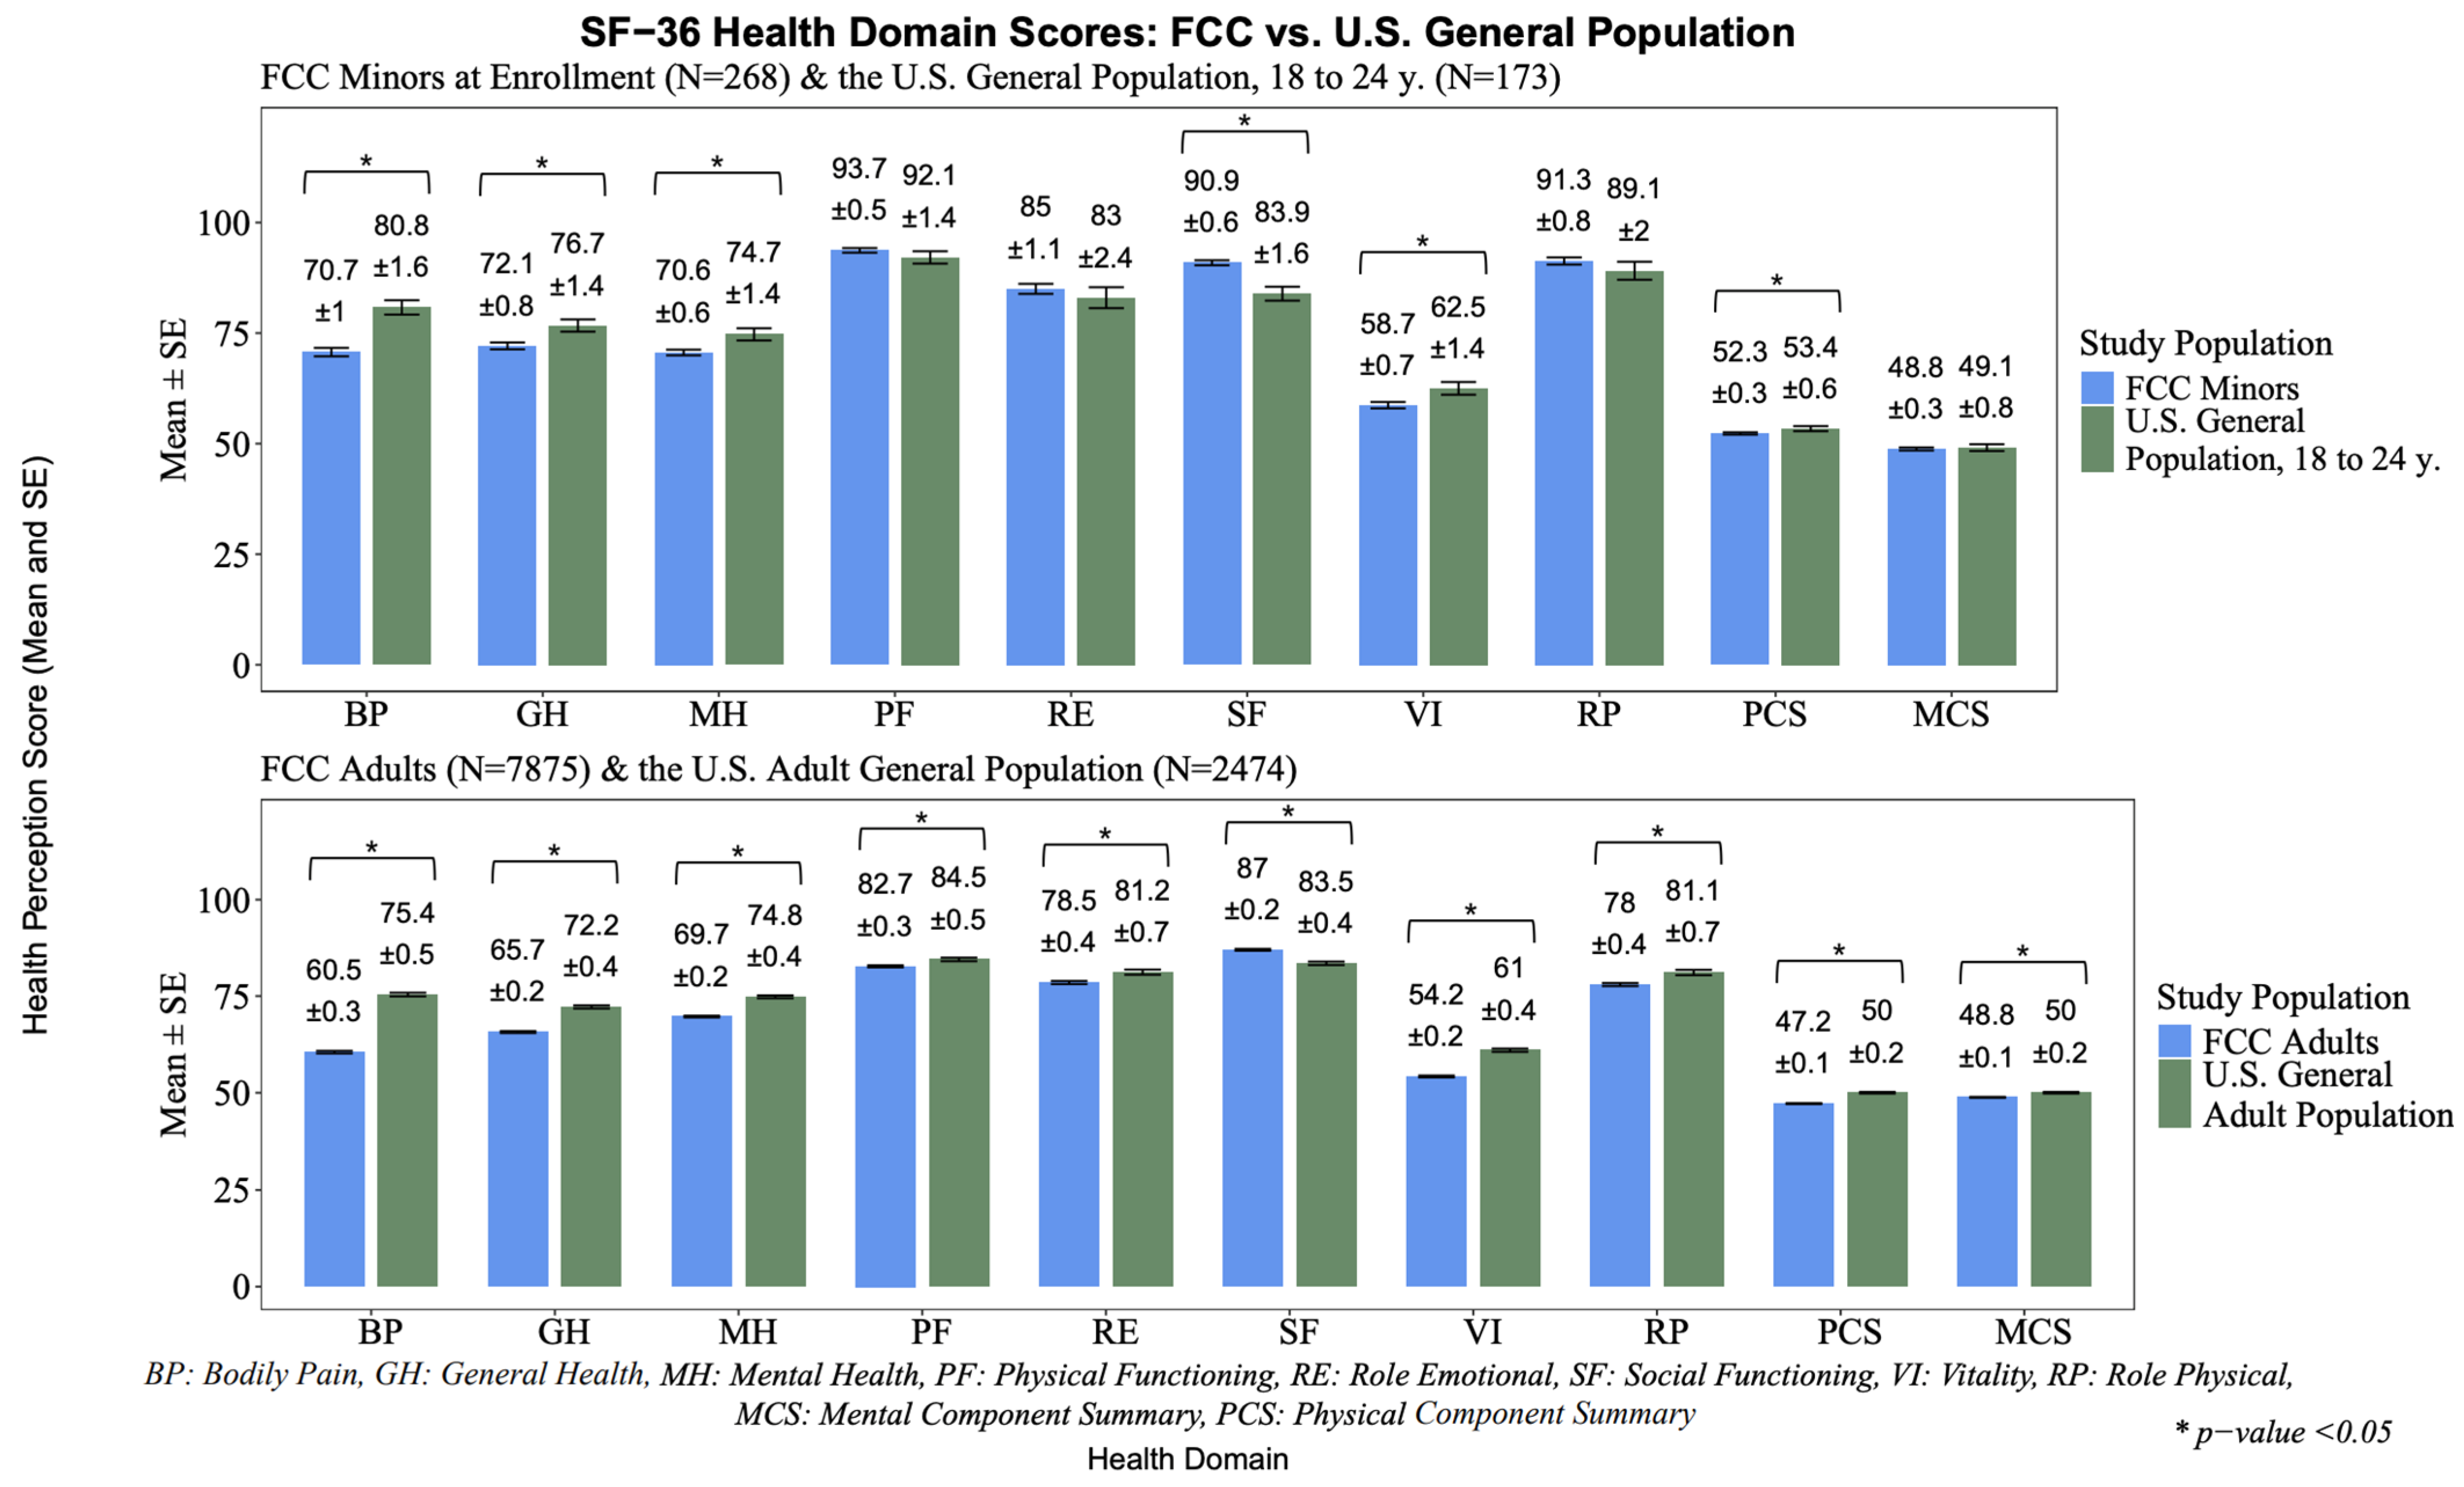
3.3. HRQoL Differences Within the Cohort and Comparisons with the U.S. General Population
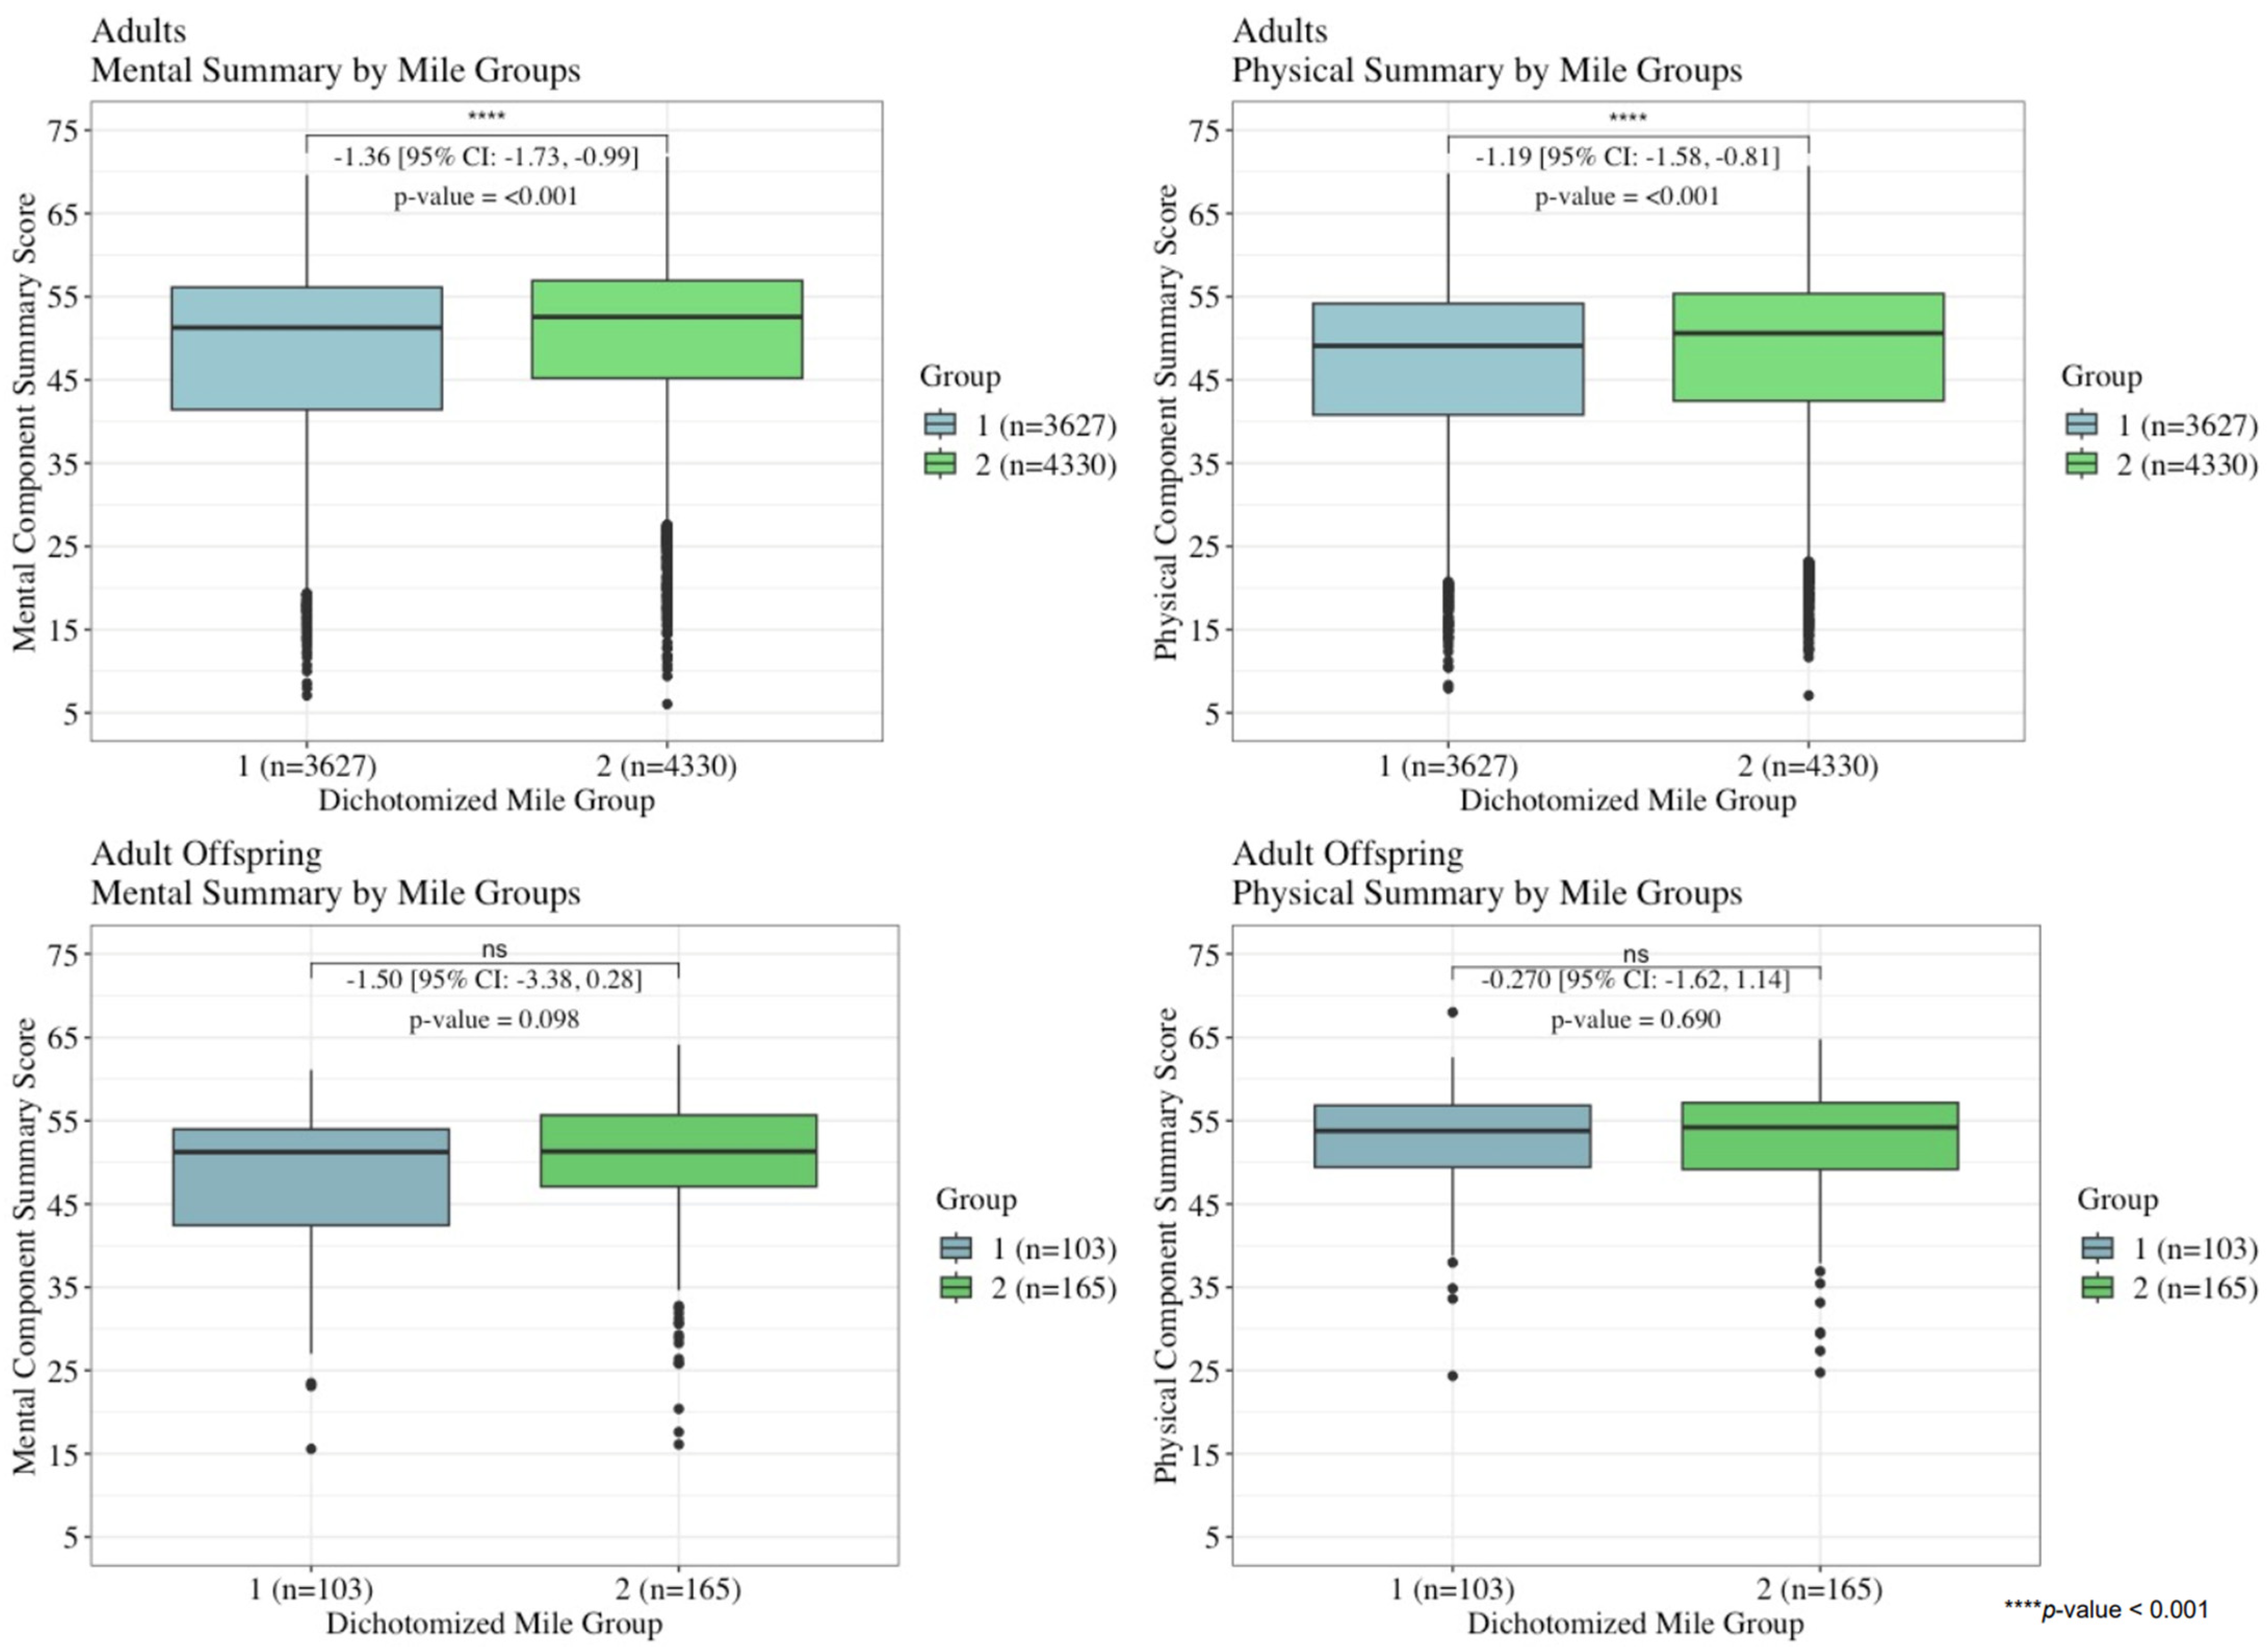
3.4. The Closest Residential Proximity to the Environmental Contamination and the Corresponding HRQoL Outcomes
3.5. The Results of the Sensitivity Analysis
3.6. Models’ Covariates
4. Discussion
4.1. Comparisons with Other Studies
4.2. Strengths
4.3. Limitations
5. Conclusions
Author Contributions
Funding
Institutional Review Board Statement
Informed Consent Statement
Data Availability Statement
Acknowledgments
Conflicts of Interest
Abbreviations
| BMI | Body mass index |
| CEC | Chronic environmental contamination |
| DSM-5 | Diagnostic and Statistical Manual of Mental Disorders, Fifth Edition |
| FCC | Fernald Community Cohort |
| FCS | Fully conditional specification |
| FMPC | Feed Materials Production Center |
| GLM | Generalized linear model |
| HRA | Health risk appraisal |
| HRQoL | Health-related quality of life |
| HS | High school |
| ICD-10 | International Classification of Diseases, Tenth Revision |
| MAEs | Minors at enrollment |
| MCS | Mental component summary |
| MOS | Medical Outcomes Survey |
| ME | Marginal effect |
| NSFHS | National Survey of Functional Health Status |
| PCS | Physical component summary |
| RP | Residential proximity |
| SF-36 | Short Form-36 |
Appendix A

| Adults (n = 7873) | MAEs (n = 268) | |||
|---|---|---|---|---|
| Variable | n | Value | n | Value |
| Age (years, mean ± SD) † | 7873 | 44.4 ± 14.9 | 268 | 19.5 ± 1.3 |
| Sex | 7873 | 268 | ||
| Female (n, %) | 4431 (56.3%) | 138 (51.5%) | ||
| Male (n, %) | 3442 (43.7%) | 130 (48.5%) | ||
| Duration associated with the closest residence (years, mean ± SD) | 7869 | 13.5 ± 9.4 | 263 | 10.5 ± 5.3 |
| Total duration within five-mile radius (years, mean ± SD) | 7870 | 17.9 ± 10.8 | 268 | 12.6 ± 4.8 |
| Marital status † | 7792 | -- | ||
| Married (n, %) | 5654 (72.6%) | -- | -- | |
| Single (n, %) | 1076 (13.8%) | -- | -- | |
| Separated (n, %) | 94 (1.2%) | -- | -- | |
| Divorced (n, %) | 640 (8.2%) | -- | -- | |
| Widowed (n, %) | 328 (4.2%) | -- | -- | |
| Household income † | 7456 | -- | ||
| ≥$75,000 | 474 (6.4%) | -- | -- | |
| $50,000–74,999 | 1182 (15.9%) | -- | -- | |
| $35,000–49,999 | 1708 (22.9%) | -- | -- | |
| $20,000–34,999 | 2137 (28.7%) | -- | -- | |
| <$20,000 | 1955 (26.2%) | -- | -- | |
| Highest education level attained † | 7796 | -- | ||
| Postgraduate or professional degree (n, %) | 460 (5.9%) | -- | -- | |
| College graduate (n, %) | 1047 (13.4%) | -- | -- | |
| Some college or vocational school (n, %) | 2099 (26.9%) | -- | -- | |
| High school graduate (n, %) | 2967 (38.1%) | -- | -- | |
| High school or less (n, %) | 1223 (15.7%) | -- | -- | |
| Hours of sleep per night | 7867 | 266 | ||
| ≤6 h (n, %) | 2033 (25.8%) | 55 (20.7%) | ||
| 7 h (n, %) | 3395 (43.2%) | 114 (42.9%) | ||
| 8 h (n, %) | 2103 (26.7%) | 74 (27.8%) | ||
| ≥9 h (n, %) | 336 (4.3%) | 23 (8.7%) | ||
| Cumulative smoking pack years (years, mean ± SD) | 7873 | 8.4 ± 14.9 | -- | -- |
| Ever smoked at least one cigarette per day for a year or 20 packs in a lifetime | -- | -- | 267 | |
| Yes (n, %) | -- | -- | 59 (22.1%) | |
| No (n, %) | -- | -- | 208 (77.9%) | |
| Alcohol consumption (drinks, mean ± SD) | 7873 | 2.9 ± 6.7 | 246 | 2.1 ± 4.1 |
| Awareness of environmental hazards | 7862 | 264 | ||
| Most/all of the time | 6099 (77.6%) | 202 (76.5%) | ||
| None/rarely/some | 1763 (22.4%) | 62 (23.5%) | ||
| Job satisfaction | 7873 | 268 | ||
| Strongly agree (n, %) | 1196 (15.2%) | 31 (11.6%) | ||
| Agree/about average (n, %) | 3830 (48.7%) | 160 (59.7%) | ||
| Disagree (n, %) | 970 (12.3%) | 33 (12.3%) | ||
| Strongly disagree (n, %) | 237 (3.0%) | 14 (5.2%) | ||
| Not employed and missing data (n, %) | 1640 (20.8%) | 30 (11.2%) | ||
| Social ties | 7861 | 266 | ||
| Very strong (n, %) | 3791 (48.2%) | 141 (52.4%) | ||
| About average (n, %) | 3474 (44.2%) | 113 (42.9%) | ||
| Weaker than average/not sure (n, %) | 596 (7.6%) | 12 (4.5%) | ||
| Recent loss or misfortune | 7854 | 266 | ||
| Yes, ≥2 losses (n, %) | 936 (11.9%) | 19 (7.1%) | ||
| Yes, 1 loss (n, %) | 1478 (18.8%) | 65 (24.4%) | ||
| No (n, %) | 5440 (69.3%) | 182 (68.4%) | ||
| Body mass index (mean ± SD) * | 7867 | 27.5 ± 5.8 | 152 | 24.2 ± 4.4 |
| Self-reported weekly physical activity | 7843 | 266 | ||
| ≥3 times per week | 3060 (39.0%) | 149 (56.0%) | ||
| 1–2 times per week | 2199 (28.0%) | 79 (29.7%) | ||
| <1 time per week | 2584 (33.0%) | 38 (14.3%) | ||
| Prescribed medication for anxiety, depression, or psychosis * | 7873 | 268 | ||
| Yes (n, %) | 384 (4.9%) | 4 (1.5%) | ||
| No (n, %) | 7489 (95.1%) | 264 (98.5%) | ||
| Self-reported chronic disorder | 7873 | 268 | ||
| Yes (n, %) | 1067 (13.6%) | 14 (5.2%) | ||
| No (n, %) | 6806 (86.4%) | 254 (94.8%) | ||
| Family history of cancer | 6426 | 261 | ||
| Yes or not sure (n, %) | 4178 (65.0%) | 163 (62.5%) | ||
| No (n, %) | 2248 (34.9%) | 98 (37.6%) | ||
| Witness to violence in the past year | 7846 | 263 | ||
| Two or more times (n, %) | 706 (9.0%) | 32 (12.2%) | ||
| Once or never (n, %) | 7140 (91.0%) | 231 (87.8%) | ||
| Count of somatic complaints at the exam (mean ± SD) * | 7873 | 5.4 ± 4.7 | 178 | 0.7 ± 1.1 |
| Ever lived with a Fernald FMPC employee | 7873 | 181 | ||
| Yes (n, %) | 3168 (40.2%) | 9 (5.0%) | ||
| No (n, %) | 4705 (59.8%) | 172 (95.0%) | ||
| SF-36 Scale | With a Chronic Illness Mean (SD) n = 1089, 13.7% | Without a Chronic Illness Mean (SD) n = 6868, 86.3% |
|---|---|---|
| Mental component summary | 46.82 (11.98) | 49.24 (10.33) * |
| Physical component summary | 38.95 (11.70) | 48.54 (9.55) * |
| Physical functioning | 65.41 (29.70) | 85.44 (20.53) * |
| Role physical | 54.97 (43.02) | 81.65 (33.03) * |
| Bodily pain | 46.35 (29.12) | 62.78 (28.38) * |
| General health | 49.04 (23.91) | 68.42 (20.28) * |
| Vitality | 44.29 (22.89) | 55.83 (20.95) * |
| Social functioning | 76.91 (26.84) | 88.71 (19.25) * |
| Role emotional | 66.87 (42.03) | 80.45 (34.26) * |
| Mental health | 64.22 (21.59) | 70.66 (18.78) * |
| Adults (n = 7873) | MAEs (n = 268) | |||||||
|---|---|---|---|---|---|---|---|---|
| Predictors | MCS3 R2 = 0.294 | PCS3 R2 = 0.354 | MCS3 R2 = 0.319 | PCS3 R2 = 0.123 | ||||
| Estimate (SE) | p-Value | Estimate | p-Value | Estimate (SE) | p-Value | Estimate (SE) | p-Value | |
| Mile 1 (ref: Mile 5) | −2741.82 (2299.94) | 0.233 | −1770.98 (2047.25) | 0.387 | −12,770.50 (11,576.21) | 0.271 | −16,924.27 (11,515.51) | 0.143 |
| Mile 2 (ref: Mile 5) | −1061.27 (1806.58) | 0.557 | −3305.34 (1617.30) | 0.041 | −14,863.45 (8733.24) | 0.090 | −240.25 (8674.14) | 0.978 |
| Mile 3 (ref: Mile 5) | 5076.35 (2049.32) | 0.013 | −1943.76 (1831.73) | 0.289 | 3470.43 (9633.94) | 0.719 | −2103.30 (9606.81) | 0.827 |
| Mile 4 (ref: Mile 5) | 2356.17 (2058.38) | 0.252 | 2198.00 (1845.36) | 0.234 | −3239.61 (8974.14) | 0.718 | −3406.21 (8883.25) | 0.702 |
| Age at the time of the questionnaire | 715.55 (68.31) | <0.001 | −627.96 (54.96) | <0.001 | 80.98 (2255.38) | 0.971 | −2555.08 (2261.56) | 0.260 |
| Sex (ref: Male) * | −17,787.77 (3953.14) | <0.001 | −12,100.00 (3559.44) | <0.001 | −16,619.79 (6136.96) | 0.007 | −5156.40 (6019.93) | 0.393 |
| Lived with a Fernald worker (ref: No) | 4362.04 (1291.89) | <0.001 | -- | -- | -- | -- | -- | -- |
| Self-report of a chronic illness (ref: None) | -- | -- | −21,928.17 (1720.11) | <0.001 | -- | -- | -- | -- |
| >6 h sleep per night (ref: ≤6 h) | −9321.03 (1440.97) | <0.001 | -- | -- | -- | -- | -- | -- |
| Physical activity <1 time per week (ref: ≥3 times per week) | -- | -- | −9041.26 (1364.01) | <0.001 | -- | -- | -- | -- |
| Physical activity 1–2 times per week (ref: ≥3 times per week) | -- | -- | −3351.27 (1392.37) | 0.016 | -- | -- | -- | -- |
| Awareness of hazards most/all of the time (ref: None/rarely/some of the time) | 4189.77 (1512.76) | 0.005 | 4350.59 (1355.95) | 0.001 | 12,902.14 (6941.41) | 0.064 | -- | -- |
| Annual household income <$50,000 (ref: >$50,000) | −6256.96 (1431.55) | <0.001 | -- | -- | -- | -- | -- | -- |
| Recent misfortune, 1 loss (ref: None) | −23,266.87 (1635.71) | <0.001 | -- | -- | −28,311.00 (7331.14) | <0.001 | −16,099.53 (7205.25) | 0.026 |
| Recent misfortune, ≥2 losses (ref: None) | −33,213.54 (1998.29) | <0.001 | -- | -- | −36,652.76 (11,839.08) | 0.002 | −49,654.82 (11,640.41) | <0.001 |
| Social ties, about average (ref: Very strong) | −10,664.54 (1313.01) | <0.001 | -- | -- | −9898.93 (6214.26) | 0.112 | −15,132.83 (6093.41) | 0.014 |
| Social ties, weaker than average/not sure (ref: Very strong) | −39,779.42 (2504.58) | <0.001 | -- | -- | −25,271.39 (15,322.31) | 0.100 | −19,723.61 (14,742.60) | 0.182 |
| Prescribed medication for mental health (ref: No) | −24,670.83 (2942.01) | <0.001 | -- | -- | −76,882.16 (24,746.55) | 0.002 | -- | -- |
| Smoking pack years at enrollment | −201.53 (44.82) | <0.001 | −122.60 (40.74) | 0.003 | -- | -- | -- | -- |
| Education, some HS (ref: Postgraduate/professional degree) | -- | -- | −20,581.14 (2757.21) | <0.001 | -- | -- | -- | -- |
| Education, HS graduate (ref: Postgraduate/professional degree) | -- | -- | −12,501.34 (2476.31) | <0.001 | -- | -- | -- | -- |
| Education, some college/vocational training (ref: Postgraduate/professional degree) | -- | -- | −9693.10 (2536.63) | <0.001 | -- | -- | -- | -- |
| Education, college graduate (ref: Postgraduate/professional degree) | -- | -- | −3535.80 (2746.27) | 0.198 | -- | -- | -- | -- |
| Ever smoked cigarettes (ref: No) | -- | -- | -- | -- | −20,955.30 (7801.90) | 0.008 | -- | -- |
| Agree/about average job satisfaction (ref: Strongly agree) | −14,440.12 (1848.32) | <0.001 | −875.27 (1641.71) | 0.594 | -- | -- | -- | -- |
| Disagree/strongly disagree job satisfaction (ref: Strongly agree) | −38,977.97 (2333.74) | <0.001 | −2684.35 (2048.28) | 0.190 | -- | -- | -- | -- |
| Not employed (ref: Strongly agree) | −16,579.49 (2191.83) | <0.001 | −13,872.23 (1957.51) | <0.001 | -- | -- | -- | -- |
| Disagree/strongly disagree/not employed job satisfaction (ref: Strongly agree/agree/about average) | -- | -- | -- | -- | −19,816.87 (7792.17) | 0.012 | -- | -- |
| Somatic complaints | −3098.76 (144.64) | <0.001 | −4697.08 (128.60) | <0.001 | -- | -- | -- | -- |
| Witness to violence, ≥2 times (ref: Once or never) | −14,670.66 (2214.49) | <0.001 | -- | -- | −24,387.33 (9647.22) | 0.012 | -- | -- |
| Age at the time of the questionnaire *Sex (ref: Male) * | 169.35 (84.56) | 0.045 | 215.81 (75.93) | 0.005 | -- | -- | -- | -- |
| BMIz | -- | -- | −8734.41 (570.03) | <0.001 | -- | -- | -- | -- |
Appendix B
References
- Schmitt, H.J.; Calloway, E.E.; Sullivan, D.; Clausen, W.; Tucker, P.G.; Rayman, J.; Gerhardstein, B. Chronic environmental contamination: A systematic review of psychological health consequences. Sci. Total Environ. 2021, 772, 145025. [Google Scholar] [CrossRef] [PubMed]
- Li, C. Ranking of factors affecting environmental pollution. Int. J. Ind. Eng. Oper. Res. 2023, 5, 1–11. [Google Scholar]
- Vrijheid, M.; Casas, M.; Gascon, M.; Valvi, D.; Nieuwenhuijsen, M. Environmental pollutants and child health—A review of recent concerns. Int. J. Hyg. Environ. Health 2016, 219, 331–342. [Google Scholar] [CrossRef]
- Shetty, S.S.; Deepthi, D.; Harshitha, S.; Sonkusare, S.; Naik, P.B.; Madhyastha, H. Environmental pollutants and their effects on human health. Heliyon 2023, 9, e19496. [Google Scholar] [CrossRef] [PubMed]
- Lima, M.L.; Marques, S. Living in Industrial Areas: Social Impacts, Adaptation and Mitigation; International Handbooks of Quality-of-Life; Springer International Publishing: Cham, Switzerland, 2017. [Google Scholar] [CrossRef]
- Sullivan, D.; Schmitt, H.J.; Calloway, E.E.; Clausen, W.; Tucker, P.; Rayman, J.; Gerhardstein, B. Chronic environmental contamination: A narrative review of psychosocial health consequences, risk factors, and pathways to community resilience. Soc. Sci. Med. 2021, 276, 113877. [Google Scholar] [CrossRef]
- Legg, R.; Prior, J.; Adams, J.; McIntyre, E. The relations between mental health and psychological wellbeing and living with environmental contamination: A systematic review and conceptual framework. J. Environ. Psychol. 2023, 87, 101994. [Google Scholar] [CrossRef]
- He, Y.; He, H.; Li, H.; Yang, J. Dirty Environment, Dark Mood: Exploring the Link Between Perceived Environmental Pollution and Depression Risk. J. Community Psychol. 2025, 53, e23181. [Google Scholar] [CrossRef]
- McMichael, A.J.; Friel, S.; Nyong, A.; Corvalan, C. Global environmental change and health: Impacts, inequalities, and the health sector. BMJ 2008, 336, 191–194. [Google Scholar] [CrossRef]
- Briggs, D. Environmental pollution and the global burden of disease. Br. Med. Bull. 2003, 68, 1–24. [Google Scholar] [CrossRef]
- Lima, M.L.; Marques, S. Towards successful social impact assessment follow-up: A case study of psychosocial monitoring of a solid waste incinerator in the North of Portugal. Impact Assess. Proj. Apprais. 2005, 23, 227–233. [Google Scholar] [CrossRef]
- Prior, J.H.; Gorman-Murray, A.; McIntyre, E.; Connon, I.; Adams, J.; Madden, B. A geography of residents’ worry about the disruptive effects of contaminated sites. Geogr. Res. 2019, 57, 52–66. [Google Scholar] [CrossRef]
- Gayer, T.; Hamilton, J.T.; Viscusi, W.K. Private Values of Risk Tradeoffs at Superfund Sites: Housing Market Evidence on Learning about Risk. Rev. Econ. Stat. 2000, 82, 439–451. [Google Scholar] [CrossRef]
- McCluskey, J.J.; Rausser, G.C. Estimation of Perceived Risk and Its Effect on Property Values. Land Econ. 2001, 77, 42–55. [Google Scholar] [CrossRef]
- O’Leary, J.; Covell, K. The Tar Ponds kids: Toxic environments and adolescent well-being. Can. J. Behav. Sci. 2002, 34, 34–43. [Google Scholar] [CrossRef]
- Brender, J.D.; Maantay, J.A.; Chakraborty, J. Residential Proximity to Environmental Hazards and Adverse Health Outcomes. Am. J. Public Health 2011, 101, S37–S52. [Google Scholar] [CrossRef]
- Chakraborty, J.; Maantay, J.A.; Brender, J.D. Disproportionate Proximity to Environmental Health Hazards: Methods, Models, and Measurement. Am. J. Public Health 2011, 101, S27–S36. [Google Scholar] [CrossRef]
- Pollock, P.H.; Vittas, M.E. Who Bears the Burdens of Environmental Pollution? Race, Ethnicity, and Environmental Equity in Florida. Soc. Sci. Q. 1995, 76, 294–310. [Google Scholar]
- Atlas, M. Few and Far Between? An Environmental Equity Analysis of the Geographic Distribution of Hazardous Waste Generation. Soc. Sci. Q. 2002, 83, 365–378. [Google Scholar] [CrossRef]
- Bromet, E.J.; Parkinson, D.K.; Dunn, L.O. Long-term Mental Health Consequences of the Accident at Three Mile Island. Int. J. Ment. Health 1990, 19, 48–60. [Google Scholar] [CrossRef]
- Payyappilly, A.; Babu, P.; Nair, M. Distance and Direction Matters: Risk Perception Among Residents Around a Dump Yard in Kerala, India. RMHP 2025, 18, 65–76. [Google Scholar] [CrossRef]
- Lindell, M.K.; Earle, T.C. How Close Is Close Enough: Public perceptions of the Risks of Industrial Facilities. Risk Anal. 1983, 3, 245–253. [Google Scholar] [CrossRef]
- Zhang, Y.; Hwang, S.N.; Lindell, M.K. Hazard Proximity or Risk Perception? Evaluating Effects of Natural and Technological Hazards on Housing Values. Environ. Behav. 2010, 42, 597–624. [Google Scholar] [CrossRef]
- Slovic, P.; Fischhoff, B.; Lichtenstein, S. Characterizing Perceived Risk. Perilous Prog. Manag. Hazards Technol. 1985, 91–125. [Google Scholar]
- Gerhardstein, B.; Tucker, P.G.; Rayman, J.; Reh, C.M. A Fresh Look at Stress and Resilience in Communities Affected by Environmental Contamination. J. Environ. Health 2019, 82, 36–38. [Google Scholar]
- Slovic, P. Perceptions of Risk: Reflections on the Psychometric Paradigm. In Theories of Risk; Praeger: New York, NY, USA, 1990. [Google Scholar]
- Lindell, M.K.; Perry, R.W. Communicating Environmental Risk in Multiethnic Communities; Communicating effectively in multicultural contexts; Sage Publications: Thousand Oaks, CA, USA, 2004. [Google Scholar]
- Lindell, M.K.; Perry, R.W. The Protective Action Decision Model: Theoretical Modifications and Additional Evidence. Risk Anal. 2012, 32, 616–632. [Google Scholar] [CrossRef] [PubMed]
- Shi, X.; Li, X.; Chen, X.; Zhang, L. Objective air quality index versus subjective perception which has a greater impact on life satisfaction.html. Environ. Dev. Sustain. 2022, 24, 6860–6877. [Google Scholar] [CrossRef]
- Cortés, S.; Burgos, S.; Adaros, H.; Lucero, B.; Quirós-Alcalá, L. Environmental Health Risk Perception: Adaptation of a Population-Based Questionnaire from Latin America. Int. J. Environ. Res. Public Health 2021, 18, 8600. [Google Scholar] [CrossRef]
- Sansom, G.T.; Thompson, C.; Sansom, L.; Fawkes, L.; Boerlin, E. Compounding impacts of hazard exposures on mental health in Houston, TX. Nat. Hazards 2022, 111, 2809–2818. [Google Scholar] [CrossRef]
- Sansom, G.; Parras, J.; Parras, A.; Nieto, Y.; Arellano, Y.; Berke, P.; McDonald, T.; Shipp, E.; Horney, J.A. The Impacts of Exposure to Environmental Risk on Physical and Mental Health in a Small Geographic Community in Houston, TX. J. Community Health 2017, 42, 813–818. [Google Scholar] [CrossRef]
- US Department of Health and Human Services; Substance Abuse and Mental Health Services Administration. Addressing the Psychosocial Elements of Slow Motion Technological Disasters; Center for Asbestos Related Disease Libby: Libby, MT, USA, 2003. [Google Scholar] [CrossRef]
- Jack, G. Place Matters: The Significance of Place Attachments for Children’s Well-Being. Br. J. Soc. Work 2010, 40, 755–771. [Google Scholar] [CrossRef]
- McHorney, C.A. Health Status Assessment Methods For Adults: Past Accomplishments and Future Challenges. Annu. Rev. Public Health 1999, 20, 309–335. [Google Scholar] [CrossRef]
- Ware, J. SF-36 Health Survey Manual and Interpretation Guide. The Health Institute, New England Medical Center Hospitals, Inc. 1993. Available online: https://gyansanchay.csjmu.ac.in/wp-content/uploads/2021/12/WareetalSF-36UserManual_27MB_1993_316pp-1_compressed-compressed-1-1.pdf (accessed on 22 June 2023).
- Gerhardstein, B.G.; Brown, P. The Benefits of Community Medical Monitoring at Nuclear Weapons Production Sites: Lessons From Fernald. Environ. Law Rev. News Anal. 2005, 35, 9. [Google Scholar]
- Wones, R.; Pinney, S.M.; Buckholz, J.M.; Deck-Tebbe, C.; Freyberg, R.; Pesce, A. Medical Monitoring: A Beneficial Remedy for Residents Living Near an Environmental Hazard Site. J. Occup. Environ. Med. 2009, 51, 1374–1383. [Google Scholar] [CrossRef] [PubMed]
- Hornung, R.W.; Pinney, S.M.; Lodwick, J.; Killough, G.G.; Brewer, D.E.; Nasuta, J. Estimation of radon exposures to workers at the Fernald Feed Materials Production Center 1952–1988. J. Expo. Sci. Environ. Epidemiol. 2008, 18, 512–523. [Google Scholar] [CrossRef]
- Silver, S.R.; Bertke, S.J.; Hein, M.J.; Daniels, R.D.; Fleming, D.A.; Anderson, J.L.; Pinney, S.M.; Hornung, R.W.; Tseng, C.-Y. Mortality and ionising radiation exposures among workers employed at the Fernald Feed Materials Production Center (1951–1985). Occup. Environ. Med. 2013, 70, 453–463. [Google Scholar] [CrossRef]
- Wones, R.; Radack, K.; Martin, V.; Mandell, K.; Pinney, S.; Buncher, R. Do persons living near a uranium processing site have evidence of increased somatic cell gene mutations? A first study. Mutat. Res./Environ. Mutagen. Relat. Subj. 1995, 335, 171–184. [Google Scholar] [CrossRef]
- University of Cincinnati College of Medicine Fernald Community Cohort. Available online: https://med.uc.edu/depart/eh/research/projects/fcc/home (accessed on 15 March 2023).
- Ware, J.E.; Kosinski, M.; Keller, S. A 12-Item Short-Form Health Survey: Construction of Scales and Preliminary Tests of Reliability and Validity. Med. Care 1996, 34, 220–233. [Google Scholar] [CrossRef]
- Barry, T.L.; Kaiser, K.L.; Atwood, J.R. Reliability, Validity, and Scoring of the Health Status Questionnaire-12 Version 2.0. J. Nurs. Meas. 2007, 15, 24–35. [Google Scholar] [CrossRef] [PubMed]
- Tarlov, A.R.; Ware, J.E.; Greenfield, S.; Nelson, E.; Zubkoff, M. The Medical Outcomes Study: An Application of Methods for Monitoring the Results of Medical Care. JAMA 1989, 262, 925–930. [Google Scholar] [CrossRef]
- Laucis, N.C.; Hays, R.D.; Bhattacharyya, T. Scoring the SF-36 in Orthopaedics: A Brief Guide. J. Bone Jt. Surg. 2015, 97, 1628–1634. [Google Scholar] [CrossRef]
- Ware, J.E.; Gandek, B. Overview of the SF-36 Health Survey and the International Quality of Life Assessment (IQOLA) Project. J. Clin. Epidemiol. 1998, 51, 903–912. [Google Scholar] [CrossRef]
- Ware, J.; Kosinski, M.; Keller, S. SF-36 Physical and Mental Health Summary Scales: A User’s Manual. Health Assessment Lab, New England Medical Center. December 1994. Available online: https://www.researchgate.net/publication/292390260_SF-36_Physical_and_Mental_Health_Summary_Scales_a_User’s_Manual (accessed on 22 June 2023).
- Graham, J.W.; Olchowski, A.E.; Gilreath, T.D. How Many Imputations are Really Needed? Some Practical Clarifications of Multiple Imputation Theory. Prev. Sci. 2007, 8, 206–213. [Google Scholar] [CrossRef]
- Liu, Y.; De, A. Multiple Imputation by Fully Conditional Specification for Dealing with Missing Data in a Large Epidemiologic Study. Int. J. Stat. Med. Res. 2015, 4, 287–295. [Google Scholar] [CrossRef]
- SAS Institute Inc. SAS 9.4 Software; SAS Institute Inc.: Cary, NC, USA, 2013. [Google Scholar]
- Burcham, S.; Liu, Y.; Merianos, A.L.; Mendy, A. Outliers in nutrient intake data for U.S. adults: National health and nutrition examination survey 2017–2018. Epidemiol. Methods 2023, 12, 20230018. [Google Scholar] [CrossRef] [PubMed]
- Pearson, K.; Pearson, E.S. On Polychoric Coefficients of Correlation. Biometrika 1922, 14, 127–156. [Google Scholar] [CrossRef]
- Thaliji, L.; Haggerty, C.C.; Richard, R.; Berckmans, T.R.; Pardee, B.L. 1990 National Survey of Functional Health Status Final Report; A Social Science Research Center University of Chicago: Chicago, IL, USA, 1991; p. 107. Available online: https://www.norc.org/content/dam/norc-org/pdfs/ThaljiL_Func_Health_Status_1991.pdf (accessed on 31 March 2025). [CrossRef]
- Wilcoxon, F. Some rapid approximate statistical procedures. Ann. N. Y. Acad. Sci. 1950, 52, 808–814. [Google Scholar] [CrossRef]
- Kruskal, W.H.; Wallis, W.A. Use of Ranks in One-Criterion Variance Analysis. J. Am. Stat. Assoc. 1952, 47, 583–621. [Google Scholar] [CrossRef]
- Lee, D.K. Data transformation: A focus on the interpretation. Korean, J. Anesth. 2020, 73, 503–508. [Google Scholar] [CrossRef]
- Efroymson, M.A. Multiple regression analysis. In Mathematical Methods for Digital Computers; John Wiley & Sons Inc.: Hoboken, NJ, USA, 1960; pp. 191–203. [Google Scholar]
- Onukwugha, E.; Bergtold, J.; Jain, R. A Primer on Marginal Effects—Part I: Theory and Formulae. Pharmacoeconomics 2015, 33, 25–30. [Google Scholar] [CrossRef]
- Onukwugha, E.; Bergtold, J.; Jain, R. A Primer on Marginal Effects—Part II: Health Services Research. Pharmacoeconomics 2015, 33, 97–103. [Google Scholar] [CrossRef]
- Bureau of the Census; U.S. Department of Commerce. Population Profile of the United States 1989; U.S. Government Printing Office: Washington, DC, USA, 1989; pp. 1–64. Available online: https://www2.census.gov/library/publications/1989/demographics/p23-159.pdf (accessed on 31 March 2025).
- Roswall, N.; Høgh, V.; Envold-Bidstrup, P.; Raaschou-Nielsen, O.; Ketzel, M.; Overvad, K.; Olsen, A.; Sørensen, M. Residential Exposure to Traffic Noise and Health-Related Quality of Life—A Population-Based Study. PLoS ONE 2015, 10, e0120199. [Google Scholar] [CrossRef]
- Dumcke, T.S.; Benedetti, A.; Selistre, L.d.S.; Camardelo, A.M.P.; Silva, E.R.d. Association between exposure to urban waste and emotional and behavioral difficulties in schoolchildren. J. Pediatr. 2020, 96, 364–370. [Google Scholar] [CrossRef]
- Nguyen, P.-Y.; Astell-Burt, T.; Rahimi-Ardabili, H.; Feng, X. Green Space Quality and Health: A Systematic Review. Int. J. Environ. Res. Public Health 2021, 18, 11028. [Google Scholar] [CrossRef] [PubMed]
- Rauh, V.A.; Margolis, A.E. Research Review: Environmental exposures, neurodevelopment, and child mental health—New paradigms for the study of brain and behavioral effects. Child Psychol. Psychiatry 2016, 57, 775–793. [Google Scholar] [CrossRef]
- Greve, K.W.; Bianchini, K.J.; Stickle, T.R.; Love, J.M.; Doane, B.M.; Thompson, M.D. Effects of a Community Toxic Release on the Psychological Status of Children. Child Psychiatry Hum. Dev. 2007, 37, 307–323. [Google Scholar] [CrossRef]
- Hawley, E. Environmental Communication for Children: Media, Young Audiences, and the More-Than-Human World; Palgrave Studies in Media and Environmental Communication; Springer International Publishing: Cham, Switzerland, 2022. [Google Scholar] [CrossRef]
- Korol, M.; Green, B.; Gleser, G. Children’s Responses to a Nuclear Waste Disaster: PTSD Symptoms and Outcome Prediction. J. Am. Acad. Child Adolesc. Psychiatry 1999, 38, 368–375. [Google Scholar] [CrossRef] [PubMed]
- Engemann, K.; Pedersen, C.B.; Arge, L.; Tsirogiannis, C.; Mortensen, P.B.; Svenning, J.-C. Residential green space in childhood is associated with lower risk of psychiatric disorders from adolescence into adulthood. Proc. Natl. Acad. Sci. USA 2019, 116, 5188–5193. [Google Scholar] [CrossRef] [PubMed]
- Venables, D.; Pidgeon, N.F.; Parkhill, K.A.; Henwood, K.L.; Simmons, P. Living with nuclear power: Sense of place, proximity, and risk perceptions in local host communities. J. Environ. Psychol. 2012, 32, 371–383. [Google Scholar] [CrossRef]
- Maderthaner, R.; Guttmann, G. Effect of Distance upon Risk Perception. J. Appl. Psychol. 1978, 63, 380–382. [Google Scholar] [CrossRef]
- Kelly, G.; Hosking, K. Nonpermanent Residents, Place Attachment, and “Sea Change” Communities. Environ. Behav. 2008, 40, 575–594. [Google Scholar] [CrossRef]
- Fitzpatrick, S.; Nolan, R.D.; Hallam, J.S.; Pinney, S.M. Ecological grief in the Fernald Community Cohort: A pilot study. PLOS Ment. Health 2024, 1, e0000049. [Google Scholar] [CrossRef]
- Reuben, A.; Manczak, E.M.; Cabrera, L.Y.; Alegria, M.; Bucher, M.L.; Freeman, E.C.; Miller, G.W.; Solomon, G.M.; Perry, M.J. The Interplay of Environmental Exposures and Mental Health: Setting an Agenda. Environ. Health Perspect 2022, 130, 025001. [Google Scholar] [CrossRef] [PubMed]
- Hawkins, R.L.; Maurer, K. Bonding, Bridging and Linking: How Social Capital Operated in New Orleans following Hurricane Katrina. Br. J. Soc. Work 2010, 40, 1777–1793. [Google Scholar] [CrossRef]
- Schmitt, H.J.; Sullivan, D.; Goad, A.N.; Palitsky, R. Coping with chronic environmental contamination: Exploring the role of social capital. J. Environ. Psychol. 2022, 83, 101870. [Google Scholar] [CrossRef]
- Faragher, E.B. The relationship between job satisfaction and health: A meta-analysis. Occup. Environ. Med. 2005, 62, 105–112. [Google Scholar] [CrossRef] [PubMed]
- Reche, E.; König, H.H.; Hajek, A. Income, Self-Rated Health, and Morbidity. A Systematic Review of Longitudinal Studies. Int. J. Environ. Res. Public Health 2019, 16, 2884. [Google Scholar] [CrossRef]
- Greve, K.W.; Bianchini, K.J.; Doane, B.M.; Love, J.M.; Stickle, T.R. Psychological Evaluation of the Emotional Effects of a Community Toxic Exposure. J. Occup. Environ. Med. 2005, 47, 51–59. [Google Scholar] [CrossRef] [PubMed]
- Pinney, S.M.; Freyberg, R.W.; Levine, G.H.; Brannen, D.E.; Mark, L.S.; Nasuta, J.M.; Tebbe, C.D.; Buckholz, J.M.; Wones, R. Health Effects in Community Residents Near a Uranium Plant at Fernald, Ohio, USA. Int. J. Occup. Med. Environ. Health 2003, 16, 139–153. [Google Scholar] [PubMed]
- Agency for Toxic Substances and Disease Registry; Division of Health Assessment and Consultation; Federal Facilities Assessment Brand: Energy Section. Public Health Assessment: Feed Materials Production Center (USDOE). EPA FACILITY ID: OH6890008976, Final Release CERCLIS No. OH6890008976. 1999. Available online: https://www.atsdr.cdc.gov/hac/pha/feedmaterials081704-oh/feedmaterials081704-oh-pt1.pdf (accessed on 20 June 2023).
- Environmental Protection Agency National Priorities List (NPL). Available online: https://www.epa.gov/superfund/superfund-national-priorities-list-npl (accessed on 12 July 2022).
- Hopman, W.M.; Harrison, M.B.; Coo, H.; Friedberg, E.; Buchanan, M.; VanDenKerkhof, E.G. Associations between chronic disease, age and physical and mental health status. Chronic Dis. Can. 2009, 29, 108–117. [Google Scholar] [CrossRef]
- Annunziata, M.A.; Muzzatti, B.; Flaiban, C.; Gipponi, K.; Carnaghi, C.; Tralongo, P.; Caruso, M.; Cavina, R.; Tirelli, U. Long-term quality of life profile in oncology: A comparison between cancer survivors and the general population. Support. Care Cancer 2018, 26, 651–656. [Google Scholar] [CrossRef]
| Adults | MAEs | |||
|---|---|---|---|---|
| Characteristic | n | Value | n | Value |
| Age (years, mean ± SD) † | 7957 | 44.5 ± 14.9 | 268 | 19.5 ± 1.3 |
| Female sex (%) † | 4470 | 56.2 | 138 | 51.5 |
| White race (%) † | 7926 | 99.6 | 265 | 98.9% |
| Characteristic | n | MCS | PCS | ||
|---|---|---|---|---|---|
| Mean/Median | SD/IQR | Mean/Median | SD/IQR | ||
| Sex * | |||||
| Female | 4431 | 48.1/51.3 | 10.9/14.1 | 46.9/49.5 | 10.9/13.9 |
| Male | 3442 | 50.0/52.8 | 10.1/11.8 | 47.7/50.4 | 10.1/12.2 |
| Age * | |||||
| <25 | 725 | 48.5/50.9 | 9.6/10.9 | 51.7/53.4 | 7.6/8.1 |
| 25–43 | 3349 | 47.6/51.1 | 10.7/13.7 | 49.6/51.7 | 8.8/10.5 |
| 44–55 | 1902 | 49.2/52.5 | 10.7/12.8 | 47.1/49.6 | 10.2/13.0 |
| >55 | 1897 | 51.0/54.1 | 10.4/13.1 | 41.6/43.8 | 11.7/18.3 |
| Marital status * | |||||
| Single | 1076 | 48.6/51.3 | 9.9/12.1 | 50.6/52.7 | 8.4/9.2 |
| Married | 5654 | 49.5/52.5 | 10.3/12.2 | 47.2/49.9 | 10.2/12.9 |
| Divorced Separated Widowed | 1062 | 45.9/49.2 | 12.4/18.1 | 44.4/47.0 | 11.9/17.6 |
| Household income * | |||||
| <$20,000 | 1955 | 46.4/49.2 | 12.2/18.0 | 43.1/45.6 | 12.2/19.0 |
| $20,000–34,999 | 2137 | 48.9/51.9 | 10.4/13.6 | 47.5/49.6 | 9.8/12.5 |
| $35,000–49,999 | 1708 | 49.5/52.1 | 9.8/11.2 | 49.3/51.5 | 9.0/10.5 |
| $50,000–74,999 | 1182 | 51.2/53.6 | 8.7/8.3 | 49.8/51.6 | 8.1/9.7 |
| >$75,000 | 474 | 51.2/54.0 | 8.7/9.4 | 50.7/52.6 | 7.9/9.6 |
| Educational attainment * | |||||
| Some HS | 1223 | 46.9/49.8 | 12.0/17.6 | 41.7/43.8 | 11.9/19.4 |
| HS graduate | 2967 | 49.0/52.1 | 10.5/13.0 | 47.3/49.6 | 10.0/12.4 |
| Some college | 2099 | 48.8/51.8 | 10.5/13.3 | 48.4/50.7 | 9.7/12.1 |
| College graduate | 1047 | 50.2/53.2 | 9.5/9.8 | 50.5/52.5 | 8.7/9.5 |
| Postgraduate | 460 | 51.7/53.9 | 8.8/8.3 | 50.3/52.6 | 8.5/10.2 |
| Self-reported chronic illness * | |||||
| Yes | 1067 | 46.8/49.5 | 12.0/18.1 | 39.0/39.8 | 11.7/18.9 |
| No | 6806 | 49.2/52.3 | 10.3/12.4 | 48.5/50.9 | 9.6/11.5 |
| FCC Population | SF-36 Component Summary Domain | Mile(s) from the FMPC | Median | Q1–Q3 | p-Value | General U.S. Population Median † |
|---|---|---|---|---|---|---|
| Adults | MCS | 1 | 49.03 | 48.2–49.9 | <0.001 | 52.52 |
| 2 | 49.13 | 48.6–49.6 | <0.001 | |||
| 3 | 51.47 | 50.9–51.9 | <0.001 | |||
| 4 | 51.18 | 50.6–51.7 | <0.001 | |||
| 5 | 50.80 | 50.2–51.3 | <0.001 | |||
| total | 50.25 | 49.9–50.5 | <0.001 | |||
| PCS | 1 | 47.95 | 47.3–48.6 | <0.001 | 52.64 | |
| 2 | 47.57 | 47.1–48.0 | <0.001 | |||
| 3 | 48.79 | 48.2–49.4 | <0.001 | |||
| 4 | 49.72 | 49.1–50.3 | <0.001 | |||
| 5 | 48.71 | 48.1–49.3 | <0.001 | |||
| total | 48.42 | 48.2–48.7 | <0.001 | |||
| MAEs | MCS | total | 50.2 | 49.1–51.2 | 0.074 | 51.13 |
| PCS | total | 53.2 | 52.4–54.0 | <0.001 | 55.03 |
| Description | Adults (n = 7873) | MAEs (n = 268) | ||
|---|---|---|---|---|
| ME | R2 | ME | R2 | |
| Model 1: MCS ß Closest Proximity (ref: 4–5 miles) | −0.388 | 0.294 | −1.624 | 0.316 |
| Model 2: MCS ß Cumulative Duration | 0.004 | 0.292 | 0.102 | 0.301 |
| Model 3: MCS ß Closest Proximity Duration | 0.005 | 0.293 | 0.007 | 0.297 |
| Model 4: MCS ß Dichotomized Proximity (ref: >2 miles) | −0.553 *** | 0.293 | −1.594 ** | 0.308 |
| Model 5: PCS ß Closest Proximity (ref: 4–5 miles) | −0.280 | 0.354 | −2.013 | 0.123 |
| Model 6: PCS ß Cumulative Duration | −0.008 | 0.353 | 0.102 | 0.120 |
| Model 7: PCS ß Closest Proximity Duration | −0.001 | 0.353 | 0.010 | 0.115 |
| Model 8: PCS ß Dichotomized Proximity (ref: >2 miles) | −0.456 ** | 0.354 | −0.157 | 0.114 |
Disclaimer/Publisher’s Note: The statements, opinions and data contained in all publications are solely those of the individual author(s) and contributor(s) and not of MDPI and/or the editor(s). MDPI and/or the editor(s) disclaim responsibility for any injury to people or property resulting from any ideas, methods, instructions or products referred to in the content. |
© 2025 by the authors. Licensee MDPI, Basel, Switzerland. This article is an open access article distributed under the terms and conditions of the Creative Commons Attribution (CC BY) license (https://creativecommons.org/licenses/by/4.0/).
Share and Cite
Burcham, S.; Hsu, W.-W.; Larson, S.L.; Rubinstein, J.; Pinney, S.M. Residential Proximity, Duration, and Health-Related Quality of Life: Insights from the Fernald Cohort. Int. J. Environ. Res. Public Health 2025, 22, 738. https://doi.org/10.3390/ijerph22050738
Burcham S, Hsu W-W, Larson SL, Rubinstein J, Pinney SM. Residential Proximity, Duration, and Health-Related Quality of Life: Insights from the Fernald Cohort. International Journal of Environmental Research and Public Health. 2025; 22(5):738. https://doi.org/10.3390/ijerph22050738
Chicago/Turabian StyleBurcham, Sara, Wei-Wen Hsu, Sharon L. Larson, Jack Rubinstein, and Susan M. Pinney. 2025. "Residential Proximity, Duration, and Health-Related Quality of Life: Insights from the Fernald Cohort" International Journal of Environmental Research and Public Health 22, no. 5: 738. https://doi.org/10.3390/ijerph22050738
APA StyleBurcham, S., Hsu, W.-W., Larson, S. L., Rubinstein, J., & Pinney, S. M. (2025). Residential Proximity, Duration, and Health-Related Quality of Life: Insights from the Fernald Cohort. International Journal of Environmental Research and Public Health, 22(5), 738. https://doi.org/10.3390/ijerph22050738