Comparison of Self-Administered Web-Based and Interviewer Printed Food Frequency Questionnaires for Dietary Assessment in Italian Adolescents

 ,
,  , , ,
, , , 
Abstract
1. Introduction
2. Materials and Methods
2.1. Study Design and Data Collection
2.2. Dietary Assessment
2.3. Statistical Analysis
3. Results
4. Discussion
5. Conclusions
Author Contributions
Funding
Acknowledgments
Conflicts of Interest
References
- Kassebaum, N.; Kyu, H.H.; Zoeckler, L.; Olsen, H.E.; Thomas, K.; Pinho, C.; Bhutta, Z.A.; Dandona, L.; Ferrari, A.; Ghiwot, T.T.; et al. Child and Adolescent Health from 1990 to 2015: Findings from the Global Burden of Diseases, Injuries, and Risk Factors 2015 Study. JAMA Pediatr. 2017, 171, 573–592. [Google Scholar] [CrossRef]
- Yeo, M.; Sawyer, S. Chronic illness and disability. BMJ 2005, 330, 721–723. [Google Scholar] [CrossRef] [PubMed]
- Baird, J.; Jacob, C.; Barker, M.; Fall, C.H.; Hanson, M.; Harvey, N.C.; Inskip, H.M.; Kumaran, K.; Cooper, C. Developmental Origins of Health and Disease: A Lifecourse Approach to the Prevention of Non-Communicable Diseases. Healthcare (Basel) 2017, 5. [Google Scholar] [CrossRef] [PubMed]
- Hobbs, M.; Pearson, N.; Foster, P.J.; Biddle, S.J. Sedentary behaviour and diet across the lifespan: An updated systematic review. Br. J. Sports Med. 2015, 49, 1179–1188. [Google Scholar] [CrossRef] [PubMed]
- Pearson, N.; Biddle, S.J. Sedentary behavior and dietary intake in children, adolescents, and adults. A systematic review. Am. J. Prev. Med. 2011, 41, 178–188. [Google Scholar] [CrossRef]
- Rangel Caballero, L.G.; Gamboa Delgado, E.M.; Murillo López, A.L. Prevalence of modifiable behavioral risk factors associated to non-communicable diseases in Latin American college students: A systematic review. Nutr. Hosp. 2017, 34, 1185–1197. [Google Scholar]
- Commission on Ending Childhood Obesity. Report of the Commission on Ending Childhood Obesity; World Health Organization: Geneva, Switzerland, 2016. [Google Scholar]
- Global Reference List of 100 Core Health Indicators. Available online: https://apps.who.int/iris/bitstream/handle/10665/173589/WHO_HIS_HSI_2015.3_eng.pdf;jsessionid=E8142D0568CA423331E53DF3C07C8CC5?sequence=1 (accessed on 30 May 2019).
- Prentice, R.L.; Mossavar-Rahmani, Y.; Huang, Y.; Van Horn, L.; Beresford, S.A.; Caan, B.; Tinker, L.; Schoeller, D.; Bingham, S.; Eaton, C.B.; et al. Evaluation and comparison of food records, recalls, and frequencies for energy and protein assessment by using recovery biomarkers. Am. J. Epidemiol. 2011, 174, 591–603. [Google Scholar] [CrossRef] [PubMed]
- Shim, J.S.; Oh, K.; Kim, H.C. Dietary assessment methods in epidemiologic studies. Epidemiol. Health 2014, 36. [Google Scholar] [CrossRef]
- Willett, W. Nutritional Epidemiology; Oxford University Press: New York, NY, USA, 2012. [Google Scholar]
- Preston, A.M.; Palacios, C.; Rodríguez, C.A.; Vélez-Rodríguez, R.M. Validation and reproducibility of a semi-quantitative food frequency questionnaire for use in Puerto Rican children. P. R. Health Sci. J. 2011, 30, 58–64. [Google Scholar]
- Martinez, M.F.; Philippi, S.T.; Estima, C.; Leal, G. Validity and reproducibility of a food frequency questionnaire to assess food group intake in adolescents. Cad. Saude Publica 2013, 29, 1795–1804. [Google Scholar] [CrossRef] [PubMed]
- Burrows, T.L.; Martin, R.J.; Collins, C.E. A systematic review of the validity of dietary assessment methods in children when compared with the method of doubly labeled water. J. Am. Diet. Assoc. 2010, 110, 1501–1510. [Google Scholar] [CrossRef]
- Burrows, T.; Golley, R.K.; Khambalia, A.; McNaughton, S.A.; Magarey, A.; Rosenkranz, R.R.; Alllman-Farinelli, M.; Rangan, A.M.; Truby, H.; Collins, C. The quality of dietary intake methodology and reporting in child and adolescent obesity intervention trials: A systematic review. Obes. Rev. 2012, 13, 1125–1138. [Google Scholar] [CrossRef] [PubMed]
- Lodato, F.; Araújo, J.; Barros, H.; Lopes, C.; Agodi, A.; Barchitta, M.; Ramos, E. Caffeine intake reduces sleep duration in adolescents. Nutr. Res. 2013, 33, 726–732. [Google Scholar] [CrossRef] [PubMed]
- Filippi, A.R.; Amodio, E.; Napoli, G.; Breda, J.; Bianco, A.; Jemni, M.; Censi, L.; Mammina, C.; Tabacchi, G. The web-based ASSO-food frequency questionnaire for adolescents: Relative and absolute reproducibility assessment. Nutr. J. 2014, 13, 119. [Google Scholar] [CrossRef] [PubMed]
- Barchitta, M.; Maugeri, A.; Agrifoglio, O.; Favara, G.; La Mastra, C.; La Rosa, M.C.; Magnano San Lio, R.; Agodi, A. Dietary patterns and school performance: Evidence from a sample of adolescents in Sicily, Italy. Ann. Ig. 2019, 31, 72–80. [Google Scholar]
- Rockett, H.R.; Breitenbach, M.; Frazier, A.L.; Witschi, J.; Wolf, A.M.; Field, A.E.; Colditz, G.A. Validation of a youth/adolescent food frequency questionnaire. Prev. Med. 1997, 26, 808–816. [Google Scholar] [CrossRef] [PubMed]
- Craig, C.L.; Marshall, A.L.; Sjostrom, M.; Bauman, A.E.; Booth, M.L.; Ainsworth, B.E.; Pratt, M.; Ekelund, U.; Yngve, A.; Sallis, J.F.; et al. International physical activity questionnaire: 12-country reliability and validity. Med. Sci. Sports Exerc. 2003, 35, 1381–1395. [Google Scholar] [CrossRef] [PubMed]
- Eveleth, P.B.; Andres, R.; Chumlea, W.C.; Eiben, O.; Ge, K.; Harris, T.; Heymsfield, S.B.; Launer, L.J.; Rosenberg, I.H.; Solomons, N.W.; et al. Uses and interpretation of anthropometry in the elderly for the assessment of physical status. Report to the Nutrition Unit of the World Health Organization: The Expert Subcommittee on the Use and Interpretation of Anthropometry in the Elderly. J. Nutr. Health Aging 1998, 2, 5–17. [Google Scholar] [PubMed]
- Agodi, A.; Barchitta, M.; Quattrocchi, A.; Maugeri, A.; Canto, C.; Marchese, A.E.; Vinciguerra, M. Low fruit consumption and folate deficiency are associated with LINE-1 hypomethylation in women of a cancer-free population. Genes Nutr. 2015, 10, 480. [Google Scholar] [CrossRef]
- Barchitta, M.; Maugeri, A.; Quattrocchi, A.; Barone, G.; Mazzoleni, P.; Catalfo, A.; De Guidi, G.; Iemmolo, M.G.; Crimi, N.; Agodi, A. Mediterranean Diet and Particulate Matter Exposure Are Associated with LINE-1 Methylation: Results from a Cross-Sectional Study in Women. Front. Genet. 2018, 9, 514. [Google Scholar] [CrossRef]
- Barchitta, M.; Maugeri, A.; Quattrocchi, A.; Agrifoglio, O.; Scalisi, A.; Agodi, A. The Association of Dietary Patterns with High-Risk Human Papillomavirus Infection and Cervical Cancer: A Cross-Sectional Study in Italy. Nutrients 2018, 10. [Google Scholar] [CrossRef] [PubMed]
- Maugeri, A.; Barchitta, M.; Agrifoglio, O.; Favara, G.; La Mastra, C.; La Rosa, M.C.; San Lio, R.M.; Panella, M.; Cianci, A.; Agodi, A. The impact of social determinants and lifestyles on dietary patterns during pregnancy: Evidence from the “Mamma & Bambino” study. Ann. Ig. 2019, 31, 81–89. [Google Scholar] [PubMed]
- Agodi, A.; Barchitta, M.; Valenti, G.; Marzagalli, R.; Frontini, V.; Marchese, A.E. Increase in the prevalence of the MTHFR 677 TT polymorphism in women born since 1959: Potential implications for folate requirements. Eur. J. Clin. Nutr. 2011, 65, 1302–1308. [Google Scholar] [CrossRef] [PubMed]
- Willett, W.; Stampfer, M.J. Total energy intake: Implications for epidemiologic analyses. Am. J. Epidemiol. 1986, 124, 17–27. [Google Scholar] [CrossRef] [PubMed]
- Ambrosini, G.L.; Mackerras, D.; de Klerk, N.H.; Musk, A.W. Comparison of an Australian food-frequency questionnaire with diet records: Implications for nutrition surveillance. Public Health Nutr. 2003, 6, 415–422. [Google Scholar] [CrossRef] [PubMed]
- Chinn, S. The assessment of methods of measurement. Stat. Med. 1990, 9, 351–362. [Google Scholar] [CrossRef] [PubMed]
- Hebert, J.R.; Miller, D.R. The inappropriateness of conventional use of the correlation coefficient in assessing validity and reliability of dietary assessment methods. Eur. J. Epidemiol. 1991, 7, 339–343. [Google Scholar] [CrossRef]
- Masson, L.F.; McNeill, G.; Tomany, J.O.; Simpson, J.A.; Peace, H.S.; Wei, L.; Grubb, D.A.; Bolton-Smith, C. Statistical approaches for assessing the relative validity of a food-frequency questionnaire: Use of correlation coefficients and the kappa statistic. Public Health Nutr. 2003, 6, 313–321. [Google Scholar] [CrossRef] [PubMed]
- Bland, J.M.; Altman, D.G. Measuring agreement in method comparison studies. Stat. Methods Med. Res. 1999, 8, 135–160. [Google Scholar] [CrossRef]
- Tabacchi, G.; Filippi, A.R.; Breda, J.; Censi, L.; Amodio, E.; Napoli, G.; Bianco, A.; Jemni, M.; Firenze, A.; Mammina, C. Comparative validity of the ASSO-Food Frequency Questionnaire for the web-based assessment of food and nutrients intake in adolescents. Food Nutr. Res. 2015, 59. [Google Scholar] [CrossRef]
- Cade, J.; Thompson, R.; Burley, V.; Warm, D. Development, Validation and Utilisation of Food-Frequency Questionnaires—A Review. Public Health Nutr. 2002, 5, 567–587. [Google Scholar] [CrossRef] [PubMed]
- Tabacchi, G.; Amodio, E.; Di Pasquale, M.; Bianco, A.; Jemni, M.; Mammina, C. Validation and reproducibility of dietary assessment methods in adolescents: A systematic literature review. Public Health Nutr. 2014, 17, 2700–2714. [Google Scholar] [CrossRef]
- Deschamps, V.; de Lauzon-Guillain, B.; Lafay, L.; Borys, J.M.; Charles, M.A.; Romon, M. Reproducibility and relative validity of a food-frequency questionnaire among French adults and adolescents. Eur. J. Clin. Nutr. 2009, 63, 282–291. [Google Scholar] [CrossRef]
- Watson, J.F.; Collins, C.E.; Sibbritt, D.W.; Dibley, M.J.; Garg, M.L. Reproducibility and comparative validity of a food frequency questionnaire for Australian children and adolescents. Int. J. Behav. Nutr. Phys. Act. 2009, 6, 62. [Google Scholar] [CrossRef] [PubMed]
- Fallaize, R.; Forster, H.; Macready, A.L.; Walsh, M.C.; Mathers, J.C.; Brennan, L.; Gibney, E.R.; Gibney, M.J.; Lovegrove, J.A. Online dietary intake estimation: Reproducibility and validity of the Food4Me food frequency questionnaire against a 4-day weighed food record. J. Med. Internet Res. 2014, 16. [Google Scholar] [CrossRef]
- Matthys, C.; Pynaert, I.; De Keyzer, W.; De Henauw, S. Validity and reproducibility of an adolescent web-based food frequency questionnaire. J. Am. Diet. Assoc. 2007, 107, 605–610. [Google Scholar] [CrossRef] [PubMed]
- Vereecken, C.A.; De Bourdeaudhuij, I.; Maes, L. The HELENA online food frequency questionnaire: Reproducibility and comparison with four 24-h recalls in Belgian-Flemish adolescents. Eur. J. Clin. Nutr. 2010, 64, 541–548. [Google Scholar] [CrossRef][Green Version]


| Food Groups (g) | Web-FFQ | Print-FFQ | Wilcoxon Rank Test | Classified in the Same Quartile | Classified in the Adjacent Quartile | Classified in the Opposite Quartile | Weighted Kappa | Spearman’s Correlation Coefficient | ||||
|---|---|---|---|---|---|---|---|---|---|---|---|---|
| Median | Q1 | Q3 | Median | Q1 | Q3 | |||||||
| Potatoes | 5.0 | 0.0 | 20.0 | 7.5 | 0.0 | 15.0 | 0.872 | 37.7% | 42.3% | 4.6% | 0.429 | 0.46 |
| Cooked vegetables | 76.0 | 43.3 | 124.7 | 80.0 | 46.5 | 123.3 | 0.799 | 46.9% | 39.4% | 1.7% | 0.587 | 0.60 |
| Raw vegetables | 83.3 | 36.7 | 135.0 | 77.5 | 33.3 | 163.3 | 0.518 | 57.1% | 32.0% | 2.3% | 0.654 | 0.67 |
| Legumes | 21.3 | 8.7 | 45.8 | 22.7 | 11.8 | 44.0 | 0.283 | 49.7% | 36.0% | 2.3% | 0.576 | 0.56 |
| Fruit | 149.3 | 74.7 | 263.0 | 176.7 | 79.3 | 285.3 | 0.206 | 39.4% | 45.1% | 4.0% | 0.490 | 0.55 |
| Nuts | 0.5 | 0.0 | 2.0 | 1.0 | 0.0 | 5.0 | 0.002 | 48.6% | 31.4% | 9.1% | 0.471 | 0.50 |
| Milk | 50.0 | 0.0 | 200.0 | 50.0 | 0.0 | 200.0 | 0.544 | 54.9% | 32.6% | 4.6% | 0.601 | 0.65 |
| Yoghurt | 0.0 | 0.0 | 16.7 | 0.0 | 0.0 | 16.7 | 0.234 | - | - | - | - | 0.65 |
| Curd cheese | 16.7 | 8.3 | 33.3 | 16.7 | 8.3 | 33.3 | 0.316 | 46.9% | 28.0% | 6.9% | 0.370 | 0.38 |
| Ripened cheese | 13.3 | 3.3 | 30.0 | 16.7 | 3.3 | 33.3 | 0.172 | 50.3% | 33.7% | 2.9% | 0.560 | 0.61 |
| Pasta | 60.0 | 30.7 | 70.0 | 56.0 | 32.7 | 77.2 | 0.195 | 44.6% | 34.9% | 2.3% | 0.478 | 0.49 |
| Rice | 6.7 | 1.2 | 10.7 | 5.3 | 1.2 | 11.0 | 0.539 | 46.9% | 34.3% | 4.6% | 0.474 | 0.48 |
| White bread | 20.0 | 9.8 | 36.1 | 23.2 | 9.0 | 45.5 | 0.054 | 44.6% | 34.3% | 4.6% | 0.431 | 0.48 |
| Whole wheat bread | 0.4 | 0.0 | 16.1 | 0.0 | 0.0 | 17.7 | 0.497 | - | - | - | - | 0.50 |
| Breakfast cereals | 3.0 | 0.0 | 8.0 | 2.0 | 0.0 | 12.0 | 0.241 | 52.6% | 30.9% | 4.0% | 0.563 | 0.62 |
| Red meat | 56.0 | 32.0 | 96.0 | 54.0 | 32.0 | 82.0 | 0.611 | 45.1% | 37.7% | 4.6% | 0.506 | 0.56 |
| White meat | 24.0 | 8.0 | 48.0 | 24.0 | 8.0 | 48.0 | 0.808 | 40.6% | 34.3% | 4.6% | 0.279 | 0.31 |
| Processed meat | 34.3 | 16.0 | 55.3 | 33.2 | 17.8 | 58.7 | 0.555 | 47.4% | 37.1% | 1.7% | 0.568 | 0.59 |
| Offal | 0.0 | 0.0 | 0.0 | 0.0 | 0.0 | 0.0 | 0.147 | - | - | - | - | 0.49 |
| Canned fish | 6.9 | 0.0 | 13.9 | 6.9 | 0.0 | 13.9 | 0.550 | 51.4% | 32.6% | 2.9% | 0.523 | 0.54 |
| Shellfish | 5.0 | 0.0 | 20.0 | 5.0 | 0.0 | 15.0 | <0.001 | 47.4% | 27.4% | 8.6% | 0.406 | 0.42 |
| Fish | 24.7 | 11.8 | 54.3 | 26.0 | 10.0 | 45.0 | 0.641 | 46.9% | 38.9% | 13.1% | 0.591 | 0.62 |
| Eggs | 16.0 | 8.0 | 32.0 | 16.0 | 8.0 | 32.0 | 0.111 | 49.1% | 38.3% | 1.1% | 0.622 | 0.62 |
| Vegetable oil | 0.0 | 0.0 | 4.0 | 0.0 | 0.0 | 4.0 | 0.277 | - | - | - | - | 0.38 |
| Olive oil | 30.0 | 15.0 | 36.0 | 30.0 | 15.0 | 36.0 | 0.519 | 42.9% | 44.6% | 1.7% | 0.337 | 0.39 |
| Butter and margarine | 0.7 | 0.0 | 2.7 | 0.7 | 0.0 | 1.3 | 0.054 | 56.0% | 25.1% | 5.7% | 0.552 | 0.56 |
| Sweets and refined sugar | 21.2 | 10.5 | 37.3 | 18.0 | 10.5 | 36.0 | 0.141 | 47.4% | 35.4% | 4.0% | 0.499 | 0.55 |
| Fruit juice | 33.3 | 0.0 | 133.3 | 13.3 | 0.0 | 80.0 | <0.001 | 45.7% | 34.3% | 5.7% | 0.479 | 0.54 |
| Coffee | 5.0 | 0.0 | 50.0 | 5.0 | 0.0 | 40.0 | 0.132 | 55.4% | 31.4% | 3.4% | 0.605 | 0.65 |
| Tea | 4.0 | 0.0 | 33.3 | 4.0 | 0.0 | 53.3 | 0.067 | 55.6% | 12.6% | 8.0% | 0.451 | 0.50 |
| Dipping sauces | 1.3 | 0.0 | 2.7 | 1.3 | 0.0 | 2.7 | 0.070 | 53.1% | 36.0% | 0.0% | 0.605 | 0.61 |
| Soup | 7.5 | 0.0 | 20.0 | 7.5 | 0.0 | 20.0 | 0.304 | 57.1% | 28.0% | 2.3% | 0.624 | 0.64 |
| Pizza | 30.0 | 12.0 | 40.0 | 30.0 | 20.0 | 40.0 | 0.141 | 37.7% | 37.1% | 6.3% | 0.154 | 0.14 |
| Wine | 0.0 | 0.0 | 0.0 | 0.0 | 0.0 | 0.0 | 0.940 | - | - | - | - | 0.48 |
| Alcoholic drink | 0.0 | 0.0 | 4.0 | 0.0 | 0.0 | 4.0 | 0.826 | - | - | - | - | 0.55 |
| Beer | 0.0 | 0.0 | 33.0 | 0.0 | 0.0 | 22.0 | 0.377 | - | - | - | - | 0.63 |
| Salty snacks | 2.2 | 0.4 | 4.3 | 2.2 | 0.8 | 5.0 | 0.409 | 39.4% | 40.6% | 4.6% | 0.446 | 0.51 |
| Fries | 18.0 | 6.0 | 24.0 | 12.0 | 6.0 | 24.0 | 0.681 | 45.1% | 36.0% | 3.4% | 0.464 | 0.48 |
| Fruit salad | 0.0 | 0.0 | 10.0 | 0.0 | 0.0 | 5.0 | 0.058 | - | - | - | - | 0.54 |
| Nutrients | Web-FFQ | Print-FFQ | Wilcoxon Rank Test | Classified in the Same Quartile | Classified in the Adjacent Quartile | Classified in the Opposite Quartile | Weighted Kappa | Spearman’s Correlation Coefficient | ||||
|---|---|---|---|---|---|---|---|---|---|---|---|---|
| Median | Q1 | Q3 | Median | Q1 | Q3 | |||||||
| Total energy intake, kcal | 1888.2 | 1328.6 | 2618.4 | 1926.9 | 1503.0 | 2583.3 | 0.092 | 42.5% | 43.0% | 2.8% | 0.538 | 0.58 |
| SFA, mg | 22.6 | 15.6 | 34.4 | 24.2 | 17.8 | 32.7 | 0.129 | 44.1% | 39.7% | 2.8% | 0.524 | 0.57 |
| MUFA, mg | 34.4 | 24.8 | 53.2 | 42.3 | 29.6 | 57.6 | <0.001 | 38.0% | 41.9% | 5.0% | 0.410 | 0.45 |
| PUFA, mg | 12.9 | 8.6 | 17.9 | 13.8 | 9.7 | 18.6 | 0.088 | 43.6% | 38.5% | 3.9% | 0.474 | 0.50 |
| Folate, µg | 252.2 | 163.6 | 385.8 | 251.9 | 162.4 | 376.5 | 0.422 | 40.8% | 46.4% | 2.2% | 0.564 | 0.61 |
| Iron, mg | 12.7 | 8.9 | 16.8 | 12.6 | 9.2 | 19.0 | 0.209 | 43.6% | 40.2% | 3.4% | 0.513 | 0.58 |
| Calcium, mg | 776.1 | 558.9 | 1196.2 | 812.2 | 584.5 | 1207.4 | 0.128 | 47.5% | 39.7% | 2.8% | 0.578 | 0.59 |
| Magnesium, mg | 261.1 | 180.9 | 342.1 | 251.5 | 188.6 | 357.2 | 0.826 | 39.7% | 44.1% | 2.8% | 0.506 | 0.56 |
| Zinc, mg | 9.5 | 6.5 | 13.6 | 9.4 | 6.8 | 13.4 | 0.334 | 46.9% | 40.2% | 1.7% | 0.596 | 0.62 |
| Vitamin A, µg | 736.9 | 472.3 | 1186.0 | 793.6 | 501.0 | 1185.5 | 0.621 | 45.3% | 40.2% | 2.2% | 0.560 | 0.59 |
| Vitamin B1, mg | 1.4 | 1.0 | 1.9 | 1.4 | 1.0 | 2.0 | 0.467 | 39.7% | 42.5% | 2.8% | 0.499 | 0.52 |
| Vitamin B6, mg | 2.0 | 1.4 | 2.9 | 2.1 | 1.5 | 2.9 | 0.525 | 43.6% | 39.1% | 3.4% | 0.484 | 0.53 |
| Vitamin C, mg | 119.2 | 50.4 | 184.4 | 86.3 | 48.3 | 159.9 | 0.055 | 42.5% | 35.2% | 3.9% | 0.421 | 0.47 |
| Vitamin D, µg | 5.3 | 3.0 | 9.6 | 5.4 | 3.3 | 9.5 | 0.550 | 44.7% | 37.4% | 4.5% | 0.475 | 0.50 |
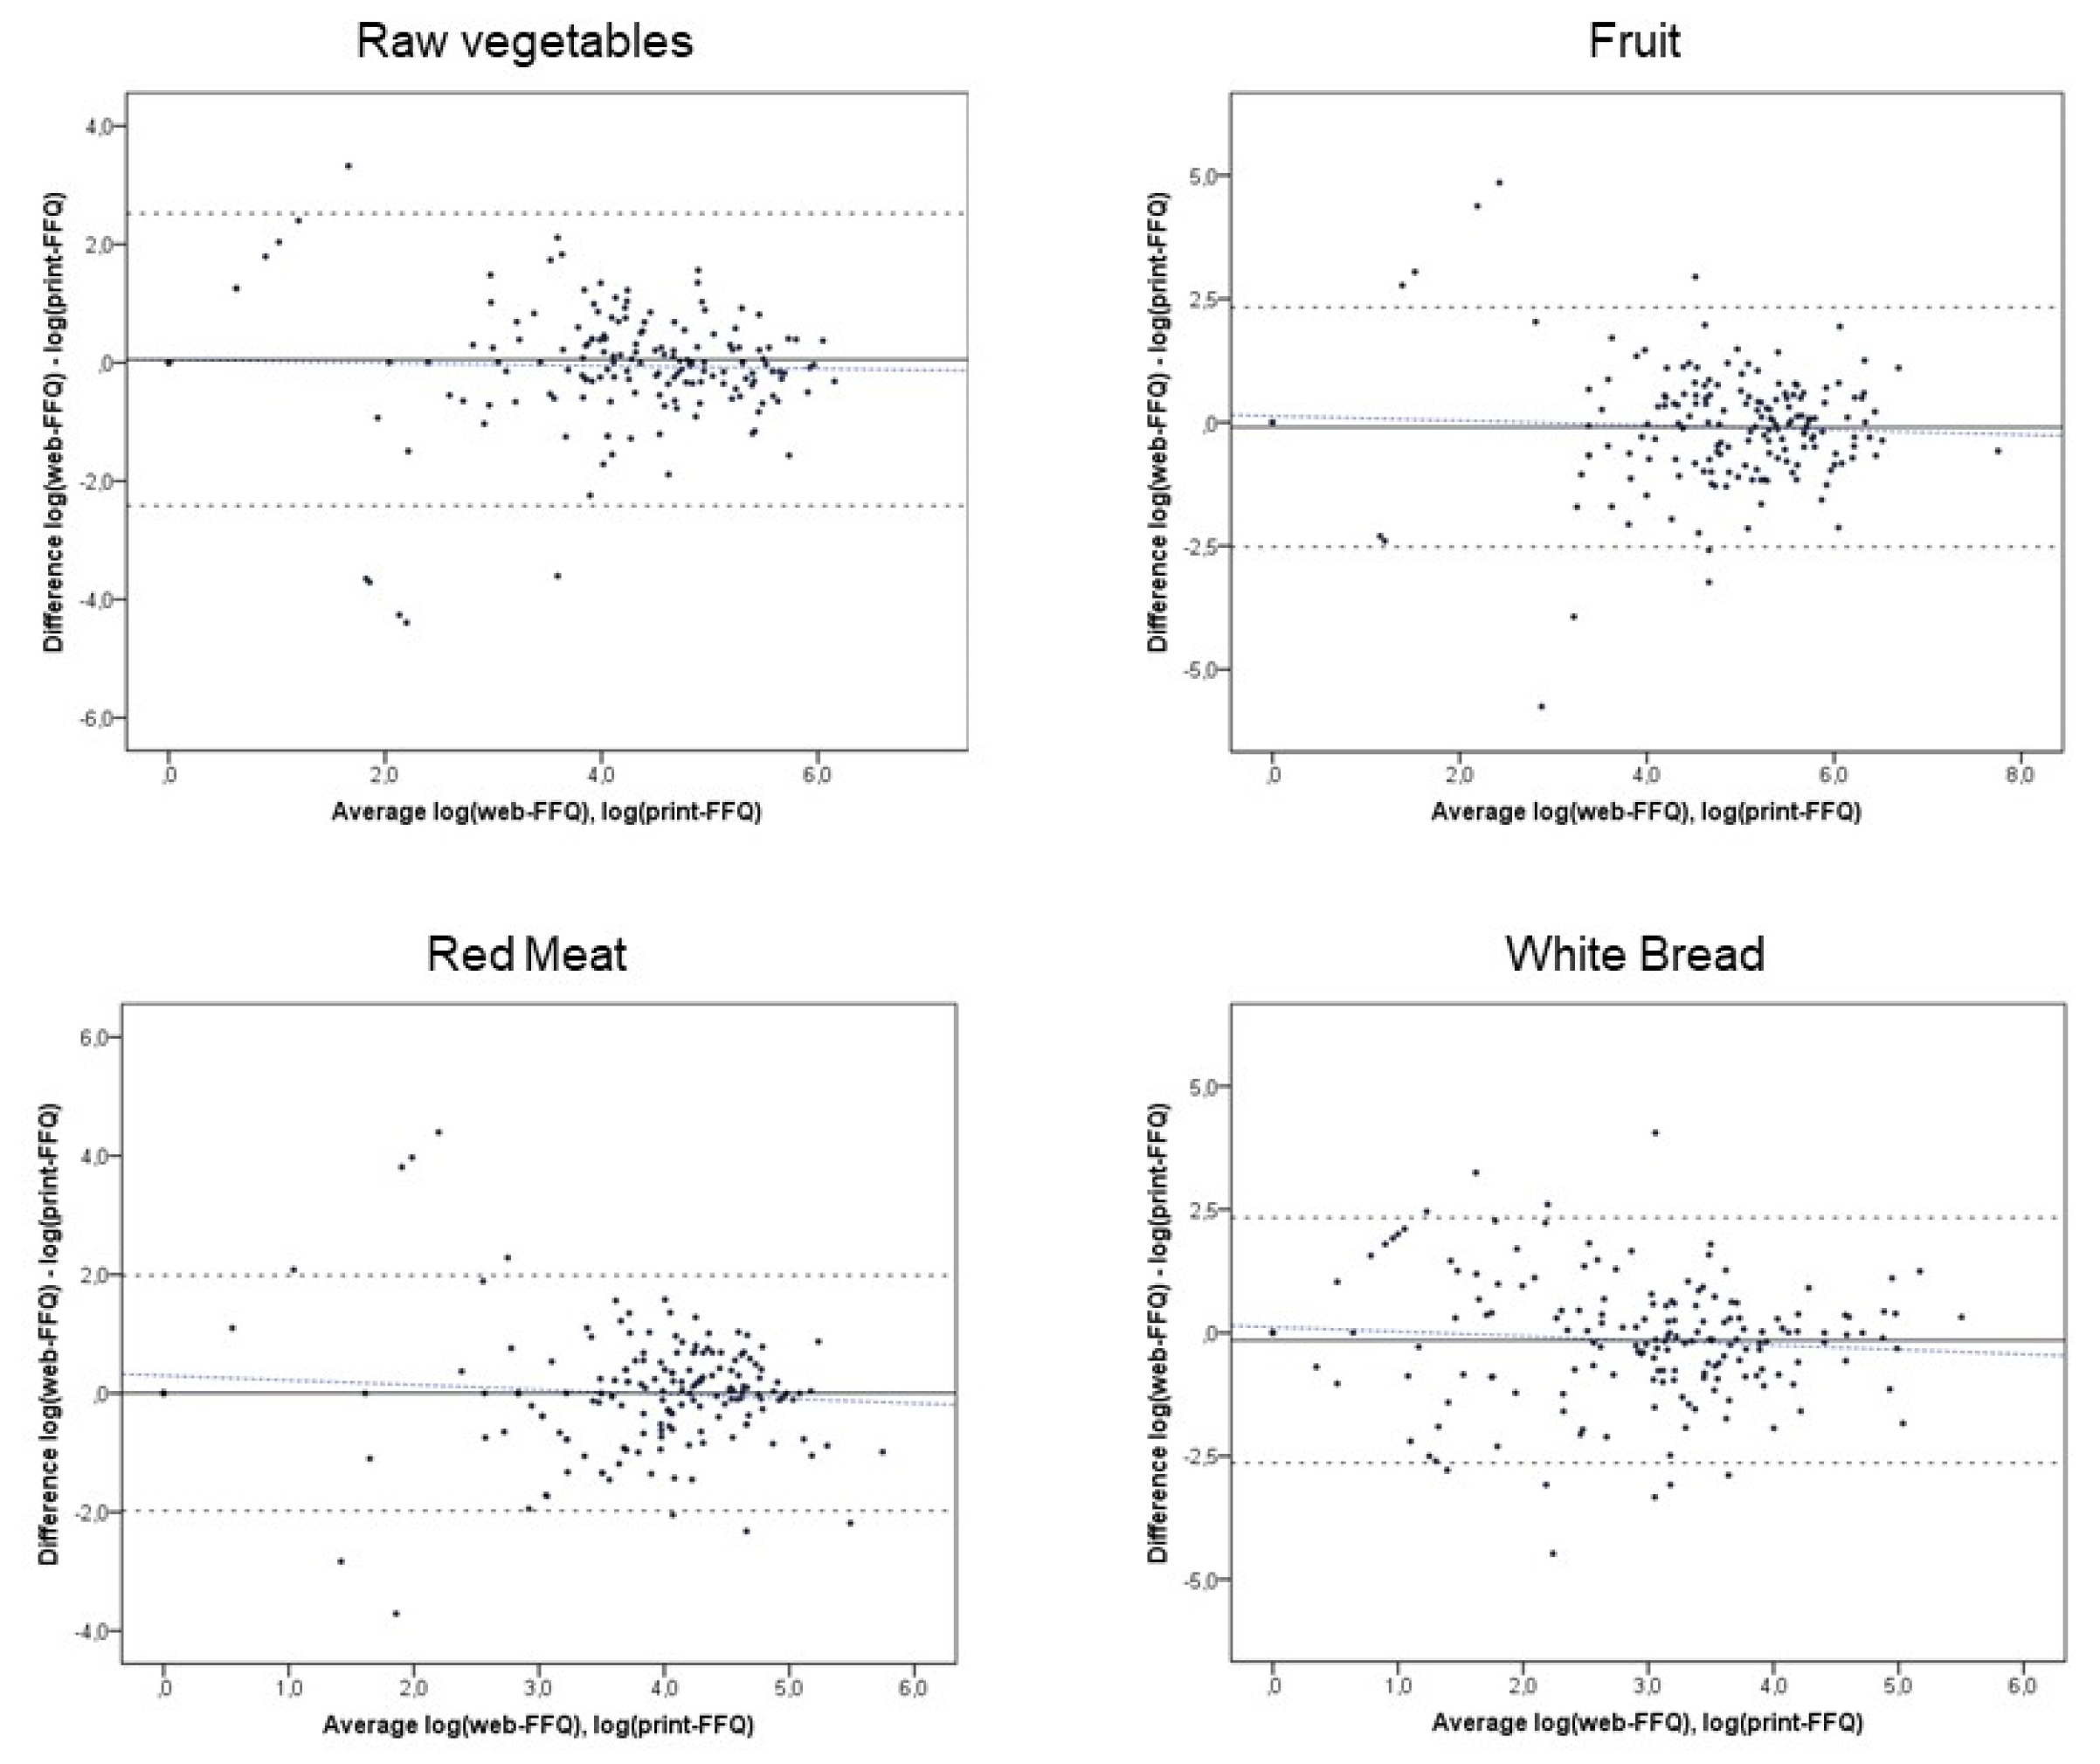
| Food Groups | Mean Agreement (95% CI) | Lower LOA | Upper LOA | Slope (β) |
|---|---|---|---|---|
| Potatoes | −0.030 (−0.254, 0.194) | −2.973 | 2.913 | 0.054 |
| Cooked vegetables | −0.089 (−0.220, 0.042) | −1.809 | 1.631 | 0.111 |
| Raw vegetables | 0.050 (−0.138, 0.238) | −2.421 | 2.521 | −0.126 |
| Legumes | 0.038 (−0.146, 0.222) | −2.384 | 2.460 | 0.017 |
| Fruit | −0.097 (−0.281, 0.088) | −2.520 | 2.327 | −0.047 |
| Nuts | −0.220 (−0.361, −0.079) | −2.072 | 1.632 | −0.139 |
| Milk | 0.151 (−0.162, 0.465) | −3.966 | 4.269 | −0.073 |
| Yoghurt | −0.195 (−0.414, 0.023) | −3.066 | 2.675 | −0.065 |
| Curd cheese | 0.065 (−0.159, 0.288) | −2.869 | 2.999 | 0.032 |
| Ripened cheese | −0.042 (−0.222, 0.139) | −2.421 | 2.337 | −0.102 |
| Pasta | −0.087 (−0.235, 0.060) | −2.029 | 1.854 | −0.009 |
| Rice | −0.052 (−0.243, 0.140) | −2.567 | 2.464 | 0.009 |
| White bread | −0.153 (−0.341, 0.036) | −2.638 | 2.332 | −0.092 |
| Whole wheat bread | −0.086 (−0.352, 0.181) | −3.586 | 3.414 | −0.088 |
| Breakfast cereals | −0.040 (−0.214, 0.135) | −2.334 | 2.254 | −0.097 |
| Red meat | 0.002 (−0.149, 0.153) | −1.978 | 1.983 | −0.078 |
| White meat | −0.040 (−0.294, 0.215) | −3.385 | 3.306 | 0.010 |
| Processed meat | 0.030 (−0.089, 0.149) | −1.536 | 1.596 | −0.090 |
| Offal | 0.020 (−0.052, 0.093) | −0.932 | 0.973 | 0.514 *** |
| Canned fish | −0.212 (−0.419, −0.006) | −2.922 | 2.497 | 0.037 |
| Shellfish | 0.314 (0.073, 0.555) | −2.848 | 3.476 | 0.258 ** |
| Fish | −0.024 (−0.204, 0.157) | −2.402 | 2.354 | 0.117 |
| Eggs | 0.070 (−0.089, 0.230) | −2.023 | 2.163 | 0.023 |
| Vegetable oil | −0.069 (−0.259, 0.121) | −2.562 | 2.424 | −0.132 |
| Olive oil | −0.162 (−0.296, −0.027) | −1.924 | 1.600 | 0.078 |
| Butter and margarine | 0.086 (−0.025, 0.198) | −1.378 | 1.551 | −0.005 |
| Sweet and processed sugar | 0.065 (−0.081, 0.210) | −1.859 | 1.988 | 0.080 |
| Fruit juice | 0.762 (0.432, 1.091) | −3.563 | 5.087 | 0.011 |
| Coffee | 0.013 (−0.197, 0.223) | −2.744 | 2.769 | 0.029 |
| Tea | −0.232 (−0.548, 0.084) | −4.381 | 3.917 | −0.040 |
| Dipping sauces | −0.066 (−0.156, 0.024) | −1.242 | 1.110 | −0.079 |
| Soup | −0.011 (−0.208, 0.186) | −2.595 | 2.573 | −0.054 |
| Pizza | −0.231 (−0.479, 0.018) | −3.496 | 3.034 | 0.246 |
| Wine | −0.076 (−0.253, 0.100) | −2.396 | 2.244 | 0.010 |
| Alcoholic drink | −0.076 (−0.296, 0.143) | −2.963 | 2.811 | 0.054 |
| Beer | −0.082 (−0.333, 0.169) | −3.379 | 3.216 | −0.028 |
| Salty snacks | −0.089 (−0.219, 0.042) | −1.803 | 1.625 | −0.117 |
| Fries | 0.063 (−0.124, 0.250) | −2.393 | 2.520 | −0.023 |
| Fruit salad | 0.093 (−0.128, 0.313) | −2.803 | 2.989 | 0.170 * |
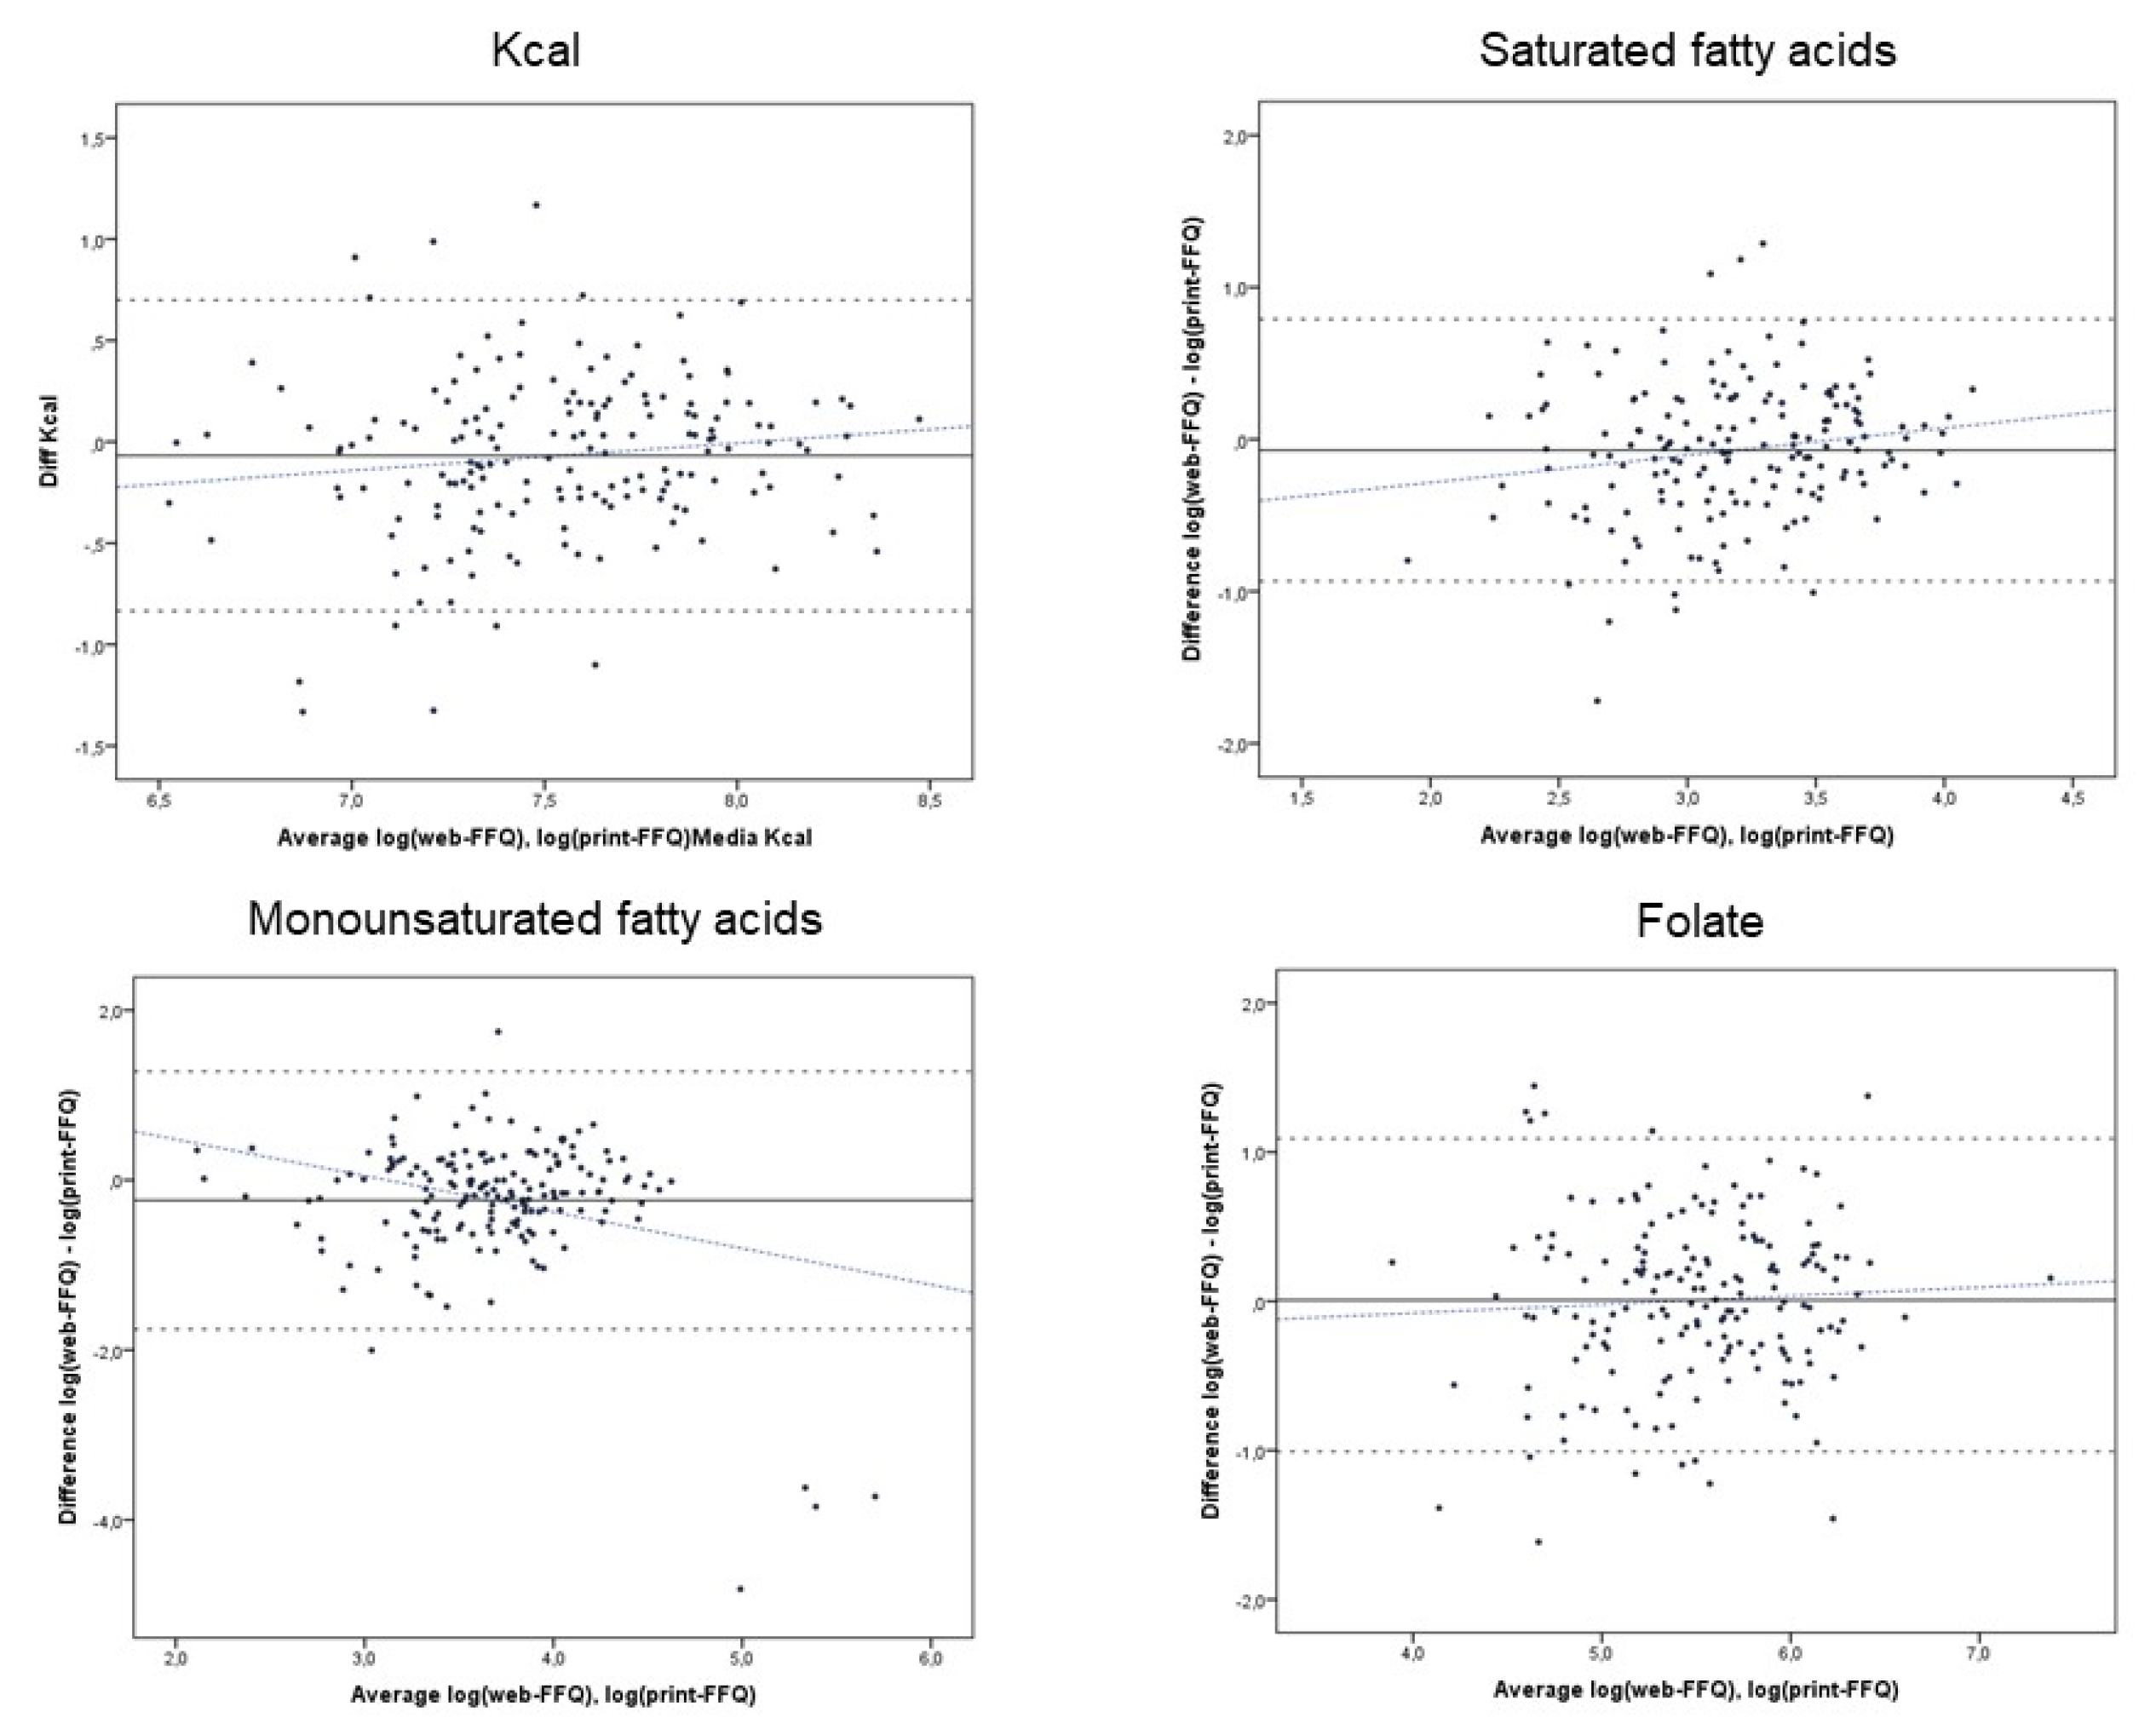
| Nutrient Groups | Mean Agreement (95% CI) | Lower LOA | Upper LOA | Slope (β) |
|---|---|---|---|---|
| Total energy intake, kcal | −0.068 (−0.126, −0.010) | −0.835 | 0.699 | 0.135 |
| SFA, mg | −0.072 (−0.137, −0.006) | −0.934 | 0.790 | 0.179 * |
| MUFA, mg | −0.239 (−0.354, −0.123) | −1.756 | 1.279 | −0.427 *** |
| PUFA, mg | −0.092 (−0.160, −0.024) | −0.990 | 0.806 | −0.020 |
| Folate, µg | 0.007 (−0.076, 0.090) | −1.077 | 1.091 | 0.058 |
| Iron, mg | −0.059 (−0.120, 0.003) | −0.861 | 0.744 | 0.053 |
| Calcium, mg | −0.060 (−0.066, −0,055) | −1.088 | 0.968 | 0.076 |
| Magnesium, mg | −0.025 (−0.087, 0.036) | −0.835 | 0.784 | 0.080 |
| Zinc, mg | −0.037 (−0.095, 0.020) | −0.800 | 0.725 | 0.145 |
| Vitamin A, µg | −0.036 (−0.026, 0.051) | −1.172 | 1.101 | 0.034 |
| Vitamin B1, mg | −0.027 (−0.067, 0.012) | −0.547 | 0.492 | 0.008 |
| Vitamin B6, mg | −0.024 (−0.070, 0.023) | −0.636 | 0.589 | 0.056 |
| Vitamin C, mg | 0.179 (0.043, 0.316) | −1.613 | 1.972 | 0.029 |
| Vitamin D, µg | −0.050 (−0.151, 0.052) | −1.383 | 1.283 | 0.163 |
© 2019 by the authors. Licensee MDPI, Basel, Switzerland. This article is an open access article distributed under the terms and conditions of the Creative Commons Attribution (CC BY) license (http://creativecommons.org/licenses/by/4.0/).
Share and Cite
Barchitta, M.; Maugeri, A.; Agrifoglio, O.; Favara, G.; La Mastra, C.; La Rosa, M.C.; Magnano San Lio, R.; Agodi, A. Comparison of Self-Administered Web-Based and Interviewer Printed Food Frequency Questionnaires for Dietary Assessment in Italian Adolescents. Int. J. Environ. Res. Public Health 2019, 16, 1949. https://doi.org/10.3390/ijerph16111949
Barchitta M, Maugeri A, Agrifoglio O, Favara G, La Mastra C, La Rosa MC, Magnano San Lio R, Agodi A. Comparison of Self-Administered Web-Based and Interviewer Printed Food Frequency Questionnaires for Dietary Assessment in Italian Adolescents. International Journal of Environmental Research and Public Health. 2019; 16(11):1949. https://doi.org/10.3390/ijerph16111949
Chicago/Turabian StyleBarchitta, Martina, Andrea Maugeri, Ottavia Agrifoglio, Giuliana Favara, Claudia La Mastra, Maria Clara La Rosa, Roberta Magnano San Lio, and Antonella Agodi. 2019. "Comparison of Self-Administered Web-Based and Interviewer Printed Food Frequency Questionnaires for Dietary Assessment in Italian Adolescents" International Journal of Environmental Research and Public Health 16, no. 11: 1949. https://doi.org/10.3390/ijerph16111949
APA StyleBarchitta, M., Maugeri, A., Agrifoglio, O., Favara, G., La Mastra, C., La Rosa, M. C., Magnano San Lio, R., & Agodi, A. (2019). Comparison of Self-Administered Web-Based and Interviewer Printed Food Frequency Questionnaires for Dietary Assessment in Italian Adolescents. International Journal of Environmental Research and Public Health, 16(11), 1949. https://doi.org/10.3390/ijerph16111949