Article

The Genetic Basis of Anthocyanin Acylation in North American Grapes (Vitis spp.)

1
School of Integrative Plant Science, Cornell AgriTech, Cornell University, Geneva, NY 14456, USA
2
Instituto Nacional de Investigaciones Forestales, Agrícolas y Pecuarias, Campo Experimental Pabellón, Aguascalientes 20676, Mexico
3
Department of Food Science, Cornell University, Ithaca, NY 14853, USA
4
BRC Bioinformatics Facility, Institute of Biotechnology, Cornell University, Ithaca, NY 14853, USA
5
Department of Food Science, Cornell AgriTech, Cornell University, Geneva, NY 14456, USA
6
USDA-Agricultural Research Service, Grape Genetics Research Unit, Geneva, NY 14456, USA
*
Authors to whom correspondence should be addressed.
Present Address: AgReliant Genetics LLC, Lebanon, IN 46052, USA.
Genes 2021, 12(12), 1962; https://doi.org/10.3390/genes12121962
Submission received: 6 October 2021 / Revised: 1 December 2021 / Accepted: 3 December 2021 / Published: 9 December 2021

Abstract

:
Hydroxycinnamylated anthocyanins (or simply ‘acylated anthocyanins’) increase color stability in grape products, such as wine. Several genes that are relevant for anthocyanin acylation in grapes have been previously described; however, control of the degree of acylation in grapes is complicated by the lack of genetic markers quantitatively associated with this trait. To characterize the genetic basis of anthocyanin acylation in grapevine, we analyzed the acylation ratio in two closely related biparental families, Vitis rupestris B38 × ‘Horizon’ and ‘Horizon’ × Illinois 547-1, for 2 and 3 years, respectively. The acylation ratio followed a bimodal and skewed distribution in both families, with repeatability estimates larger than 0.84. Quantitative trait locus (QTL) mapping with amplicon-based markers (rhAmpSeq) identified a strong QTL from ‘Horizon’ on chromosome 3, near 15.85 Mb in both families and across years, explaining up to 85.2% of the phenotypic variance. Multiple candidate genes were identified in the 14.85–17.95 Mb interval, in particular, three copies of a gene encoding an acetyl-CoA-benzylalcohol acetyltransferase-like protein within the two most strongly associated markers. Additional population-specific QTLs were found in chromosomes 9, 10, 15, and 16; however, no candidate genes were described. The rhAmpSeq markers reported here, which were previously shown to be highly transferable among the Vitis genus, could be immediately implemented in current grapevine breeding efforts to control the degree of anthocyanin acylation and improve the quality of grapes and their products.

1. Introduction

Anthocyanin pigments are widespread in the plant kingdom, including grapevines (Vitis spp.), where they contribute to the coloration of red/black grape berries and resulting products such as juices and wines [1]. Anthocyanins consist of a flavonoid aglycone (an anthocyanidin, e.g., malvidin) covalently linked to one or more sugars [2]. Anthocyanins may be further modified by the acylation of their sugar group(s) by one or more organic acid moieties. The dominant acylated forms in most V. vinifera cultivars are derivatives of hydroxycinnamic acids (e.g., anthocyanidin-3-O-ferulylglucosides, anthocyanidin-3-O-coumarylglucosides) [1]. These hydroxycinnamylated anthocyanins, referred to in this paper simply as ‘acylated anthocyanins’, are of interest because of their enhanced color stability relative to non-acylated anthocyanins in typical food or beverage matrices [3]. For example, as compared to non-acylated analogs, acylated anthocyanins show little change in their absorption profiles over the pH range 3–5 and are less susceptible to thermal hydrolysis [4], purportedly due to intramolecular stacking between the flavonoid and hydroxycinnamyl rings.
The proportion of anthocyanins that exist in acylated forms can vary widely among grape cultivars. For example, a survey of 50 Spanish V. vinifera cultivars reported that the acylated anthocyanin fraction (specifically, the coumarylated fraction) varied from 4.2% to 53.5% [5], and some black-fruited cultivars such as Pinot noir are reported to have no detectable acylated anthocyanins. Similar variation in the degree of acylation has been reported among wild Vitis accessions [6]. DNA markers predicting acylation could be of interest to breeders, e.g., to select for grapes with high proportions of acylated species to achieve greater color stability in grape-derived products or to select for lower acylation to increase anthocyanin bioavailability [7,8] and consequent health benefits [9,10,11].
The biosynthetic pathway of anthocyanins in grapes and other plants is well understood [2], and several markers associated with anthocyanin-related traits have been discovered through mapping studies. MYB transcription factors are critical for regulating total anthocyanin production [12]. Studies with transgenic grapes have demonstrated that VvMYBA is a positive regulator of the later stages of anthocyanin biosynthesis and modification, including the formation of acylated anthocyanins by an anthocyanin acyltransferase (VvAT) [13]. Moreover, work led by Massonnet et al. 2017 [14] identified that the expression of VvAT, as well as other anthocyanin biosynthesis-related genes, was unique to red grape cultivars. QTL analysis of a ‘Syrah’ × Pinot noir mapping population identified several minor QTLs for anthocyanin acylation, including two VvAT genes [15]. However, no further QTL mapping studies have associated VvAT with the presence/absence of acylated anthocyanins in Vitis.
To identify novel markers for anthocyanin acylation, we quantified the anthocyanin acylation ratios (acylated anthocyanins relative to the total anthocyanin content) in two genetically related Vitis biparental populations, V. rupestris B38 × ‘Horizon’ and ‘Horizon’ × Illinois 547-1. These populations segregated for the degree of anthocyanin acylation during 2 and 3 consecutive years, respectively. A set of 2000 amplicon-based markers (rhAmpSeq) were applied to find a stable major QTL on chromosome 3. An analysis of genomic regions harboring this marker-trait association revealed acyltransferase candidate genes regulating the presence/absence of anthocyanin acylation in grapes. Moreover, our highly transferable rhAmpSeq markers linked to anthocyanin acylation could be rapidly adopted in current breeding programs for the selection of grape materials with improved fruit quality.

2. Materials and Methods

2.1. Plant Material and Sampling

Two F1 grapevine families, V. rupestris B38 × ‘Horizon’ and ‘Horizon’ × Illinois 547-1 (material used as female showed first), were grown without replication (single vines of each genotype; additional vines of each parent) in Geneva, New York. ‘Horizon’ (white grape cultivar) is a complex hybrid and includes ancestry from V. vinifera, V. labrusca, V. aestivalis, and V. rupestris [16]. Illinois 547-1 (male with no fruit production) resulted from a cross between V. rupestris B38 × V. cinerea B9; therefore, V. rupestris B38 (the only parent accumulating anthocyanins) is a parent in one family and a grandparent in the other. Fruit sampling and analysis were conducted in 2012 and 2013 for V. rupestris B38 × ‘Horizon’, and in 2011–2013 for ‘Horizon’ × Illinois 547-1. The progeny consisted of 118 and 116 vines in V. rupestris B38 × ‘Horizon’ and 93, 162, and 142 vines in ‘Horizon’ × Illinois 547-1, in each year, respectively. For each genotype, 150 g of fruit were sampled at maturity, based on fruit total soluble solid content (°Brix). TSS means and standard deviation at maturity in the families were 22.7 ± 1.9 and 18.4 ± 1.4 in 2012 and 2013 in V. rupestris B38 × ‘Horizon’ and 17.1 ± 2, 21.4 ± 2.3, and 20.1 ± 2.1 in 2011–2013 in ‘Horizon’ × Illinois 547-1. In addition, in 2013, ‘Horizon’ × Illinois 547-1 fruits were analyzed at an earlier phenological stage, i.e., mean TSS level of 16.5 ± 2.1, to study the effect of ripening stage on the degree of acylation. Sampled fruit was transported in cooler boxes and stored at −20 °C before shipping to the Cornell Ithaca campus for phenotyping.

2.2. Phenotyping and Data Analysis

Frozen berry samples were destemmed, partially thawed, and homogenized in a 250 mL stainless steel Waring blender (Stamford, CT, USA) at medium speed for 30 s and then at high speed for 30 s. A 10 g portion of berry slurry was transferred to a 15 mL centrifuge tube and frozen at −20 °C. Prior to analysis, samples were thawed, equilibrated to room temperature, and centrifuged (5 min, 10,000× g). An anthocyanin fraction was then isolated by solid-phase extraction (SPE) fractionation based on the protocol of Manns et al. 2012. HPLC analyses were performed on an Agilent Model 1260 Infinity series consisting of an in-line vacuum degasser, autosampler, binary pump, diode array detector, and thermostatted column compartment controlled via Chemstation software (Version 3.04.02SP1 with spectral pack). All solvents, including methanol, acetonitrile, ethyl acetate, and formic acid (Thermo Fisher Scientific, Waltham, MA, USA), were high-performance liquid chromatography (HPLC) grade. Anthocyanin HPLC analyses were based on the method described by Manns et al. 2012. Separations were performed on a Kinetex C18 column (100 mm × 4.6 mm, 2.6 μm particle size) fitted with a KrudKatcher guard filter (Phenomenex, Torrance, CA, USA). Anthocyanin identification was based on commercial standards where possible and otherwise based on characterized color extracts, retention times, and UV absorption characteristics (i.e., appearance of a ~320 nm shoulder in hydroxycinnamic-acylated forms) [17]. Quantification was based on malvidin-3-glucoside and malvidin-3,5-diglucoside standards (Extrasynthese; Genay, France) as measures of mono- and diglucoside equivalents, respectively. Negligible concentrations of acetylated anthocyanins were detected in the populations and were ignored, and “acylated anthocyanins” were taken to refer only to hydroxycinnamic-acylated anthocyanins. Cumulative concentrations of total anthocyanins and acylated anthocyanins were then calculated, along with the ratio of acylated to total anthocyanins (Supplementary File S1).
Broad-sense heritability was estimated for each population according to REML (restricted maximum likelihood) variance components using the following equation: H2 = (σG2)/(σG2 + σε2/n), where σG2 and σε2 are the variances of the genetic and residuals variance, respectively, and n is the number of experiments over the years, respectively.

2.3. rhAmpSeq Genotyping and Quality Control

DNA from individuals was extracted using modified Qiagen DNeasy columns with 2.7% PVP-40 added to the extraction buffer, as previously described [18]. rhAmpSeq local haplotype sequencing targeting the core Vitis genome was conducted as described in the work of [19,20]. rhAmpSeq markers targeted 250 bp regions evenly distributed across the genome; because there could be multiple polymorphisms (SNPs and indels) per region, each marker represented up to four alleles in the F1 populations studied here. To identify haplotype variants, rhAmpSeq marker data were analyzed using a custom Perl script (https://github.com/avinashkarn/analyze_amplicon/blob/master/analyze_amplicon.pl; (accessed on 2 April 2021)), which was further converted to a variant calling format (VCF) file using the haplotype_to_VCF.pl perl script (https://github.com/avinashkarn/analyze_amplicon/blob/master/haplotype_to_VCF.pl (accessed on 2 April 2021)).
Multidimensional scaling (MDS) and Mendelian error detection were performed as quality controls (Supplementary Files S2 and S3) to identify vines with genotyping errors due to self-pollination, pollen contamination, or mislabeling as described elsewhere [21]. An identical by state (IBS) kinship matrix computed in TASSEL 5 [22] was used to conduct the MDS analysis, which was further visualized using the R ggplot2 package [23]. Similarly, the Mendelian error detection analysis was conducted using the Mendelian plugin in bcftools [24].

2.4. Genetic Map Construction

A genetic map was constructed in Lep-MAP3 v. 0.2 [25] using the VCF format files and the pedigree information of each vine in the two mapping populations (V. rupestris B38 × ‘Horizon’ and ‘Horizon’ × Illinois 547-1, Supplementary Files S4 and S5). The following Lep-MAP3 modules and steps were used to construct the genetic maps: (1) ParentCall2 module of Lep-MAP3 was used to call parental genotypes; (2) Filtering2 module was used to filter distorted markers based on a χ2(chi-squared, p-value > 1 × 10⁻⁶) test and monomorphism (non-segregating); (3) SeparateChromosomes2 module was used to split the marker into linkage groups (LG); (4) OrderMarkers2 module was used to order the markers within each LG using 20 iterations per group, computing parental (sex-specific) and sex-averaged genetic distances. The marker order of the genetic maps was evaluated for the consistency, genome organization, and structural variation by correlating with their physical coordinates on the V. vinifera PN40024 reference genome (version 12X.v2; [26]). Finally, the phased output data from the OrderMarkers2 step were converted into 4-way phased genotype data using the map2genotypes.awk script.

2.5. QTL Analysis

Sex-averaged genetic maps were used for QTL mapping in the R package qtl [27]. The genotype probabilities were calculated using calc.genoprob with step = 0 (probabilities were calculated only at the marker locations) and assumed genotyping error rate of 1.0 × 10⁻⁴. Consistently with the observed binomial distribution on anthocyanin acylation suggesting a single major gene, we tested normal and binomial single-QTL models on acylation ratios and total acylated anthocyanins using the function scanone. Significance thresholds were defined based on 1000 permutation tests at α = 0.05. The percentage of variance explained in the context of a full additive model was calculated using fitqtl.

3. Results

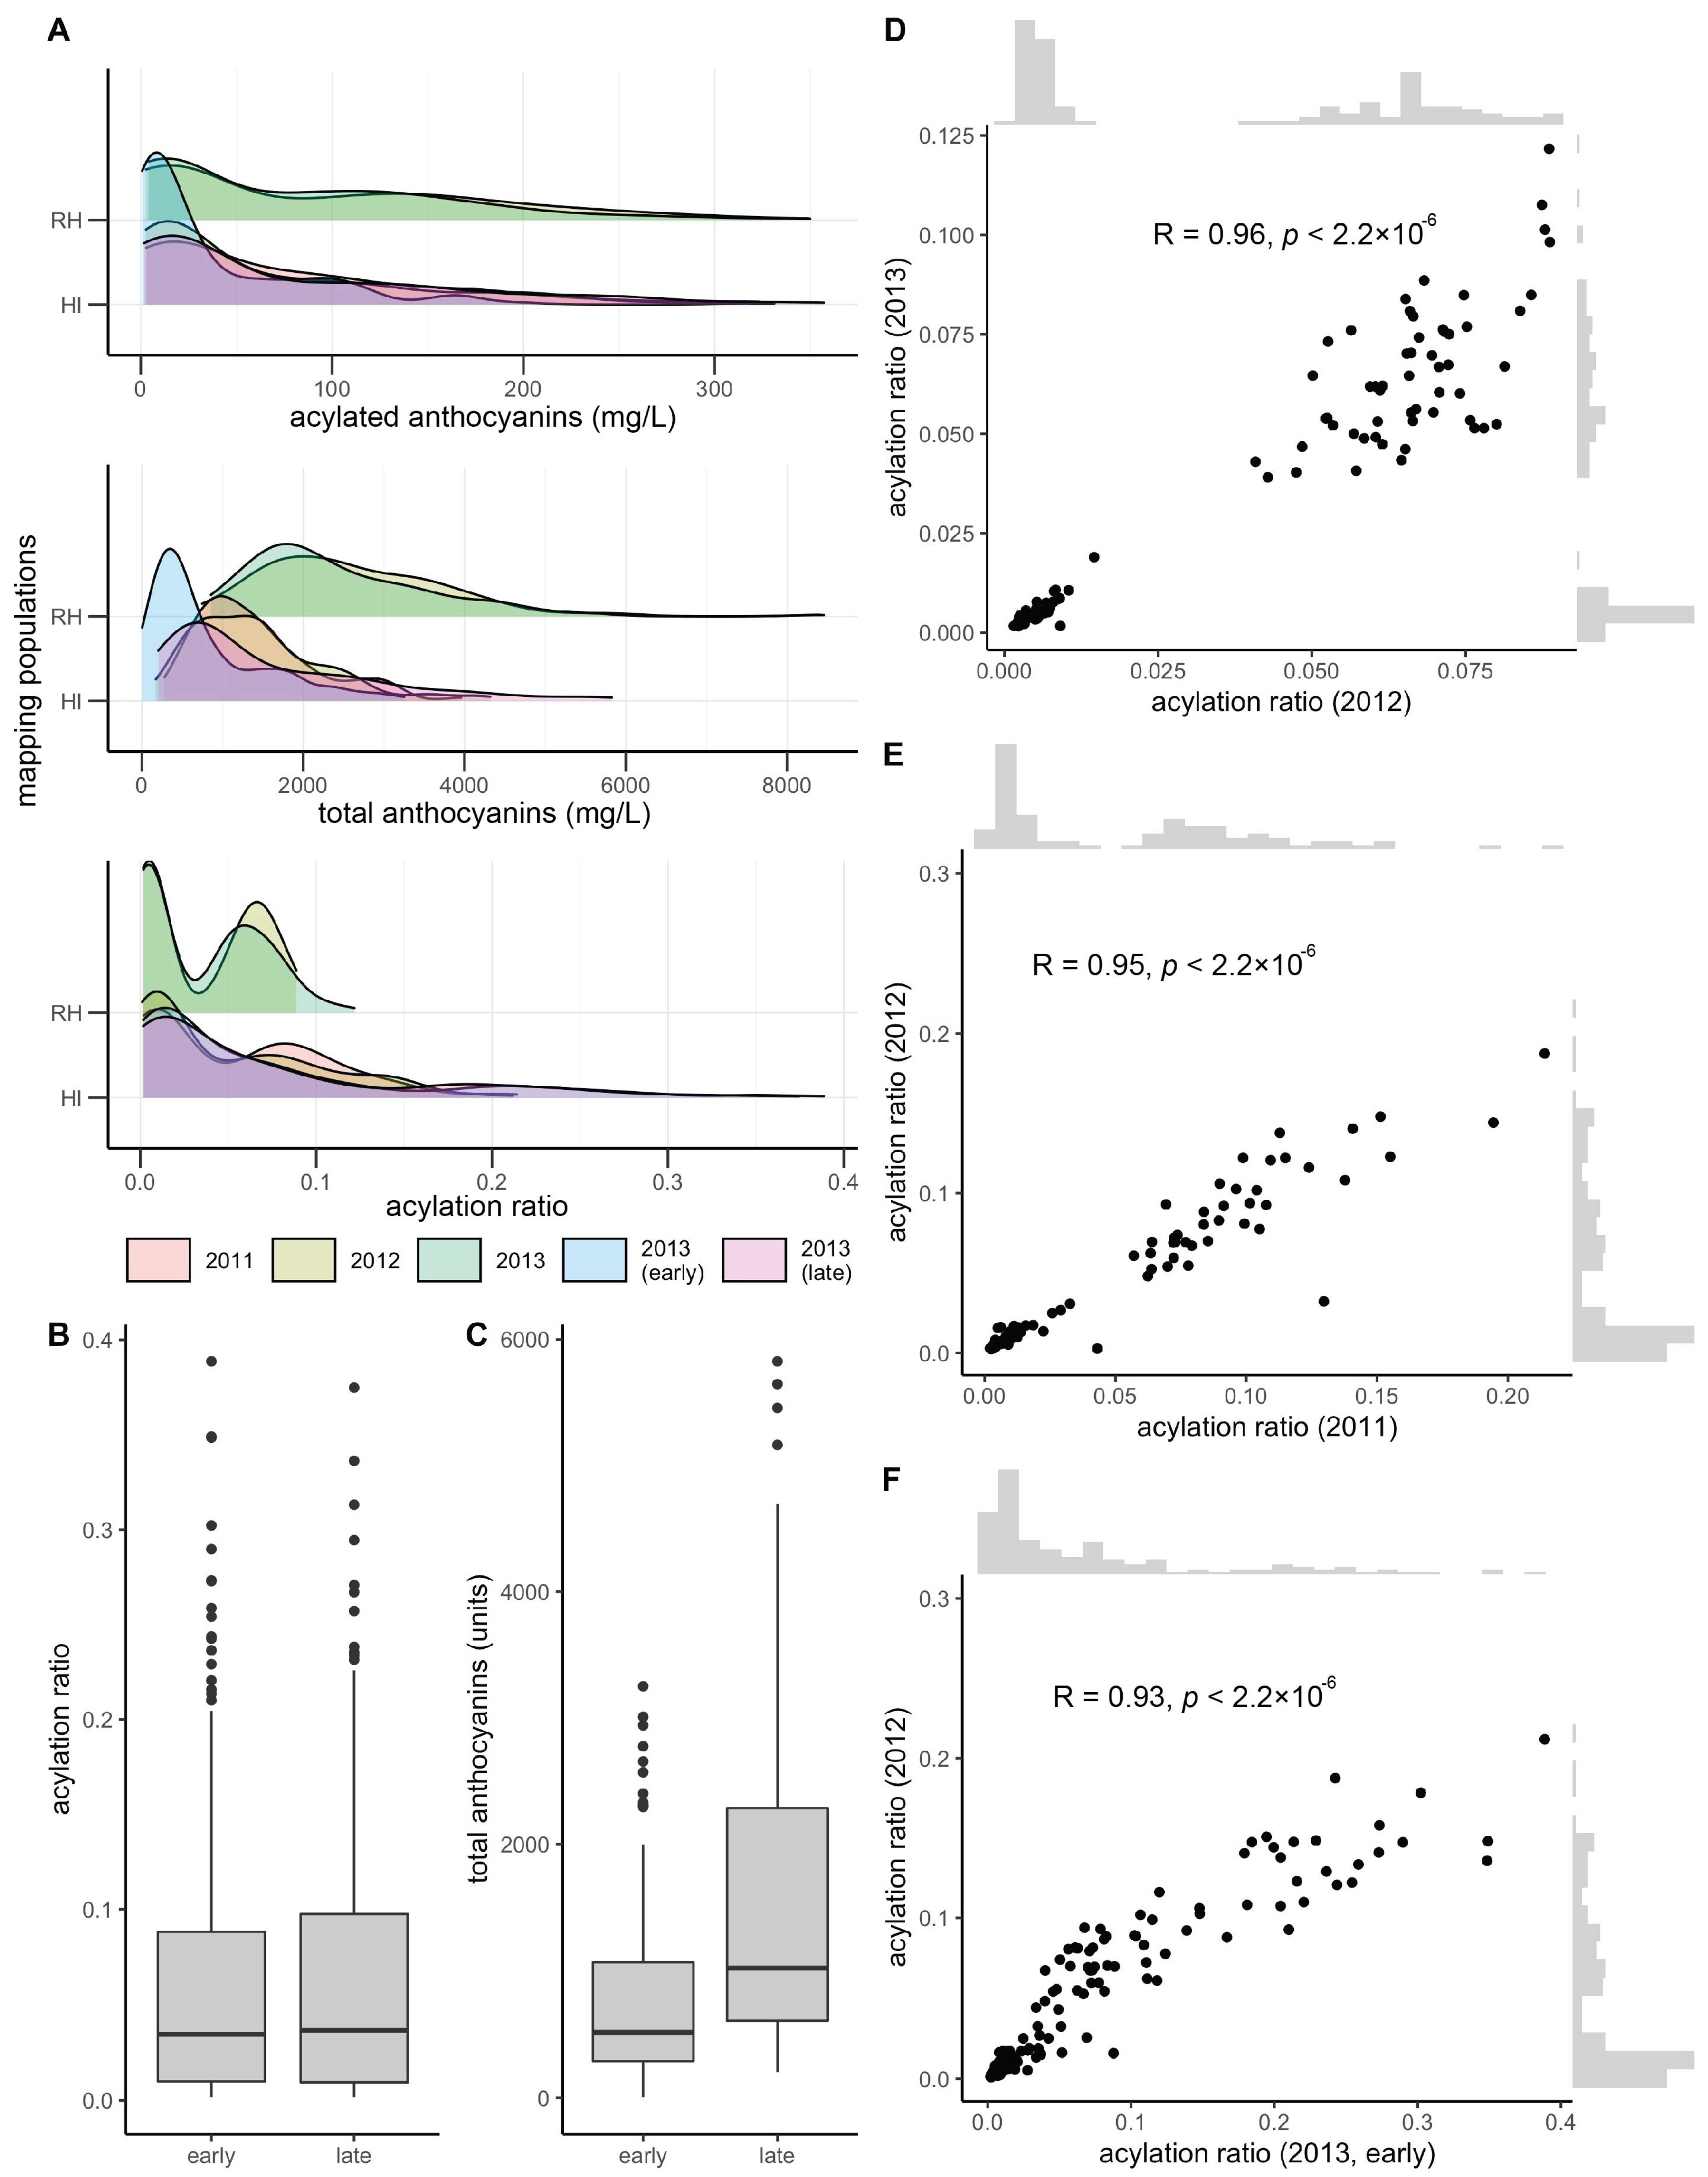
3.1. Mapping Population Showed Presence/Absence Patterns for Anthocyanin Acylation

Total and acylated anthocyanins were quantified from a maximum of 112 and 155 vines in the V. rupestris B38 × ‘Horizon’ (sampled in 2012 and 2013, at late maturity) and ‘Horizon’ × Illinois 547-1 (sampled in 2011, 2012, and 2013, at late maturity; for the later, sampling at early maturation was also conducted) populations, respectively. The acylation ratio was computed as the ratio of acylated anthocyanins relative to the total anthocyanin concentration. Total anthocyanins and acylated anthocyanins were poorly correlated (R = 0.20, average across years and populations), as were total anthocyanins and acylation ratio (R = −0.25, average across years and populations). However, acylated anthocyanins and acylation ratio were strongly correlated (R = 0.75, average across years and populations). Total anthocyanins and acylated anthocyanins showed a skewed normal distribution, whereas the acylation ratio showed a bimodal distribution, more clearly defined in the V. rupestris B38 × ‘Horizon’ population (Figure 1A). Acylation ratio ranged from 0.1% to 12% in V. rupestris B38 × ‘Horizon’, and from 0.1% to 39% in ‘Horizon’ × Illinois 547-1. Based on the two sets of phenotypic data collected for the ‘Horizon’ × Illinois 547-1 population, no changes were observed for acylation ratio when comparing early vs. late (p = 0.98, t-test; Figure 1B); however, total anthocyanin content increased as expected (p = 3.74 × 10⁻⁹; Figure 1C). Pearson’s correlation among years was high (R > 0.93, p < 2.2 × 10⁻¹⁶) within each population (two years for the V. rupestris B38 × ‘Horizon’ population, and 3 years with 2 collection times for the ‘Horizon’ × Illinois 547-1 population; Figure 1D–F). Finally, broad-sense heritability estimates for acylation ratio were 0.95 and 0.84 for the V. rupestris B38 × ‘Horizon’ and ‘Horizon’ × Illinois 547-1 populations, respectively. Data analyzed in this study are provided in Supplementary File S1.

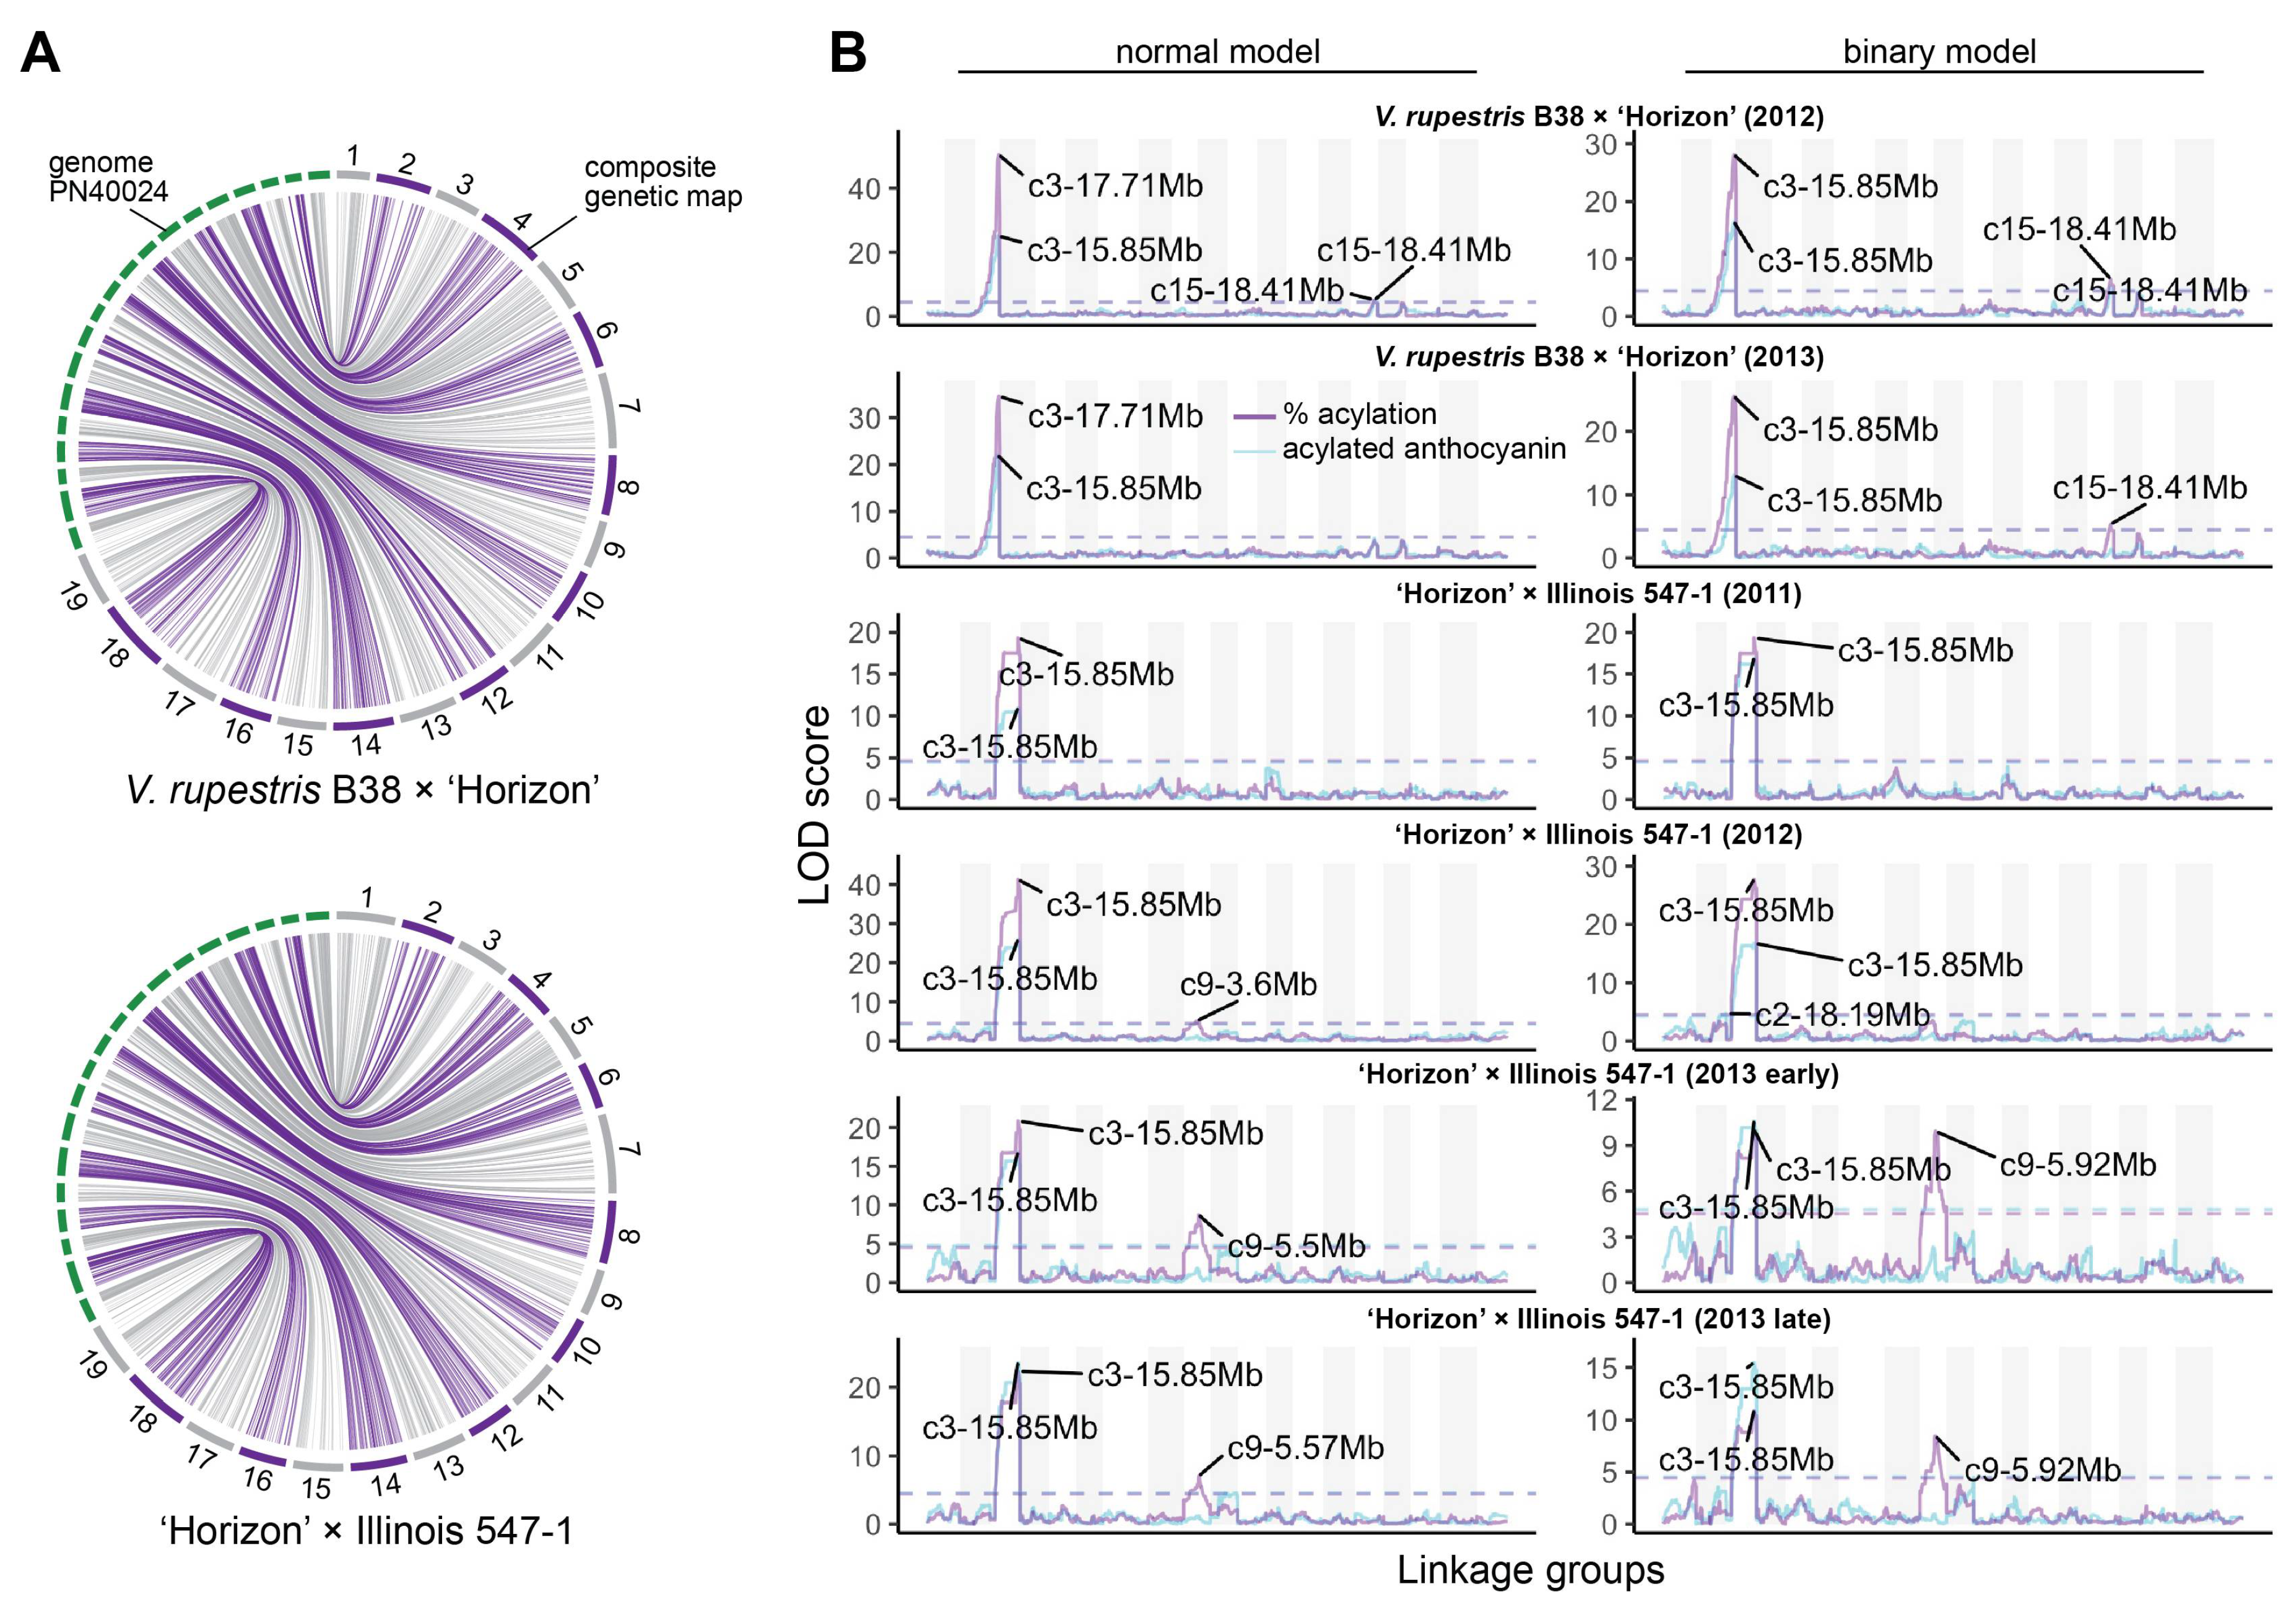
3.2. Stable QTL for Acylation Ratio across Genetic Backgrounds

Composite linkage maps for the V. rupestris B38 × ‘Horizon’ and ‘Horizon’ × Illinois 547-1 populations were constructed using rhAmpSeq markers. Of almost 2000 markers successfully amplified in both populations, about 55% were included in the final maps, and the rest were filtered out due to segregation distortion, monomorphism, or missing data. The V. rupestris B38 × ‘Horizon’ linkage map included 1092 markers and spanned 1206 cM, with an average gap of 1.16 cM (Table 1). The ‘Horizon’ × Illinois 547-1 linkage map showed similar metrics, including 1171 markers spanning 1182 cM and an average gap length of 1.01 cM. Overall, there was an excellent agreement between the reference genome (PN40024) [26] and the linkage maps of the two populations. Particularly, Spearman’s rank correlation between genetic and physical marker positions was >0.99 (on average across chromosomes) for both populations (Figure 2A).
QTL mapping was performed for each year × population data set using both binary (high vs. low acylation ratios) and continuous (quantitative) single-QTL models. For binary single-QTL models, acylation ratio variables were converted to binary traits (0′s and 1′s), according to the requirements of r/qtl, based on k-means clustering analysis. A large QTL on chromosome 3 (position 14.85–17.95 Mb, based on 1.5-LOD interval) was consistently identified across populations and evaluation years. A stronger signal was observed when using a normal model compared to a binary model (Figure 2B). Additionally, the use of acylation ratio as phenotype instead of the total acylated anthocyanins increased the LOD scores of the identified QTL at chromosome 3. On average, this QTL explained 68.97% and 47.25% of the phenotypic variation (acylation ratio) for the normal and binary single-QTL models, respectively. Significant marker-trait associations on chromosomes 9, 10, and 15 were also discovered; however, these were mostly population-specific (Figure 2B). Although LOD profiles for total acylated anthocyanins and acylation ratio were relatively similar, a QTL on chromosome 9 (position 5.5–5.92 Mb) was revealed only when using acylation ratio on the ‘Horizon’ × Illinois 547-1 population.

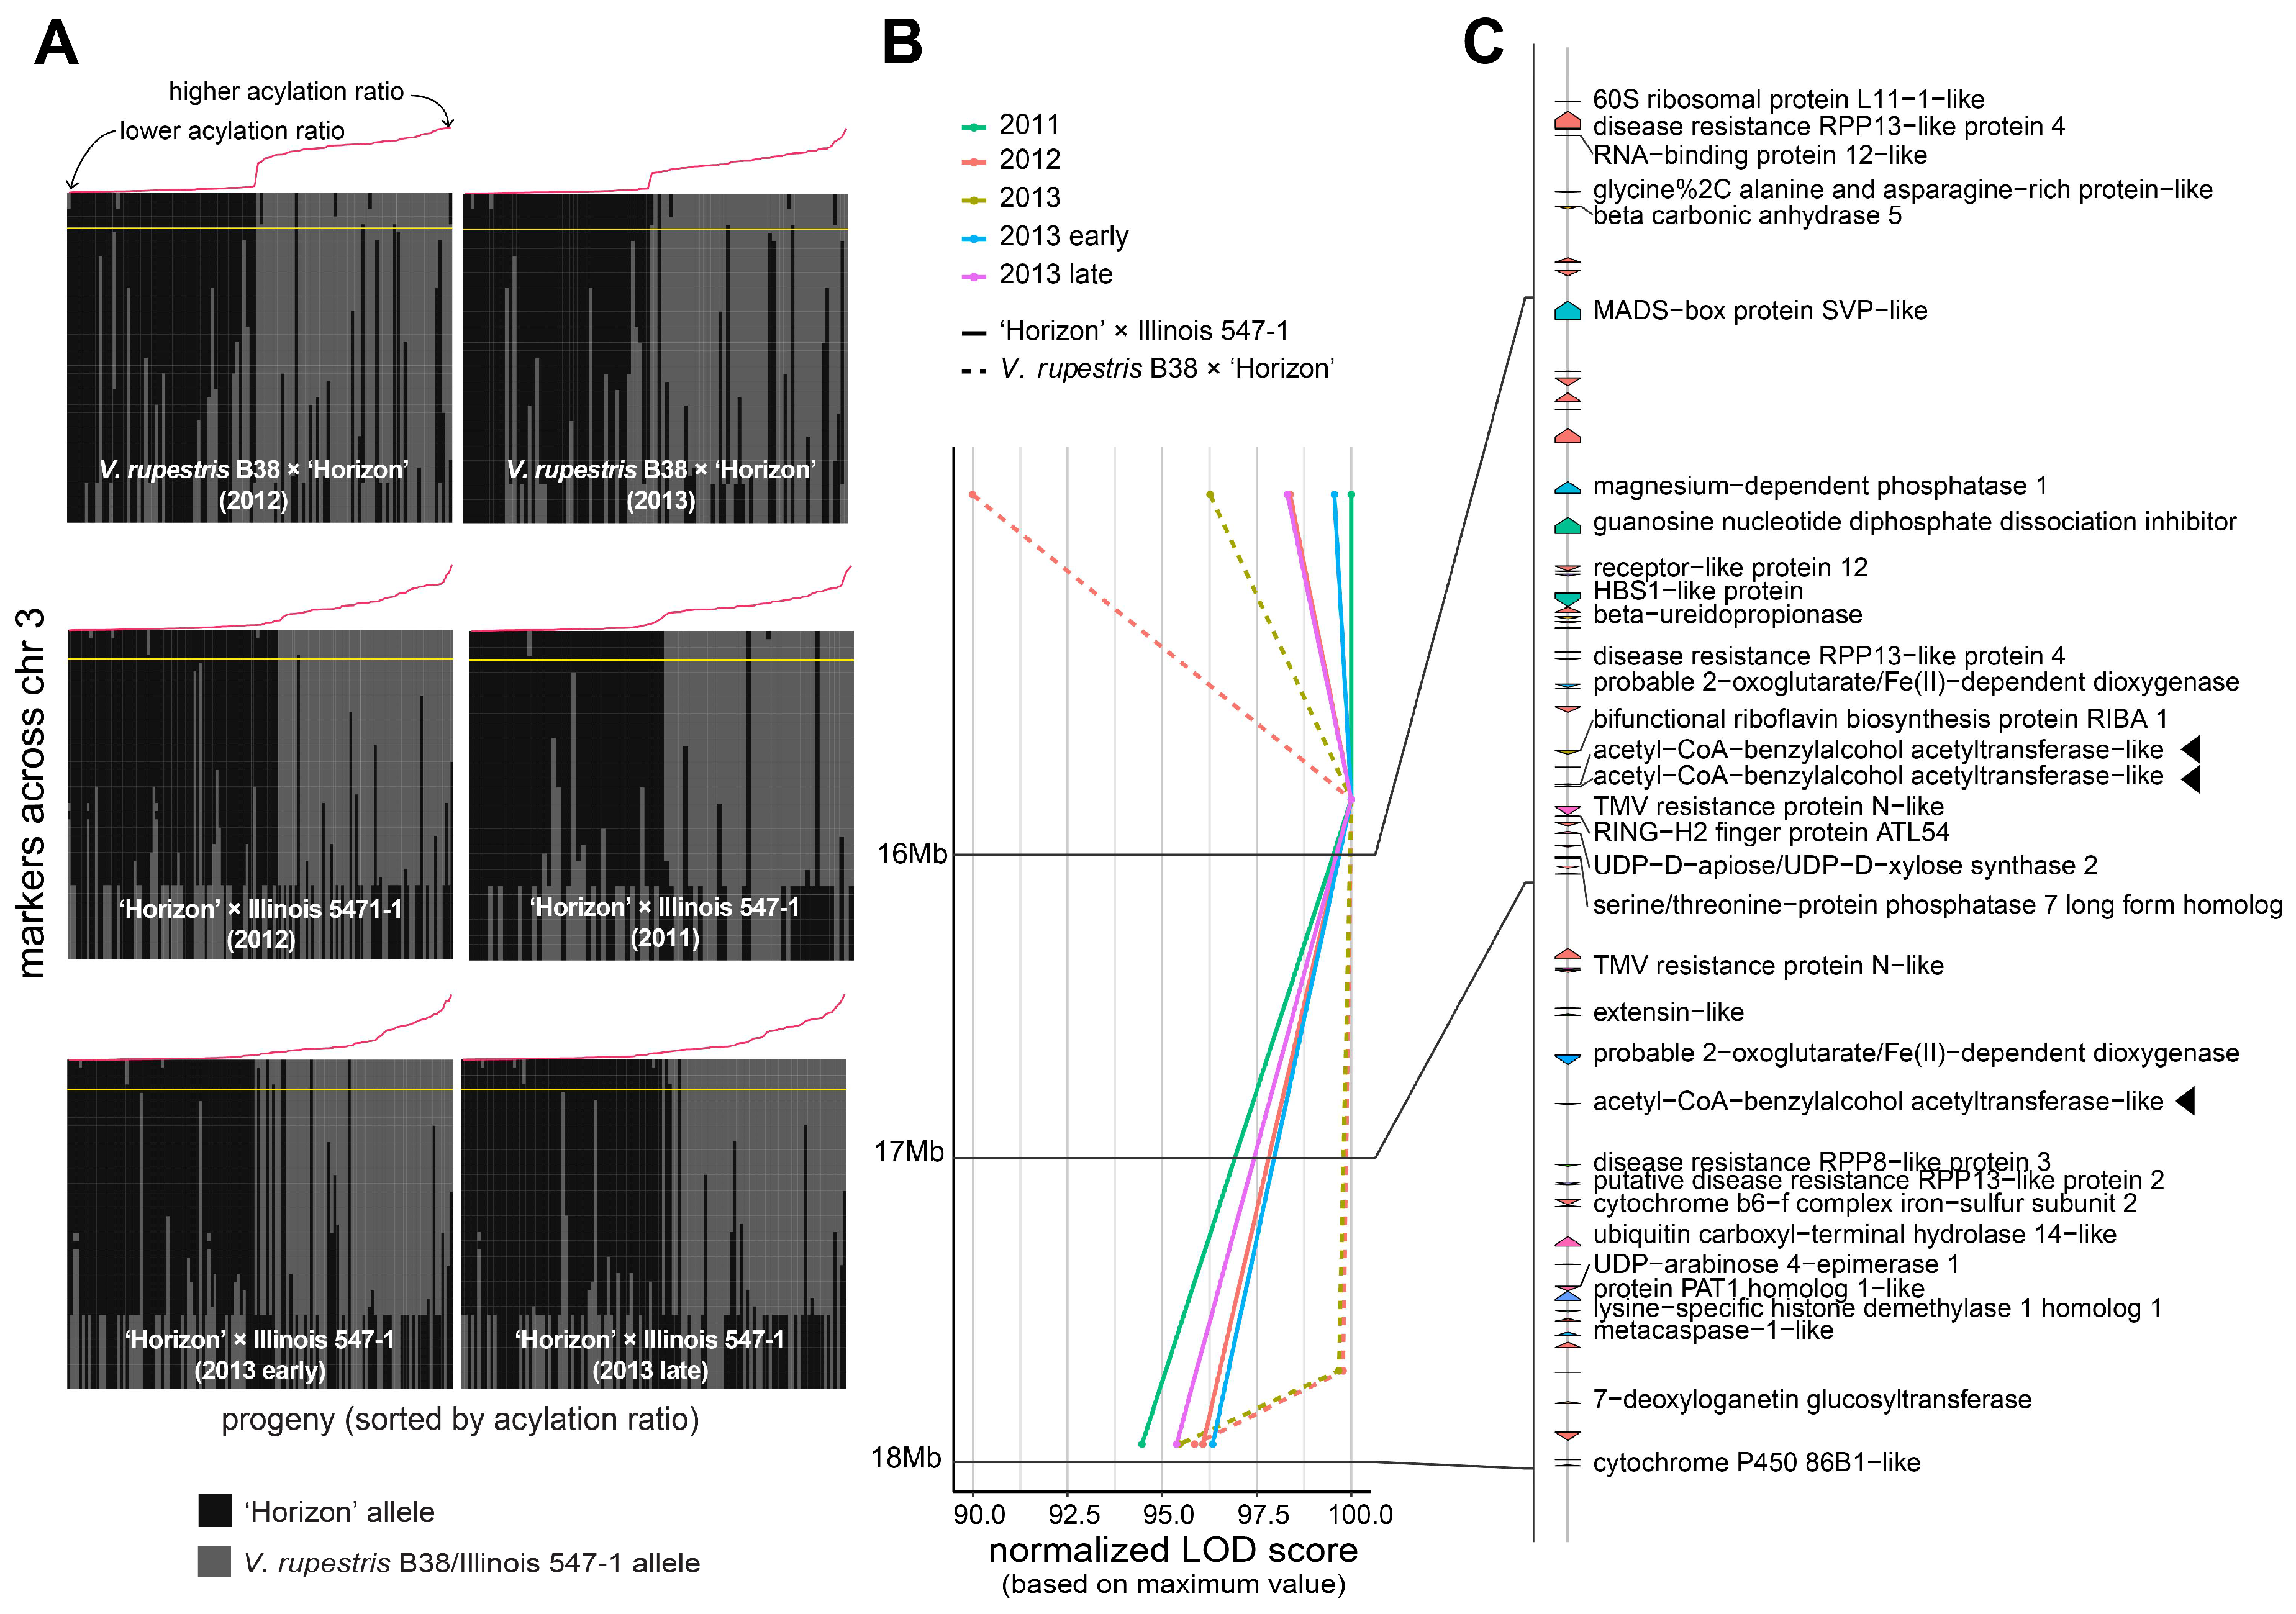
3.3. Candidate Genes

A large QTL on the arm of chromosome 3 was consistently found across different genetic backgrounds and years (Figure 2B). Several genetic markers in that region were highly associated with the percentage of acylation; therefore, a comprehensive analysis of the recombinants in the interval 14.85–17.95 Mb was carried out (Figure 3A). Within the region of interest, there were four markers at positions 14.85, 15.85, 17.71, and 17.95 Mb. These four markers cosegregated almost perfectly with the acylation ratio, except for a few cases (on average, ~3.1 individuals per population), where genotyping errors are a possible explanation. In both populations, high acylation ratios were associated with the ‘Horizon’ genotype.
The 14.85–17.95 Mb region on chromosome 3 of the 12X.v2 PN40024 V. vinifera reference genome was inspected on the URGI database (https://urgi.versailles.inra.fr/Species/Vitis/Annotations (accessed on 6 June 2021)) (Figure 3B,C). In total, there were 74 genes, of which 34 had a functional annotation. The genes LOC104878940, LOC100251354, and LOC104878920 (16831069-16831860b, 16834152-16835462b, and 17377464-17378981b, respectively), all encoding an acetyl-CoA-benzylalcohol acetyltransferase-like protein, were in close proximity to the significant markers at positions 15.85 and 17.71 Mb. This location had the largest LOD score across nearly all the evaluated conditions (i.e., genetic backgrounds, year of evaluation, and normal vs. binary QTL models; Figure 3B). Within the 14.85–17.95 Mb interval, version 4 of the PN40024 genome assembly (https://integrape.eu/resources/genes-genomes/genome-accessions/ (accessed on 26 November 2021)) lists not three but four genes encoding an acetyl-CoA-benzylalcohol acetyltransferase-like protein, which could be explored in further fine-mapping studies.

4. Discussion

Anthocyanins serve a dual role in the food industry as natural pigments and as health-promoting dietary constituents purported to have multiple beneficial properties [9,10,11]. Acylation of anthocyanins affects both attributes yet with contrasting consequences. Acylation increases the color stability of anthocyanins, reducing their sensitivity to pH change, sulfite bleaching, and thermal degradation [4]. Conversely, compared to non-acylated forms, the bioavailability of acylated anthocyanins is substantially lower, consequently limiting their potential benefit following dietary intake [7,8]. As a result, the desired ratio of acylation may vary depending on the purpose and required properties of the anthocyanins. For instance, a high acylation rate may be regarded as advantageous in the case of food colorants but undesirable in the case of dietary supplements. Thus, molecular markers for acylation provide a valuable tool for grape breeders to shift the ratio of acylation in either direction.
In this study, the portion of acylated anthocyanins that existed in acylated form (“acylated anthocyanin ratio”; 0.1%–39%) followed a clear binomial distribution within each population (V. rupestris B38 × ‘Horizon’ and ‘Horizon’ × Illinois 547-1). These ranges for acylation ratios were within previously observed ranges in both V. vinifera and wild Vitis accessions [5,6]. Acylated anthocyanins and acylation ratio were highly correlated, while total anthocyanins and acylation ratio were uncorrelated. This was likely a consequence of the large range in acylated anthocyanin concentrations within a population as compared to total anthocyanins (3 vs. 1 orders of magnitude, respectively).
Using highly transferable rhAmpSeq markers, we mapped a significant association between the anthocyanin acylation ratio and a genomic region harboring three copies of a gene encoding acetyl-CoA-benzylalcohol acetyltransferase-like protein. Previously, a weaker QTL (based on a single year of data from the ‘Horizon’ × Illinois 547-1 population genotyped with GBS) located nearby was detected using total acylated anthocyanins, emphasizing the advantage in normalizing acylated anthocyanin concentration against total anthocyanins [28]. Acetyl-CoA-benzylalcohol acetyltransferase-like proteins are part of the enzyme super-class of BAHD transferases, which can catalyze acylation reactions from a broad range of anthocyanins and acyl-donating compounds [13]. The BAHD superfamily includes the anthocyanin 3-O-glucoside-6-O-acyltransferase (3AT) described by Rinaldo et al. [13], in which a nonsense mutation prevents the production of acylated anthocyanins in Pinot noir. Moreover, transcriptomic studies have also shown that 3AT expression increases in the skins of most red berries (but not white) during ripening in both V. vinifera [13,14] and wild Vitis [29].
Mapping population studies in other plant families, e.g., maize, have also reported that anthocyanin acyltransferases are important for controlling acylation ratios [30]. Thus, 3AT is a likely candidate for controlling acylation ratios in grapes. Notably, both extreme alleles producing high acylation in the V. rupestris B38 × ‘Horizon’ and ‘Horizon’ × Illinois 547-1 populations came from ‘Horizon’, which produces white fruit. This cultivar resulted from a cross between ‘Seyval blanc’ and ‘Schuyler’, and the latter was a hybrid of ‘Primitivo’ (a red wine variety) and ‘Ontario’ (white-fruited). White-fruited grapes result from loss-of-function mutations of VvMYBA protein [31,32], a major regulator of anthocyanin accumulation, which acts upstream and regulates the expression of Vv3AT [13]. Therefore, as indicated in this case, while phenotypically masked by VvMYBA loss-of-function, white-fruited genotypes can form a valuable genetic source of highly functional Vv3AT alleles.
Interestingly, two previous studies on V. vinifera mapping populations did not detect major QTLs for acylation ratio, nor a QTL on LG 3 associated with Vv3AT. A thorough study of anthocyanin profiles in a ‘Syrah’ × Pinot noir population yielded only minor QTLs for anthocyanin acylation on LGs 3, 7, 8, 12, and 18. The authors speculate that their inability to detect a major QTL may be due to low segregation of the acylated ratio trait [15]. Production of non-functional copies of Vv3AT in Pinot noir [13] may reflect homozygosity for this nonsense mutation, and if ‘Syrah’ is homozygous for the two functional Vv3AT copies, the resulting population would be heterozygous. A separate study on an F1 V. vinifera mapping population (‘Red Globe’ × ‘Muscat Hamburg’) also identified weak QTLs for acylation ratio [33]. Again, this study may have been limited by the low amount of trait variation within the population, as the distribution was unimodal, with most acylation ratios falling between 20% and 40%. These earlier reports identified several other candidate genes, including other anthocyanin acyltransferases (VvAT1, VvAT9) as well as genes involved in ion transport. We did not detect these same QTL, although we did detect a minor QTL in one year and one population (2013, ‘Horizon’ × Illinois 547-1) on Chr 9. The interval for this QTL contains a 5-O-glucosyltransferase (5GT) responsible for the production of anthocyanin 3,5-diglucosides in wild Vitis species. However, the relationship between diglucosides and acylated anthocyanins is unclear.
The previous report with one harvest year on ‘Horizon’ × Illinois 547-1 used GBS to develop a haploblock panel of thirteen amplicon sequencing SNP markers to predict acylated ratios in V. rupestris B38 × ‘Horizon’ [28]. However, because the transferability of SNP-based markers has been low in high-diversity taxa such as Vitis spp., these markers have not been widely implemented. Highly transferable molecular markers are essential for the implementation of marker-assisted selection strategies, especially in grapes where the use of wild relative species in breeding programs is fairly common [19,34]. Unlike markers derived from skim sequencing platforms, PCR-based markers such as rhAmpSeq used here to map acylation ratio can be more readily implemented in current grape breeding strategies [19] since these have been tested for transferability, cover the whole genome, and have the capability to differentiate germplasm. The high phenotypic variance explained by the associated markers on chromosome 3 will make these rhAmpSeq markers particularly efficient, once properly validated, when predicting high vs. low acylation ratio in Vitis species.

Supplementary Materials

The following are available online at https://www.mdpi.com/article/10.3390/genes12121962/s1, Supplementary File S1: Best linear unbiased estimators for total anthocyanins, acylated anthocyanins, and acylation ratio in the V. rupestris B38 × ‘Horizon’ and ‘Horizon’ × Illinois 547-1 populations., Supplementary Files S2 and S3: Genotyping QC for ‘Horizon’ × Illinois 547-1 and V. rupestris B38 × ‘Horizon’ families, respectively., Supplementary Files S4 and S5: Four-way cross-genetic maps for ‘Horizon’ × Illinois 547-1 and V. rupestris B38 × ‘Horizon’ families, respectively.

Author Contributions

Conceptualization and methodology, G.L.S., B.I.R. and L.C.-D.; software, C.Z.; formal analysis, D.C.M., A.K. and L.D.-G.; investigation, G.L.S., A.K.M. and D.C.M.; resources, B.I.R.; data curation, A.K. and C.Z.; writing—original draft preparation, N.R., G.L.S., A.K. and L.D.-G.; writing—review and editing, G.L.S., L.C.-D., B.I.R., N.R., A.K. and L.D.-G.; visualization, A.K. and L.D.-G.; supervision, G.L.S. and L.C.-D.; project administration, G.L.S.; funding acquisition, B.I.R., L.C.-D. and G.L.S. All authors have read and agreed to the published version of the manuscript.

Funding

This research was funded by the U.S. Department of Agriculture (USDA)-National Institute of Food and Agriculture (NIFA) Specialty Crop Research Initiative, awards no. 2017-51181-26829 and 2011-51181-30635, and BARD, the U.S.–Israel Binational Agricultural Research and Development Fund, a Vaadia-BARD Postdoctoral Fellowship Award (FI-602-2020 to N.R.).

Institutional Review Board Statement

Not applicable.

Informed Consent Statement

Not applicable.

Data Availability Statement

Haplotype sequences of the genetic markers, sex-averaged genetic maps, and phenotyping data sets are given as supplementary files. Perl scripts used for identification of haplotype variants and conversion to a variant calling format (VCF) are available at: https://github.com/avinashkarn/analyze_amplicon/blob/master/analyze_amplicon.pl (accessed on 2 April 2021) and https://github.com/avinashkarn/analyze_amplicon/blob/master/haplotype_to_VCF.pl (accessed on 2 April 2021), respectively.

Acknowledgments

We thank the Cornell University Biotechnology Resource Center for providing the necessary equipment and technical support for the sequencing of DNA samples. We would like to acknowledge support from Steve Luce and Mike Colizzi with vineyard care and maintenance.

Conflicts of Interest

The authors declare no conflict of interest. The funders had no role in the design of the study, in the collection, analyses, or interpretation of data, in the writing of the manuscript, or in the decision to publish the results.

References

  1. Waterhouse, A.L.; Sacks, G.L.; Jeffery, D.W. Anthocyanins. In Understanding Wine Chemistry; Waterhouse, A.L., Sacks, G.L., Jeffery, D.W., Eds.; John Wiley & Sons, Ltd.: Chichester, UK, 2016; pp. 131–139. ISBN 9781118730720. [Google Scholar]
  2. Boss, P.K.; Davies, C. Molecular Biology of Anthocyanin Accumulation in Grape Berries. In Grapevine Molecular Physiology & Biotechnology; Roubelakis-Angelakis, K.A., Ed.; Springer: Dordrecht, The Netherlands, 2009; pp. 263–292. ISBN 9789048123056. [Google Scholar]
  3. He, F.; Liang, N.-N.; Mu, L.; Pan, Q.-H.; Wang, J.; Reeves, M.J.; Duan, C.-Q. Anthocyanins and Their Variation in Red Wines I. Monomeric Anthocyanins and Their Color Expression. Molecules 2012, 17, 1571–1601. [Google Scholar] [CrossRef] [Green Version]
  4. Zhao, C.-L.; Yu, Y.-Q.; Chen, Z.-J.; Wen, G.-S.; Wei, F.-G.; Zheng, Q.; Wang, C.-D.; Xiao, X.-L. Stability-Increasing Effects of Anthocyanin Glycosyl Acylation. Food Chem. 2017, 214, 119–128. [Google Scholar] [CrossRef] [PubMed]
  5. Pomar, F.; Novo, M.; Masa, A. Varietal Differences among the Anthocyanin Profiles of 50 Red Table Grape Cultivars Studied by High Performance Liquid Chromatography. J. Chromatogr. A 2005, 1094, 34–41. [Google Scholar] [CrossRef] [PubMed]
  6. Liang, Z.; Yang, Y.; Cheng, L.; Zhong, G.-Y. Polyphenolic Composition and Content in the Ripe Berries of Wild Vitis Species. Food Chem. 2012, 132, 730–738. [Google Scholar] [CrossRef]
  7. Charron, C.S.; Kurilich, A.C.; Clevidence, B.A.; Simon, P.W.; Harrison, D.J.; Britz, S.J.; Baer, D.J.; Novotny, J.A. Bioavailability of Anthocyanins from Purple Carrot Juice: Effects of Acylation and Plant Matrix. J. Agric. Food Chem. 2009, 57, 1226–1230. [Google Scholar] [CrossRef] [PubMed]
  8. Kurilich, A.C.; Clevidence, B.A.; Britz, S.J.; Simon, P.W.; Novotny, J.A. Plasma and Urine Responses Are Lower for Acylated vs Nonacylated Anthocyanins from Raw and Cooked Purple Carrots. J. Agric. Food Chem. 2005, 53, 6537–6542. [Google Scholar] [CrossRef] [PubMed]
  9. Alvarez-Suarez, J.M.; Giampieri, F.; Tulipani, S.; Casoli, T.; Di Stefano, G.; González-Paramás, A.M.; Santos-Buelga, C.; Busco, F.; Quiles, J.L.; Cordero, M.D.; et al. One-Month Strawberry-Rich Anthocyanin Supplementation Ameliorates Cardiovascular Risk, Oxidative Stress Markers and Platelet Activation in Humans. J. Nutr. Biochem. 2014, 25, 289–294. [Google Scholar] [CrossRef]
  10. Li, S.; Wu, B.; Fu, W.; Reddivari, L. The Anti-Inflammatory Effects of Dietary Anthocyanins against Ulcerative Colitis. Int. J. Mol. Sci. 2019, 20, 2588. [Google Scholar] [CrossRef] [PubMed] [Green Version]
  11. Morais, C.A.; de Rosso, V.V.; Estadella, D.; Pisani, L.P. Anthocyanins as Inflammatory Modulators and the Role of the Gut Microbiota. J. Nutr. Biochem. 2016, 33, 1–7. [Google Scholar] [CrossRef]
  12. Fournier-Level, A.; Le Cunff, L.; Gomez, C.; Doligez, A.; Ageorges, A.; Roux, C.; Bertrand, Y.; Souquet, J.-M.; Cheynier, V.; This, P. Quantitative Genetic Bases of Anthocyanin Variation in Grape (Vitis Vinifera L. Ssp. Sativa) Berry: A Quantitative Trait Locus to Quantitative Trait Nucleotide Integrated Study. Genetics 2009, 183, 1127–1139. [Google Scholar] [CrossRef] [Green Version]
  13. Rinaldo, A.R.; Cavallini, E.; Jia, Y.; Moss, S.M.A.; McDavid, D.A.J.; Hooper, L.C.; Robinson, S.P.; Tornielli, G.B.; Zenoni, S.; Ford, C.M.; et al. A Grapevine Anthocyanin Acyltransferase, Transcriptionally Regulated by VvMYBA, Can Produce Most Acylated Anthocyanins Present in Grape Skins. Plant Physiol. 2015, 169, 1897–1916. [Google Scholar] [CrossRef] [PubMed]
  14. Massonnet, M.; Fasoli, M.; Tornielli, G.B.; Altieri, M.; Sandri, M.; Zuccolotto, P.; Paci, P.; Gardiman, M.; Zenoni, S.; Pezzotti, M. Ripening Transcriptomic Program in Red and White Grapevine Varieties Correlates with Berry Skin Anthocyanin Accumulation. Plant Physiol. 2017, 174, 2376–2396. [Google Scholar] [CrossRef] [Green Version]
  15. Costantini, L.; Malacarne, G.; Lorenzi, S.; Troggio, M.; Mattivi, F.; Moser, C.; Grando, M.S. New Candidate Genes for the Fine Regulation of the Colour of Grapes. J. Exp. Bot. 2015, 66, 4427–4440. [Google Scholar] [CrossRef] [PubMed]
  16. Reisch, B.; Robinson, W.B.; Kimball, K.; Pool, R.; Watson, J. “Horizon” Grape. HortScience 1983, 18, 108–109. [Google Scholar]
  17. Manns, D.C.; Mansfield, A.K. A Core-Shell Column Approach to a Comprehensive High-Performance Liquid Chromatography Phenolic Analysis of Vitis vinifera L. and Interspecific Hybrid Grape Juices, Wines, and Other Matrices Following Either Solid Phase Extraction or Direct Injection. J. Chromatogr. A 2012, 1251, 111–121. [Google Scholar] [CrossRef] [PubMed]
  18. Hyma, K.E.; Barba, P.; Wang, M.; Londo, J.P.; Acharya, C.B.; Mitchell, S.E.; Sun, Q.; Reisch, B.; Cadle-Davidson, L. Heterozygous Mapping Strategy (HetMappS) for High Resolution Genotyping-By-Sequencing Markers: A Case Study in Grapevine. PLoS ONE 2015, 10, e0134880. [Google Scholar] [CrossRef] [Green Version]
  19. Zou, C.; Karn, A.; Reisch, B.; Nguyen, A.; Sun, Y.; Bao, Y.; Campbell, M.S.; Church, D.; Williams, S.; Xu, X.; et al. Haplotyping the Vitis Collinear Core Genome with rhAmpSeq Improves Marker Transferability in a Diverse Genus. Nat. Commun. 2020, 11, 413. [Google Scholar] [CrossRef] [Green Version]
  20. Yin, L.; Karn, A.; Cadle-Davidson, L.; Zou, C.; Underhill, A.; Atkins, P.; Treiber, E.; Voytas, D.; Clark, M. Fine Mapping of Leaf Trichome Density Revealed a 747-Kb Region on Chromosome 1 in Cold-Hardy Hybrid Wine Grape Populations. Front. Plant Sci. 2021, 12, 587640. [Google Scholar] [CrossRef]
  21. Reshef, N.; Karn, A.; Manns, D.C.; Mansfield, A.K.; Cadle-Davidson, L.; Reisch, B.; Sacks, G.L. Stable QTL for Malate Levels in Ripe Fruit and Their Transferability across Vitis Species. bioRxiv 2020. [Google Scholar] [CrossRef]
  22. Bradbury, P.J.; Zhang, Z.; Kroon, D.E.; Casstevens, T.M.; Ramdoss, Y.; Buckler, E.S. TASSEL: Software for Association Mapping of Complex Traits in Diverse Samples. Bioinformatics 2007, 23, 2633–2635. [Google Scholar] [CrossRef] [PubMed]
  23. Wickham, H. ggplot2. Wiley Interdiscip. Rev. Comput. Stat. 2011, 3, 180–185. [Google Scholar] [CrossRef]
  24. Danecek, P.; Auton, A.; Abecasis, G.; Albers, C.A.; Banks, E.; DePristo, M.A.; Handsaker, R.E.; Lunter, G.; Marth, G.T.; Sherry, S.T.; et al. The Variant Call Format and VCFtools. Bioinformatics 2011, 27, 2156–2158. [Google Scholar] [CrossRef] [PubMed]
  25. Rastas, P. Lep-MAP3: Robust Linkage Mapping Even for Low-Coverage Whole Genome Sequencing Data. Bioinformatics 2017, 33, 3726–3732. [Google Scholar] [CrossRef] [PubMed] [Green Version]
  26. Canaguier, A.; Grimplet, J.; Di Gaspero, G.; Scalabrin, S.; Duchêne, E.; Choisne, N.; Mohellibi, N.; Guichard, C.; Rombauts, S.; Le Clainche, I.; et al. A New Version of the Grapevine Reference Genome Assembly (12X.v2) and of Its Annotation (VCost.v3). Genom. Data 2017, 14, 56–62. [Google Scholar] [CrossRef] [PubMed]
  27. Broman, K.W.; Wu, H.; Sen, S.; Churchill, G.A. R/qtl: QTL Mapping in Experimental Crosses. Bioinformatics 2003, 19, 889–890. [Google Scholar] [CrossRef] [Green Version]
  28. Yang, S.; Fresnedo-Ramírez, J.; Wang, M.; Cote, L.; Schweitzer, P.; Barba, P.; Takacs, E.M.; Clark, M.; Luby, J.; Manns, D.C.; et al. A Next-Generation Marker Genotyping Platform (AmpSeq) in Heterozygous Crops: A Case Study for Marker-Assisted Selection in Grapevine. Hortic. Res. 2016, 3, 16002. [Google Scholar] [CrossRef] [Green Version]
  29. Sun, L.; Fan, X.; Zhang, Y.; Jiang, J.; Sun, H.; Liu, C. Transcriptome Analysis of Genes Involved in Anthocyanins Biosynthesis and Transport in Berries of Black and White Spine Grapes (Vitis davidii). Hereditas 2016, 153, 17. [Google Scholar] [CrossRef] [PubMed] [Green Version]
  30. Paulsmeyer, M.N.; Brown, P.J.; Juvik, J.A. Discovery of Anthocyanin Acyltransferase1 (AAT1) in Maize Using Genotyping-by-Sequencing (GBS). G3 2018, 8, 3669–3678. [Google Scholar] [CrossRef] [PubMed] [Green Version]
  31. Walker, A.R.; Lee, E.; Bogs, J.; McDavid, D.A.J.; Thomas, M.R.; Robinson, S.P. White Grapes Arose through the Mutation of Two Similar and Adjacent Regulatory Genes. Plant J. 2007, 49, 772–785. [Google Scholar] [CrossRef]
  32. Kobayashi, S.; Goto-Yamamoto, N.; Hirochika, H. Association of VvmybA1 Gene Expression with Anthocyanin Production in Grape (Vitis vinifera) Skin-Color Mutants. J. Jpn. Soc. Hotic. Sci. 2005, 74, 196–203. [Google Scholar] [CrossRef] [Green Version]
  33. Sun, L.; Li, S.; Jiang, J.; Tang, X.; Fan, X.; Zhang, Y.; Liu, J.; Liu, C. New Quantitative Trait Locus (QTLs) and Candidate Genes Associated with the Grape Berry Color Trait Identified Based on a High-Density Genetic Map. BMC Plant Biol. 2020, 20, 302. [Google Scholar] [CrossRef] [PubMed]
  34. Cantu, D.; Walker, M.A. (Eds.) The Grape Genome; Compendium of Plant Genomes; Springer: Cham, Switzerland, 2019. [Google Scholar]
Figure 1. Overview of phenotypic variation. (A) Phenotypic variation observed for total anthocyanins, acylated anthocyanins, and acylated ratio (acylated anthocyanins/total anthocyanins). Variation in (B) acylation ratio and (C) total anthocyanins by harvest time (early vs. late) during 2013 for ‘Horizon’ × Illinois 547-1. Year-to-year Pearson’s correlation for (D) V. rupestris B38 × ‘Horizon’ and (E,F) ‘Horizon’ × Illinois 547-1 acylation ratios.
Genes 12 01962 g001
Figure 2. Linkage maps and QTL mapping of anthocyanin acylation. (A) Collinearity between physical (PN40024 reference genome) and composite genetic maps for the V. rupestris B38 × ‘Horizon’ and ‘Horizon’ × Illinois 547-1 populations. (B) Genetic mapping results for each population and evaluation year; QTL mapping was performed using both total acylated anthocyanins (blue line) as well as acylation ratio (purple line); additionally, normal and binary (high vs. low acylation ratio) models were compared for each population/year; dashed lines represent permutation-based significance thresholds.
Genes 12 01962 g002
Figure 3. Analysis of the genomic region harboring marker-trait associations on chromosome 3. (A) Haplotypes on chromosome 3 for the V. rupestris B38 × ‘Horizon’ and ‘Horizon’ × Illinois 547-1 populations. Progenies on each panel are sorted decreasingly, right to left, based on acylation ratio, which is also indicated with a line plot in red color. The largest LOD score per panel is indicated by a horizontal yellow line. (B,C) LOD score profiles and gene content, respectively, in the 14.85–17.95 Mb interval for all populations and evaluation years. For visualization purposes, LOD scores were normalized to account for differences in the magnitude of the signal; gene labels are shown only for functionally annotated genes. Candidate genes are highlighted with a triangle.
Genes 12 01962 g003
Table 1. Features of the V. rupestris B38 × ‘Horizon’ and ‘Horizon’ × Illinois 547-1 sex-averaged linkage maps.
ChrV. rupestris B38 × ‘Horizon’‘Horizon’ × Illinois 547-1
MarkersSize (cM)Average Gap (cM)Maximum Gap (cM)Recomb. Rate (cM/Mb)MarkersSize (cM)Average Gap (cM)Maximum Gap (cM)Recomb. Rate (cM/Mb)
14237.300.914.830.988562.340.724.971.99
24062.511.6012.02.845056.821.1612.04.31
34251.081.255.133.334055.701.4318.53.70
46475.391.206.350.566854.520.815.461.88
58161.890.774.161.979049.940.563.130.93
65666.271.205.433.086549.490.776.010.11
77485.581.178.311.699384.120.919.082.94
87667.940.915.821.798566.600.794.402.00
94753.881.178.641.864649.141.098.805.00
105162.531.256.422.354551.091.168.301.91
114762.281.356.533.964752.771.155.565.25
125960.651.059.312.275549.230.913.624.03
136765.300.9910.91.736756.790.865.760.94
148468.540.834.602.247860.070.783.582.46
154355.541.328.244.053153.021.778.515.03
164759.241.297.202.624250.411.235.322.10
175367.881.3110.71.195253.581.056.891.49
186782.161.248.181.277669.940.936.583.24
195260.621.196.222.805656.591.038.102.88
Total10921206.581.167.312.2411711082.161.017.082.75
Publisher’s Note: MDPI stays neutral with regard to jurisdictional claims in published maps and institutional affiliations.

