Characterization of Hormone-Dependent Pathways in Six Human Prostate-Cancer Cell Lines: A Gene-Expression Study

 , , , , ,
  ,
,
Abstract
:1. Introduction
2. Materials and Methods
2.1. Cell Culture
2.2. Human Samples
2.3. Real-Time qPCR
2.4. Western Blot
3. Results
4. Discussion
Author Contributions
Funding
Conflicts of Interest
References
- Grossmann, M.; Wittert, G. Androgens, diabetes and prostate cancer. Endocr. Relat. Cancer 2012, 19, F47–F62. [Google Scholar] [CrossRef] [Green Version]
- Elia, I.; Schmieder, R.; Christen, S.; Fendt, S.M. Organ-Specific Cancer Metabolism and Its Potential for Therapy. Handb. Exp. Pharmacol. 2016, 233, 321–353. [Google Scholar] [CrossRef] [PubMed] [Green Version]
- Bushman, W. Hedgehog Signaling in Prostate Development, Regeneration and Cancer. J. Dev. Biol. 2016, 4, 30. [Google Scholar] [CrossRef] [PubMed] [Green Version]
- Ridge, S.M.; Sullivan, F.J.; Glynn, S.A. Mesenchymal stem cells: Key players in cancer progression. Mol. Cancer 2017, 16, 31. [Google Scholar] [CrossRef] [PubMed] [Green Version]
- Ishii, K.; Takahashi, S.; Sugimura, Y.; Watanabe, M. Role of Stromal Paracrine Signals in Proliferative Diseases of the Aging Human Prostate. J. Clin. Med. 2018, 7, 68. [Google Scholar] [CrossRef] [PubMed] [Green Version]
- Hensel, J.; Thalmann, G.N. Biology of Bone Metastases in Prostate Cancer. Urology 2016, 92, 6–13. [Google Scholar] [CrossRef] [Green Version]
- Di Sebastiano, K.M.; Pinthus, J.H.; Duivenvoorden, W.C.M.; Mourtzakis, M. Glucose impairments and insulin resistance in prostate cancer: The role of obesity, nutrition and exercise. Obes. Rev. 2018, 19, 1008–1016. [Google Scholar] [CrossRef]
- Franko, A.; Berti, L.; Hennenlotter, J.; Rausch, S.; Scharpf, M.; De Angelis, M.H.; Stenzl, A.; Birkenfeld, A.L.; Peter, A.; Lutz, S.Z.; et al. Prostate tissue of patients with type 2 diabetes is characterized by increased gene expressions of Matrix metalloproteinases (MMPs) and CC chemokine ligands (CCLs). 2020. In Preparation. [Google Scholar]
- Lutz, S.Z.; Hennenlotter, J.; Scharpf, M.O.; Sailer, C.; Fritsche, L.; Schmid, V.; Kantartzis, K.; Wagner, R.; Lehmann, R.; Berti, L.; et al. Androgen receptor overexpression in prostate cancer in type 2 diabetes. Mol. Metab. 2018, 8, 158–166. [Google Scholar] [CrossRef]
- Nelles, J.L.; Hu, W.-Y.; Prins, G.S. Estrogen action and prostate cancer. Expert Rev. Endocrinol. Metab. 2011, 6, 437–451. [Google Scholar] [CrossRef] [Green Version]
- Wu, X.; Gong, S.; Roy-Burman, P.; Lee, P.; Culig, Z. Current mouse and cell models in prostate cancer research. Endocr. Relat. Cancer 2013, 20, R155–R170. [Google Scholar] [CrossRef] [PubMed] [Green Version]
- Sobel, R.E.; Sadar, M.D. Cell Lines Used in Prostate Cancer Research: A Compendium of Old and New Lines—Part 1. J. Urol. 2005, 173, 342–359. [Google Scholar] [CrossRef] [PubMed]
- Namekawa, T.; Ikeda, K.; Horie-Inoue, K.; Inoue, S. Application of Prostate Cancer Models for Preclinical Study: Advantages and Limitations of Cell Lines, Patient-Derived Xenografts, and Three-Dimensional Culture of Patient-Derived Cells. Cells 2019, 8, 74. [Google Scholar] [CrossRef] [Green Version]
- Franko, A.; Shao, Y.; Heni, M.; Hennenlotter, J.; Hoene, M.; Hu, C.; Liu, X.; Zhao, X.; Wang, Q.; Birkenfeld, A.L.; et al. Human Prostate Cancer is Characterized by an Increase in Urea Cycle Metabolites. Cancers 2020, 12, 1814. [Google Scholar] [CrossRef] [PubMed]
- Franko, A.; Berti, L.; Hennenlotter, J.; Rausch, S.; Scharpf, M.O.; De Angelis, M.H.; Stenzl, A.; Birkenfeld, A.L.; Peter, A.; Lutz, S.Z.; et al. Transcript Levels of Aldo-Keto Reductase Family 1 Subfamily C (AKR1C) Are Increased in Prostate Tissue of Patients with Type 2 Diabetes. J. Pers. Med. 2020, 10, 124. [Google Scholar] [CrossRef] [PubMed]
- Franko, A.; Kovarova, M.; Feil, S.; Feil, R.; Wagner, R.; Heni, M.; Königsrainer, A.; Ruoss, M.; Nussler, A.K.; Weigert, C.; et al. cGMP-dependent protein kinase I (cGKI) modulates human hepatic stellate cell activation. Metabolism 2018, 88, 22–30. [Google Scholar] [CrossRef] [Green Version]
- Heni, M.; Hennenlotter, J.; Scharpf, M.; Lutz, S.Z.; Schwentner, C.; Todenhöfer, T.; Schilling, D.; Kühs, U.; Gerber, V.; Machicao, F.; et al. Insulin Receptor Isoforms A and B as well as Insulin Receptor Substrates-1 and -2 Are Differentially Expressed in Prostate Cancer. PLoS ONE 2012, 7, e50953. [Google Scholar] [CrossRef] [Green Version]
- Balk, S.P.; Knudsen, K.E. AR, the cell cycle, and prostate cancer. Nucl. Recept. Signal. 2008, 6. [Google Scholar] [CrossRef] [Green Version]
- Bjartell, A.; Montironi, R.; Berney, D.M.; Egevad, L. Tumour markers in prostate cancer II: Diagnostic and prognostic cellular biomarkers. Acta Oncol. 2011, 50 (Suppl. 1), 76–84. [Google Scholar] [CrossRef]
- Debelec-Butuner, B.; Alapinar, C.; Varisli, L.; Erbaykent-Tepedelen, B.; Hamid, S.M.; Gonen-Korkmaz, C.; Korkmaz, K.S. Inflammation-mediated abrogation of androgen signaling: An in vitro model of prostate cell inflammation. Mol. Carcinog. 2014, 53, 85–97. [Google Scholar] [CrossRef] [Green Version]
- McIlwain, D.W.; Fishel, M.L.; Boos, A.; Kelley, M.R.; Jerde, T.J. APE1/Ref-1 redox-specific inhibition decreases survivin protein levels and induces cell cycle arrest in prostate cancer cells. Oncotarget 2018, 9, 10962–10977. [Google Scholar] [CrossRef] [PubMed] [Green Version]
- Russo, M.A.; Ravenna, L.; Pellegrini, L.; Petrangeli, E.; Salvatori, L.; Magrone, T.; Fini, M.; Tafani, M. Hypoxia and Inflammation in Prostate Cancer Progression. Cross-talk with Androgen and Estrogen Receptors and Cancer Stem Cells. Endocr. Metab. Immune Disord. Drug Targets 2016, 16, 235–248. [Google Scholar] [CrossRef] [PubMed]
- Sciacovelli, M.; Frezza, C. Oncometabolites: Unconventional triggers of oncogenic signalling cascades. Free. Radic. Biol. Med. 2016, 100, 175–181. [Google Scholar] [CrossRef] [PubMed] [Green Version]
- Ramteke, P.; Deb, A.; Shepal, V.; Bhat, M.K. Hyperglycemia Associated Metabolic and Molecular Alterations in Cancer Risk, Progression, Treatment, and Mortality. Cancers 2019, 11, 1402. [Google Scholar] [CrossRef] [PubMed] [Green Version]
- Ghandi, M.; Huang, F.W.; Jané-Valbuena, J.; Kryukov, G.V.; Lo, C.C.; McDonald, E.R., 3rd; Barretina, J.; Gelfand, E.T.; Bielski, C.M.; Li, H.; et al. Next-generation characterization of the Cancer Cell Line Encyclopedia. Nature 2019, 569, 503–508. [Google Scholar] [CrossRef]
- Shourideh, M.; DePriest, A.; Mohler, J.L.; Wilson, E.M.; Koochekpour, S. Characterization of fibroblast-free CWR-R1ca castration-recurrent prostate cancer cell line. Prostate 2016, 76, 1067–1077. [Google Scholar] [CrossRef]
- Hsieh, T.C.; Wu, J.M. Cell growth and gene modulatory activities of Yunzhi (Windsor Wunxi) from mushroom Trametes versicolor in androgen-dependent and androgen-insensitive human prostate cancer cells. Int. J. Oncol. 2001, 18, 81–88. [Google Scholar] [CrossRef]
- Li, Y.; Chen, R.; Bowden, M.; Mo, F.; Lin, Y.Y.; Gleave, M.; Collins, C.; Dong, X. Establishment of a neuroendocrine prostate cancer model driven by the RNA splicing factor SRRM4. Oncotarget 2017, 8, 66878–66888. [Google Scholar] [CrossRef]
- Thomas-Jardin, S.E.; Kanchwala, M.S.; Jacob, J.; Merchant, S.; Meade, R.K.; Gahnim, N.M.; Nawas, A.F.; Xing, C.; Delk, N.A. Identification of an IL-1-induced gene expression pattern in AR(+)PCa cells that mimics the molecular phenotype of AR(−)PCa cells. Prostate 2018, 78, 595–606. [Google Scholar] [CrossRef]
- Belfiore, A.; Malaguarnera, R.; Vella, V.; Lawrence, M.C.; Sciacca, L.; Frasca, F.; Morrione, A.; Vigneri, R. Insulin Receptor Isoforms in Physiology and Disease: An Updated View. Endocr. Rev. 2017, 38, 379–431. [Google Scholar] [CrossRef]
- Alfaqih, M.A.; Nelson, E.R.; Liu, W.; Safi, R.; Jasper, J.S.; Macias, E.; Geradts, J.; Thompson, J.W.; Dubois, L.G.; Freeman, M.R.; et al. CYP27A1 Loss Dysregulates Cholesterol Homeostasis in Prostate Cancer. Cancer Res. 2017, 77, 1662–1673. [Google Scholar] [CrossRef] [PubMed] [Green Version]
- Kimbro, K.S.; Simons, J.W. Hypoxia-inducible factor-1 in human breast and prostate cancer. Endocr. Relat. Cancer 2006, 13, 739–749. [Google Scholar] [CrossRef] [PubMed]
- Lutz, S.Z.; Todenhöfer, T.; Wagner, R.; Hennenlotter, J.; Ferchl, J.M.; Scharpf, M.O.; Martus, P.; Staiger, H.; Fritsche, A.; Stenzl, A.; et al. Higher prevalence of lymph node metastasis in prostate cancer in patients with diabetes. Endocr. Relat. Cancer 2018, 25, L19–L22. [Google Scholar] [CrossRef] [PubMed] [Green Version]
- Kim, H.S.; Presti, J.C., Jr.; Aronson, W.J.; Terris, M.K.; Kane, C.J.; Amling, C.L.; Freedland, S.J. Glycemic control and prostate cancer progression: Results from the SEARCH database. Prostate 2010, 70, 1540–1546. [Google Scholar] [CrossRef] [PubMed] [Green Version]
- Bensimon, L.; Yin, H.; Suissa, S.; Pollak, M.N.; Azoulay, L. Type 2 diabetes and the risk of mortality among patients with prostate cancer. Cancer Causes Control. 2014, 25, 329–338. [Google Scholar] [CrossRef]
- Jhan, J.H.; Yeh, H.C.; Chang, Y.H.; Guu, S.J.; Wu, W.J.; Chou, Y.H.; Li, C.C. New-onset diabetes after androgen-deprivation therapy for prostate cancer: A nationwide propensity score-matched four-year longitudinal cohort study. J. Diabetes Complicat. 2018, 32, 688–692. [Google Scholar] [CrossRef]
- Shiota, M.; Fujimoto, N.; Kashiwagi, E.; Eto, M. The Role of Nuclear Receptors in Prostate Cancer. Cells 2019, 8, 602. [Google Scholar] [CrossRef] [Green Version]
- Zhao, H.; Ma, T.F.; Lin, J.; Liu, L.L.; Sun, W.J.; Guo, L.X.; Wang, S.Q.; Otecko, N.O.; Zhang, Y.P. Identification of valid reference genes for mRNA and microRNA normalisation in prostate cancer cell lines. Sci. Rep. 2018, 8, 1949. [Google Scholar] [CrossRef] [Green Version]
- Olsen, J.R.; Azeem, W.; Hellem, M.R.; Marvyin, K.; Hua, Y.; Qu, Y.; Li, L.; Lin, B.; Ke, X.; Øyan, A.M.; et al. Context dependent regulatory patterns of the androgen receptor and androgen receptor target genes. BMC Cancer 2016, 16, 377. [Google Scholar] [CrossRef] [Green Version]
- Yuan, T.C.; Veeramani, S.; Lin, F.F.; Kondrikou, D.; Zelivianski, S.; Igawa, T.; Karan, D.; Batra, S.K.; Lin, M.F. Androgen deprivation induces human prostate epithelial neuroendocrine differentiation of androgen-sensitive LNCaP cells. Endocr. Relat. Cancer 2006, 13, 151–167. [Google Scholar] [CrossRef] [Green Version]


| Cell Line | Origin | Catalog Nr | Medium | Supplements (Final Concentration) |
|---|---|---|---|---|
| PC3 | Adult, male Caucasian. Prostate, from metastatic site: bone. Adenocarcinoma, Grade IV | CLS, cell line service #300312 | ThermoFisher Scientific #11039047 | 2 mM L-glutamine, 5% FBS |
| LNCaP | Adult, male Caucasian. Prostate, from metastatic site: left supraclavicular lymph node. Carcinoma | CLS, cell line service #300265 | ThermoFisher Scientific #51200046 | 2 mM L-glutamine, 10% FBS, 0.1 mM nonessential amino acids, 1 mM sodium pyruvate |
| MDA-PCa-2b | Adult, male African American. Prostate, from metastatic site: bone | ATCC #CRL-2422 | ATCC #30-2004 | 20% FBS, 25 ng/mL cholera toxin, 10 ng/mL mouse EGF, 0.005 mM phosphoethanolamine, 100 pg/mL hydrocortisone, 45 nM sodium selenite, 0.005 mg/mL human recombinant insulin |
| CWR-R1ca | Fibroblast-free cell line derived from the castration-resistant or recurrent CWR-R1 human prostate-cancer cell line | Merck-Millipore #SCC118 | ThermoFisher Scientific #32404014 | 2 mM L-glutamine, 10% FBS |
| NCI-H660 | Adult, male Caucasian. Prostate, from metastatic site: lymph node | ATCC #CRL-5813 | ThermoFisher Scientific #32404014 | 4 mM L-glutamine, 5% FBS, 0.005 mg/mL insulin, 0.01 mg/mL transferrin, 30 nM sodium selenite, 10 nM hydrocortisone, 10 nM β-estradiol |
| DU145 | Adult, male Caucasian. Prostate, from metastatic site: brain | DSMZ #ACC 261 | ThermoFisher Scientific #32404014 | 2 mM L-glutamine, 10% FBS |
| HPEC | Adult, normal | Merck-Millipore #SCCE019 | Merck-Millipore #SCMP001 (Kit) | 6 mM L-glutamine, 0.4% epiFactor P, 1 µM epinephrine, 0.5 ng/mL rh TGF-α, 100 ng/mL hydrocortisone hemisuccinate, 5 µg/mL human recombinant insulin, 5 µg/mL apo-transferrin |
| Patient Characteristics | Mean | Stdev | N |
|---|---|---|---|
| Age (y) | 65 | 8 | 11 |
| BMI (kg/m2) | 26.5 | 3.2 | 11 |
| PSA (ng/mL) | 12.1 | 8.1 | 10 |
| pT–2c | 6 | ||
| pT–3a | 4 | ||
| pT–3b | 1 | ||
| pN | 0 | ||
| GLEASON 7a | 7 | ||
| GLEASON 7b | 4 |
| Cell Line | DU145 | LNCaP | NCI-H660 | MDA-PCa-2b | PC3 |
|---|---|---|---|---|---|
| Gene ID | |||||
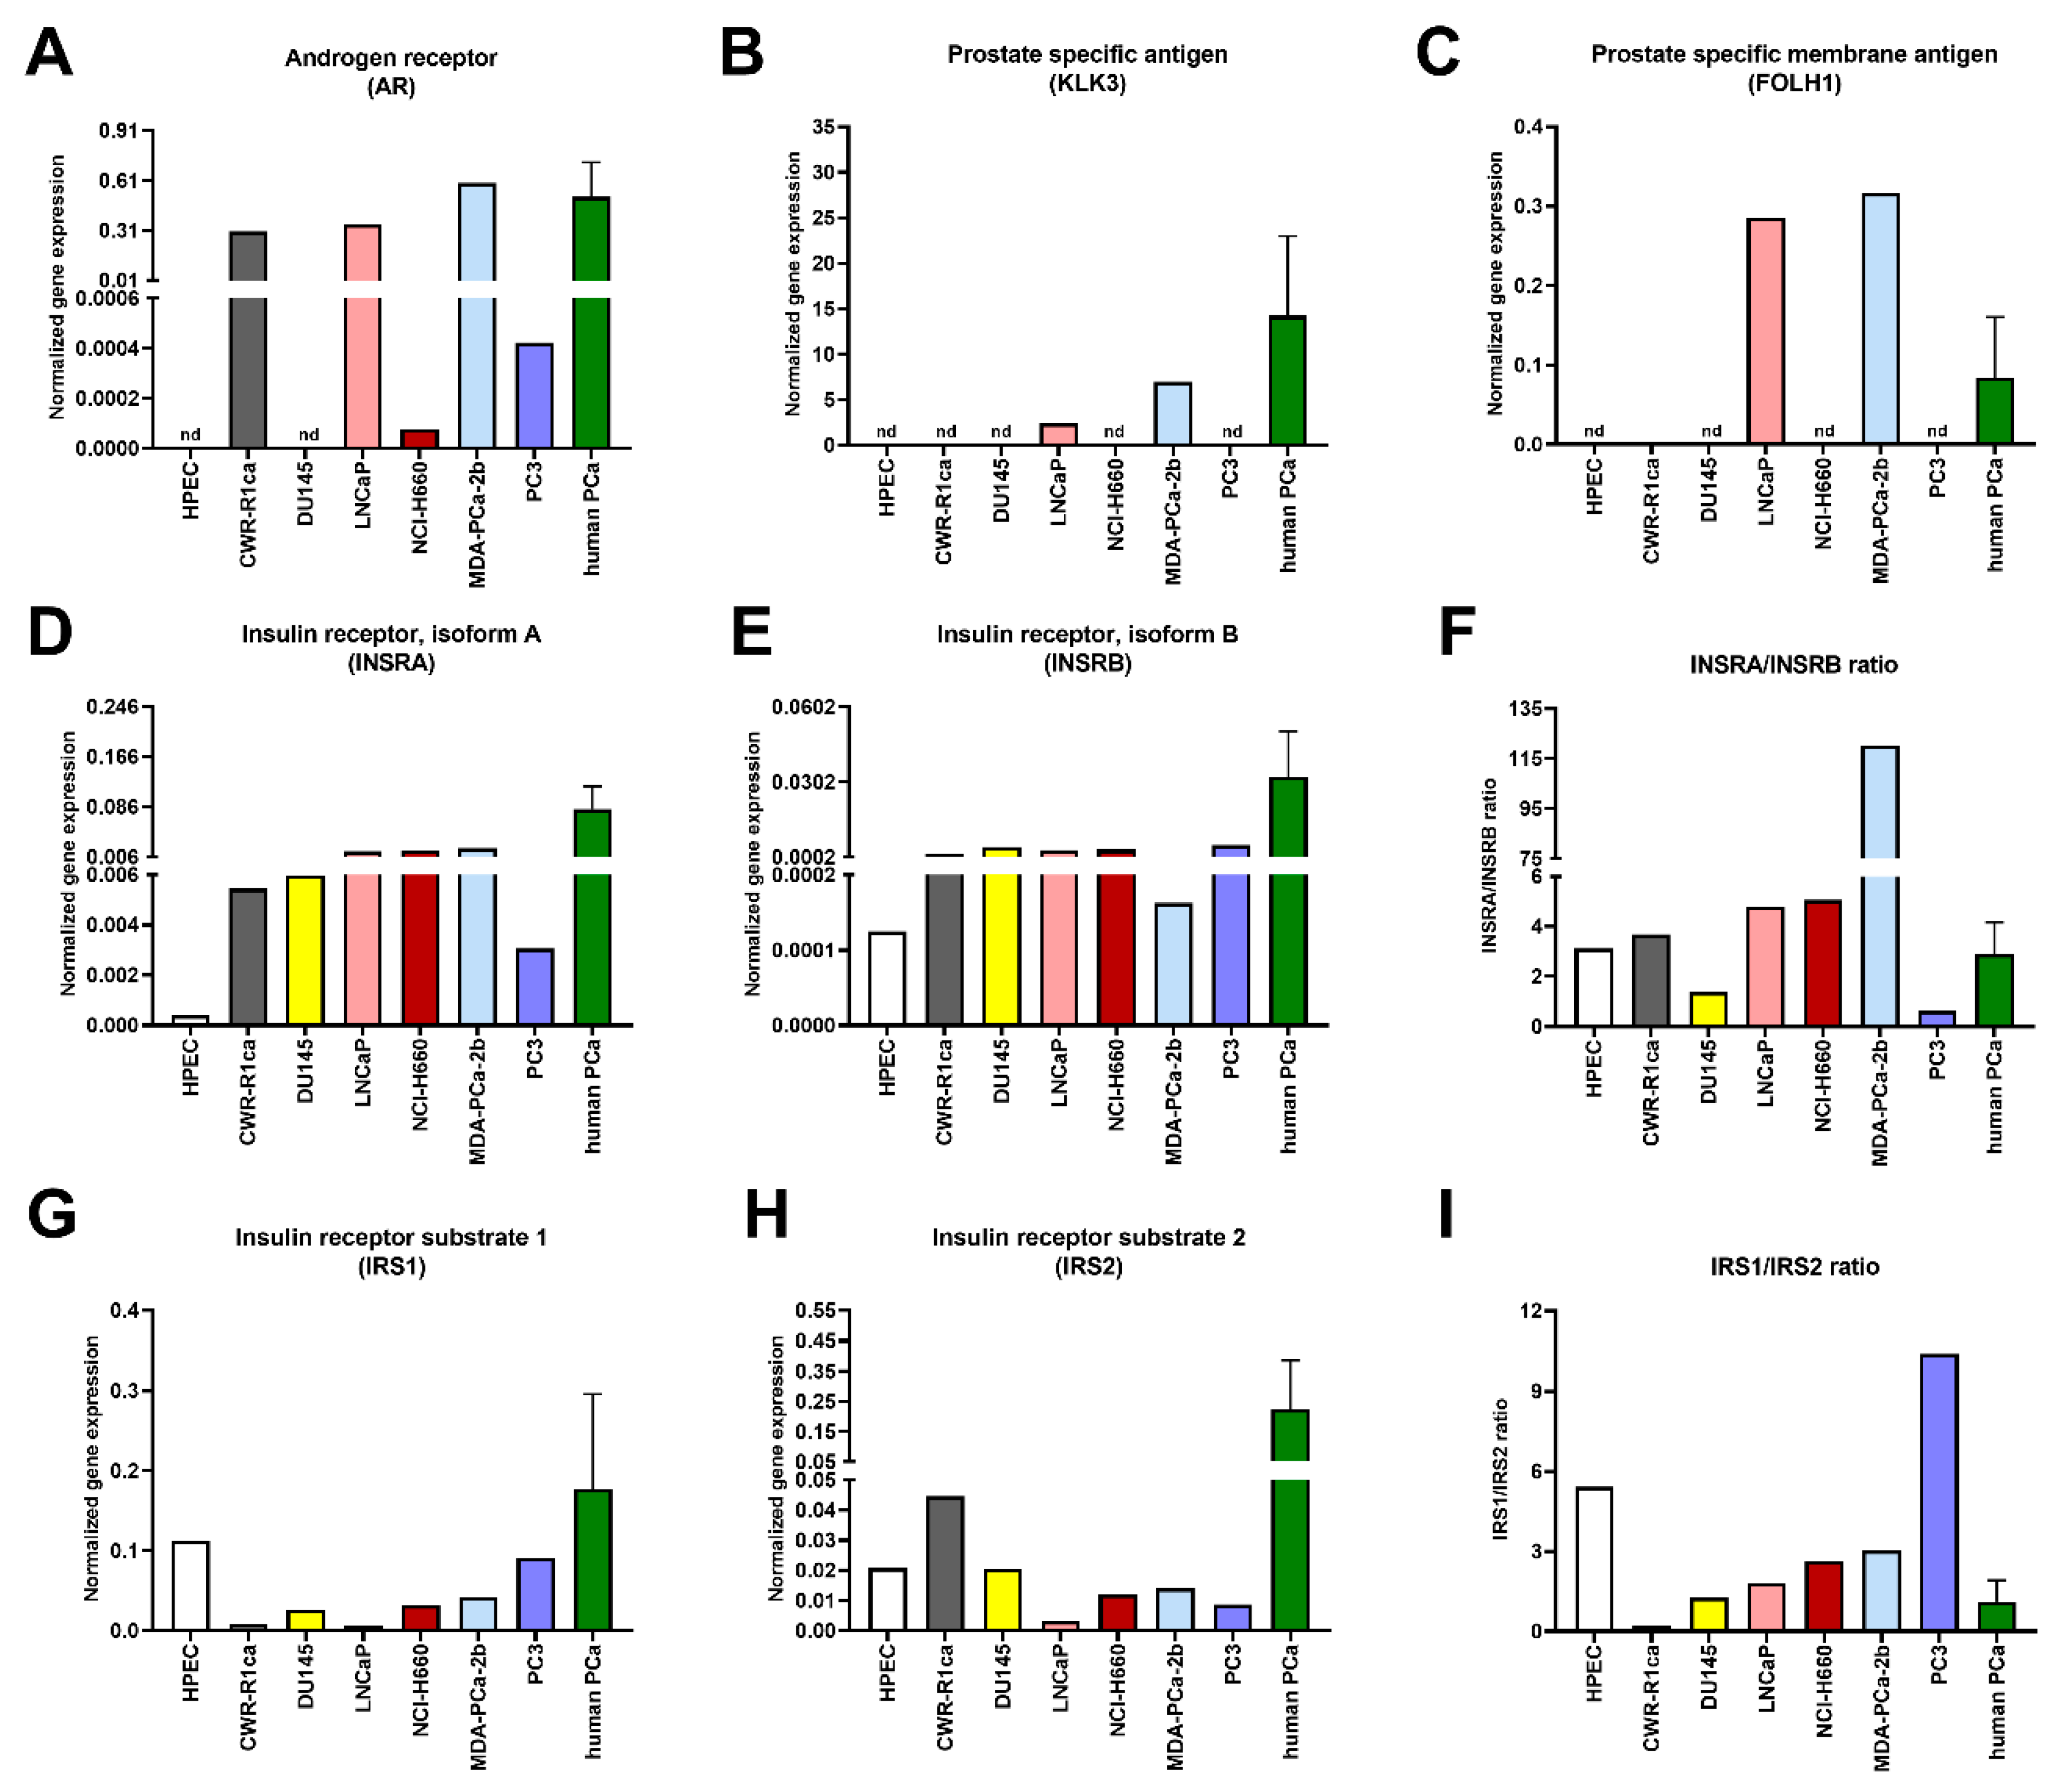
| AR | 0.0934 | 52.35 | 0.0104 | 24.77 | 0.0098 |
| KLK3 | 0.0152 | 3066.78 | 0 | 3292.29 | 0 |
| FOLH1 | 0.0447 | 473.17 | 0.0119 | 308.79 | 0.1089 |
| INSR * | 1.27 | 5.68 | 6.41 | 5.39 | 1.87 |
| IRS1 | 3.59 | 2.50 | 2.15 | 5.40 | 7.05 |
| IRS2 | 3.44 | 0.8080 | 2.80 | 6.19 | 0.7902 |
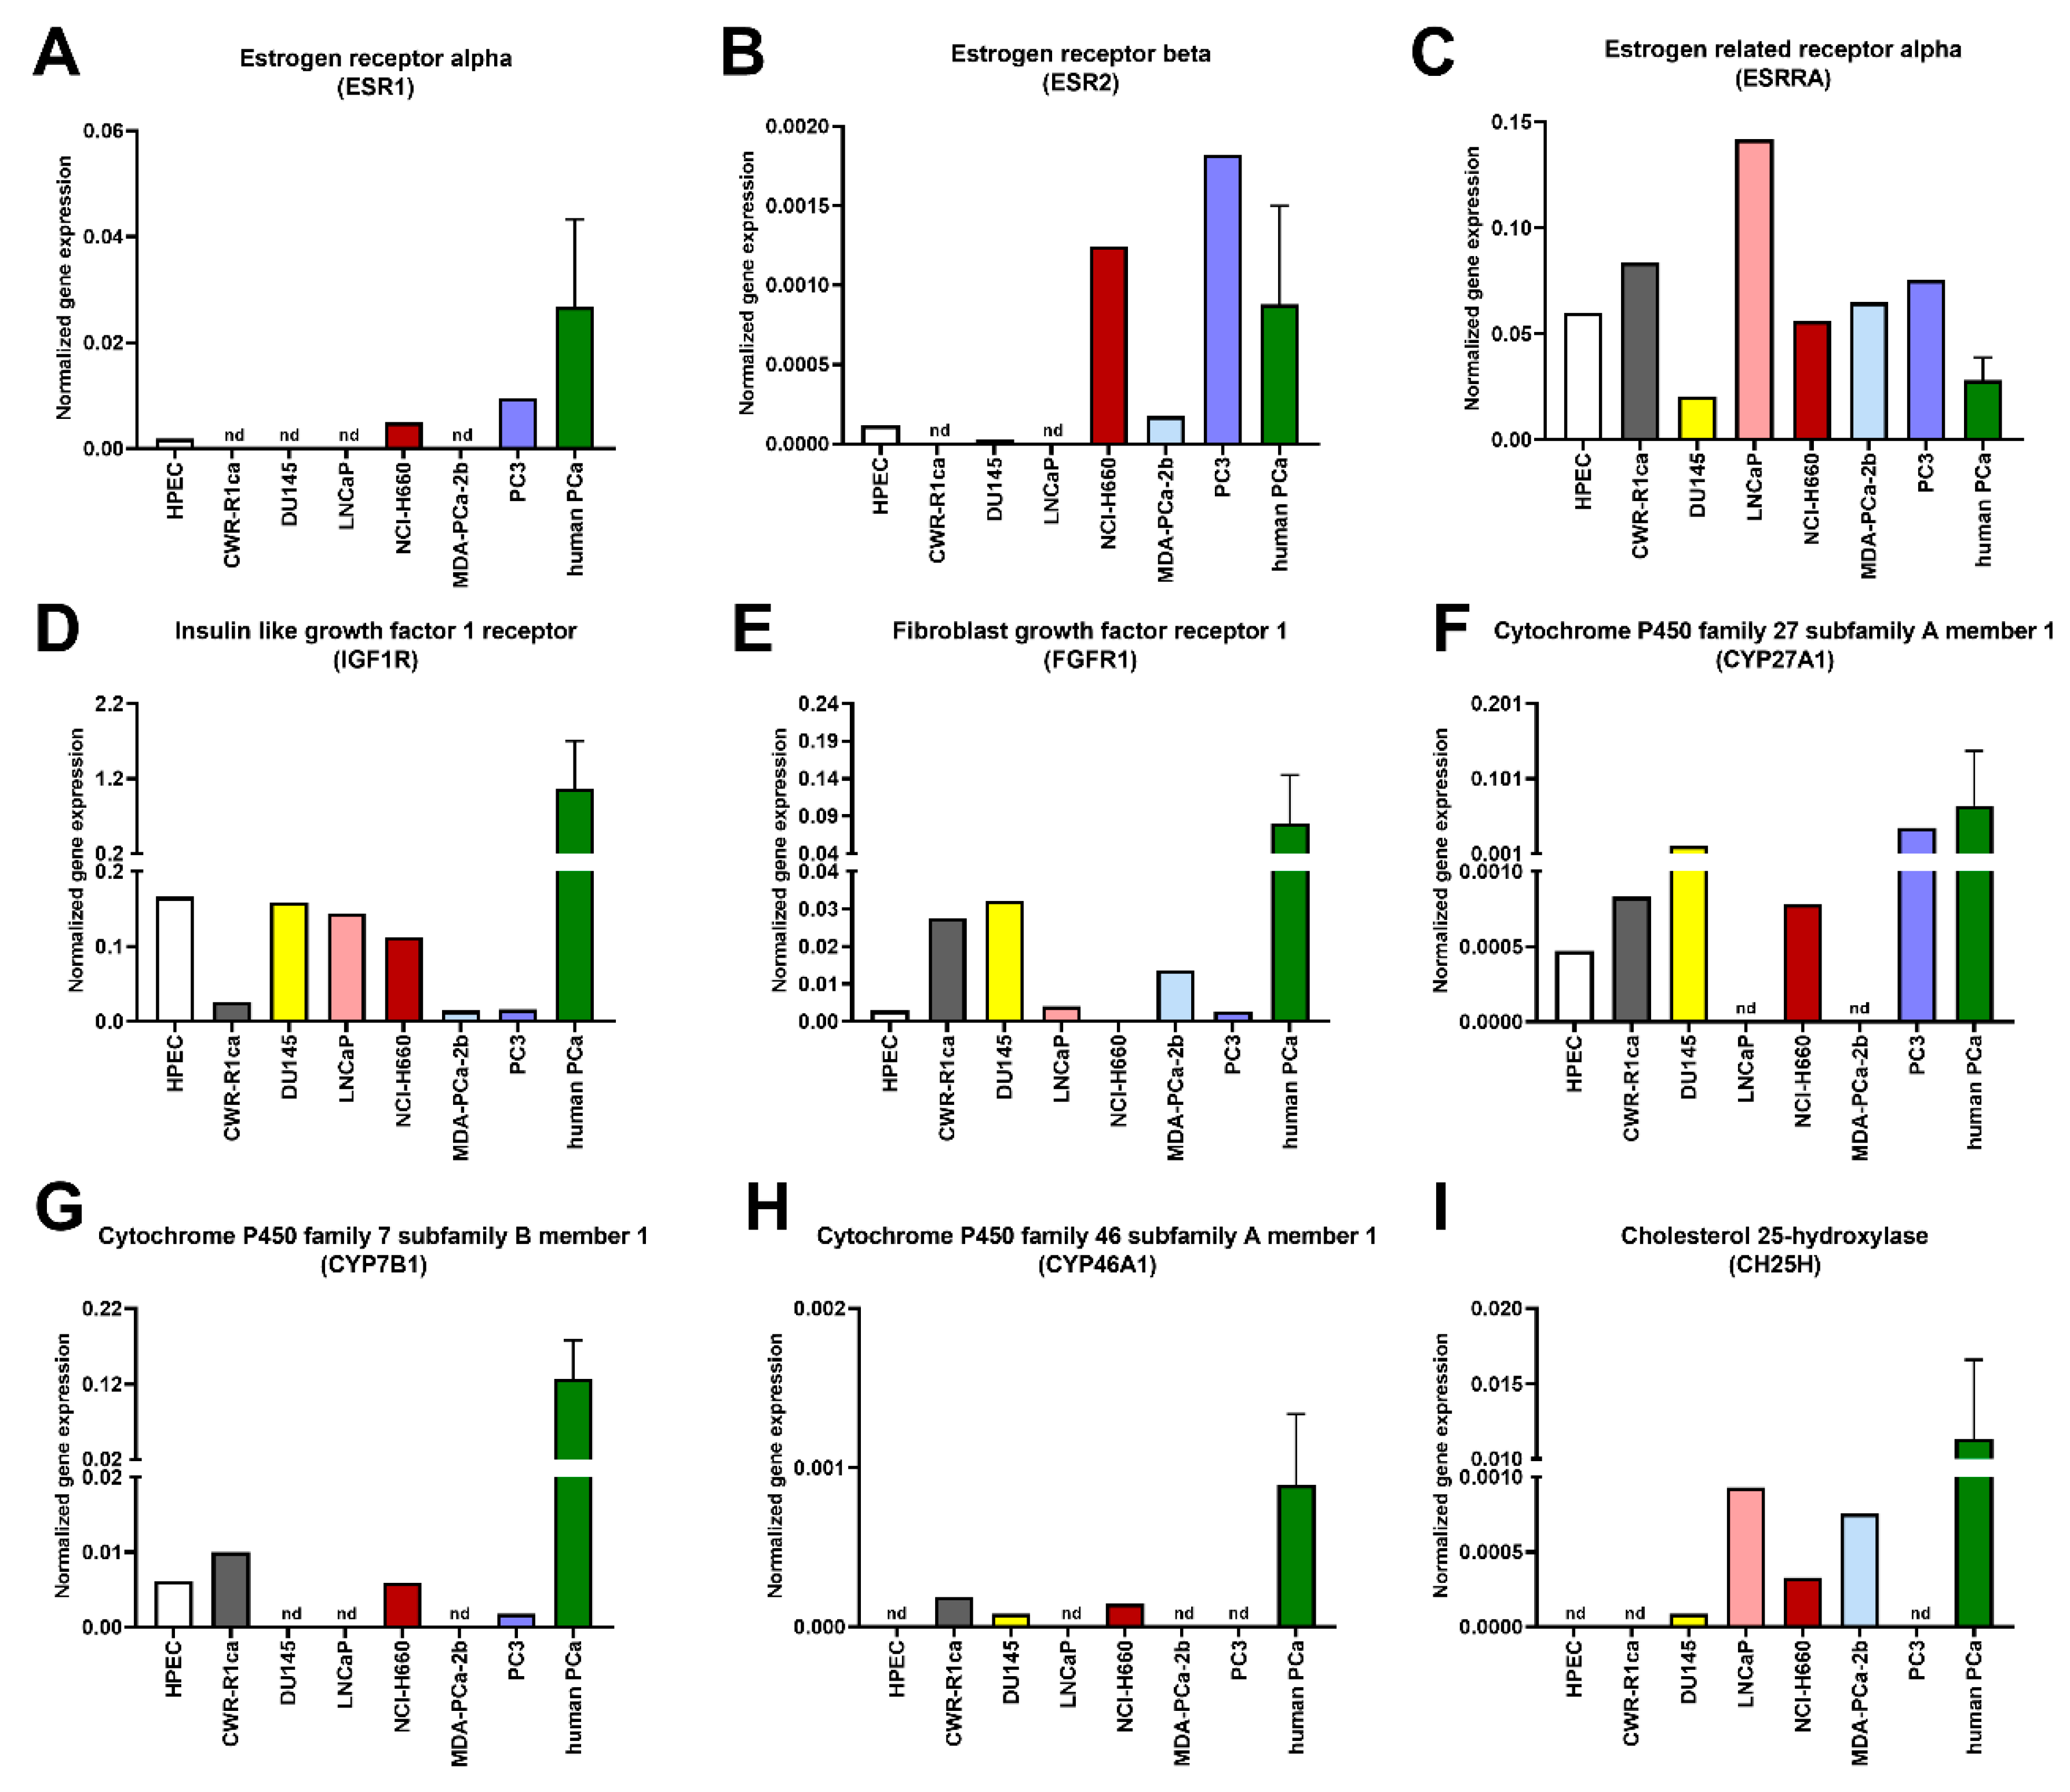
| ESR1 | 0.0184 | 0.0015 | 0.9132 | 0.0016 | 0.2013 |
| ESR2 | 0.1613 | 0.0867 | 0.5153 | 0.0632 | 0.2337 |
| ESRRA | 11.19 | 27.04 | 12.65 | 29.41 | 19.22 |
| IGF1R | 5.41 | 9.46 | 6.21 | 22.71 | 1.58 |
| FGFR1 | 13.30 | 2.68 | 0.3394 | 3.32 | 5.23 |
| CYP27A1 | 3.42 | 0.0650 | 0.1743 | 0.0264 | 5.67 |
| CYP7B1 | 0.0550 | 0 | 0.3231 | 0.0092 | 0.7905 |
| CYP46A1 | 0.0446 | 0.2518 | 0.1962 | 0.1349 | 0.1359 |
| CH25H | 0.0455 | 0.0151 | 0.0282 | 0 | 0.0157 |
| MKI67 | 58.09 | 16.15 | 38.52 | 26.22 | 24.39 |
| CCND1 | 129.71 | 110.32 | 0.6017 | 98.12 | 232.60 |
| TP53 | 32.21 | 39.17 | 5.85 | 17.03 | 1.01 |
| HIF1A | 111.95 | 40.72 | 54.63 | 123.32 | 83.55 |
| RELA | 27.04 | 19.18 | 20.18 | 19.53 | 16.76 |
| BIRC5 | 6.84 | 2.61 | 4.12 | 2.57 | 6.09 |
| NOS2 | 0.5080 | 0 | 0.0462 | 0 | 0.0081 |
| SEPP1 | 0.6737 | 27.18 | 34.10 | 44.55 | 1.32 |
| CDKN1A | 18.73 | 92.39 | 52.25 | 40.94 | 4.49 |
| CDKN1B | 17.72 | 28.15 | 40.70 | 32.49 | 8.18 |
| GLUT1 | 68.77 | 19.17 | 10.53 | 25.15 | 63.88 |
| GLUT12 | 0.5633 | 26.02 | 0.9042 | 6.98 | 0.6577 |
| Pathway of Interest | Proposed Useful PCa Cell Lines |
|---|---|
| Androgen signaling | LNCaP, MDA-PCa-2b |
| Mitogenic insulin signaling | MDA-PCa-2b |
| Estrogen signaling | NCI-H660, PC3 |
| HIF1A pathway | PC3 |
© 2020 by the authors. Licensee MDPI, Basel, Switzerland. This article is an open access article distributed under the terms and conditions of the Creative Commons Attribution (CC BY) license (http://creativecommons.org/licenses/by/4.0/).
Share and Cite
Franko, A.; Berti, L.; Guirguis, A.; Hennenlotter, J.; Wagner, R.; Scharpf, M.O.; de Angelis, M.H.; Wißmiller, K.; Lickert, H.; Stenzl, A.; et al. Characterization of Hormone-Dependent Pathways in Six Human Prostate-Cancer Cell Lines: A Gene-Expression Study. Genes 2020, 11, 1174. https://doi.org/10.3390/genes11101174
Franko A, Berti L, Guirguis A, Hennenlotter J, Wagner R, Scharpf MO, de Angelis MH, Wißmiller K, Lickert H, Stenzl A, et al. Characterization of Hormone-Dependent Pathways in Six Human Prostate-Cancer Cell Lines: A Gene-Expression Study. Genes. 2020; 11(10):1174. https://doi.org/10.3390/genes11101174
Chicago/Turabian StyleFranko, Andras, Lucia Berti, Alke Guirguis, Jörg Hennenlotter, Robert Wagner, Marcus O. Scharpf, Martin Hrabĕ de Angelis, Katharina Wißmiller, Heiko Lickert, Arnulf Stenzl, and et al. 2020. "Characterization of Hormone-Dependent Pathways in Six Human Prostate-Cancer Cell Lines: A Gene-Expression Study" Genes 11, no. 10: 1174. https://doi.org/10.3390/genes11101174