Entropy Measures as Descriptors to Identify Apneas in Rheoencephalographic Signals


Abstract
1. Introduction
2. Materials and Methods
2.1. Entropy Definitions
2.1.1. Shannon Entropy
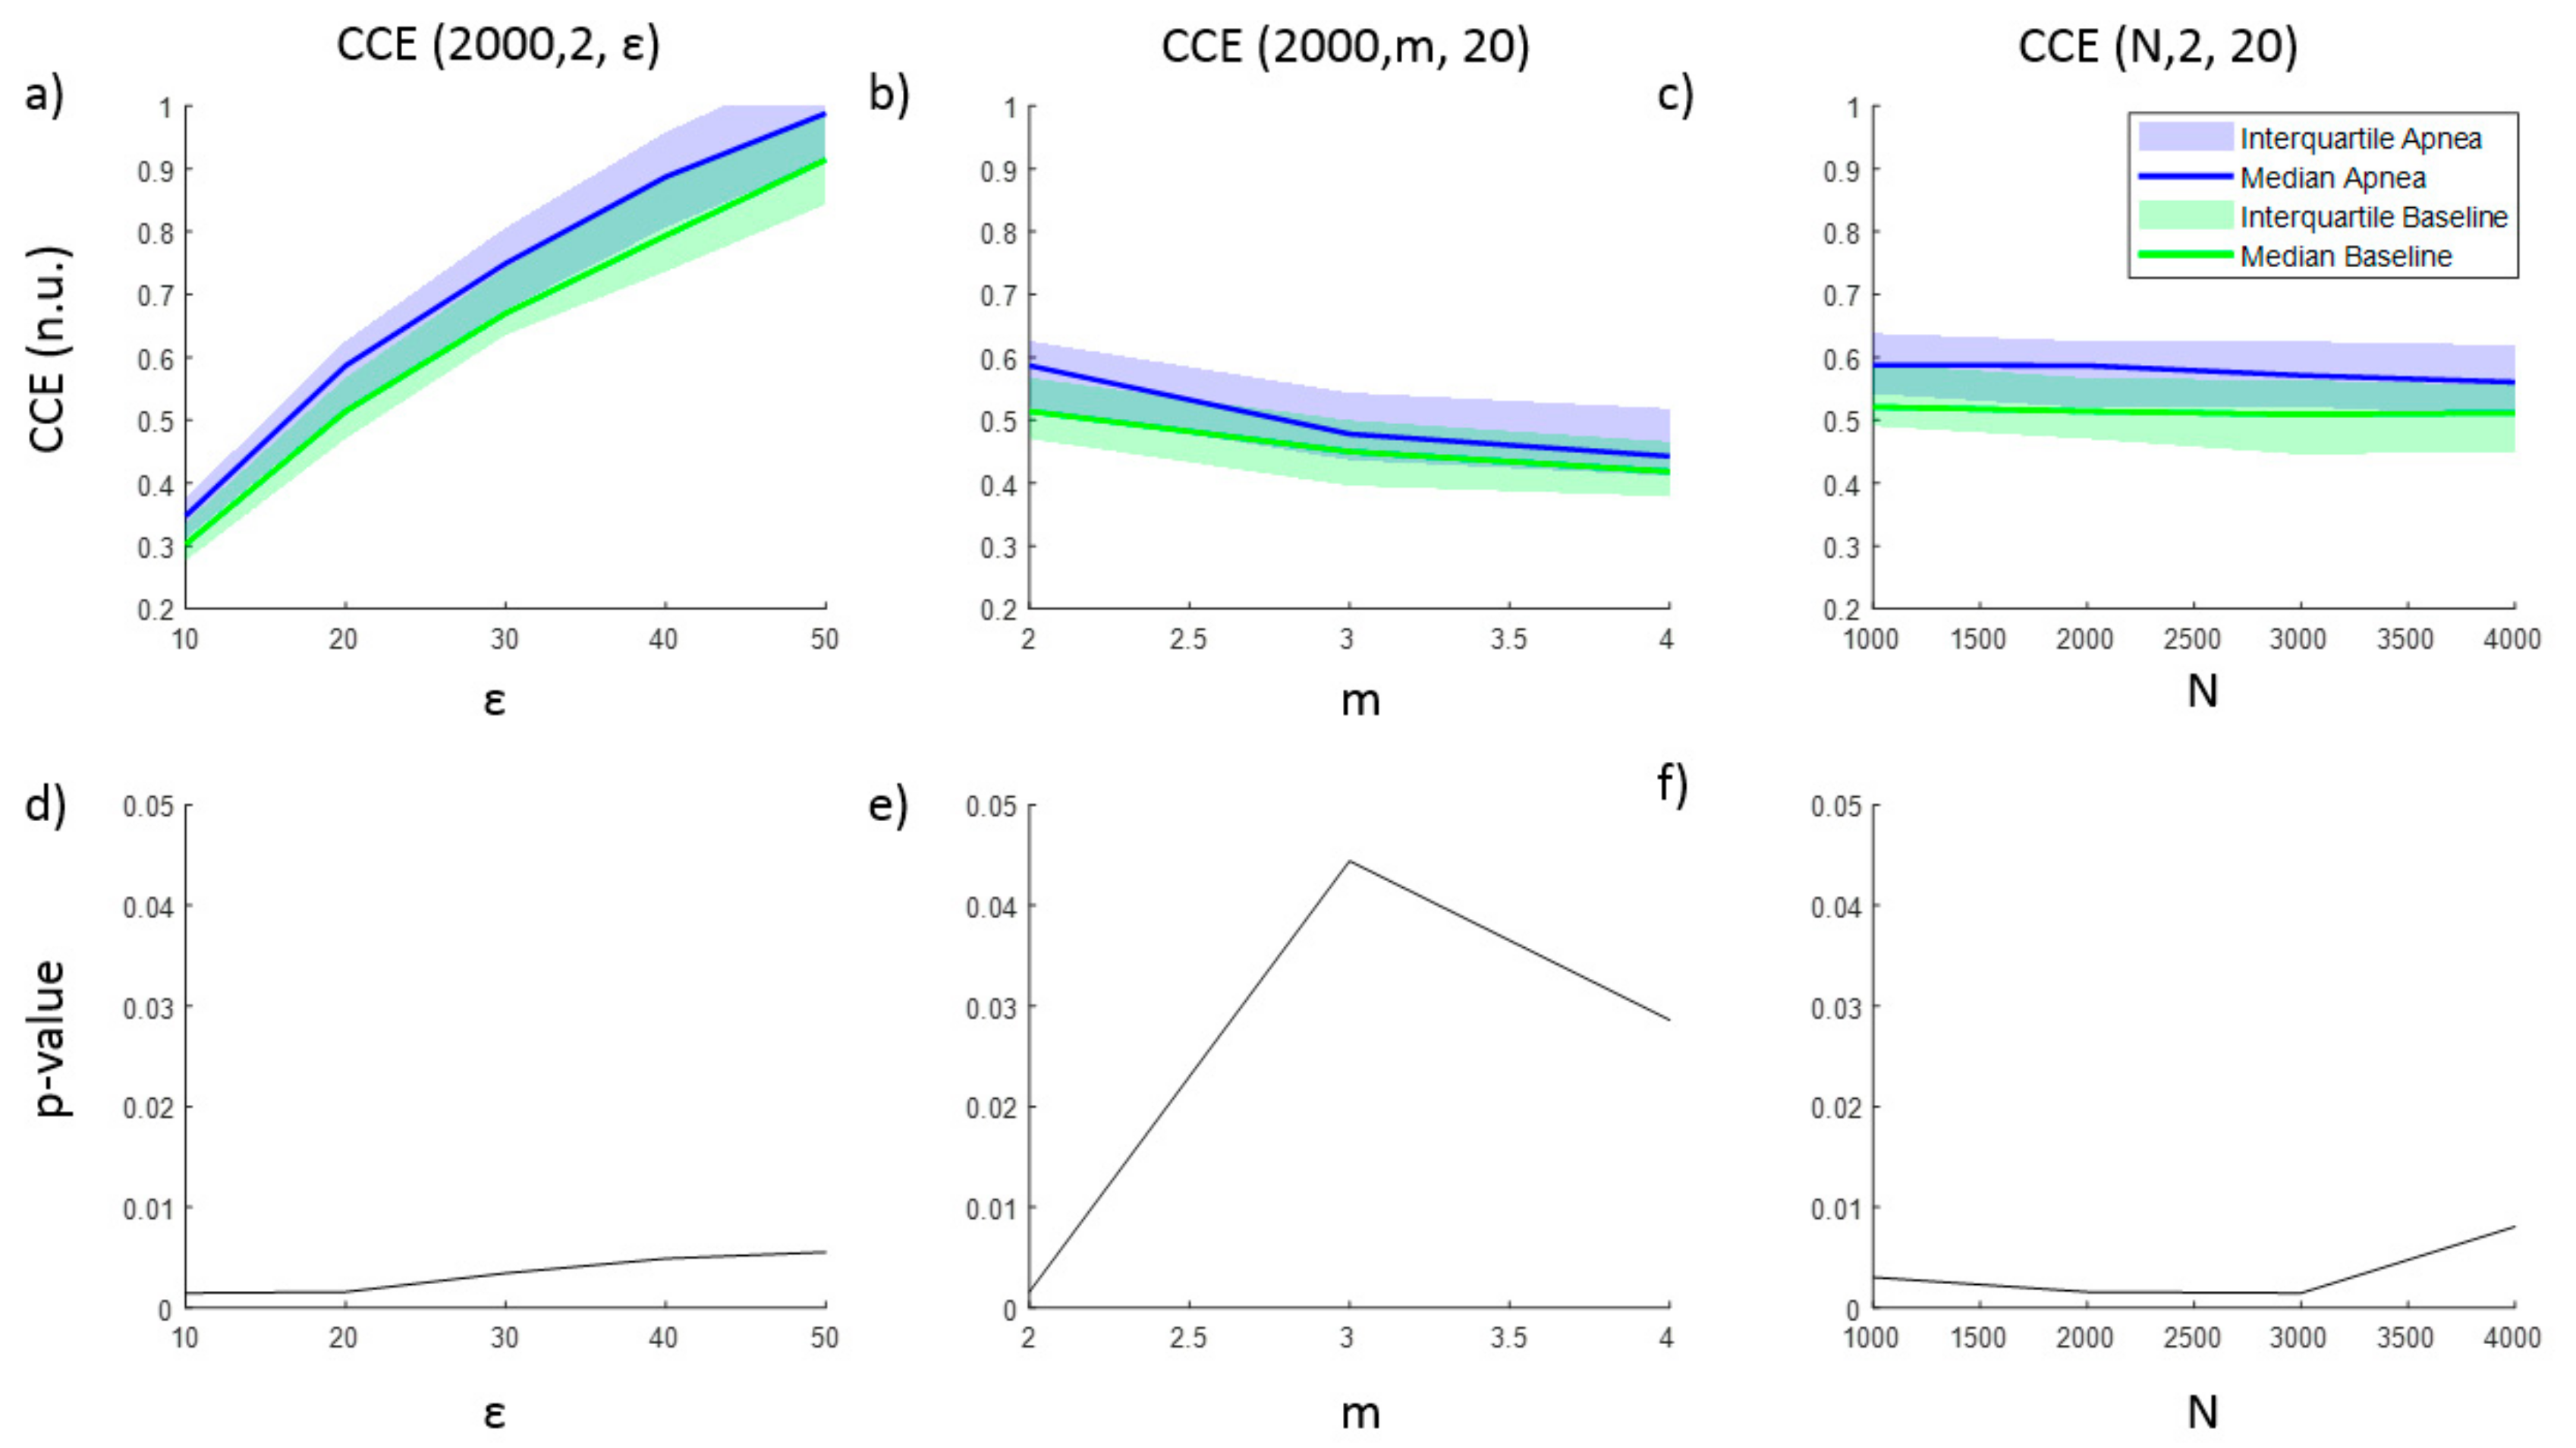
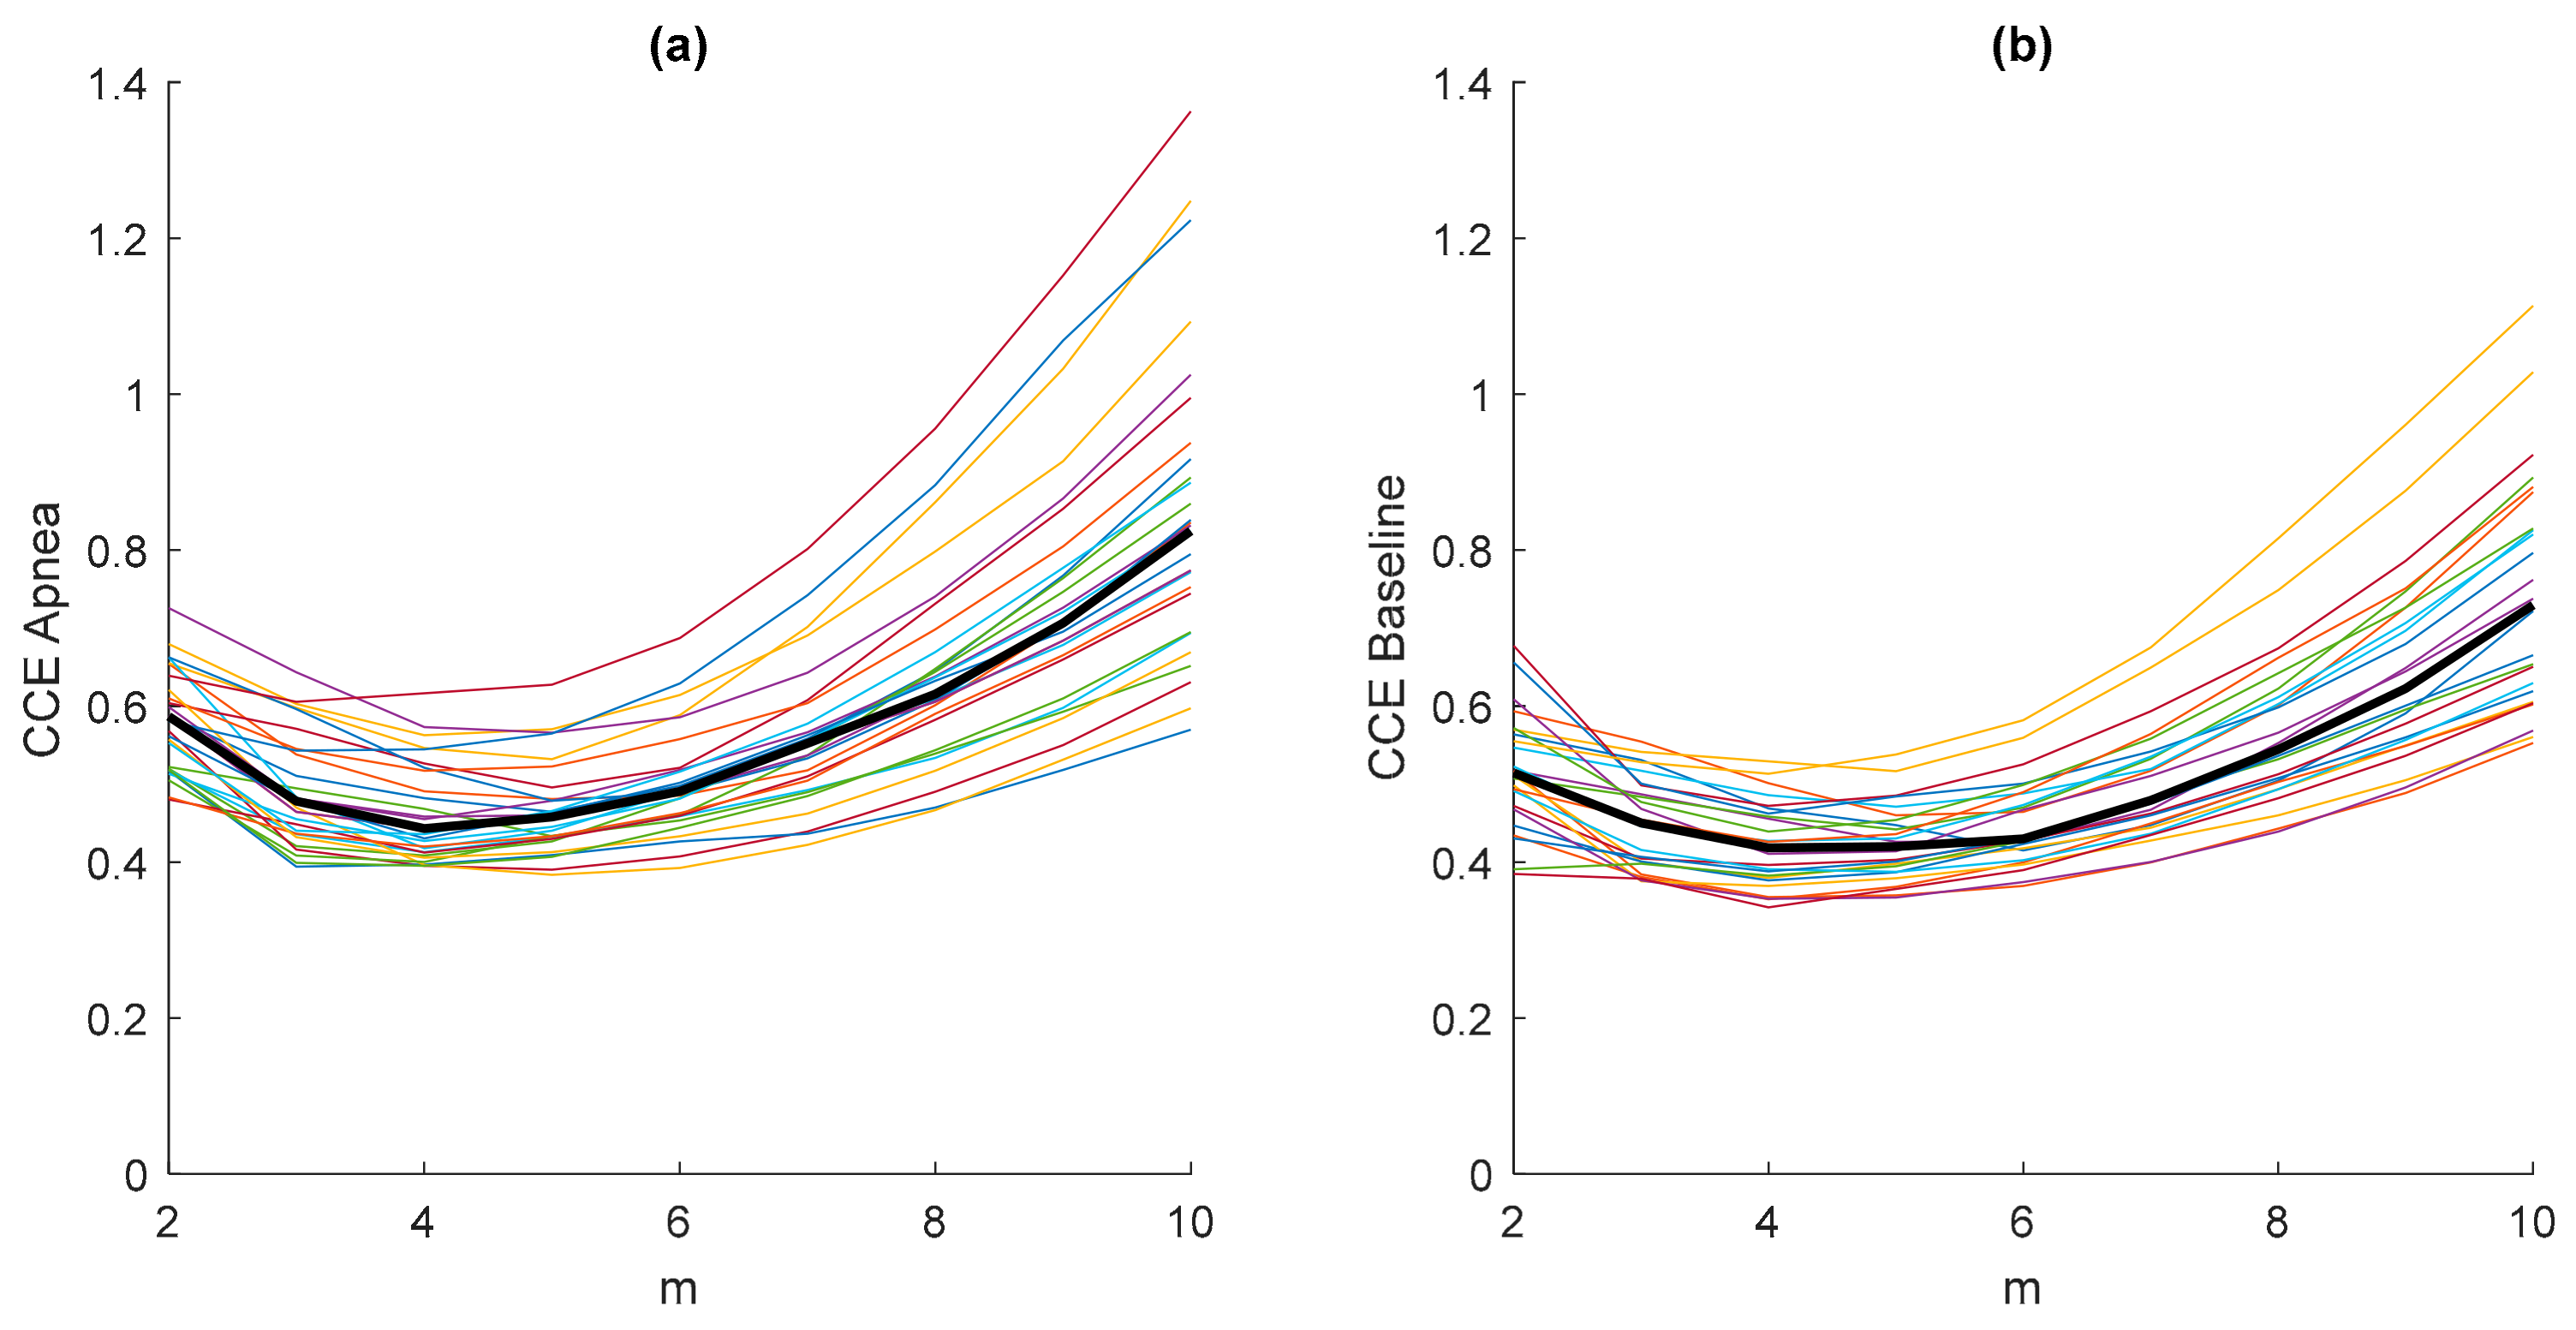
2.1.2. Corrected Conditional Entropy
2.1.3. Approximate Entropy
2.1.4. Sample Entropy
2.1.5. Fuzzy Entropy
2.2. Experimental Protocol
2.3. Data Analysis
- Maximum amplitude (Max)
- Minimum amplitude (Min)
- Amplitude range (Range)
- Slope of the increasing edge (α)
- Area under the curve of each cardiac cycle (Area)
- Time between two consecutive maximums (Δtmax)
- Time between two consecutive minimums (Δtmin)
- Time between a minimum and its consecutive maximum (Δtmin-max)
3. Results
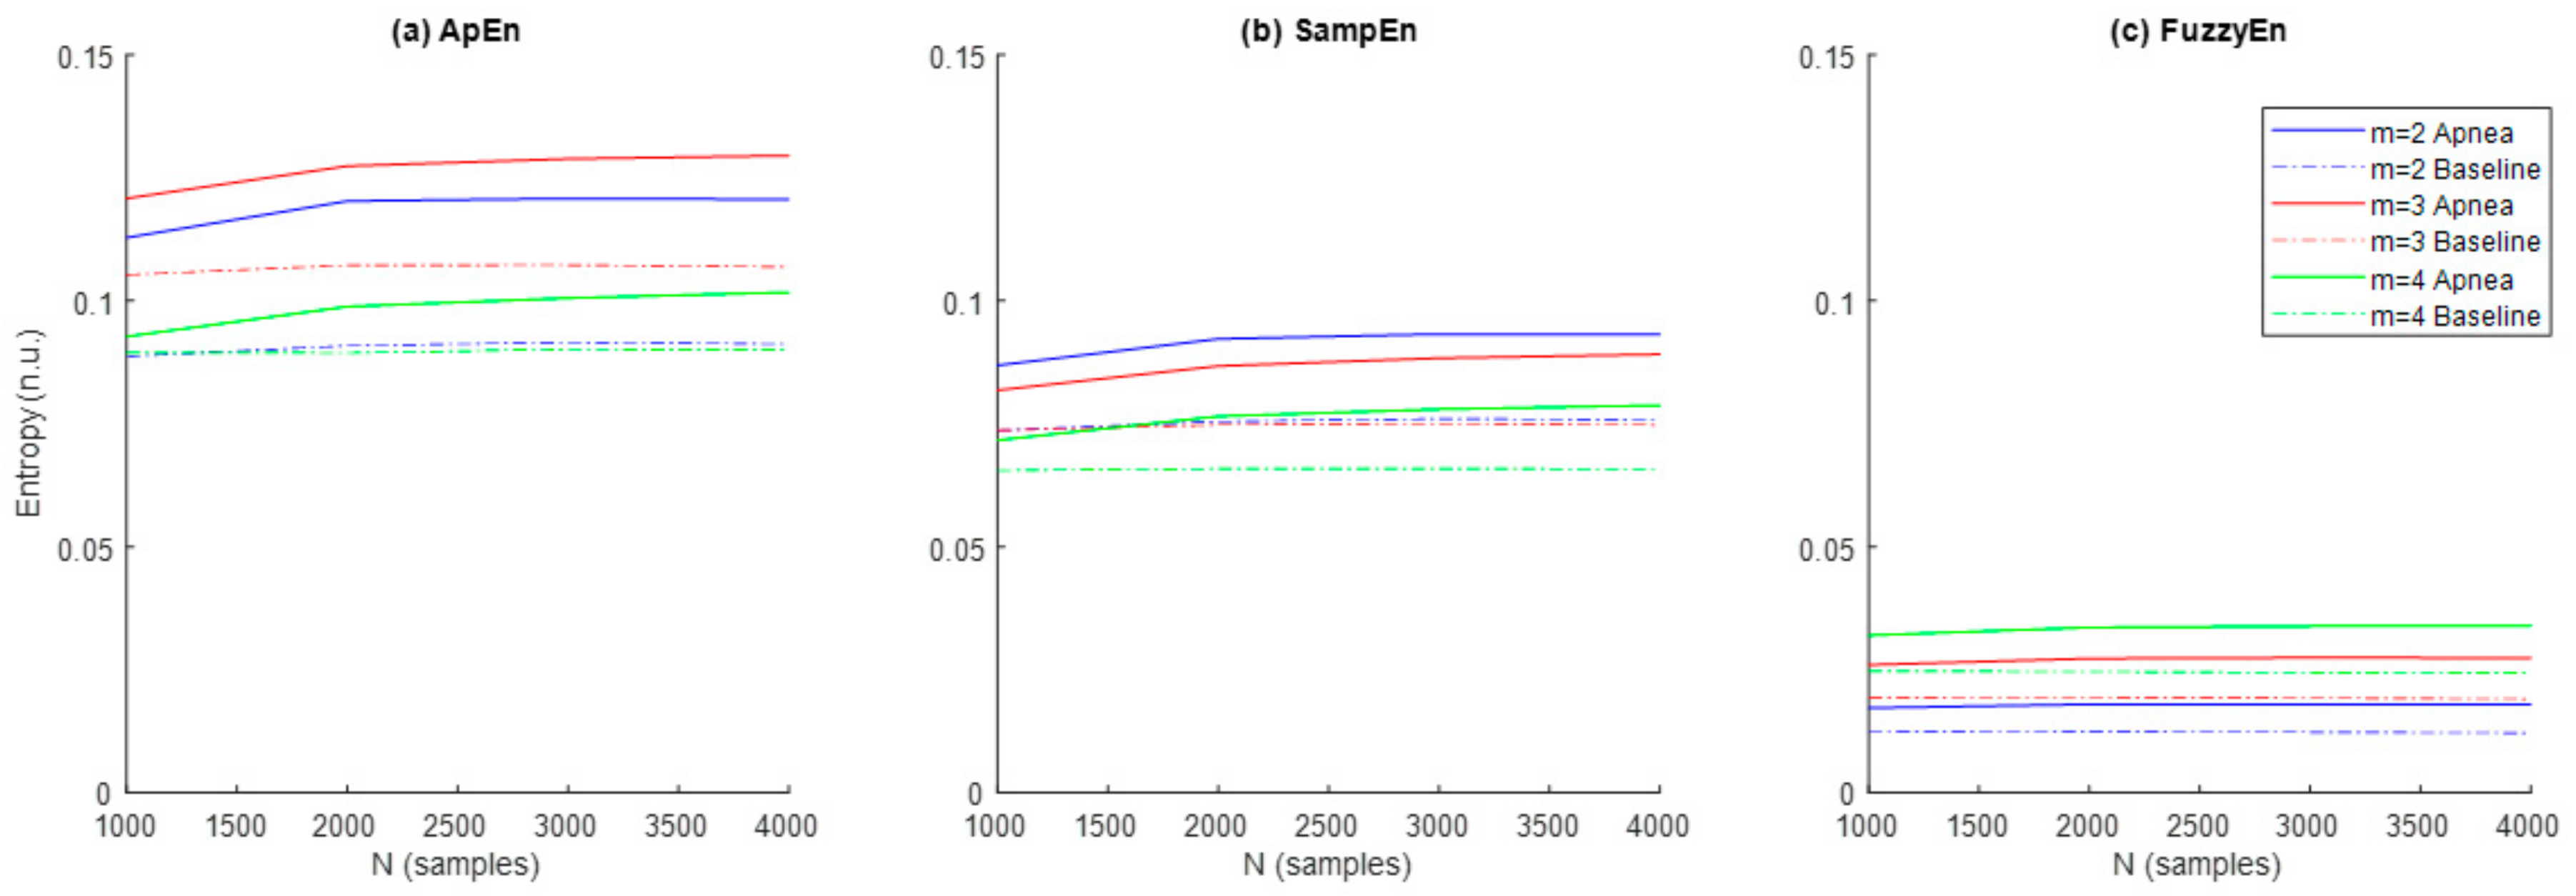
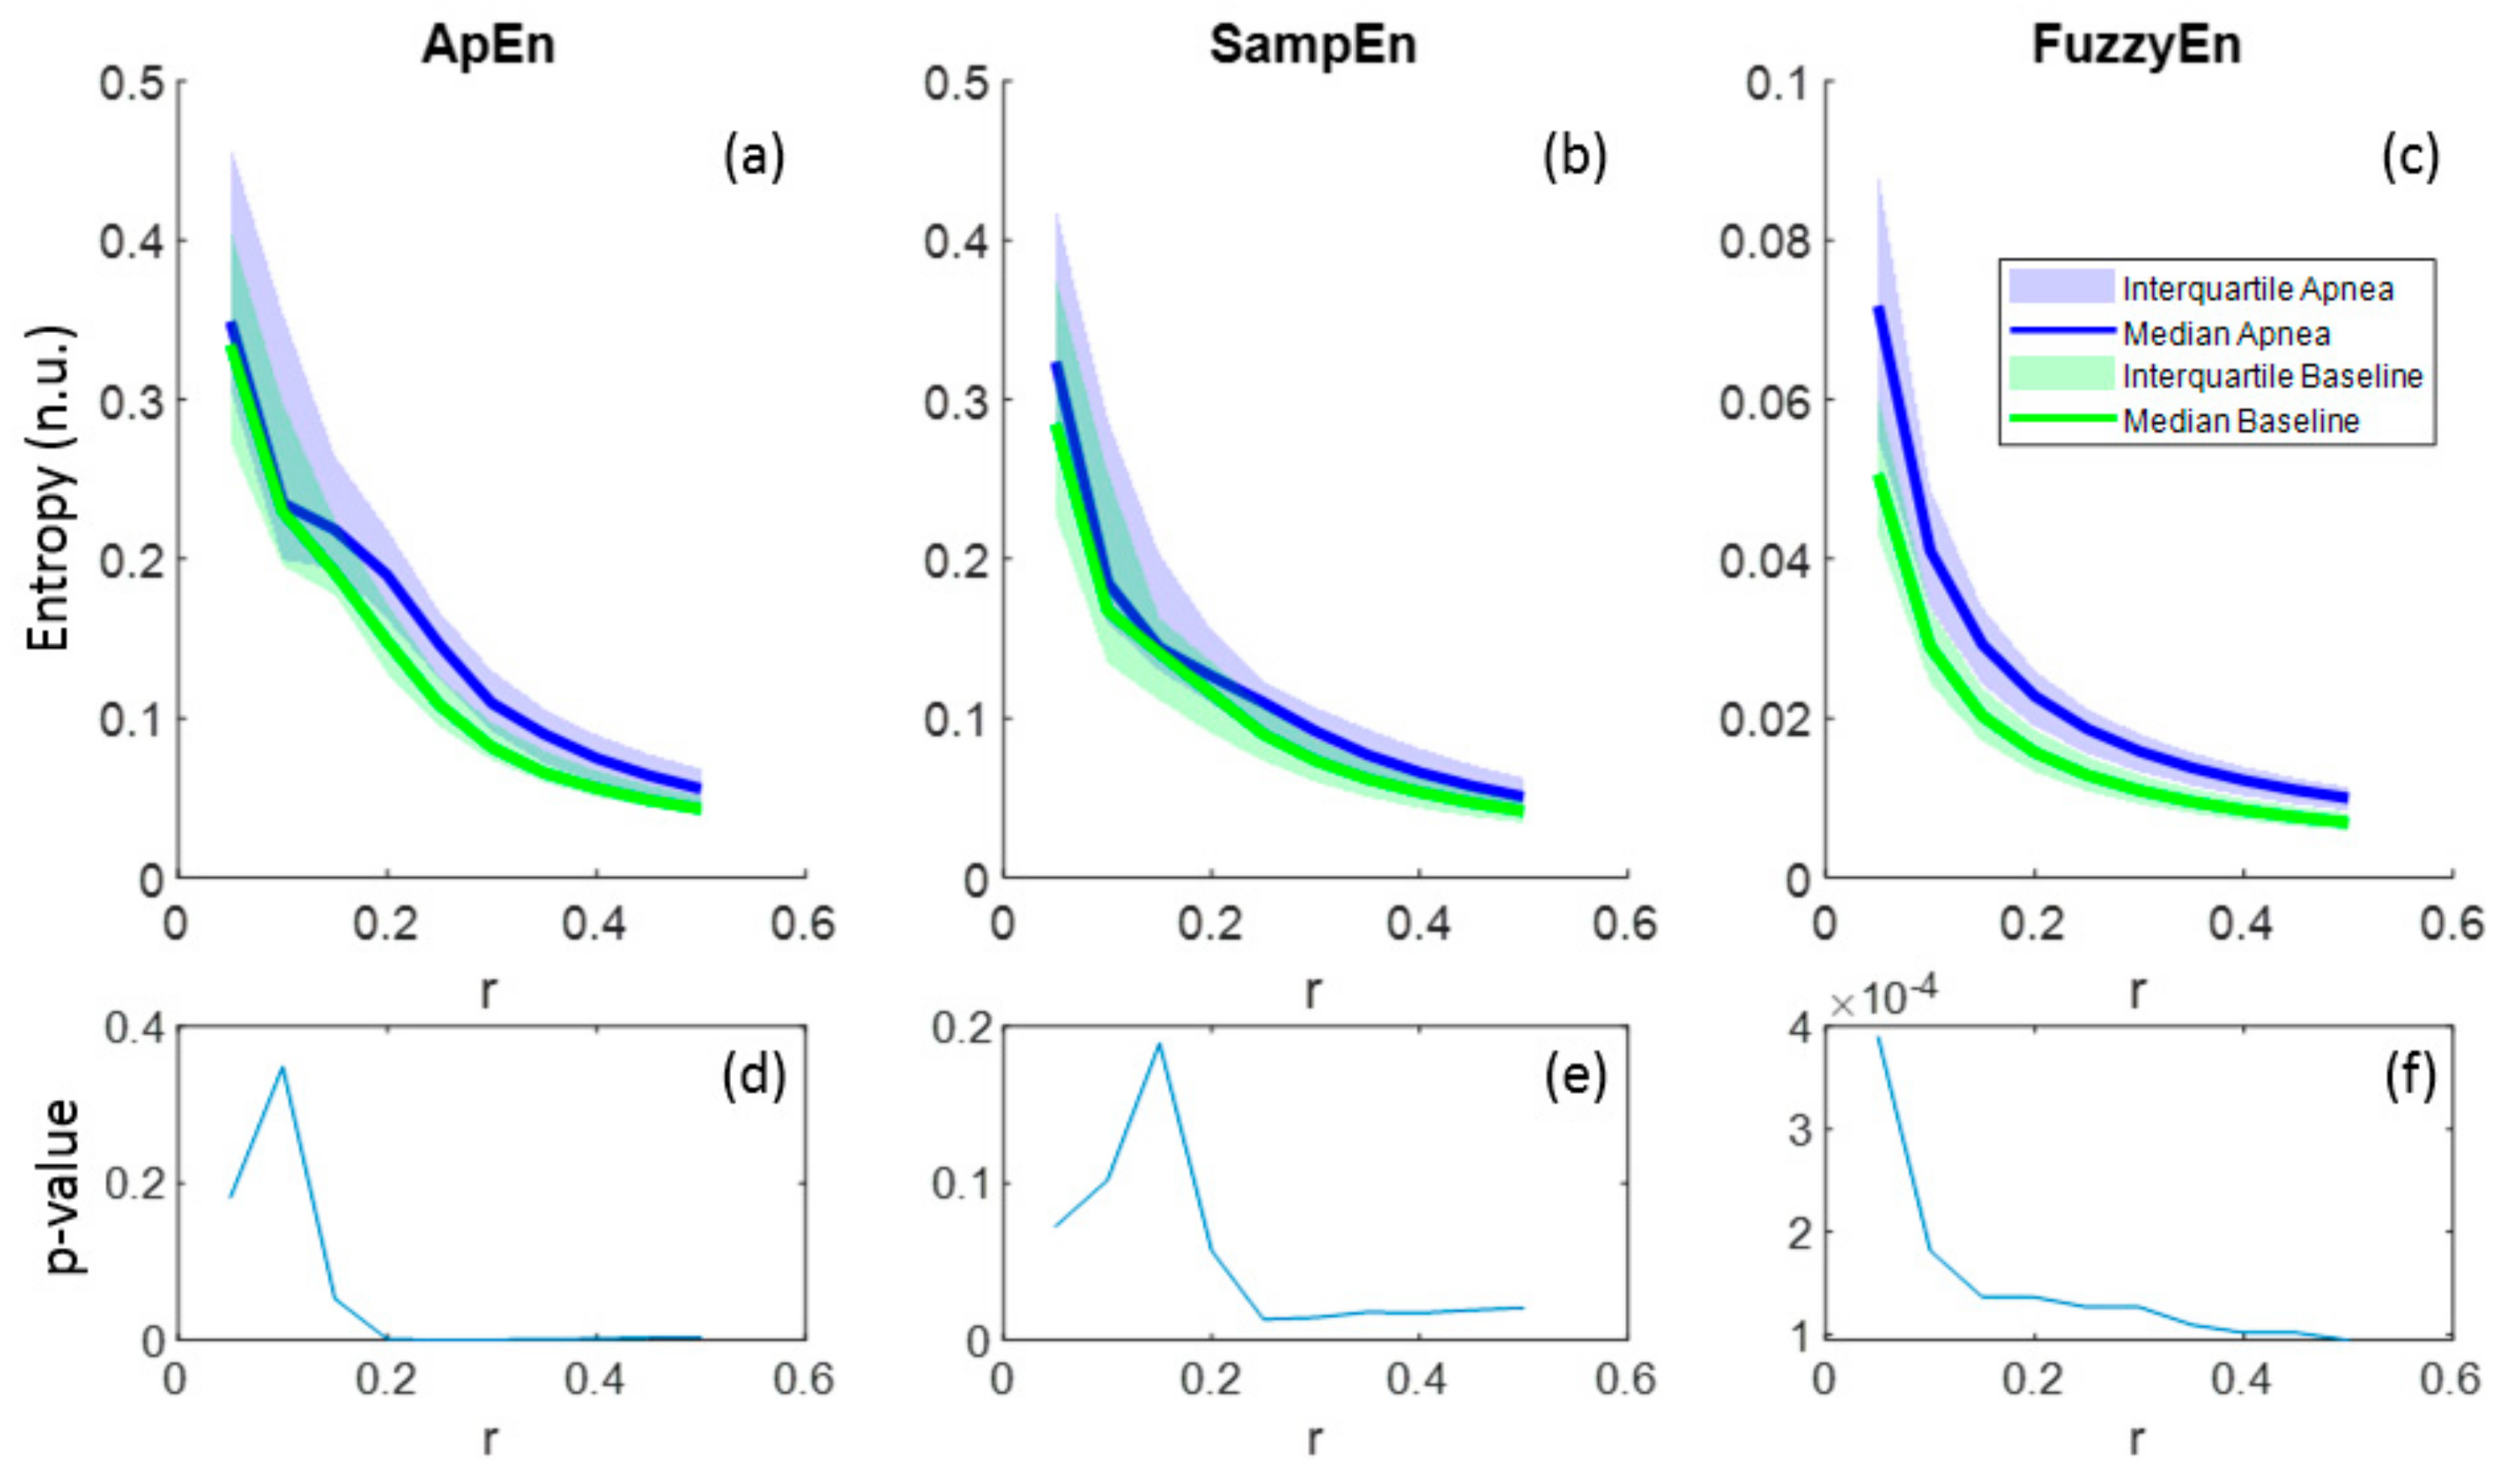
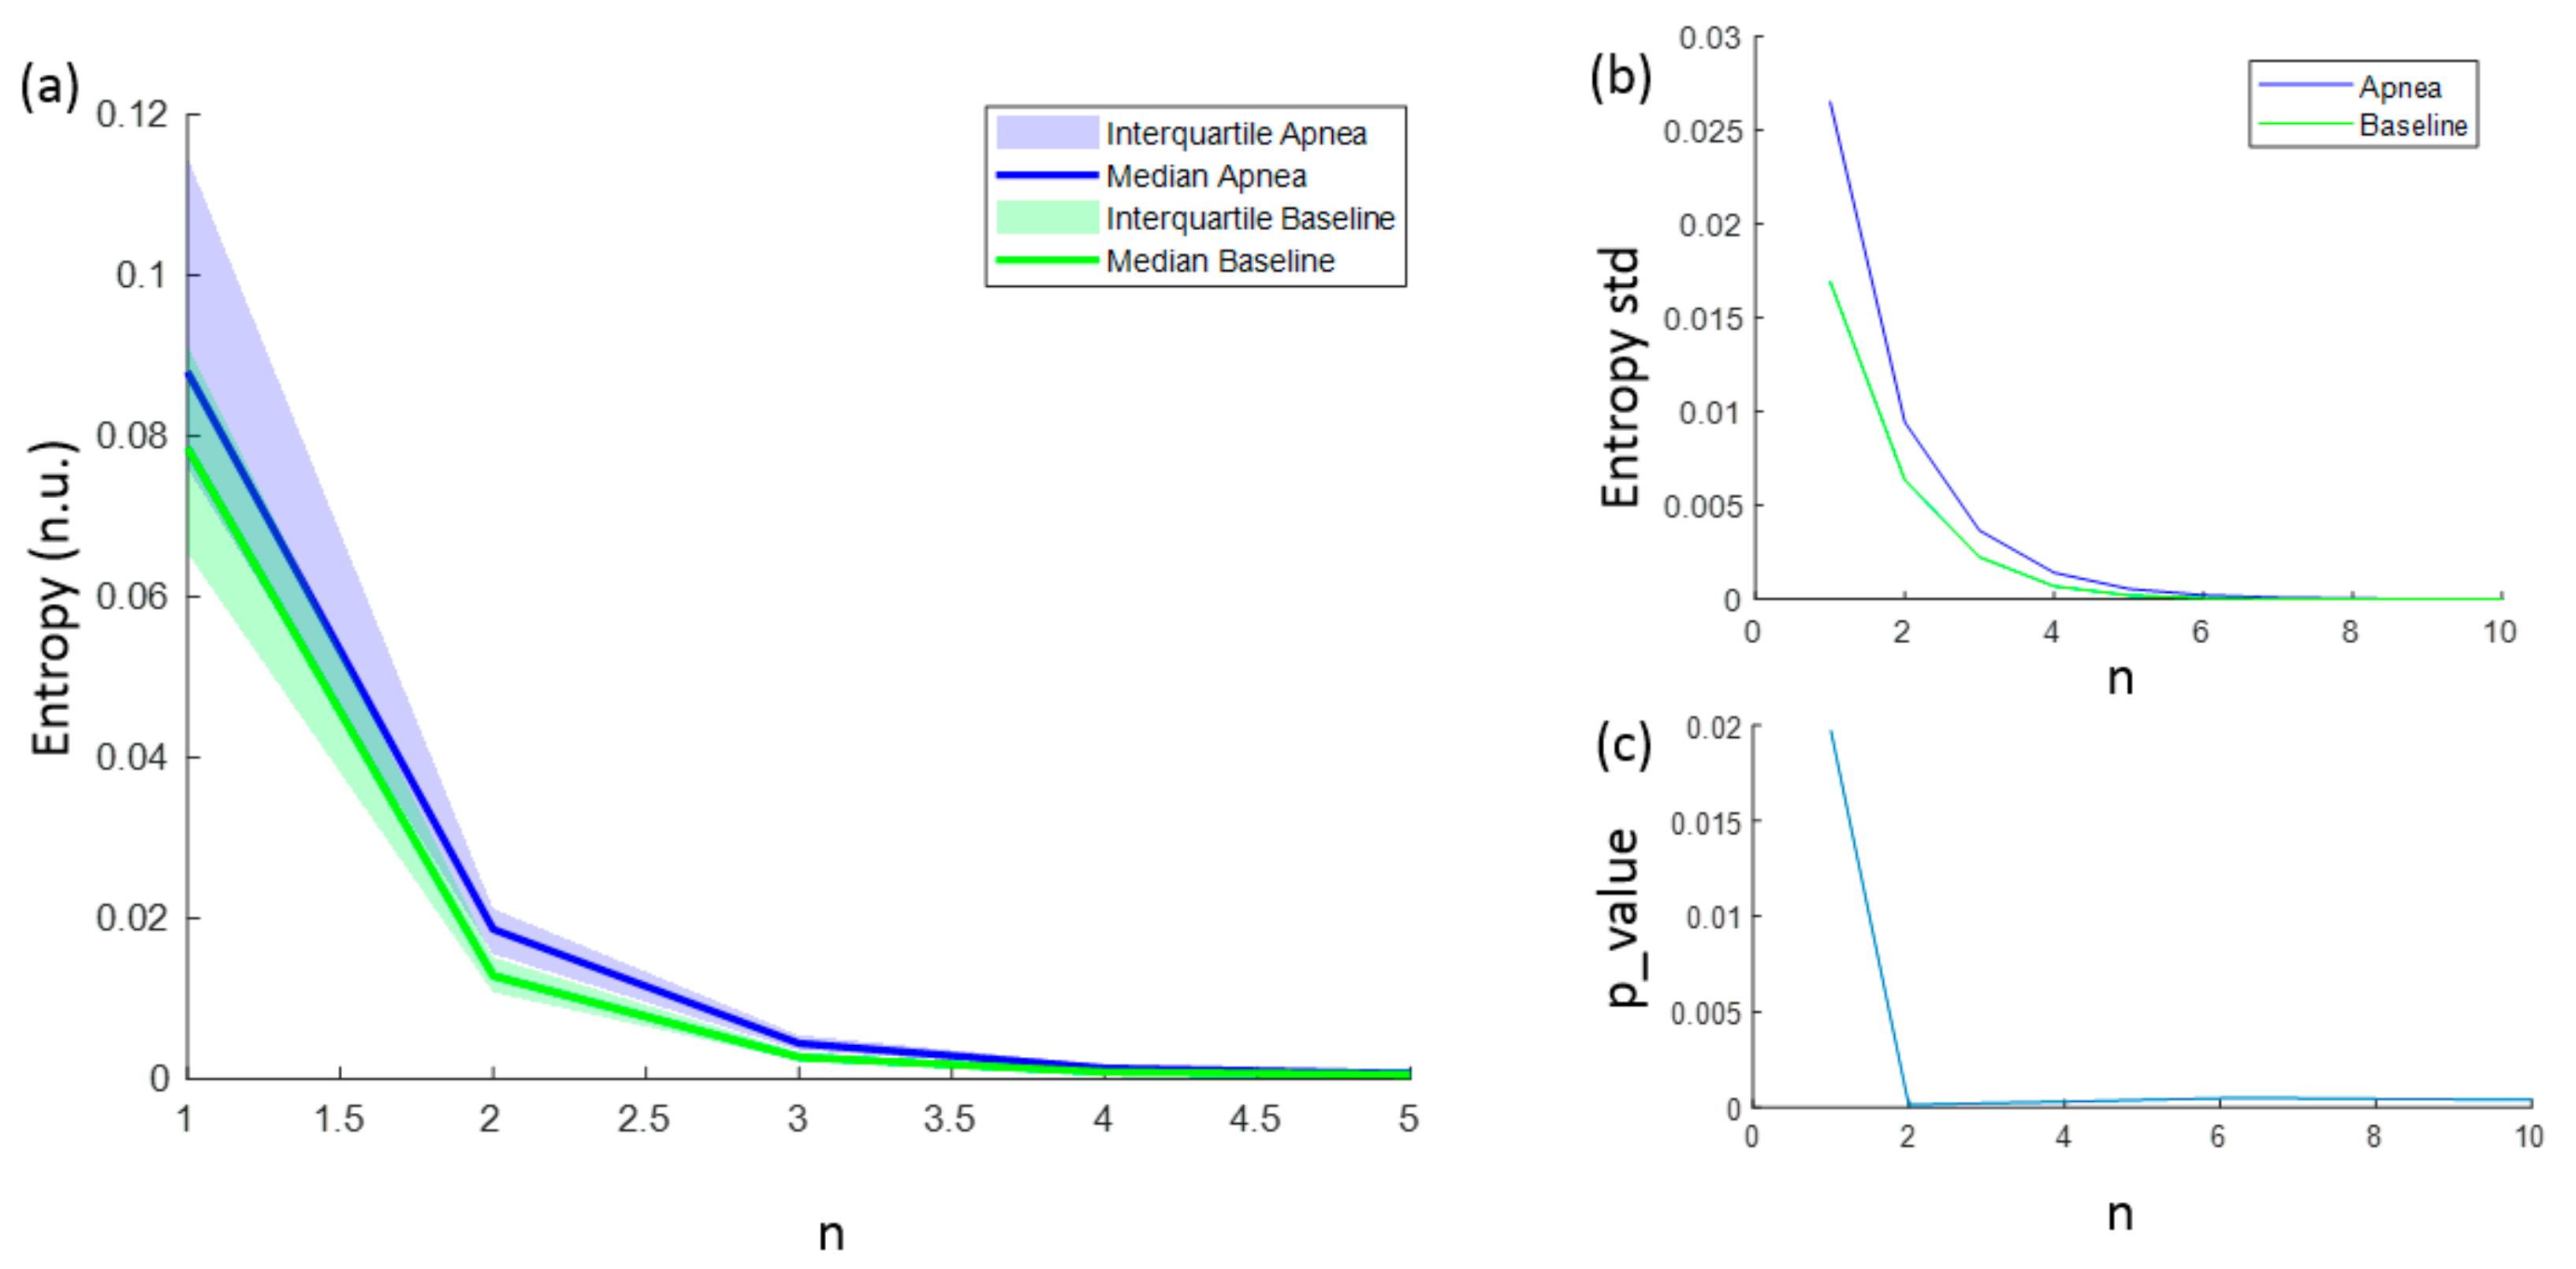
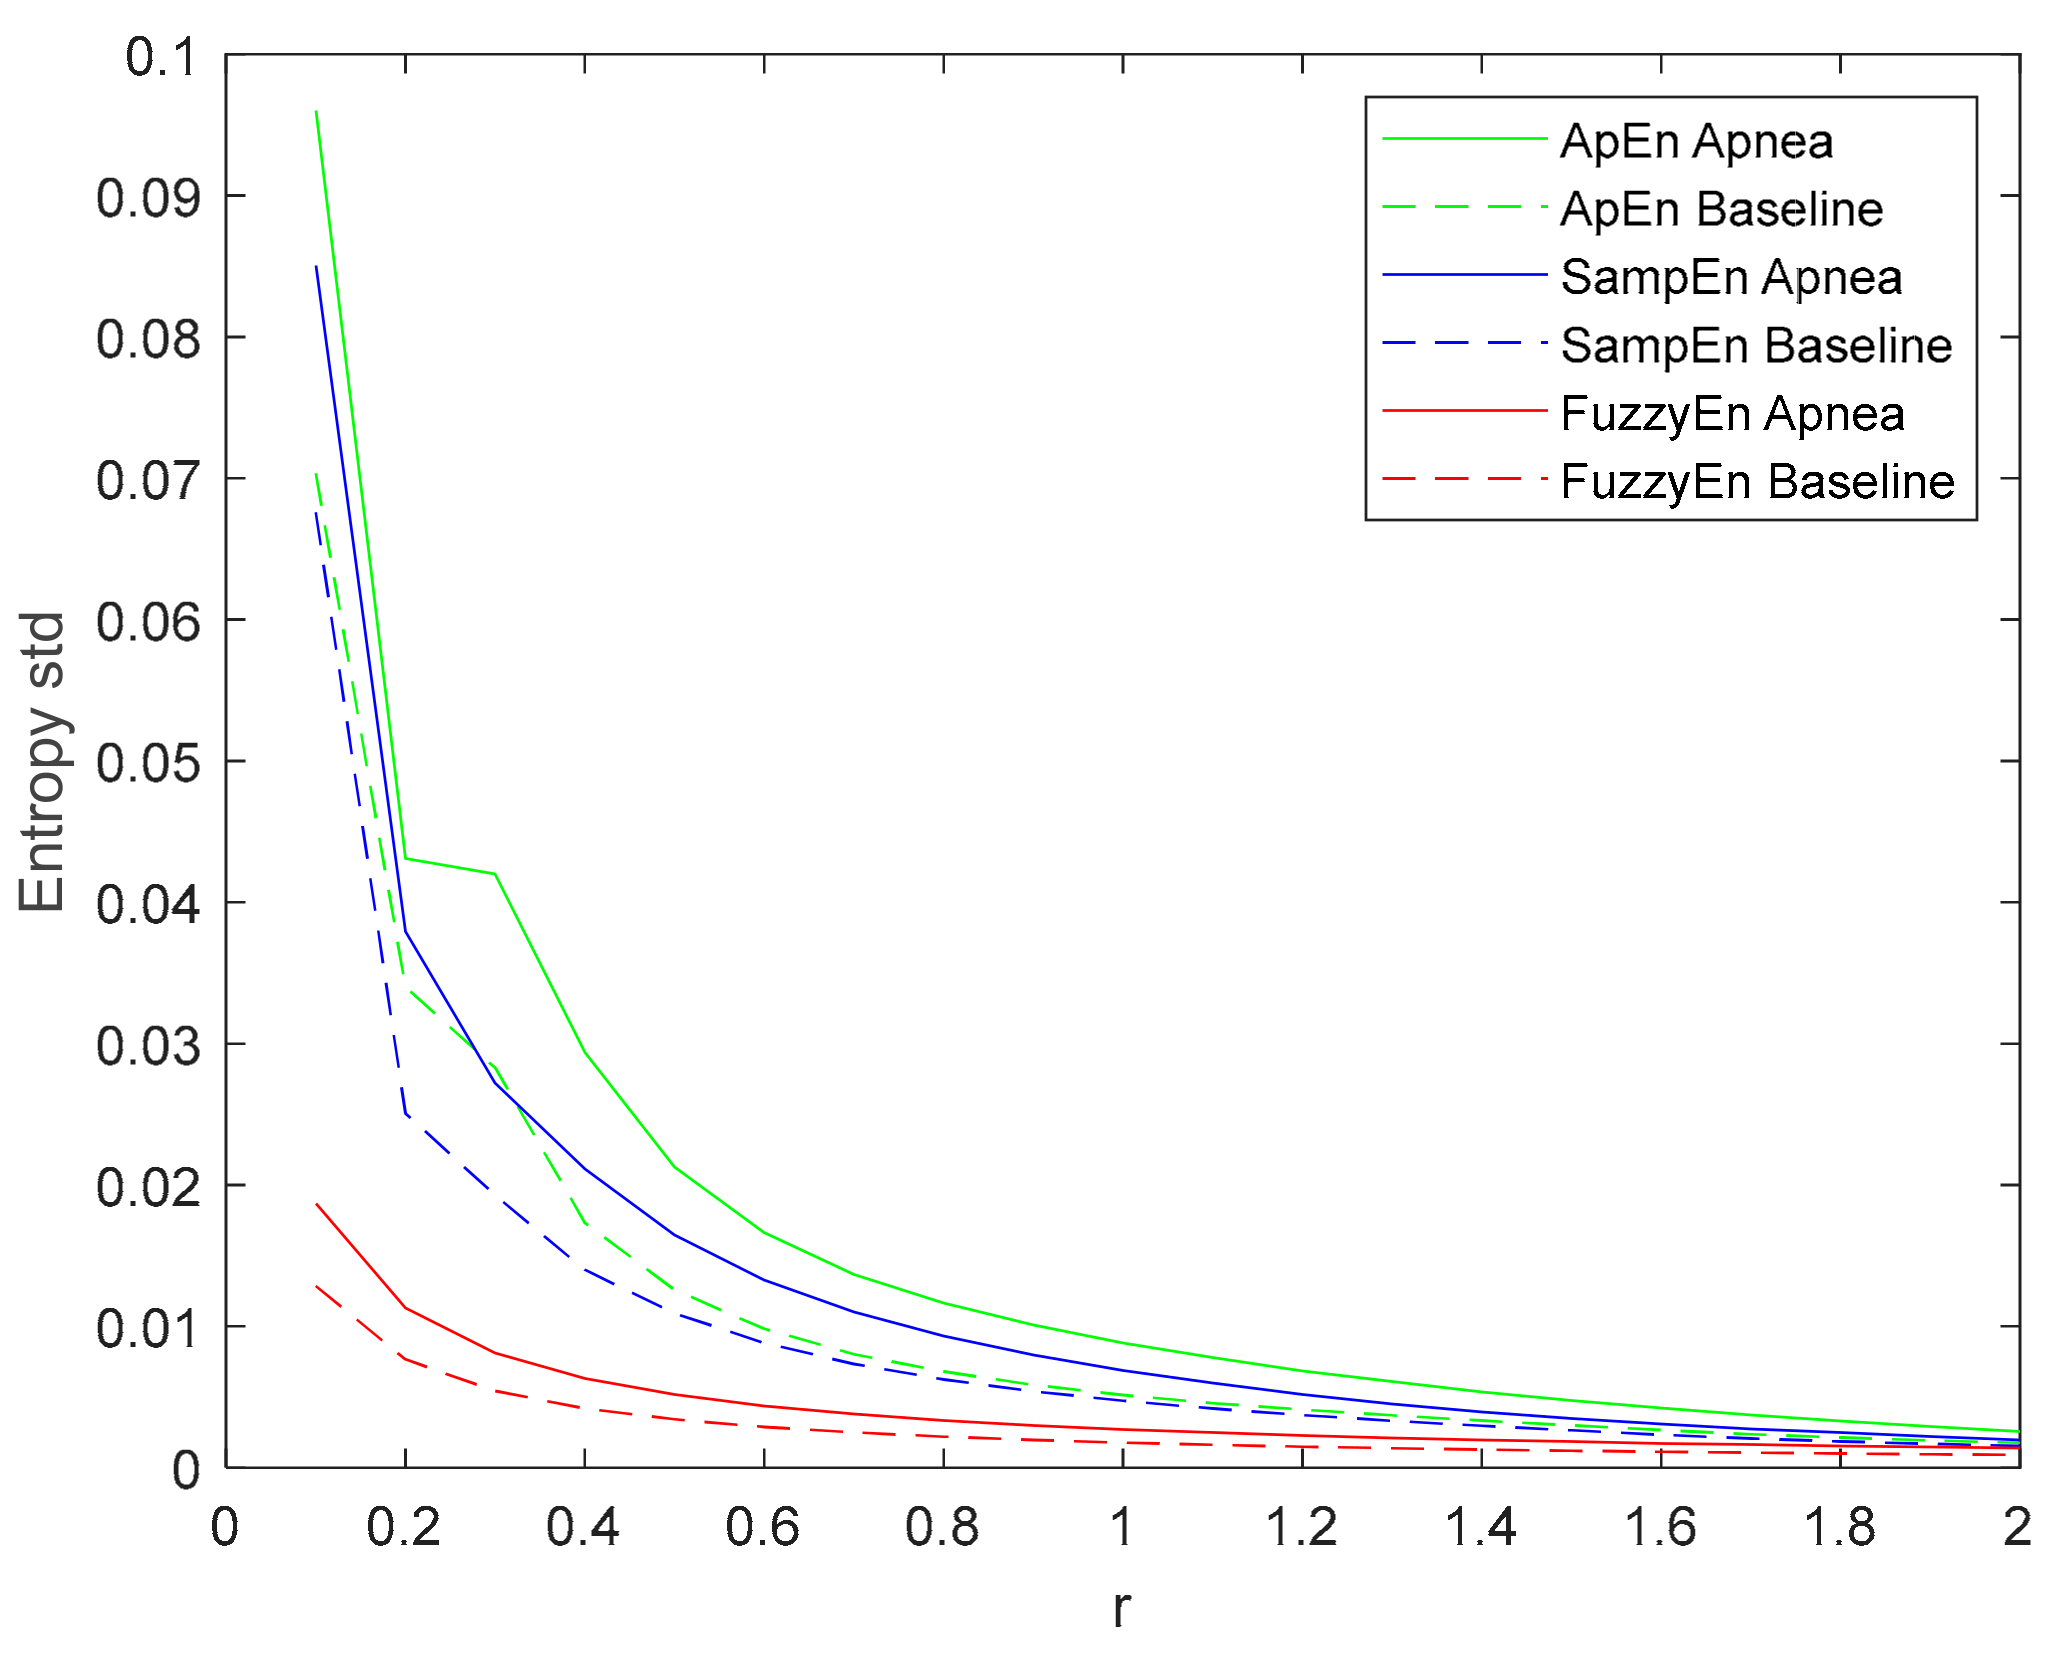
3.1. Parameters Selection for Each Entropy Metric
3.2. Final Parameter and Entropy Values
4. Discussion
5. Conclusions
Author Contributions
Funding
Conflicts of Interest
References
- Cipolla, M.J. The Cerebral Circulation; Morgan & Claypool Life Sciences: San Rafael, CA, USA, 2009. [Google Scholar]
- Goettel, N.; Patet, C.; Rossi, A.; Burkhart, C.S.; Czosnyka, M.; Strebel, S.P.; Steiner, L.A. Monitoring of cerebral blood flow autoregulation in adults undergoing sevoflurane anesthesia: a prospective cohort study of two age groups. J. Clin. Monit. Comput. 2016, 30, 255–264. [Google Scholar] [CrossRef] [PubMed]
- Tuman, K.J.; McCarthy, R.J.; Najafi, H.; Ivankovich, A.D. Differential effects of advanced age on neurologic and cardiac risks of coronary artery operations. J. Thorac. Cardiovasc. Surg. 1992, 104, 1510–1517. [Google Scholar] [PubMed]
- Reed, G.L.; Singer, D.E.; Picard, E.H.; DeSanctis, R.W. Stroke Following Coronary-Artery Bypass Surgery. N. Engl. J. Med. 1988, 319, 1246–1250. [Google Scholar] [CrossRef] [PubMed]
- North American Symptomatic Carotid Endarterectomy Trial Collaborators Beneficial Effect of Carotid Endarterectomy in Symptomatic Patients with High-Grade Carotid Stenosis. N. Engl. J. Med. 1991, 325, 445–453. [CrossRef] [PubMed]
- Bodo, M. Studies in Rheoencephalography (REG). J. Electr. Bioimpedance 2010, 1, 18–40. [Google Scholar] [CrossRef]
- Bodo, M.; Pearce, F.J.; Armonda, R.A. Cerebrovascular reactivity: rat studies in rheoencephalography. Physiol. Meas. 2004, 25, 1371–1384. [Google Scholar] [CrossRef] [PubMed]
- Popovic, D.; Bodo, M.; Pearce, F.; van Albert, S.; Garcia, A.; Settle, T.; Armonda, R. Assessment of cerebral blood flow autoregulation (CBF AR) with rheoencephalography (REG): studies in animals. J. Phys. Conf. Ser. 2013, 434, 12042. [Google Scholar] [CrossRef]
- Bodo, M.; Pearce, F.J.; Baranyi, L.; Armonda, R.A. Changes in the intracranial rheoencephalogram at lower limit of cerebral blood flow autoregulation. Physiol. Meas. 2005, 26, S1–S17. [Google Scholar] [CrossRef] [PubMed]
- Bodo, M.; Pearce, F.; Garcia, A. In vivo cerebral blood flow autoregulation studies using rheoencephalography. J. Phys. 2010, 224, 8–11. [Google Scholar] [CrossRef]
- Jevning, R.; Fernando, G.; Wilson, A.F. Evaluation of consistency among different electrical impedance indices of relative cerebral blood flow in normal resting individuals. J. Biomed. Eng. 1989, 11, 53–56. [Google Scholar] [CrossRef]
- Jacquy, J.; Dekoninck, W.J.; Piraux, A.; Calay, R.; Bacq, J.; Levy, D.; Noel, G. Cerebral blood flow and quantitative rheoencephalography. Electroencephalogr. Clin. Neurophysiol. 1974, 37, 507–511. [Google Scholar] [CrossRef]
- Moskalenko, Y.E. Rheoencephalography: Past Popularity, Obvilion at Present and Optimistic Future. Int. J. Adv. Life Sci. Technol. 2015, 2, 1–15. [Google Scholar] [CrossRef]
- Perez, J.J. To what extent is the bipolar rheoencephalographic signal contaminated by scalp blood flow? A clinical study to quantify its extra and non-extracranial components. Biomed. Eng. Online 2014, 13, 1–11. [Google Scholar] [CrossRef] [PubMed]
- Perez, J.J.; Guijarro, E.; Sancho, J.; Navarre, A. Extraction of the Intracranial Component from the Rheoencephalographic Signal: A New Approach. In Proceedings of the 2006 International Conference of the IEEE Engineering in Medicine and Biology Society, New York, NY, USA, 30 August–3 September 2006; IEEE: Piscataway, NJ, USA, 2006; pp. 6064–6067. [Google Scholar]
- Pérez, J.J.; Guijarro, E.; Barcia, J.A. Quantification of intracranial contribution to rheoencephalography by a numerical model of the head. Clin. Neurophysiol. 2000, 111, 1306–1314. [Google Scholar] [CrossRef]
- Pincus, S.M.; Gladstone, I.M.; Ehrenkranz, R.A. A regularity statistic for medical data analysis. J. Clin. Monit. 1991, 7, 335–345. [Google Scholar] [CrossRef] [PubMed]
- Beckers, F.; Ramaekers, D.; Aubert, A.E. Approximate entropy of heart rate variability: Validation of methods and application in heart failure. Cardiovasc. Eng. An Int. J. 2001, 1, 177–182. [Google Scholar] [CrossRef]
- Li, X.; Yu, S.; Chen, H.; Lu, C.; Zhang, K.; Li, F. Cardiovascular autonomic function analysis using approximate entropy from 24-h heart rate variability and its frequency components in patients with type 2 diabetes. J. Diabetes Investig. 2015, 6, 227–235. [Google Scholar] [CrossRef]
- Burioka, N.; Miyata, M.; Cornélissen, G.; Halberg, F.; Takeshima, T.; Kaplan, D.T.; Suyama, H.; Endo, M.; Maegaki, Y.; Nomura, T.; et al. Approximate entropy in the electroencephalogram during wake and sleep. Clin. EEG Neurosci. 2005, 36, 21–24. [Google Scholar] [CrossRef]
- Lee, G.M.H.; Fattinger, S.; Mouthon, A.-L.; Noirhomme, Q.; Huber, R. Electroencephalogram approximate entropy influenced by both age and sleep. Front. Neuroinform. 2013, 7, 33. [Google Scholar] [CrossRef]
- Bruhn, J.; Röpcke, H.; Hoeft, A. Approximate entropy as an electroencephalographic measure of anesthetic drug effect during desflurane anesthesia. Anesthesiol. J. Am. Soc. Anesthesiol. 2000, 92, 715–726. [Google Scholar] [CrossRef]
- Richman, J.S.; Moorman, J.R. Physiological time-series analysis using approximate entropy and sample entropy. Am. J. Physiol. Circ. Physiol. 2000, 278, H2039–H2049. [Google Scholar] [CrossRef] [PubMed]
- Ahmadi, S.; Sepehri, N.; Wu, C.; Szturm, T. Sample Entropy of Human Gait Center of Pressure Displacement: A Systematic Methodological Analysis. Entropy 2018, 20, 579. [Google Scholar] [CrossRef]
- Wang, F.; Wang, H.; Fu, R. Real-Time ECG-based detection of fatigue driving using sample entropy. Entropy 2018, 20, 196. [Google Scholar] [CrossRef]
- Zhang, D.; Ding, H.; Liu, Y.; Zhou, C.; Ding, H.; Ye, D. Neurodevelopment in newborns: A sample entropy analysis of electroencephalogram. Physiol. Meas. 2009, 30, 491. [Google Scholar] [CrossRef] [PubMed]
- Montesinos, L.; Castaldo, R.; Pecchia, L. On the use of approximate entropy and sample entropy with centre of pressure time-series. J. Neuroeng. Rehabil. 2018, 15, 116. [Google Scholar] [CrossRef]
- Yentes, J.M.; Hunt, N.; Schmid, K.K.; Kaipust, J.P.; McGrath, D.; Stergiou, N. The appropriate use of approximate entropy and sample entropy with short data sets. Ann. Biomed. Eng. 2013, 41, 349–365. [Google Scholar] [CrossRef] [PubMed]
- Chen, W.; Wang, Z.; Xie, H.; Yu, W. Characterization of surface EMG signal based on fuzzy entropy. IEEE Trans. Neural Syst. Rehabil. Eng. 2007, 15, 266–272. [Google Scholar] [CrossRef]
- Simons, S.; Espino, P.; Abásolo, D. Fuzzy entropy analysis of the electroencephalogram in patients with Alzheimer’s disease: is the method superior to sample entropy? Entropy 2018, 20, 21. [Google Scholar] [CrossRef]
- Lu, S.; Chen, X.; Kanters, J.K.; Solomon, I.C.; Chon, K.H. Automatic Selection of the Threshold Value $ r $ for Approximate Entropy. IEEE Trans. Biomed. Eng. 2008, 55, 1966–1972. [Google Scholar]
- Liu, C.; Liu, C.; Shao, P.; Li, L.; Sun, X.; Wang, X.; Liu, F. Comparison of different threshold values r for approximate entropy: application to investigate the heart rate variability between heart failure and healthy control groups. Physiol. Meas. 2010, 32, 167. [Google Scholar] [CrossRef]
- Chon, K.H.; Scully, C.G.; Lu, S. Approximate entropy for all signals. IEEE Eng. Med. Biol. Mag. 2009, 28. [Google Scholar] [CrossRef] [PubMed]
- Restrepo, J.F.; Schlotthauer, G.; Torres, M.E. Maximum approximate entropy and r threshold: A new approach for regularity changes detection. Phys. A Stat. Mech. Appl. 2014, 409, 97–109. [Google Scholar] [CrossRef]
- Shannon, C.E. A mathematical theory of communication. Bell Syst. Tech. J. 1948, 27, 379–423. [Google Scholar] [CrossRef]
- Phung, D.Q.; Tran, D.; Ma, W.; Nguyen, P.; Pham, T. Using Shannon Entropy as EEG Signal Feature for Fast Person Identification. In Proceedings of the ESANN, Bruges, Belgium, 23–25 April 2014; Volume 4, pp. 413–418. [Google Scholar]
- Granero-Belinchon, C.; Roux, S.; Abry, P.; Doret, M.; Garnier, N. Information theory to probe intrapartum fetal heart rate dynamics. Entropy 2017, 19, 640. [Google Scholar] [CrossRef]
- Porta, A.; Baselli, G.; Liberati, D.; Montano, N.; Cogliati, C.; Gnecchi-Ruscone, T.; Malliani, A.; Cerutti, S. Measuring regularity by means of a corrected conditional entropy in sympathetic outflow. Biol. Cybern. 1998, 78, 71–78. [Google Scholar] [CrossRef]
- Guzzetti, S.; Mezzetti, S.; Magatelli, R.; Porta, A.; De Angelis, G.; Rovelli, G.; Malliani, A. Linear and non-linear 24 h heart rate variability in chronic heart failure. Auton. Neurosci. Basic Clin. 2000, 86, 114–119. [Google Scholar] [CrossRef]
- Faes, L.; Nollo, G.; Porta, A. Mechanisms of causal interaction between short-term RR interval and systolic arterial pressure oscillations during orthostatic challenge. J. Appl. Physiol. 2013, 114, 1657–1667. [Google Scholar] [CrossRef] [PubMed]
- Viola, A.U.; Tobaldini, E.; Chellappa, S.L.; Casali, K.R.; Porta, A.; Montano, N. Short-term complexity of cardiac autonomic control during sleep: REM as a potential risk factor for cardiovascular system in aging. PLoS ONE 2011, 6, e19002. [Google Scholar] [CrossRef] [PubMed]
- Pham, T.D.; Thang, T.C.; Oyama-Higa, M.; Sugiyama, M. Mental-disorder detection using chaos and nonlinear dynamical analysis of photoplethysmographic signals. Chaos Solitons Fractals 2013, 51, 64–74. [Google Scholar]
- Borowska, M. Entropy-based algorithms in the analysis of biomedical signals. Stud. Logic Gramm. Rhetor. 2015, 43, 21–32. [Google Scholar] [CrossRef]
- Porta, A.; Guzzetti, S.; Montano, N.; Pagani, M.; Somers, V.; Malliani, A.; Baselli, G.; Cerutti, S. Information domain analysis of cardiovascular variability signals: evaluation of regularity, synchronisation and co-ordination. Med. Biol. Eng. Comput. 2000, 38, 180–188. [Google Scholar] [CrossRef] [PubMed]
- Pincus, S.M.; Huang, W.-M. Approximate entropy: statistical properties and applications. Commun. Stat. Methods 1992, 21, 3061–3077. [Google Scholar] [CrossRef]
- Wolf, A.; Swift, J.B.; Swinney, H.L.; Vastano, J.A. Determining Lyapunov exponents from a time series. Phys. D Nonlinear Phenom. 1985, 16, 285–317. [Google Scholar] [CrossRef]
- Pincus, S.M.; Goldberger, A.L. Physiological time-series analysis: What does regularity quantify? Am. J. Physiol. Circ. Physiol. 1994, 266, H1643–H1656. [Google Scholar] [CrossRef] [PubMed]
- Castiglioni, P.; Di Rienzo, M. How the threshold “r” influences approximate entropy analysis of heart-rate variability. In Proceedings of the Computers in Cardiology, Bologna, Italy, 14–17 September 2008; pp. 561–564. [Google Scholar]
- Alcaraz, R.; Abásolo, D.; Hornero, R.; Rieta, J.J. Optimal parameters study for sample entropy-based atrial fibrillation organization analysis. Comput. Methods Programs Biomed. 2010, 99, 124–132. [Google Scholar] [CrossRef] [PubMed]
- Castiglioni, P.; Zurek, S.; Piskorski, J.; Kosmider, M.; Guzik, P.; Ce, E.; Rampichini, S.; Merati, G. Assessing sample entropy of physiological signals by the norm component matrix algorithm: Application on muscular signals during isometric contraction. In Proceedings of the 2013 35th Annual International Conference of the IEEE Engineering in Medicine and Biology Society (EMBC), Osaka, Japan, 3–7 July 2013; pp. 5053–5056. [Google Scholar]
- Lake, D.E.; Richman, J.S.; Griffin, M.P.; Moorman, J.R. Sample entropy analysis of neonatal heart rate variability. Am. J. Physiol. Integr. Comp. Physiol. 2002, 283, R789–R797. [Google Scholar] [CrossRef]
- Lewis, M.J.; Short, A.L. Sample entropy of electrocardiographic RR and QT time-series data during rest and exercise. Physiol. Meas. 2007, 28, 731. [Google Scholar] [CrossRef]
- Zadeh, L.A. Fuzzy sets. Inf. Control 1965, 8, 338–353. [Google Scholar] [CrossRef]
- Xie, H.-B.; Chen, W.-T.; He, W.-X.; Liu, H. Complexity analysis of the biomedical signal using fuzzy entropy measurement. Appl. Soft Comput. 2011, 11, 2871–2879. [Google Scholar] [CrossRef]
- Liu, C.; Zhao, L. Using fuzzy measure entropy to improve the stability of traditional entropy measures. In Proceedings of the Computing in Cardiology, Hangzhou, China, 18–21 September 2011; pp. 681–684. [Google Scholar]
- González, C.; Jensen, E.W.; Gambús, P.L.; Vallverdú, M. Poincaré plot analysis of cerebral blood flow signals: Feature extraction and classification methods for apnea detection. PLoS ONE 2018, 13, e0208642. [Google Scholar] [CrossRef]
- Montgomery, L.D.; Montgomery, R.W.; Guisado, R. Rheoencephalographic and electroencephalographic measures of cognitive workload: analytical procedures. Biol. Psychol. 1995, 40, 143–159. [Google Scholar] [CrossRef]
- Lovett, J.W.D.; Barchha, R.; Lee, R.S.; Little, M.H.; Watkinson, J.S. Acute effects of ECT on the cerebral circulation in man. A computerized study by cerebral impedance plethysmography. Eur. Neurol. 1974, 12, 47–62. [Google Scholar] [CrossRef] [PubMed]
- Porta, A.; Guzzetti, S.; Montano, N.; Furlan, R.; Pagani, M.; Malliani, A.; Cerutti, S. Entropy, entropy rate, and pattern classification as tools to typify complexity in short heart period variability series. IEEE Trans. Biomed. Eng. 2001, 48, 1282–1291. [Google Scholar] [CrossRef] [PubMed]
- Mayer, C.C.; Bachler, M.; Hörtenhuber, M.; Stocker, C.; Holzinger, A.; Wassertheurer, S. Selection of entropy-measure parameters for knowledge discovery in heart rate variability data. BMC Bioinform. 2014, 15, S2. [Google Scholar] [CrossRef] [PubMed]
- Bošković, A.; Lončar-Turukalo, T.; Japundžić-Žigon, N.; Bajić, D. The flip-flop effect in entropy estimation. In Proceedings of the 2011 IEEE 9th International Symposium on Intelligent Systems and Informatics, Subotica, Serbia, 8–10 September 2011; pp. 227–230. [Google Scholar]
- Aktaruzzaman, M.; Sassi, R. Parametric estimation of sample entropy in heart rate variability analysis. Biomed. Signal Process. Control 2014, 14, 141–147. [Google Scholar] [CrossRef]
- Cuesta-Frau, D.; Miro-Martinez, P.; Oltra-Crespo, S.; Varela-Entrecanales, M.; Aboy, M.; Novak, D.; Austin, D. Measuring body temperature time series regularity using approximate entropy and sample entropy. In Proceedings of the 2009 Annual International Conference of the IEEE Engineering in Medicine and Biology Society, Minneapolis, MN, USA, 3–6 September 2009; pp. 3461–3464. [Google Scholar]


| Signal Length (N) (Samples) | Embedding Dimension (m) | Filtering Level (r) | Quantization Intervals (ε) | Fuzzy Function Gradient (n) | |
|---|---|---|---|---|---|
| Shannon Entropy | 1000 to 4000 | 2 to 4 | - | 10 to 50 | - |
| Corrected Conditional Entropy | 1000 to 4000 | 2 to 4 * | - | 10 to 50 | - |
| Approximate Entropy | 1000 to 4000 | 2 to 4 | 0.05 to 0.3 | - | - |
| Sample Entropy | 1000 to 4000 | 2 to 4 | 0.05 to 0.3 | - | - |
| Fuzzy entropy | 1000 to 4000 | 2 to 4 | 0.05 to 0.3 | - | 2 to 10 |
| N = 1000 | N = 2000 | N = 3000 | N = 4000 | |
|---|---|---|---|---|
| ApEn | ||||
| m = 2 | 0.0044 | 0.0006 | 0.0006 | 0.0004 |
| m = 3 | 0.0131 | 0.0014 | 0.0013 | 0.0004 |
| m = 4 | 0.6379 | 0.4915 | 0.5376 | 0.3391 |
| SampEn | ||||
| m = 2 | 0.048 | 0.014 | 0.017 | 0.017 |
| m = 3 | 0.166 | 0.195 | 0.145 | 0.136 |
| m = 4 | 0.387 | 0.280 | 0.183 | 0.172 |
| FuzzyEn | ||||
| m = 2 | 0.00076 | 0.00013 | 0.00014 | 0.00012 |
| m = 3 | 0.00086 | 0.00018 | 0.00016 | 0.00014 |
| m = 4 | 0.00329 | 0.00042 | 0.00022 | 0.00021 |
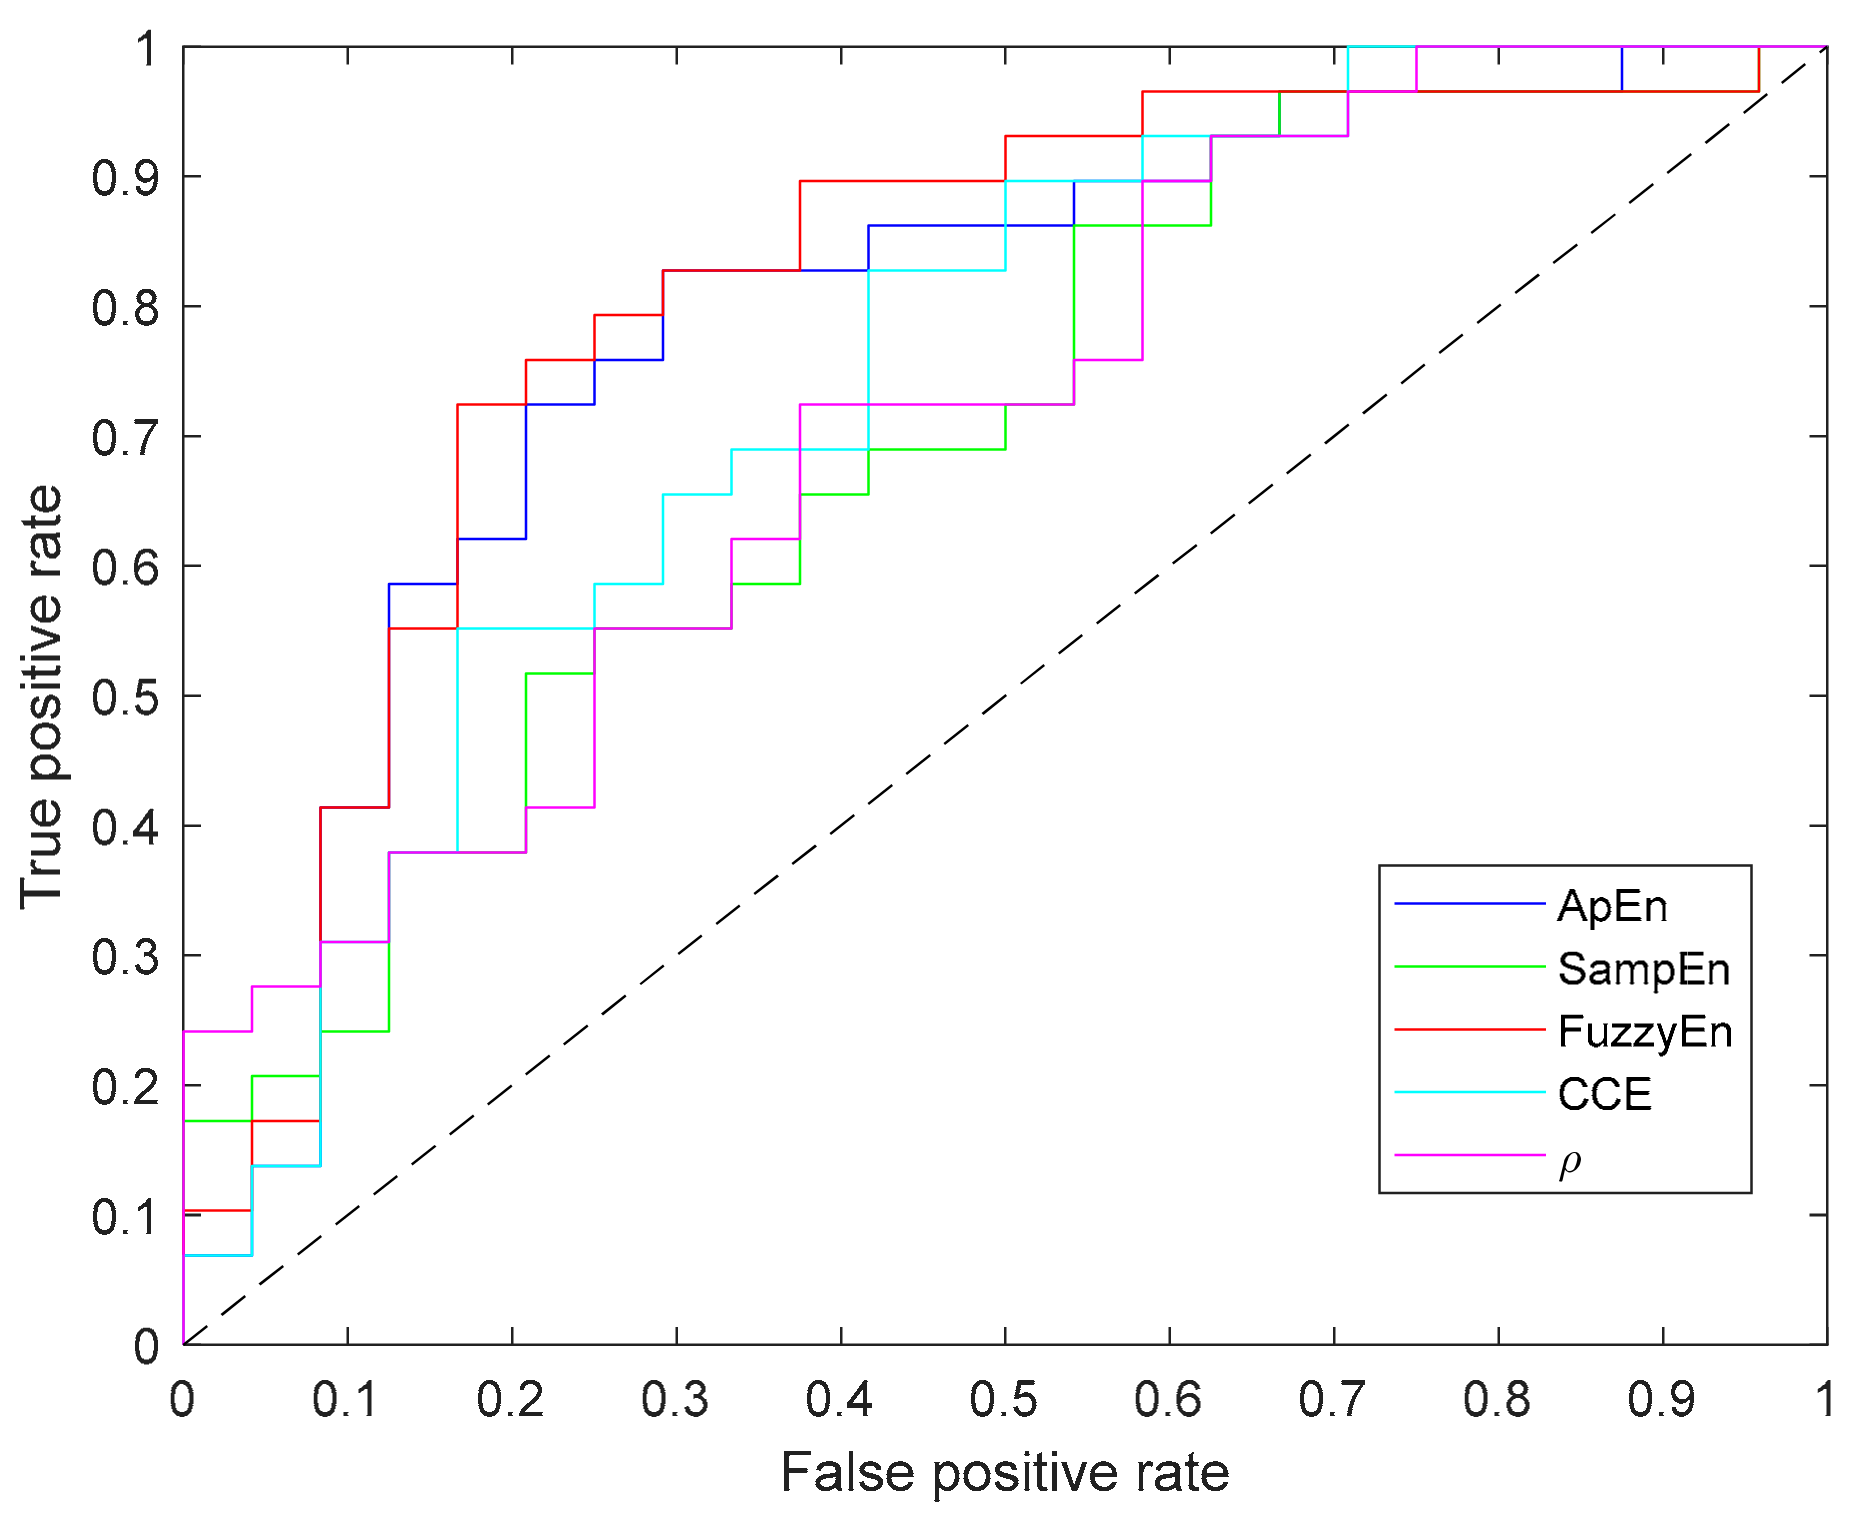
| Entropy Measure | Parameters | Apnea Mean ± std | Baseline Mean ± std | p-Value | AUC | acc (%) |
|---|---|---|---|---|---|---|
| ApEn | r = 0.25 m = 2 N = 2000 | 0.155 ± 0.045 | 0.118 ± 0.035 | 0.0003 | 0.789 | 69.8 |
| SampEn | r = 0.25 m = 2 N = 2000 | 0.111 ± 0.031 | 0.092 ± 0.022 | 0.0132 | 0.698 | 60.4 |
| FuzzyEn | r = 0.25 m = 2 N = 2000 n = 2 | 0.021 ± 0.009 | 0.015 ± 0.006 | 0.0001 | 0.809 | 69.8 |
| CCE | ε = 20 m = 2 N = 2000 | 0.581 ± 0.063 | 0.518 ± 0.075 | 0.0016 | 0.744 | 67.9 |
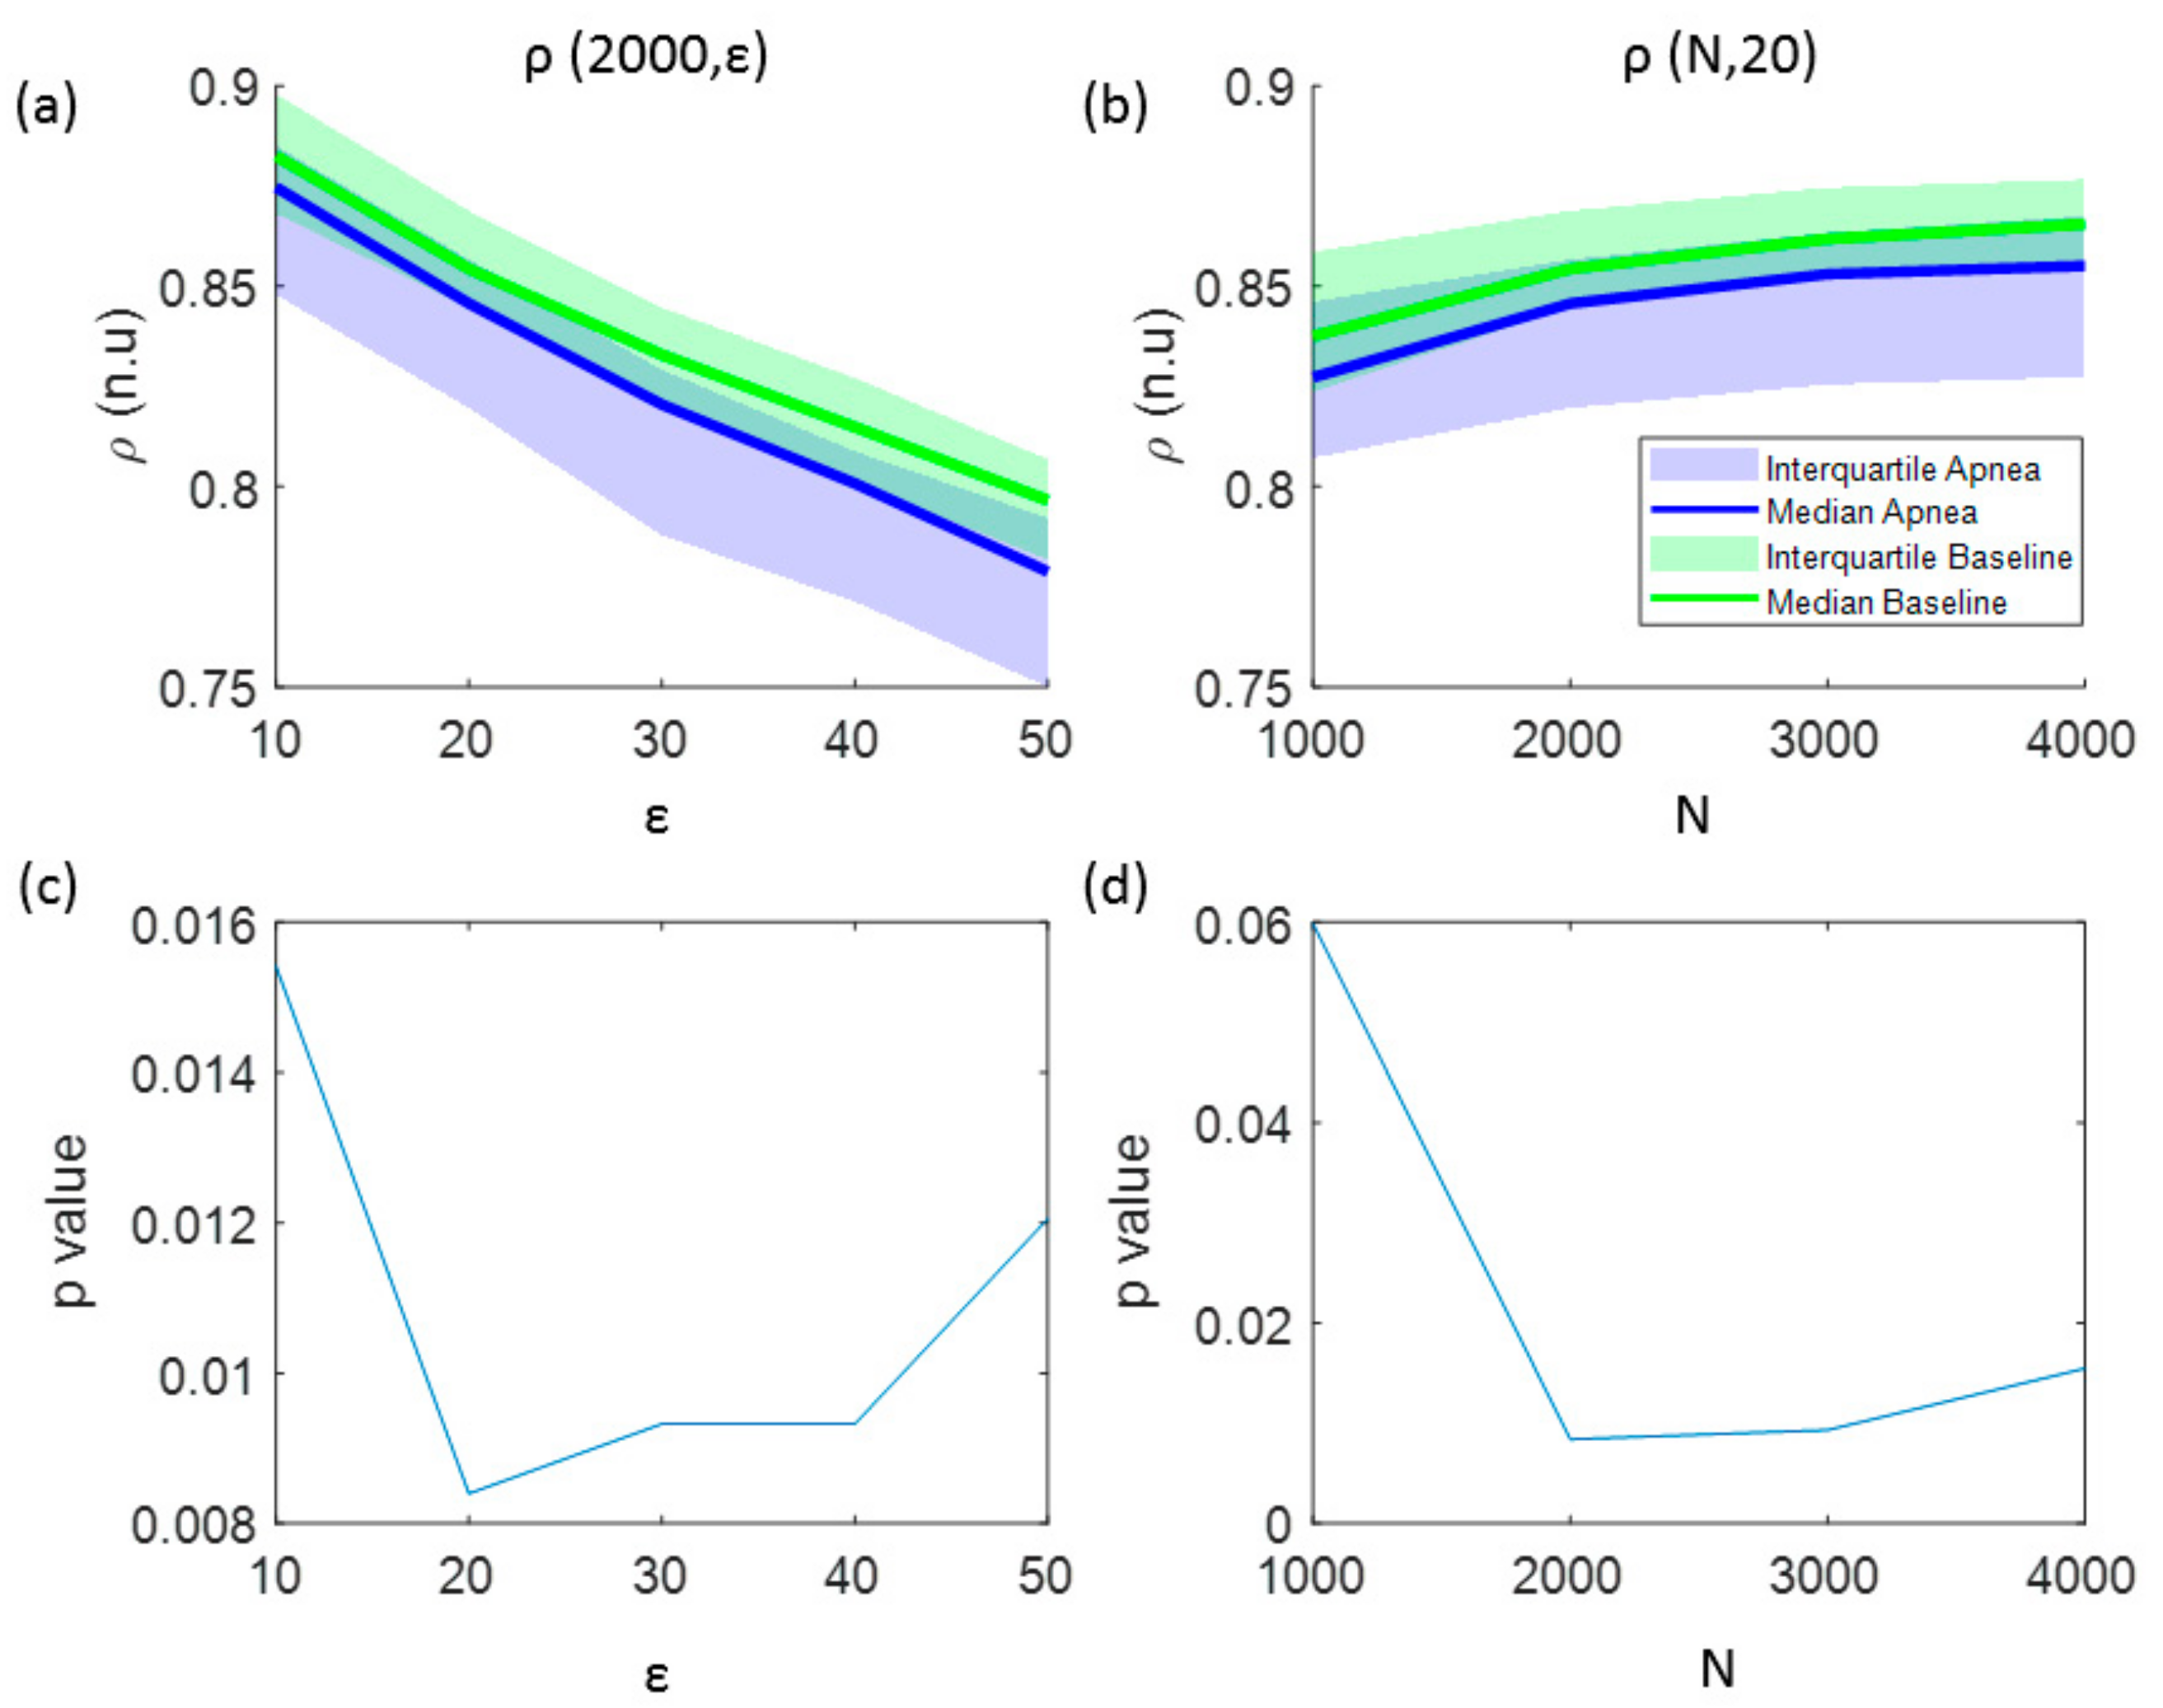
| ρ | ε = 20 N = 2000 | 0.838 ± 0.024 | 0.854 ± 0.017 | 0.0084 | 0.713 | 62.3 |
| Parameter | Units | Apnea Mean ± std | Baseline Mean ± std | p-Value |
|---|---|---|---|---|
| Max | Ω | 0.041 ± 0.014 | 0.045 ± 0.017 | 0.356 |
| Min | Ω | −0.051 ± 0.017 | −0.054 ± 0.018 | 0.523 |
| Range | Ω | 0.092 ± 0.028 | 0.099 ± 0.033 | 0.376 |
| Δtmax | samples | 238.7 ± 22.1 | 254.9 ± 43.2 | 0.084 |
| Δtmin | samples | 242.11 ± 23.2 | 248.6 ± 38.8 | 0.455 |
| Δtmin-max | samples | 52.88 ± 27.36 | 60.56 ± 24.76 | 0.217 |
| α | a.u. | 0.002 ± 0.001 | 0.002 ± 0.001 | 0.406 |
| Area | Ω.s | 12.453 ± 4.766 | 13.471 ± 4.856 | 0.446 |
| δmax | Ω/s | 0.006 ± 0.002 | 0.005 ± 0.002 | 0.272 |
| δrange | Ω/s | 0.007 ± 0.002 | 0.007 ± 0.002 | 0.145 |
© 2019 by the authors. Licensee MDPI, Basel, Switzerland. This article is an open access article distributed under the terms and conditions of the Creative Commons Attribution (CC BY) license (http://creativecommons.org/licenses/by/4.0/).
Share and Cite
González, C.; Jensen, E.; Gambús, P.; Vallverdú, M. Entropy Measures as Descriptors to Identify Apneas in Rheoencephalographic Signals. Entropy 2019, 21, 605. https://doi.org/10.3390/e21060605
González C, Jensen E, Gambús P, Vallverdú M. Entropy Measures as Descriptors to Identify Apneas in Rheoencephalographic Signals. Entropy. 2019; 21(6):605. https://doi.org/10.3390/e21060605
Chicago/Turabian StyleGonzález, Carmen, Erik Jensen, Pedro Gambús, and Montserrat Vallverdú. 2019. "Entropy Measures as Descriptors to Identify Apneas in Rheoencephalographic Signals" Entropy 21, no. 6: 605. https://doi.org/10.3390/e21060605
APA StyleGonzález, C., Jensen, E., Gambús, P., & Vallverdú, M. (2019). Entropy Measures as Descriptors to Identify Apneas in Rheoencephalographic Signals. Entropy, 21(6), 605. https://doi.org/10.3390/e21060605