
Cystatin M/E Ameliorates Multiple Myeloma-Induced Hyper Osteolytic Bone Resorption


 , ,
, , 
Simple Summary
Abstract
1. Introduction
2. Results
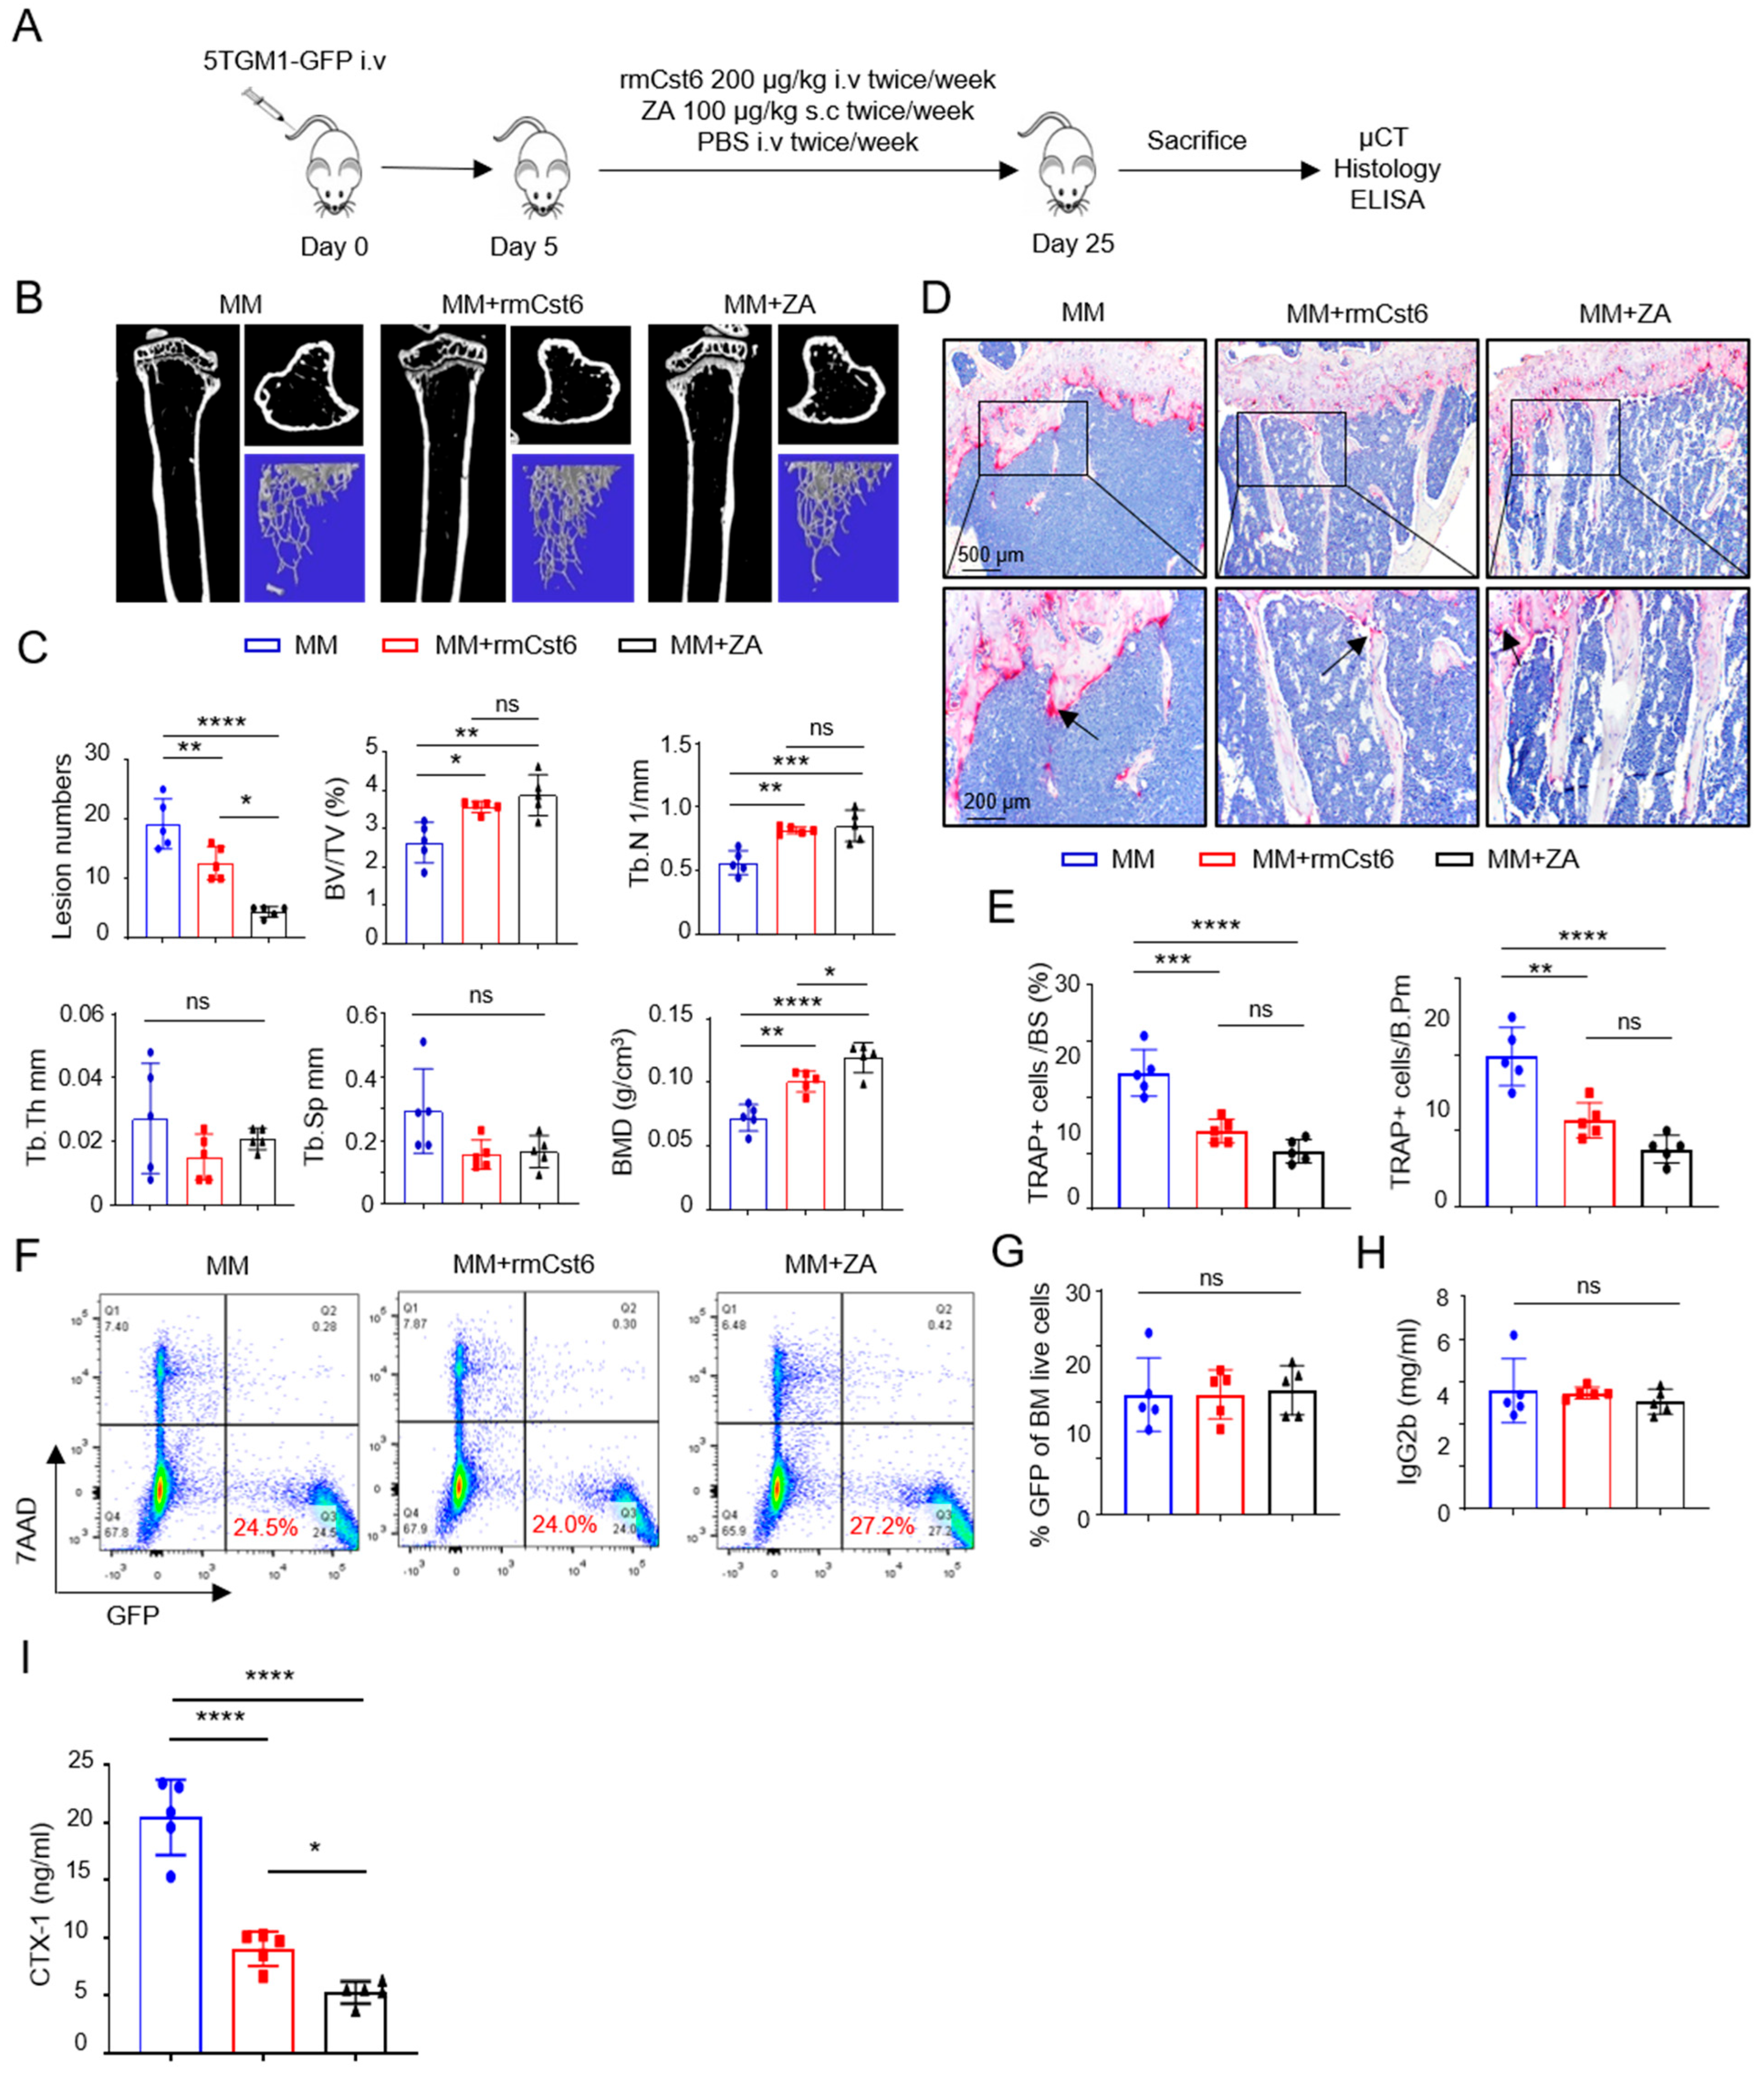
2.1. Evaluate rmCst6 Protein and ZA Inhibition in MM Cell-Induced Bone Resorption In Vivo
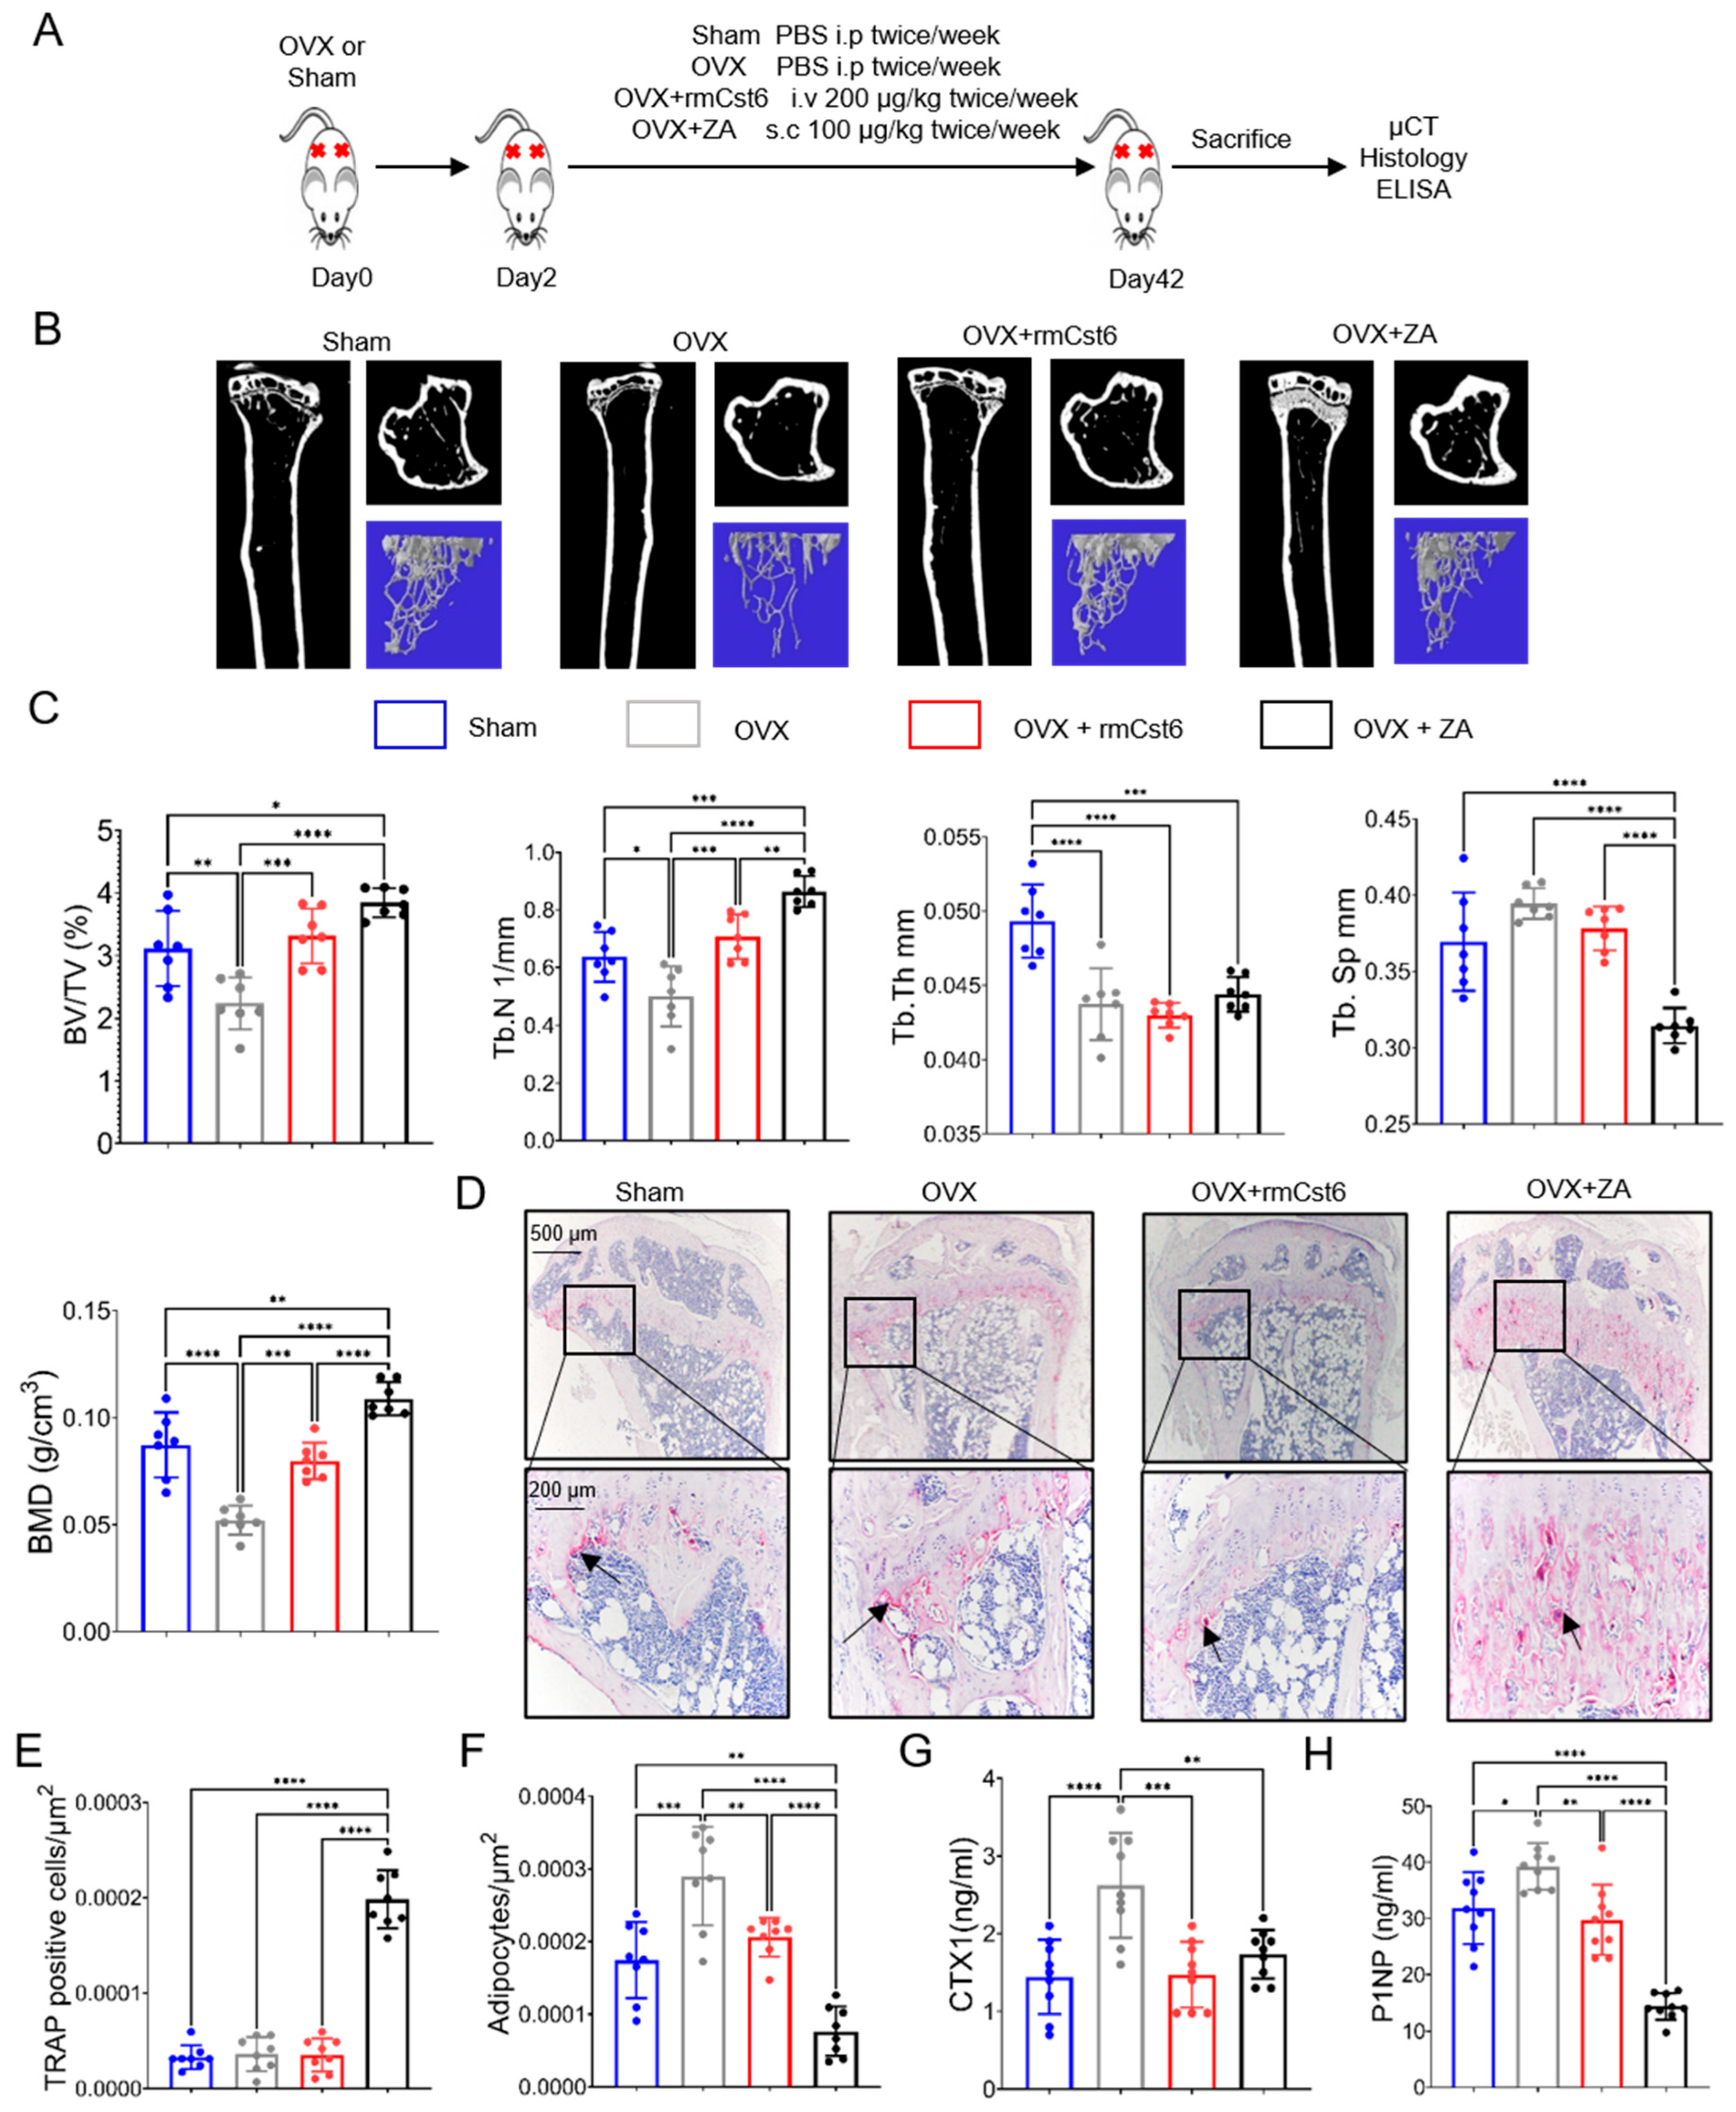
2.2. Evaluate rmCst6 Protein and ZA Effects in an Ovariectomized (OVX) Mouse Model
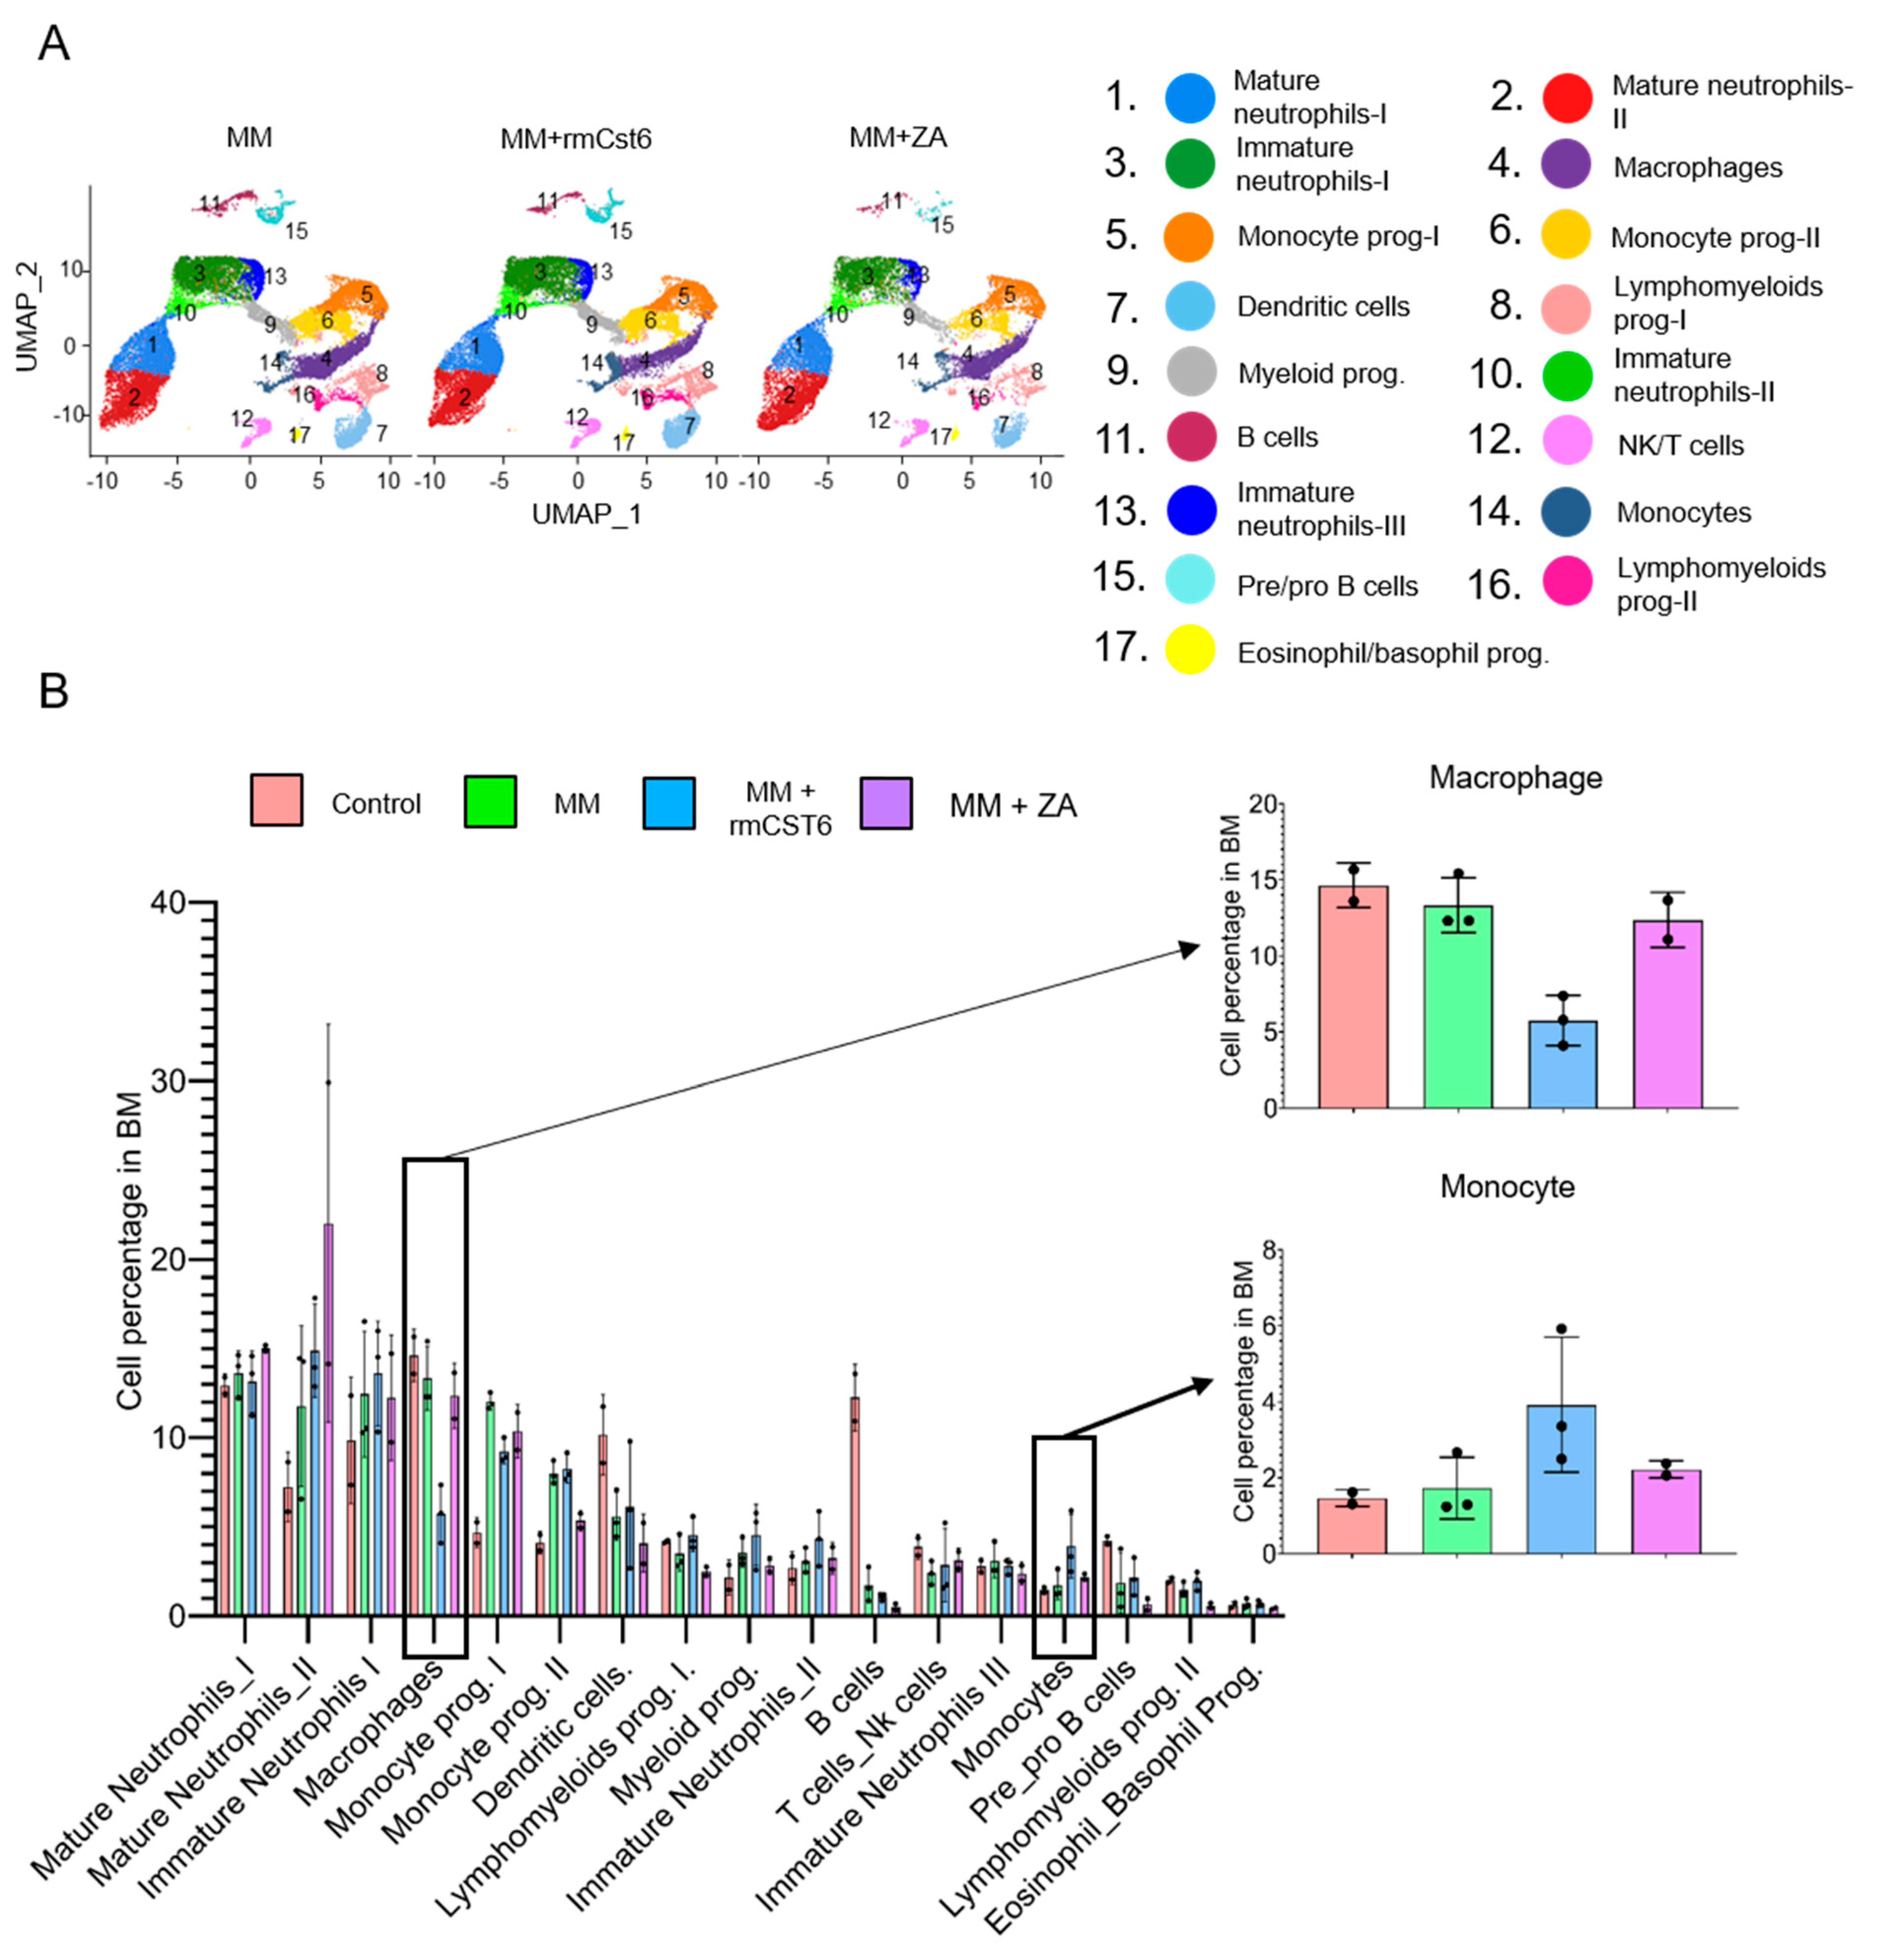
2.3. Cell Composition of MM Mouse Bone Marrow Is Altered by rmCst6 and ZA Treatment
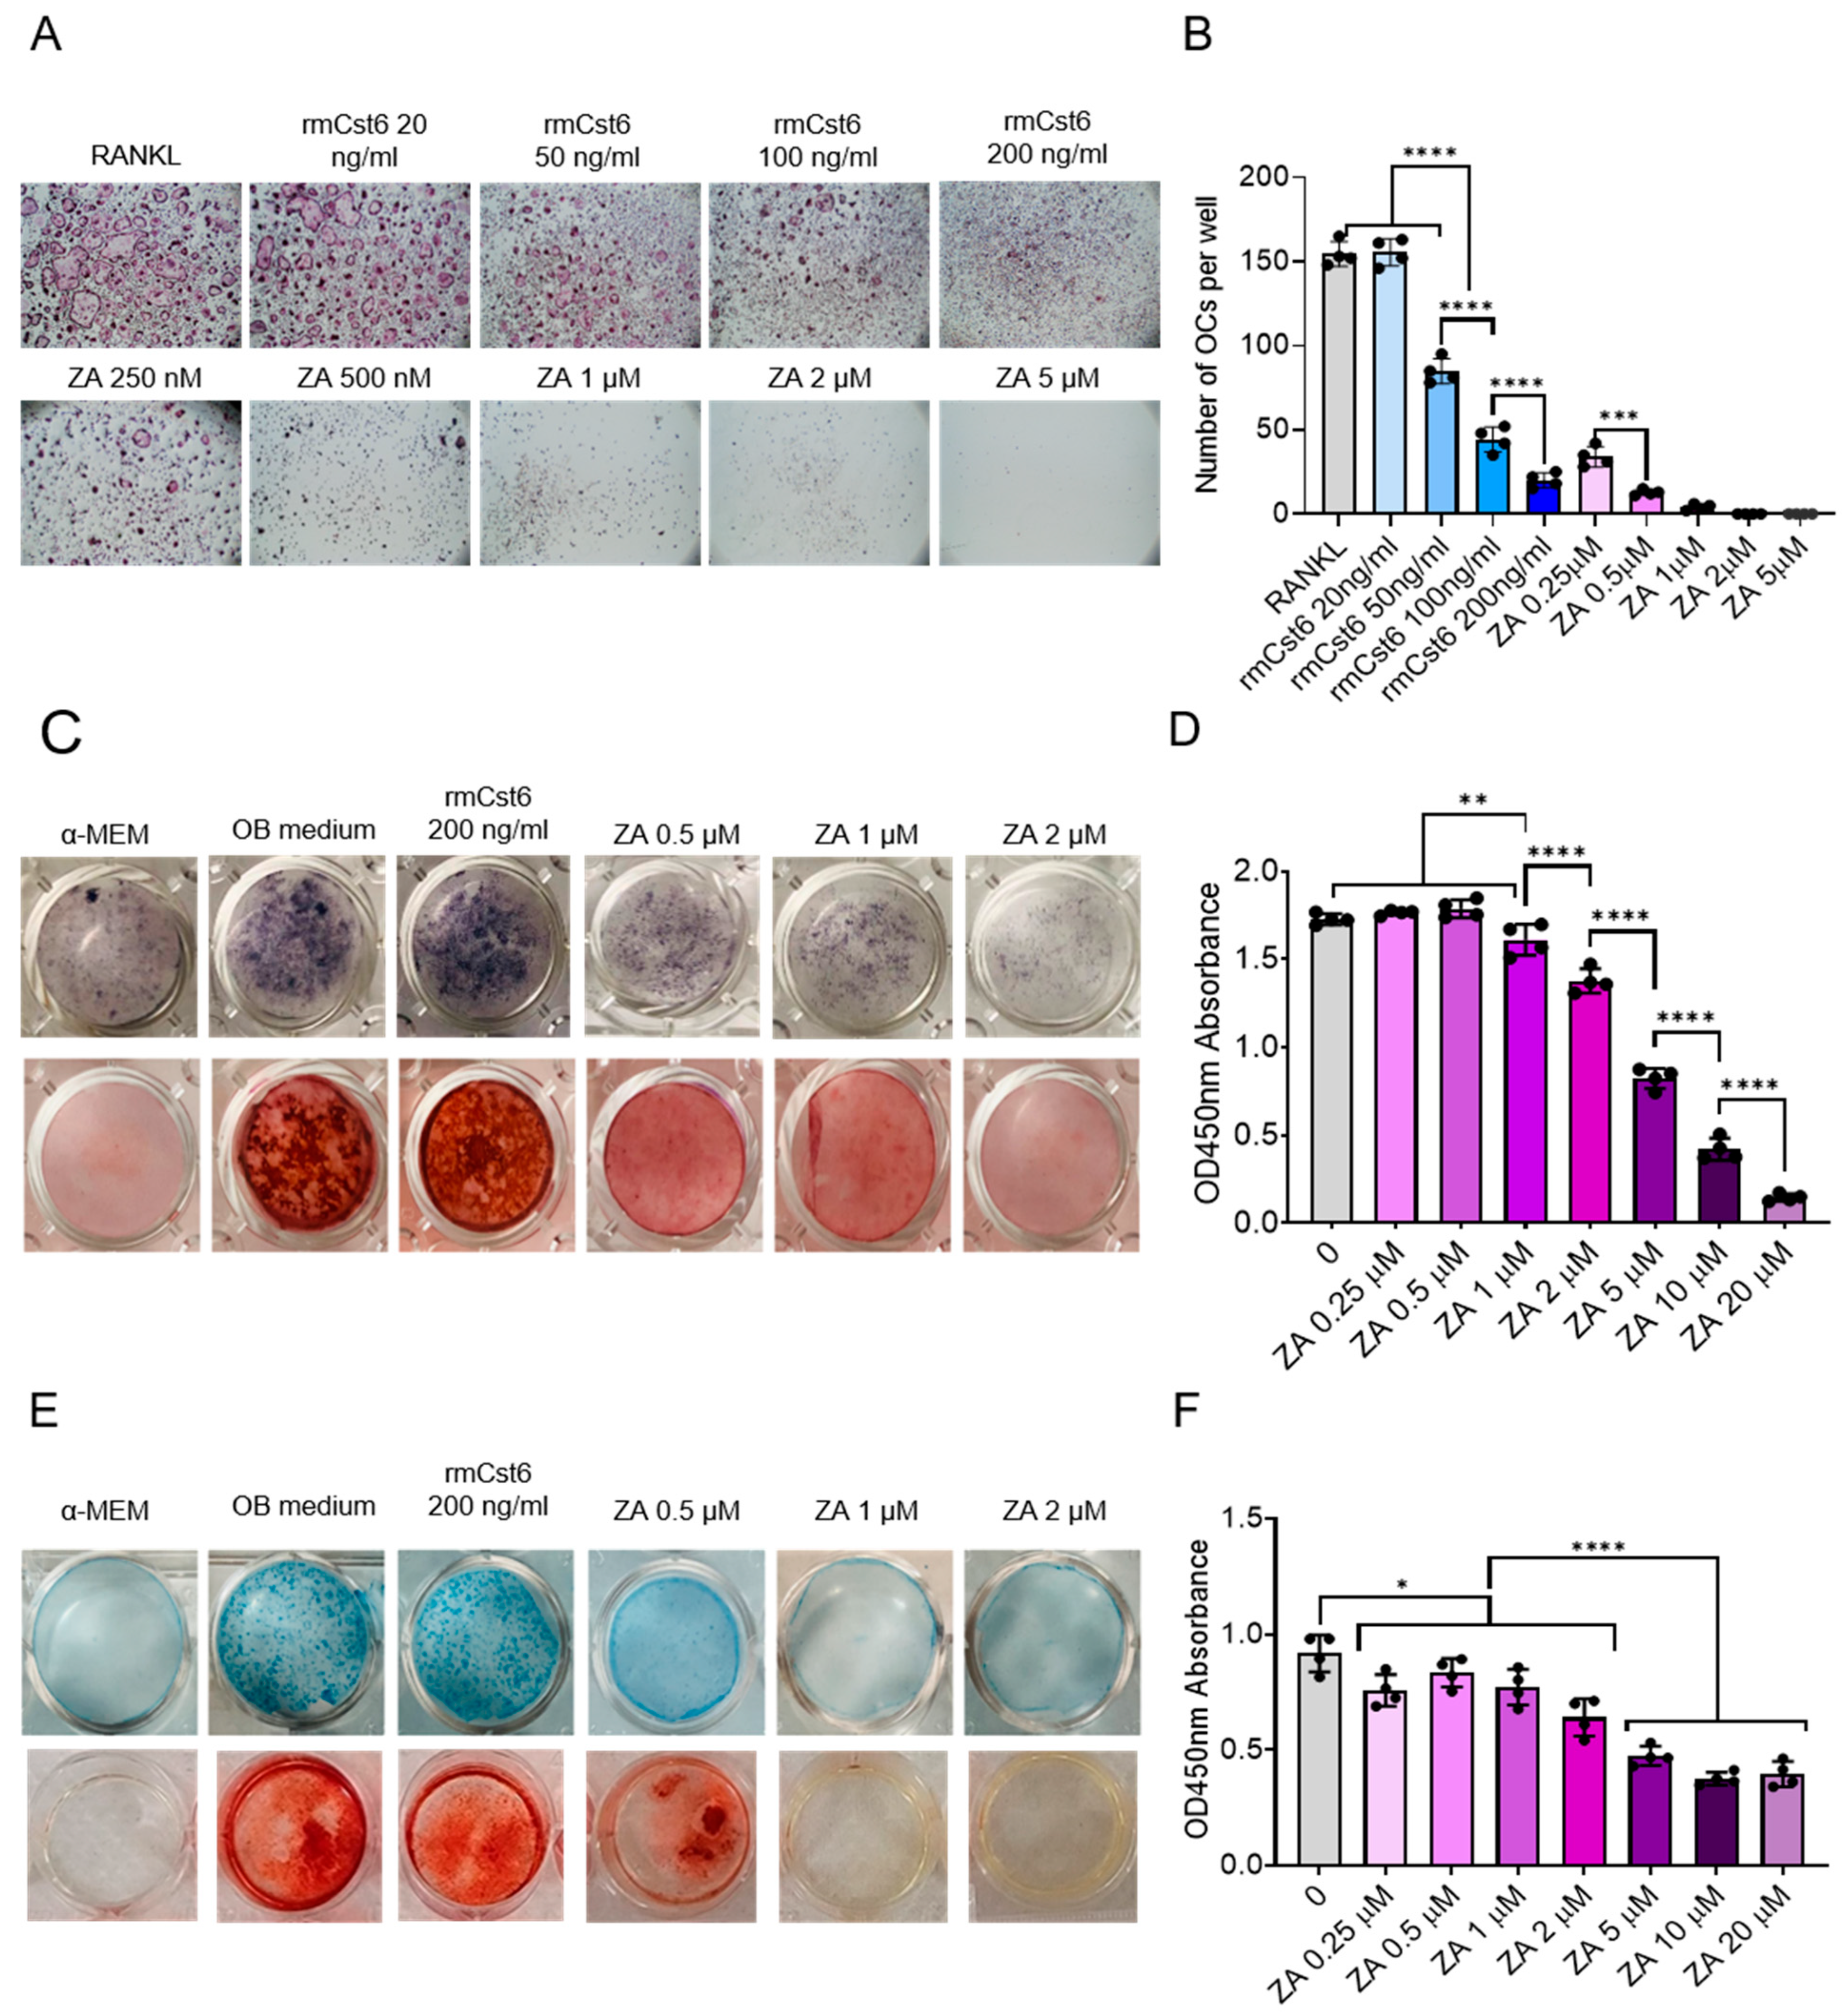
2.4. Effects of rmCST6 and ZA on the Viability and Differentiation of Osteoclasts, Osteoblasts, and Chondrocytes
2.5. rmCst6 and ZA Bring OVX-Induced Inflammatory Cytokine Levels Back to Control
2.6. ZA and rmCst6 Treatment Upregulate Different Genomic Pathways in Bone of OVX Mice
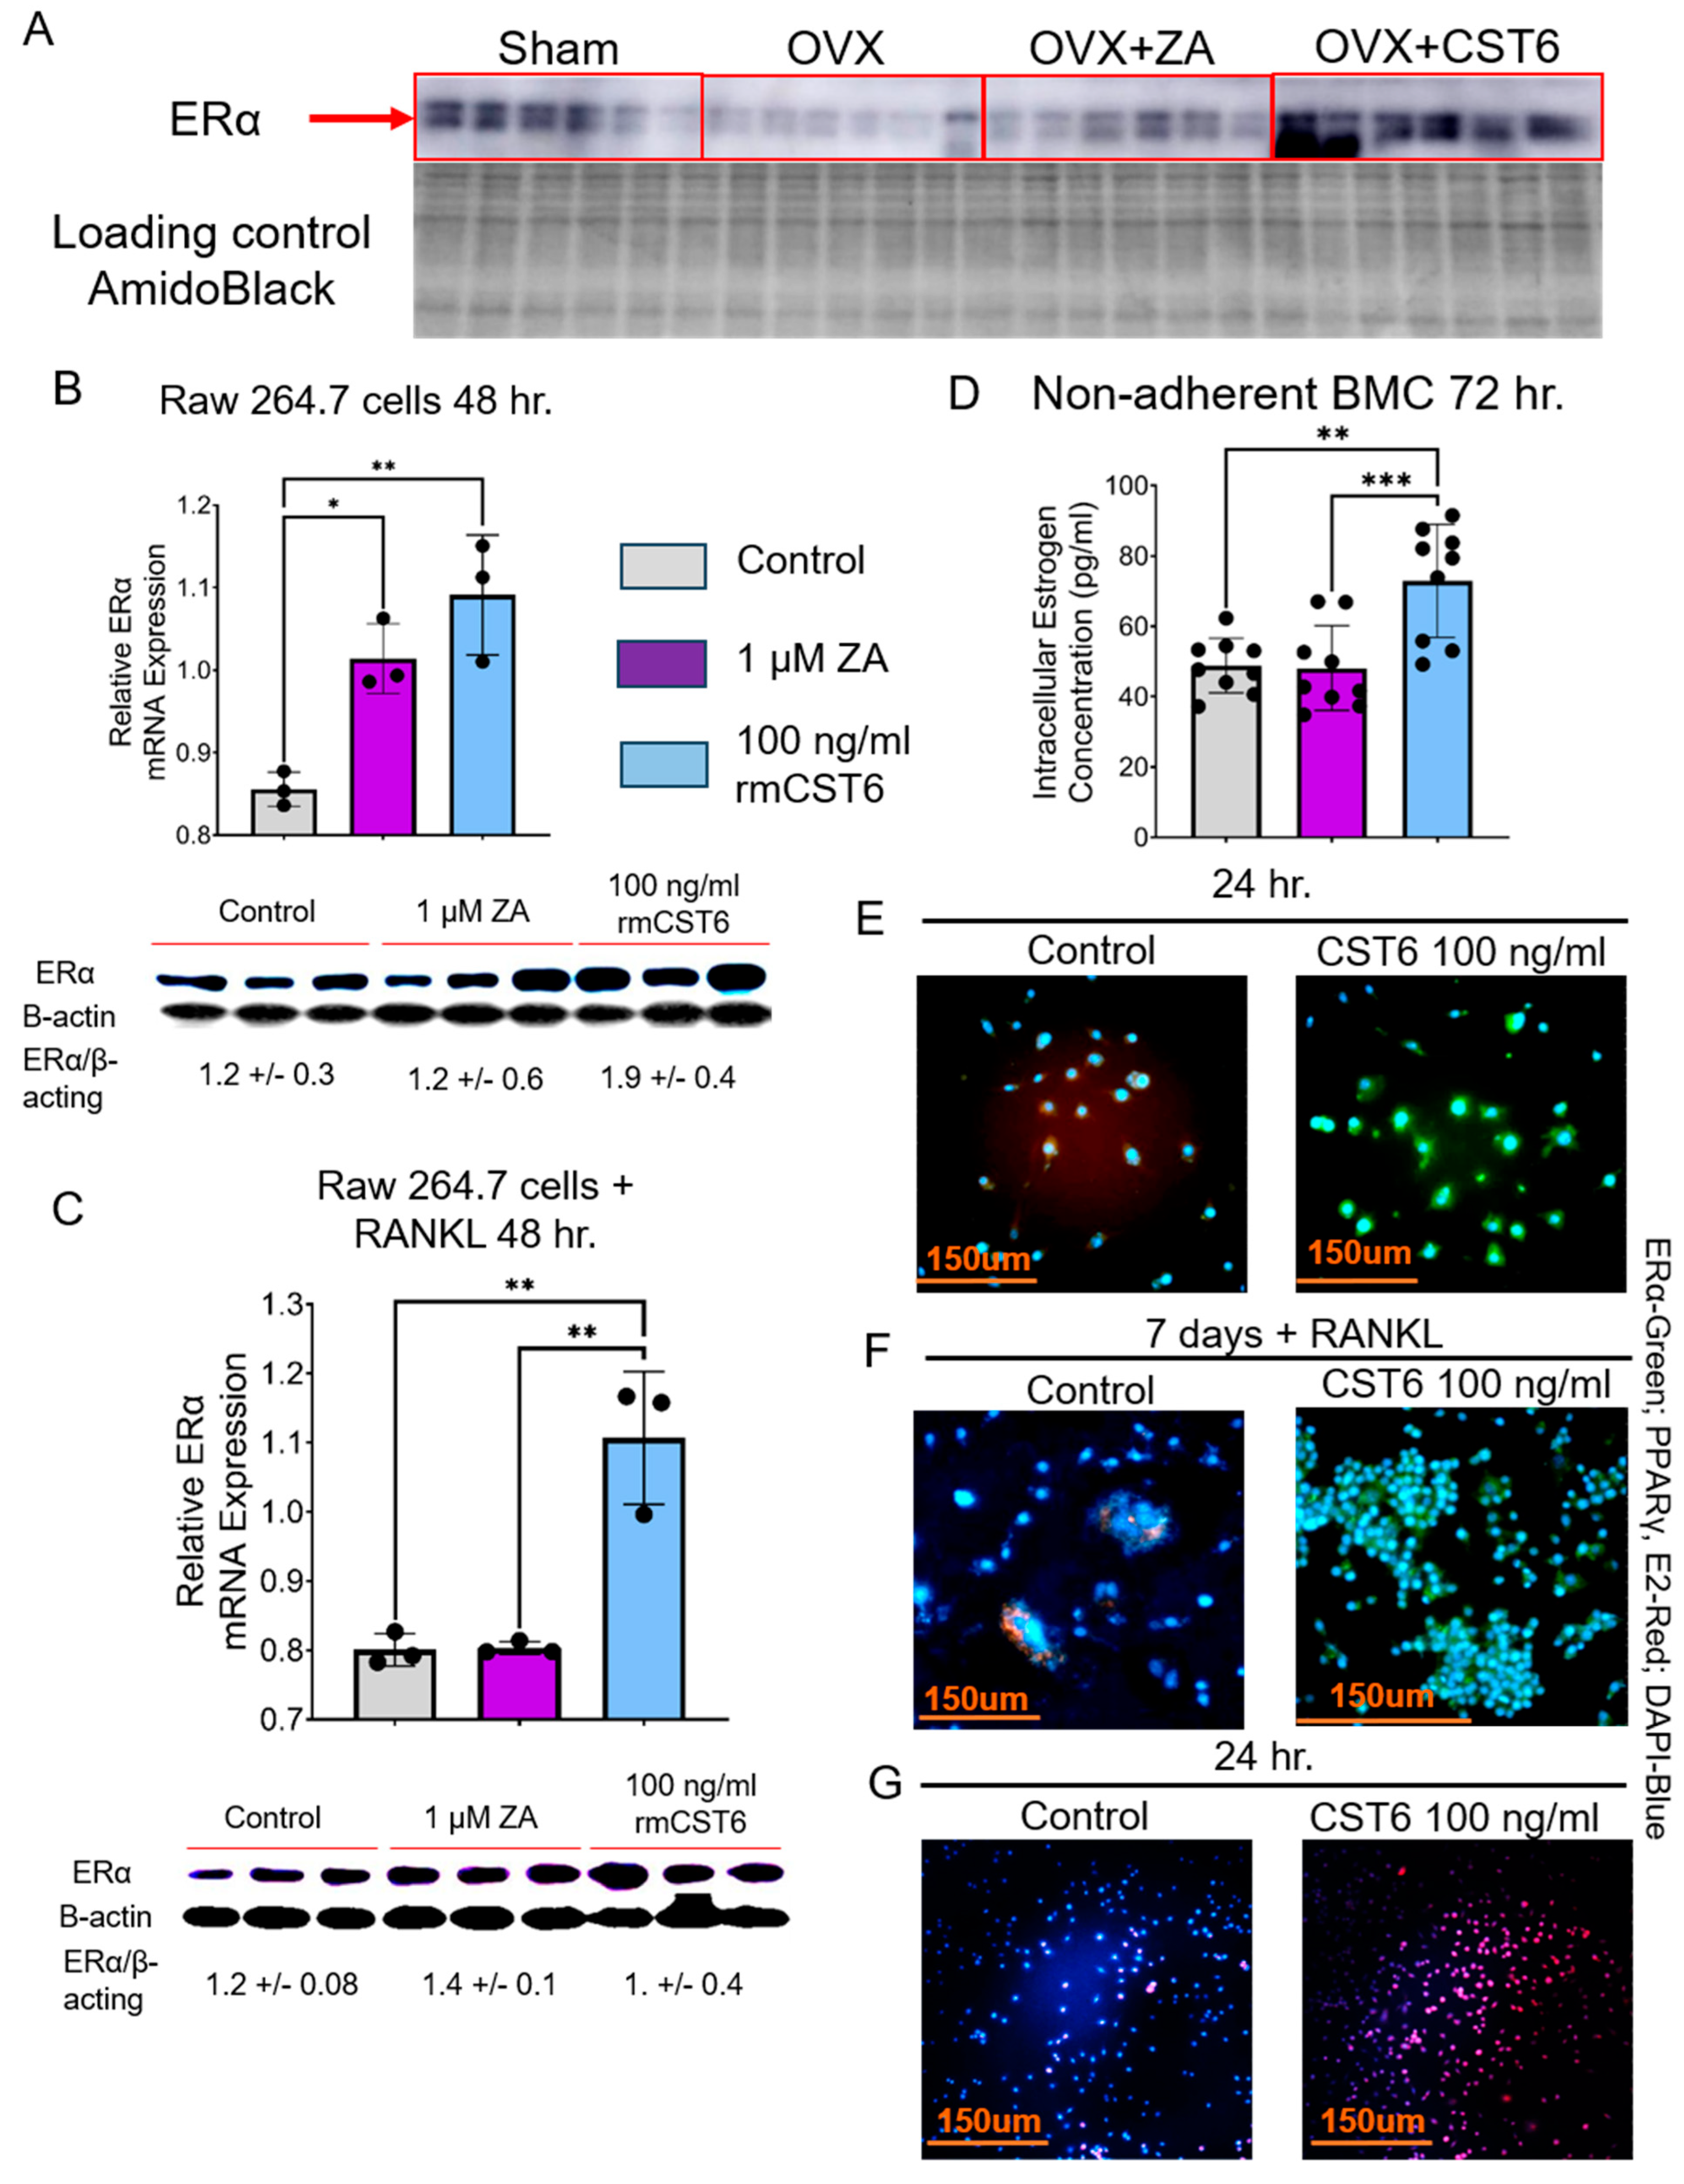
2.7. rmCst6 Treatment Increases Intracellular Estrogen Concentration of Osteoclast Precursors
3. Discussion
4. Material and Methods
4.1. Cell Cultures
4.2. 5TGM1/KaLwRij MM Mouse Model
4.3. Recombinant CST6 (rmCst6) Expression and Purification
4.4. Ovariectomy (OVX) Mouse Model
4.5. Micro-Computed Tomography (µCT)
4.6. Bone Histomorphometry
4.7. Evaluation of Intracellular Bone Turnover Markers and Estrogen Levels
4.8. Single Cell RNA Sequencing (scRNA-seq)
4.9. Bioinformatic Analysis of scRNA-seq
4.10. In Ex Vivo Osteoclast Differentiation
4.11. Osteoblast and Chondrocyte Precursor Histological Staining
4.12. Cell Counting Kit (CCK)-8 Assay
4.13. Cytokine Array
4.14. RNA Isolation, Real-Time Reverse Transcription-Polymerase Chain Reaction
4.15. Bone Tissue RNA Sequencing Analysis
4.16. Western Blots
4.17. Immunohistochemistry
4.18. Statistical Analysis
Supplementary Materials
Author Contributions
Funding
Institutional Review Board Statement
Informed Consent Statement
Data Availability Statement
Acknowledgments
Conflicts of Interest
References
- Kumar, S.K.; Rajkumar, V.; Kyle, R.A.; van Duin, M.; Sonneveld, P.; Mateos, M.; Gay, F.; Anderson, K.C. Multiple myeloma. Nat. Rev. Dis. Primers 2017, 3, 17046. [Google Scholar] [CrossRef]
- Roodman, G.D. Pathogenesis of myeloma bone disease. Leukemia 2009, 23, 435–441. [Google Scholar] [CrossRef]
- Tian, E.; Zhan, F.; Walker, R.; Rassmussen, E.; Ma, Y.; Barlogie, B.; Shaughnessy, J.D., Jr. The role of the wnt-signaling antagonist DKK1 in the development of osteolytic lesions in multiple myeloma. N. Engl. J. 2003, 349, 2483–2494. [Google Scholar] [CrossRef] [PubMed]
- Terpos, E.; Ntanasis-Stathopoulos, I.; Dimopoulos, M.A. Myeloma bone disease: From biology findings to treatment approaches. Blood 2019, 133, 1534–1539. [Google Scholar] [CrossRef] [PubMed]
- Pozzi, S.; Vallet, S.; Mukherjee, S.; Cirstea, D.; Vaghela, N.; Santo, L.; Rosen, E.; Ikeda, H.; Okawa, Y.; Kiziltepe, T.; et al. High-dose zoledronic acid impacts bone remodeling with effects on osteoblastic lineage and bone mechanical properties. Clin. Cancer Res. 2009, 15, 5829–5839. [Google Scholar] [CrossRef] [PubMed]
- Bone, H.G.; Hosking, D.; Devogelaer, J.P.; Tucci, J.R.; Emkey, R.D.; Tonino, R.P.; Rodriguez-Portales, J.A.; Downs, R.W.; Gupta, J.; Santora, A.C.; et al. Ten Years’ Experience with alendronate for osteoporosis in postmenopausal women. N. Engl. J. 2004, 350, 1189–1199. [Google Scholar] [CrossRef] [PubMed]
- Aapro, M.; Abrahamsson, P.A.; Body, J.J.; Coleman, R.E.; Colomer, R.; Costa, L.; Crinò, L.; Dirix, L.; Gnant, M.; Gralow, J.; et al. Guidance on the use of bisphosphonates in solid tumours: Recommendations of an international expert panel. Ann. Oncol. 2008, 19, 420–432. [Google Scholar] [CrossRef] [PubMed]
- Van Beek, E.; Pieterman, E.; Cohen, L.; Löwik, C.; Papapoulos, S. Farnesyl pyrophosphate synthase is the molecular target of nitrogen-containing bisphosphonates. Biochem. Biophys. Res. Commun. 1999, 264, 108–111. [Google Scholar] [CrossRef]
- Dunford, J.E.; Rogers, M.J.; Ebetino, F.H.; Phipps, R.J.; Coxon, F.P. Inhibition of protein prenylation by bisphosphonates causes sustained activation of Rac, CDC42, and Rho GTPases. J. Bone Miner. Res. 2006, 21, 684–694. [Google Scholar] [CrossRef]
- Huang, X.; Huang, S.; Guo, F.; Xu, F.; Cheng, P.; Ye, Y.; Dong, Y.; Xiang, W.; Chen, A. Dose-dependent inhibitory effects of zoledronic acid on osteoblast viability and function in vitro. Mol. Med. Rep. 2016, 13, 613. [Google Scholar] [CrossRef]
- Raje, N.; Woo, S.B.; Hande, K.; Yap, J.T.; Richardson, P.G.; Vallet, S.; Treister, N.; Hideshima, T.; Sheehy, N.; Chhetri, S.; et al. Clinical, radiographic, and biochemical characterization of multiple myeloma patients with osteonecrosis of the jaw. Clin. Cancer Res. 2008, 14, 2387–2395. [Google Scholar] [CrossRef] [PubMed]
- Terpos, E.; Roodman, G.D.; Dimopoulos, M.A. Optimal use of bisphosphonates in patients with multiple myeloma. Blood 2013, 121, 3325–3328. [Google Scholar] [CrossRef] [PubMed]
- Terpos, E.; Ntanasis-Stathopoulos, I.; Gavriatopoulou, M.; Dimopoulos, M.A. Pathogenesis of bone disease in multiple myeloma: From bench to bedside. Blood Cancer J. 2018, 8, 7. [Google Scholar] [CrossRef] [PubMed]
- Paton-Hough, J.; Tazzyman, S.; Evans, H.; Lath, D.; Down, J.M.; Green, A.C.; Snowden, J.A.; Chantry, A.D.; Lawson, M.A. Preventing and repairing myeloma bone disease by combining conventional antiresorptive treatment with a bone anabolic agent in murine models. JBMR 2019, 34, 783. [Google Scholar] [CrossRef] [PubMed]
- Nyman, J.S.; Merkel, A.R.; Uppuganti, S.; Nayak, B.; Rowland, B.; Makowski, A.J.; Oyajobi, B.O.; Sterling, J.A. Combined treatment with a transforming growth factor beta inhibitor (1D11) and bortezomib improves bone architecture in a mouse model of myeloma-induced bone disease. Bone 2016, 91, 81–91. [Google Scholar] [CrossRef] [PubMed]
- Gai, D.; Chen, J.R.; Stewart, J.P.; Nookaew, I.; Habelhah, H.; Ashby, C.; Sun, F.; Cheng, Y.; Li, C.; Xu, H.; et al. CST6 suppresses osteolytic bone disease in multiple myeloma by blocking osteoclast differentiation. J. Clin. Investig. 2022, 132, 159527. [Google Scholar] [CrossRef]
- Li, X.; Liang, Y.; Lian, C.; Peng, F.; Xiao, Y.; He, Y.; Ma, C.; Yang, Y.; Zhang, P.; Deng, Y.; et al. CST6 protein and peptides inhibit breast cancer bone metastasis by suppressing CTSB activity and osteoclastogenesis. Theranostics 2021, 11, 9821. [Google Scholar] [CrossRef]
- Ko, E.; Park, S.E.; Cho, E.Y.; Kim, Y.; Hwang, J.A.; Lee, Y.S.; Nam, S.J.; Bang, S.; Park, J. Cystatin M loss is associated with the losses of estrogen receptor, progesterone receptor, and HER4 in invasive breast cancer. Breast Cancer Res. 2010, 12, R100. [Google Scholar] [CrossRef] [PubMed]
- Tsukasaki, M.; Huynh, N.C.; Okamoto, K.; Muro, R.; Terashima, A.; Kurikawa, Y.; Komatsu, N.; Pluemsakunthai, W.; Nitta, T.; Abe, T.; et al. Stepwise cell fate decision pathways during osteoclastogenesis at single-cell resolution. Nat. Metab. 2020, 2, 1382–1390. [Google Scholar] [CrossRef] [PubMed]
- Kalish, S.; Lyamina, S.; Manukhina, E.; Malyshev, Y.; Raetskaya, A.; Malyshev, I. M3 macrophages stop division of tumor cells in vitro and extend survival of mice with ehrlich ascites carcinoma. Med. Sci. Monit. Basic Res. 2017, 23, 8. [Google Scholar] [CrossRef]
- Newton, P.T.; Staines, K.A.; Spevak, L.; Boskey, A.L.; Teixeira, C.C.; Macrae, V.E.; Canfield, A.E.; Farquharson, C. Chondrogenic ATDC5 cells: An optimized model for rapid and physiological matrix mineralization. Int. J. Mol. Med. 2012, 30, 1187. [Google Scholar] [CrossRef]
- Tai, T.W.; Chen, C.Y.; Su, F.C.; Tu, Y.K.; Tsai, T.T.; Lin, C.F.; Jou, I.M. Reactive oxygen species are required for zoledronic acid-induced apoptosis in osteoclast precursors and mature osteoclast-like cells. Sci. Rep. 2017, 7, 44245. [Google Scholar] [CrossRef] [PubMed]
- Chen, Y.; Wang, W.; Liu, F.; Tang, L.; Tang, R.; Li, W. Apoptotic effect of matrix metalloproteinases 9 in the development of diabetic retinopathy. Int. J. Clin. Exp. Pathol. 2015, 8, 10452. [Google Scholar]
- Lee, W.; Glaeser, H.; Smith, L.H.; Roberts, R.L.; Moeckel, G.W.; Gervasini, G.; Leake, B.F.; Kim, R.B. Polymorphisms in human organic anion-transporting polypeptide 1A2 (OATP1A2): Implications for altered drug disposition and central nervous system drug entry. J. Biol. Chem. 2005, 280, 9610–9617. [Google Scholar] [CrossRef] [PubMed]
- Leuthold, S.; Hagenbuch, B.; Mohebbi, N.; Wagner, C.A.; Meier, P.J.; Steiger, B. Mechanisms of pH-gradient driven transport mediated by organic anion polypeptide transporters. Am. J. Physiol. Cell Physiol. 2009, 296, 570–582. [Google Scholar] [CrossRef] [PubMed]
- Cho, E.; Montgomery, R.B.; Mostaghel, E.A. Minireview: SLCO and ABC transporters: A role for steroid transport in prostate cancer progression. Endocrinology 2014, 155, 4124. [Google Scholar] [CrossRef] [PubMed]
- Norton, A.; Thieu, K.; Baumann, C.W.; Lowe, D.A.; Mansky, K.C. Estrogen regulation of myokines that enhance osteoclast differentiation and activity. Sci. Rep. 2022, 12, 15900. [Google Scholar] [CrossRef] [PubMed]
- Streicher, C.; Heyny, A.; Andrukhova, O.; Haigl, B.; Slavic, S.; Schüler, C.; Kollman, K.; Kanter, I.; Sexl, V.; Kleiter, M. Estrogen regulates bone turnover by targeting RANKL expression in bone lining cells. Sci. Rep. 2017, 7, 6460. [Google Scholar] [CrossRef] [PubMed]
- Gavali, S.; Gupta, M.K.; Daswani, B.; Wani, M.R.; Sirdeshmukh, R.; Khatkhatay, M.I. Estrogen enhances human osteoblast survival and function via promotion of autophagy. BBA—Mol. Cell Res. 2019, 1866, 1498–1507. [Google Scholar] [CrossRef]
- Matsumoto, Y.; Otsuka, F.; Takano, M.; Mukai, T.; Yamanaka, R.; Takeda, M.; Miyoshi, T.; Inagaki, K.; Sada, K.E.; Makino, H. Estrogen and glucocorticoid regulate osteoblast differentiation through the interaction of bone morphogenetic protein-2 and tumor necrosis factor-α in C2C12 cells. Mol. Cell. Endocrinol. 2010, 325, 118–127. [Google Scholar] [CrossRef] [PubMed]
- Mohamad, N.V.; Ima-Nirwana, S.; Chin, K.Y. Are oxidative stress and inflammation mediators of bone loss due to estrogen deficiency? A review of current evidence. Endocr. Metab. Immune Disord. Drug Targets 2020, 20, 1478–1487. [Google Scholar] [CrossRef]
- Baek, K.H.; Oh, K.W.; Lee, W.Y.; Lee, S.S.; Kim, M.K.; Kwon, H.S.; Rhee, E.J.; Han, J.H.; Song, K.H.; Cha, B.Y.; et al. Association of oxidative stress with postmenopausal osteoporosis and the effects of hydrogen peroxide on osteoclast formation in human bone marrow cell cultures. Calcif. Tissue Int. 2010, 87, 226–235. [Google Scholar] [CrossRef]
- Giannoni, E.; Guignard, L.; Knaup Reymond, M.; Perreau, M.; Roth-Kleiner, M.; Calandra, T.; Roger, T. Estradiol and progesterone strongly inhibit the innate immune response of mononuclear cells in newborns. Infect. Immun. 2011, 79, 2690–2698. [Google Scholar] [CrossRef] [PubMed]
- Dou, C.E.; Ding, N.; Zhao, C.; Hou, T.; Kang, F.; Cao, Z.; Liu, C.; Bai, Y.; Dai, Q.; Ma, Q.; et al. Estrogen deficiency-mediated M2 macrophage osteoclastogenesis contributes to M1/M2 ratio alteration in ovariectomized osteoporotic mice. J. Bone Miner. Res. 2017, 33, 899–908. [Google Scholar] [CrossRef] [PubMed]
- Magister, Š.; Kos, J. Cystatins in immune system. J. Cancer 2013, 4, 45–46. [Google Scholar] [CrossRef]
- Redza-Dutordoir, M.; Averill-Bates, D.A. Activation of apoptosis signaling pathways by reactive oxygen species. BBA—Mol. Cell Res. 2016, 1863, 2977–2992. [Google Scholar]
- Yang, K.; Wu, Y.; Cheng, P.; Zhang, J.; Yang, C.; Pi, B.; Ye, Y.; You, H.; Chen, A.; Xu, T.; et al. YAP and ERK mediated mechanical strain-induced cell cycle progression through RhoA and cytoskeletal dynamics in rat growth plate chondrocytes. J. Orthop. Res. 2016, 34, 1121–1129. [Google Scholar] [CrossRef] [PubMed]
- Singhatanadgit, W.; Hankamolsiri, W.; Janvikul, W. Geranylgeraniol prevents zoledronic acid-mediated reduction of viable mesenchymal stem cells via induction of Rho-dependent YAP activation. R. Soc. Open Sci. 2021, 8, 202066. [Google Scholar] [CrossRef]
- Lei, Z.; Xiaoying, Z.; Xingguo, L. Ovariectomy-associated changes in bone mineral density and bone marrow haematopoiesis in rats. Int. J. Exp. Pathol. 2009, 90, 512–519. [Google Scholar] [CrossRef]
- Homma, H.; Kurachi, H.; Nishio, Y.; Takeda, T.; Yamamoto, T.; Adachi, K.; Morishige, K.; Ohmichi, M.; Matsuzawa, Y.; Murata, Y. Estrogen suppresses transcription of lipoprotein lipase gene: Existence of a unique estrogen response element on the lipoprotein lipase promoter. J. Biol. Chem. 2000, 275, 11404–11411. [Google Scholar] [CrossRef] [PubMed]
- An, J.; Ribeiro, R.C.; Webb, P.; Gustafsson, J.A.; Kushner, P.J.; Baxter, J.D.; Leitman, D.C. Estradiol repression of tumor necrosis factor-α transcription requires estrogen receptor activation function-2 and is enhanced by coactivators. Proc. Natl. Acad. Sci. USA 1999, 96, 15161–15166. [Google Scholar] [CrossRef]
- Dragin, N.; Nancy, P.; Villegas, J.; Roussin, R.; Le Panse, R.; Berrih-Aknin, S. Balance between estrogens and proinflammatory cytokines regulates chemokine production involved in thymic germinal center formation. Sci. Rep. 2017, 7, 7970. [Google Scholar] [CrossRef] [PubMed]
- Figueira, M.I.; Correia, S.; Vaz, C.V.; Cardoso, H.J.; Gomes, I.M.; Marques, R.; Maia, C.J.; Socorro, S. Estrogens down-regulate the stem cell factor (SCF)/c-KIT system in prostate cells: Evidence of antiproliferative and proapoptotic effects. Biochem. Pharmacol. 2016, 99, 73–87. [Google Scholar] [CrossRef] [PubMed]
- Arun, M.Z.; Reel, B.; Sala-Newby, G.B.; Bond, M.; Tsaousi, A.; Maskell, P.; Newby, A.C. Zoledronate upregulates MMP-9 and -13 in rat vascular smooth muscle cells by inducing oxidative stress. Drug Des. Devel Ther. 2016, 10, 1453. [Google Scholar] [CrossRef] [PubMed]
- Kuroshima, S.; Go, V.A.A.; Yamashita, J. Increased numbers of nonattached osteoclasts after long-term zoledronic acid therapy in mice. Endocrinology 2012, 153, 17. [Google Scholar] [CrossRef]
- Richardson, H.; Ho, V.; Pasquet, R.; Singh, R.J.; Goetz, M.P.; Tu, D.; Goss, P.E.; Ingle, J.N. Baseline estrogen levels in postmenopausal women participating in the MAP.3 breast cancer chemoprevention trial. Menopause 2020, 27, 693–700. [Google Scholar] [CrossRef] [PubMed]
- Sellitto, A.; D’Agostino, Y.; Alexandrova, E.; Lamberti, J.; Pecoraro, G.; Memoli, D.; Rocco, D.; Coviello, E.; Giurato, G.; Nassa, G.; et al. Insights into the Role of Estrogen Receptor β in Triple-Negative Breast Cancer. Cancers 2020, 12, 1477. [Google Scholar] [CrossRef] [PubMed]
- Band, A.M.; Laiho, M. Crosstalk of TGF-β and estrogen receptor signaling in breast cancer. J. Mammary Gland. Biol. Neoplasia 2011, 16, 109–115. [Google Scholar] [CrossRef] [PubMed]
- Wu, L.; Wu, Y.; Gathings, B.; Wan, M.; Li, X.; Grizzle, W.; Liu, Z.; Lu, C.; Mao, Z.; Cao, X. Smad4 as a transcription corepressor for estrogen receptor α. J. Biol. Chem. 2003, 278, 15192–15200. [Google Scholar] [CrossRef]
- Caviness, P.C.; Lazarenko, O.P.; Blackburn, M.L.; Chen, J.F.; Randolph, C.E.; Zabaleta, J.; Zhan, F.; Chen, J.R. Phenolic acids prevent sex-steroid deficiency-induced bone loss and bone marrow adipogenesis in mice. J. Nutr. Biochem. 2024, 127, 109601. [Google Scholar] [CrossRef] [PubMed]
- Chen, J.R.; Zhao, H.; Lazarenko, O.P.; Blackburn, M.L.; Shankar, K. Maternal regulation of SATB2 in osteo-progeniters impairs skeletal development in offspring. FASEB J. 2019, 34, 2511–2523. [Google Scholar] [CrossRef] [PubMed]


| MM | MM + rmCST6 | MM + ZA | |
|---|---|---|---|
| Lesion Number | 19.2 ± 4.2 | 12.6 ± 2.8 | 4.4 ± 0.9 |
| BV/TV (%) | 2.64 ± 0.52 | 3.57 ± 0.14 | 3.88 ± 0.53 |
| Tb.N (1/mm) | 0.56 ± 0.09 | 0.82 ± 0.02 | 0.85 ± 0.12 |
| Tb.Th (mm) | 0.047 ± 0.004 | 0.044 ± 0.002 | 0.045 ± 0.0008 |
| Tb.Sp (mm) | 0.45 ± 0.06 | 0.38 ± 0.02 | 0.38 ± 0.025 |
| BMD (g/cm3) | 0.072 ± 0.01 | 0.10 ± 0.008 | 0.12 ± 0.012 |
| Sham | OVX | OVX + rmCst6 | OVX + ZA | |
|---|---|---|---|---|
| BV/TV (%) | 3.1 ± 0.6 | 2.2 ± 0.40 | 3.3 ± 0.43 | 3.84 ± 0.23 |
| Tb.N (1/mm) | 0.64 ± 0.08 | 0.50 ± 0.10 | 0.70 ± 0.078 | 0.86 ± 0.053 |
| Tb.Th (mm) | 0.049 ± 0.002 | 0.043 ± 0.002 | 0.043 ± 0.0008 | 0.04 ± 0.001 |
| Tb.Sp (mm) | 0.37 ± 0.03 | 0.39 ± 0.01 | 0.31 ± 0.01 | 0.37 ± 0.014 |
| BMD (g/cm3) | 0.087 ± 0.015 | 0.052 ± 0.0068 | 0.079 ± 0.008 | 0.10 ± 0.007 |
| Protein | Sham Average | OVX-PBS Average | OVX-CST6 Average | OVX-ZA Average | t-Test Sham vs. OVX-PBS | t-Test OVX-CST6 vs. OVX-PBS | t-Test OVX-ZA vs. OVX-PBS |
|---|---|---|---|---|---|---|---|
| BLC (CXCL13) | 0.41 ± 0.14 | 1.39 ± 0.25 | 0.54 ± 0.14 | 0.46 ± 0.03 | 0.004 | 0.004 | 0.001 |
| MIP-1 alpha (CCL3) | 0.55 ± 0.27 | 1.39 ± 0.78 | 0.64 ± 0.05 | 0.70 ± 0.09 | 0.07 | 0.08 | 0.10 |
| MIP-3 alpha (CCL20) | 0.51 ± 0.12 | 1.22 ± 0.27 | 0.73 ± 0.08 | 0.71 ± 0.05 | 0.01 | 0.13 | 0.13 |
| SCF | 0.72 ± 0.17 | 1.42 ± 0.04 | 0.69 ± 0.13 | 0.74 ± 0.096 | 0.001 | 0.000 | 0.000 |
| TARC (CCL17) | 0.50 ± 0.16 | 1.02 ± 0.27 | 0.59 ± 0.10 | 0.68 ± 0.19 | 0.03 | 0.03 | 0.07 |
| TECK (CCL25) | 0.61 ± 0.37 | 1.17 ± 0.26 | 0.50 ± 0.05 | 0.57 ± 0.17 | 0.05 | 0.007 | 0.01 |
| TIMP-1 | 0.68 ± 0.14 | 1.01 ± 0.06 | 0.38 ± 0.03 | 0.46 ± 0.12 | 0.02 | 0.000 | 0.001 |
| TNF alpha | 0.53 ± 0.10 | 1.44 ± 0.50 | 0.65 ± 0.05 | 0.79 ± 0.04 | 0.01 | 0.027 | 0.04 |
| TPO | 0.60 ± 0.27 | 1.27 ± 0.27 | 0.63 ± 0.02 | 0.68 ± 0.06 | 0.02 | 0.008 | 0.01 |
| Control Average | ZA Average | 100 ng/mL CST6 Average | t-Test Control vs. ZA | t-Test Control vs. 100 ng/mL CST6 | t-Test ZA vs. 100 ng/mL CST6 | |
|---|---|---|---|---|---|---|
| ERα band Intensity | 13,735.0 ± 3336.7 | 15,366.5 ± 7562.1 | 24,189.5 ± 5269.1 | 0.37 | 0.021 | 0.086 |
| β-actin band Intensity | 11,835.3 ± 877.9 | 13,207.1 ± 837.6 | 13,846.5 ± 2350.0 | 0.06 | 0.11 | 0.34 |
| ERα/β-actin | 1.18 ± 0.32 | 1.17 ± 0.63 | 1.89 ± 0.39 | 0.48 | 0.036 | 0.084 |
| Control Average | ZA Average | 100 ng/mL CST6 Average | t-Test Control vs. ZA | t-Test Control vs. 100 ng/mL CST6 | t-Test ZA vs. 100 ng/mL CST6 | |
|---|---|---|---|---|---|---|
| ERα band Intensity | 20,647.3 ± 2366.8 | 24,660.8 ± 1917.5 | 29,535.7 ± 3279.3 | 0.042 | 0.0094 | 0.045 |
| β-actin band Intensity | 16,643.0 ± 1369.6 | 17,405.5 ± 588.6 | 17,153.1 ± 1755.3 | 0.21 | 0.35 | 0.41 |
| ERα/β-actin | 1.23 ± 0.077 | 1.41 ± 0.096 | 1.74 ± 0.37 | 0.033 | 0.041 | 0.10 |
Disclaimer/Publisher’s Note: The statements, opinions and data contained in all publications are solely those of the individual author(s) and contributor(s) and not of MDPI and/or the editor(s). MDPI and/or the editor(s) disclaim responsibility for any injury to people or property resulting from any ideas, methods, instructions or products referred to in the content. |
© 2025 by the authors. Licensee MDPI, Basel, Switzerland. This article is an open access article distributed under the terms and conditions of the Creative Commons Attribution (CC BY) license (https://creativecommons.org/licenses/by/4.0/).
Share and Cite
Gai, D.; Caviness, P.C.; Lazarenko, O.P.; Chen, J.F.; Randolph, C.E.; Zhang, Z.; Cheng, Y.; Sun, F.; Xu, H.; Blackburn, M.L.; et al. Cystatin M/E Ameliorates Multiple Myeloma-Induced Hyper Osteolytic Bone Resorption. Cancers 2025, 17, 833. https://doi.org/10.3390/cancers17050833
Gai D, Caviness PC, Lazarenko OP, Chen JF, Randolph CE, Zhang Z, Cheng Y, Sun F, Xu H, Blackburn ML, et al. Cystatin M/E Ameliorates Multiple Myeloma-Induced Hyper Osteolytic Bone Resorption. Cancers. 2025; 17(5):833. https://doi.org/10.3390/cancers17050833
Chicago/Turabian StyleGai, Dongzheng, Perry C. Caviness, Oxana P. Lazarenko, Jennifer F. Chen, Christopher E. Randolph, Zijun Zhang, Yan Cheng, Fumou Sun, Hongwei Xu, Michael L. Blackburn, and et al. 2025. "Cystatin M/E Ameliorates Multiple Myeloma-Induced Hyper Osteolytic Bone Resorption" Cancers 17, no. 5: 833. https://doi.org/10.3390/cancers17050833
APA StyleGai, D., Caviness, P. C., Lazarenko, O. P., Chen, J. F., Randolph, C. E., Zhang, Z., Cheng, Y., Sun, F., Xu, H., Blackburn, M. L., Tricot, G., Shaughnessy, J. D., Jr., Chen, J.-R., & Zhan, F. (2025). Cystatin M/E Ameliorates Multiple Myeloma-Induced Hyper Osteolytic Bone Resorption. Cancers, 17(5), 833. https://doi.org/10.3390/cancers17050833