
Tandem Mass Spectrometry as Strategy for the Selective Identification and Quantification of the Amyloid Precursor Protein Tyr682 Residue Phosphorylation Status in Human Blood Mononuclear Cells

 ,
,  , , and
Abstract
:1. Introduction
2. Materials and Methods
2.1. Cell Lines
2.2. Patients Selection and Isolation of Peripheral Blood Mononuclear Cells from Whole Blood
2.3. Transfection Experiments
2.4. Western Blot
2.5. SDS-PAGE and In-Gel Digestion
2.6. Preparation of Samples and Standards
2.7. LC-MS/MS Analysis
2.8. Information-Dependent Acquisition (IDA) Parameters
2.9. Validation
2.10. Statistical Analysis and Data Processing
3. Results
3.1. Tandem Mass Spectrometry Set Up and Validation
3.2. Samples Analysis
4. Discussion
5. Conclusions
Supplementary Materials
Author Contributions
Funding
Institutional Review Board Statement
Informed Consent Statement
Conflicts of Interest
References
- Alzheimer’s Association. 2016 Alzheimer’s disease facts and figures. Alzheimers Dement. 2016, 12, 459–509. [Google Scholar] [CrossRef]
- 2020 Alzheimer’s disease facts and figures. Alzheimers Dement. 2020. [CrossRef]
- King, G.D.; Scott Turner, R. Adaptor protein interactions: Modulators of amyloid precursor protein metabolism and Alzheimer’s disease risk? Exp. Neurol. 2004, 185, 208–219. [Google Scholar] [CrossRef] [PubMed]
- Guénette, S.; Strecker, P.; Kins, S. APP Protein Family Signaling at the Synapse: Insights from Intracellular APP-Binding Proteins. Front. Mol. Neurosci. 2017, 10, 87. [Google Scholar] [CrossRef] [PubMed] [Green Version]
- Matrone, C. A new molecular explanation for age-related neurodegeneration: The Tyr682 residue of amyloid precursor protein. Bioessays 2013, 35, 847–852. [Google Scholar] [CrossRef] [PubMed] [Green Version]
- Matrone, C.; Iannuzzi, F.; Annunziato, L. The Y682 ENPTY687 motif of APP: Progress and insights toward a targeted therapy for Alzheimer’s disease patients. Aging Res. Rev. 2019, 52, 120–128. [Google Scholar] [CrossRef] [PubMed]
- Matrone, C.; Luvisetto, S.; La Rosa, L.R.; Tamayev, R.; Pignataro, A.; Canu, N.; Yang, L.; Barbagallo, A.P.; Biundo, F.; Lombino, F.; et al. Tyr682 in the Abeta-precursor protein intracellular domain regulates synaptic connectivity, cholinergic function, and cognitive performance. Aging Cell 2012, 11, 1084–1093. [Google Scholar] [CrossRef] [Green Version]
- Perez, R.G.; Soriano, S.; Hayes, J.D.; Ostaszewski, B.; Xia, W.; Selkoe, D.J.; Chen, X.; Stokin, G.B.; Koo, E.H. Mutagenesis identifies new signals for beta-amyloid precursor protein endocytosis, turnover, and the generation of secreted fragments, including Abeta42. J. Biol. Chem. 1999, 274, 18851–18856. [Google Scholar] [CrossRef] [Green Version]
- Yáñez, M.J.; Belbin, O.; Estrada, L.D.; Leal, N.; Contreras, P.S.; Lleó, A.; Burgos, P.V.; Zanlungo, S.; Alvarez, A.R. c-Abl links APP-BACE1 interaction promoting APP amyloidogenic processing in Niemann-Pick type C disease. Biochim. Biophys. Acta 2016, 1862, 2158–2167. [Google Scholar] [CrossRef]
- Matrone, C.; Marolda, R.; Ciafre, S.; Ciotti, M.T.; Mercanti, D.; Calissano, P. Tyrosine kinase nerve growth factor receptor switches from prosurvival to proapoptotic activity via Abeta-mediated phosphorylation. Proc. Natl. Acad. Sci. USA 2009, 106, 11358–11363. [Google Scholar] [CrossRef] [Green Version]
- Matrone, C.; Barbagallo, A.P.; La Rosa, L.R.; Florenzano, F.; Ciotti, M.T.; Mercanti, D.; Chao, M.V.; Calissano, P.; D’Adamio, L. APP is phosphorylated by TrkA and regulates NGF/TrkA signaling. J. Neurosci. 2011, 31, 11756–11761. [Google Scholar] [CrossRef] [Green Version]
- La Rosa, L.R.; Perrone, L.; Nielsen, M.S.; Calissano, P.; Andersen, O.M.; Matrone, C. Y682G Mutation of Amyloid Precursor Protein Promotes Endo-Lysosomal Dysfunction by Disrupting APP-SorLA Interaction. Front. Cell. Neurosci. 2015, 9, 109. [Google Scholar] [CrossRef] [Green Version]
- Poulsen, E.T.; Larsen, A.; Zollo, A.; Jørgensen, A.L.; Sanggaard, K.W.; Enghild, J.J.; Matrone, C. New Insights to Clathrin and Adaptor Protein 2 for the Design and Development of Therapeutic Strategies. Int. J. Mol. Sci. 2015, 16, 29446–29453. [Google Scholar] [CrossRef]
- Calissano, P.; Amadoro, G.; Matrone, C.; Ciafrè, S.; Marolda, R.; Corsetti, V.; Ciotti, M.T.; Mercanti, D.; Di Luzio, A.; Severini, C.; et al. Does the term ‘trophic’ actually mean anti-amyloidogenic? The case of NGF. Cell Death Differ. 2010, 17, 1126–1133. [Google Scholar] [CrossRef] [PubMed]
- Iannuzzi, F.; Sirabella, R.; Canu, N.; Maier, T.J.; Annunziato, L.; Matrone, C. Fyn Tyrosine Kinase Elicits Amyloid Precursor Protein Tyr682 Phosphorylation in Neurons from Alzheimer’s Disease Patients. Cells 2020, 9, 1807. [Google Scholar] [CrossRef] [PubMed]
- Iannuzzi, F.; Frisardi, V.; Annunziato, L.; Matrone, C. Might Fibroblasts from Patients with Alzheimer’s Disease Reflect the Brain Pathology? A Focus on the Increased Phosphorylation of Amyloid Precursor Protein Tyr. Brain Sci. 2021, 11, 103. [Google Scholar] [CrossRef]
- Poulsen, E.T.; Iannuzzi, F.; Rasmussen, H.F.; Maier, T.J.; Enghild, J.J.; Jørgensen, A.L.; Matrone, C. An Aberrant Phosphorylation of Amyloid Precursor Protein Tyrosine Regulates Its Trafficking and the Binding to the Clathrin Endocytic Complex in Neural Stem Cells of Alzheimer’s Disease Patients. Front. Mol. Neurosci. 2017, 10, 59. [Google Scholar] [CrossRef] [PubMed] [Green Version]
- Resh, M.D. Fyn, a Src family tyrosine kinase. Int. J. Biochem. Cell Biol. 1998, 30, 1159–1162. [Google Scholar] [CrossRef]
- Shirazi, S.K.; Wood, J.G. The protein tyrosine kinase, fyn, in Alzheimer’s disease pathology. Neuroreport 1993, 4, 435–437. [Google Scholar] [CrossRef]
- Lee, G.; Newman, S.T.; Gard, D.L.; Band, H.; Panchamoorthy, G. Tau interacts with src-family non-receptor tyrosine kinases. J. Cell Sci. 1998, 111 Pt 21, 3167–3177. [Google Scholar] [CrossRef]
- Um, J.W.; Nygaard, H.B.; Heiss, J.K.; Kostylev, M.A.; Stagi, M.; Vortmeyer, A.; Wisniewski, T.; Gunther, E.C.; Strittmatter, S.M. Alzheimer amyloid-β oligomer bound to postsynaptic prion protein activates Fyn to impair neurons. Nat. Neurosci. 2012, 15, 1227–1235. [Google Scholar] [CrossRef] [Green Version]
- Nygaard, H.B.; van Dyck, C.H.; Strittmatter, S.M. Fyn kinase inhibition as a novel therapy for Alzheimer’s disease. Alzheimers Res. Ther. 2014, 6, 8. [Google Scholar] [CrossRef] [Green Version]
- Kaufman, A.C.; Salazar, S.V.; Haas, L.T.; Yang, J.; Kostylev, M.A.; Jeng, A.T.; Robinson, S.A.; Gunther, E.C.; van Dyck, C.H.; Nygaard, H.B.; et al. Fyn inhibition rescues established memory and synapse loss in Alzheimer mice. Ann. Neurol. 2015, 77, 953–971. [Google Scholar] [CrossRef] [Green Version]
- Nygaard, H.B. Targeting Fyn Kinase in Alzheimer’s Disease. Biol. Psychiatry 2018, 83, 369–376. [Google Scholar] [CrossRef]
- Low, C.Y.B.; Lee, J.H.; Lim, F.T.W.; Lee, C.; Ballard, C.; Francis, P.T.; Lai, M.K.P.; Tan, M.G.K. Isoform-specific upregulation of FynT kinase expression is associated with tauopathy and glial activation in Alzheimer’s disease and Lewy body dementias. Brain Pathol. 2020, e12917. [Google Scholar] [CrossRef]
- Lee, C.; Low, C.Y.; Francis, P.T.; Attems, J.; Wong, P.T.; Lai, M.K.; Tan, M.G. An isoform-specific role of FynT tyrosine kinase in Alzheimer’s disease. J. Neurochem. 2016, 136, 637–650. [Google Scholar] [CrossRef] [PubMed] [Green Version]
- Da Mesquita, S.; Louveau, A.; Vaccari, A.; Smirnov, I.; Cornelison, R.C.; Kingsmore, K.M.; Contarino, C.; Onengut-Gumuscu, S.; Farber, E.; Raper, D.; et al. Functional aspects of meningeal lymphatics in ageing and Alzheimer’s disease. Nature 2018, 560, 185–191. [Google Scholar] [CrossRef] [PubMed]
- Heyman, A.; Wilkinson, W.; Hurwitz, B.; Helms, M.; Haynes, C.; Utley, C.; Gwyther, L. Early-onset Alzheimer’s disease: Clinical predictors of institutionalization and death. Neurology 1987, 37, 980. [Google Scholar] [CrossRef]
- Hughes, C.P.; Berg, L.; Danziger, W.; Coben, L.A.; Martin, R.L. A new clinical scale for the staging of dementia. Br. J. Psychiatry 1982, 140, 566–572. [Google Scholar] [CrossRef]
- Hellman, U. Sample preparation by SDS/PAGE and in-gel digestion. EXS 2000, 88, 43–54. [Google Scholar] [CrossRef]
- Basso, E.; Matrone, C. NGF and APP Interplay: Focus on YENPTY Motif of Amyloid Precursor Protein and Y682 Residue. Cell Biol. Res. Ther. 2013, 2. [Google Scholar] [CrossRef]
- Ren, R.-J.; Dammer, E.B.; Wang, G.; Seyfried, N.T.; Levey, A.I. Proteomics of protein post-translational modifications implicated in neurodegeneration. Transl. Neurodegener. 2014, 3, 23. [Google Scholar] [CrossRef] [Green Version]
- Olat, A.N.; Özlü, N. Towards single-cell LC-MS phosphoproteomics. Analytical 2014, 139, 4733–4749. [Google Scholar] [CrossRef] [Green Version]
- Xia, Q.; Cheng, D.; Duong, D.; Gearing, M.; Lah, J.J.; Levey, A.I.; Peng, J. Phosphoproteomic Analysis of Human Brain by Calcium Phosphate Precipitation and Mass Spectrometry. J. Proteome Res. 2008, 7, 2845–2851. [Google Scholar] [CrossRef] [PubMed] [Green Version]
- Di Domenico, F.; Sultana, R.; Barone, E.; Perluigi, M.; Cini, C.; Mancuso, C.; Cai, J.; Pierce, W.M.; Butterfield, D.A. eQuantitative proteomics analysis of phosphorylated proteins in the hippocampus of Alzheimer’s disease subjects. J. Proteom. 2011, 74, 1091–1103. [Google Scholar] [CrossRef] [PubMed] [Green Version]
- Collins, M.; Yu, L.; Campuzano, I.; Grant, S.; Choudhary, J. Phosphoproteomic Analysis of the Mouse Brain Cytosol Reveals a Predominance of Protein Phosphorylation in Regions of Intrinsic Sequence Disorder. Mol. Cell. Proteom. 2008, 7, 1331–1348. [Google Scholar] [CrossRef] [Green Version]
- Barthélemy, N.R.; Mallipeddi, N.; Moiseyev, P.; Sato, C.; Bateman, R.J. Tau phosphorylation rates measured by mass spectrometry differ in the intracellular brain vs. extracellular cerebrospinal fluid compartments and are differentially affected by Alzheimer’s disease. Front. Aging Neurosci. 2019, 11, 121. [Google Scholar] [CrossRef] [Green Version]
- Nair, H.; Clarke, W. Mass Spectrometry for the Clinical Laboratory; Academic Press: Cambridge, MA, USA, 2016. [Google Scholar]


| Peptide | Precursor Ion (m/z) | Product Ion (m/z) | DP a | CE b | CXP c | RT d (min) | |
|---|---|---|---|---|---|---|---|
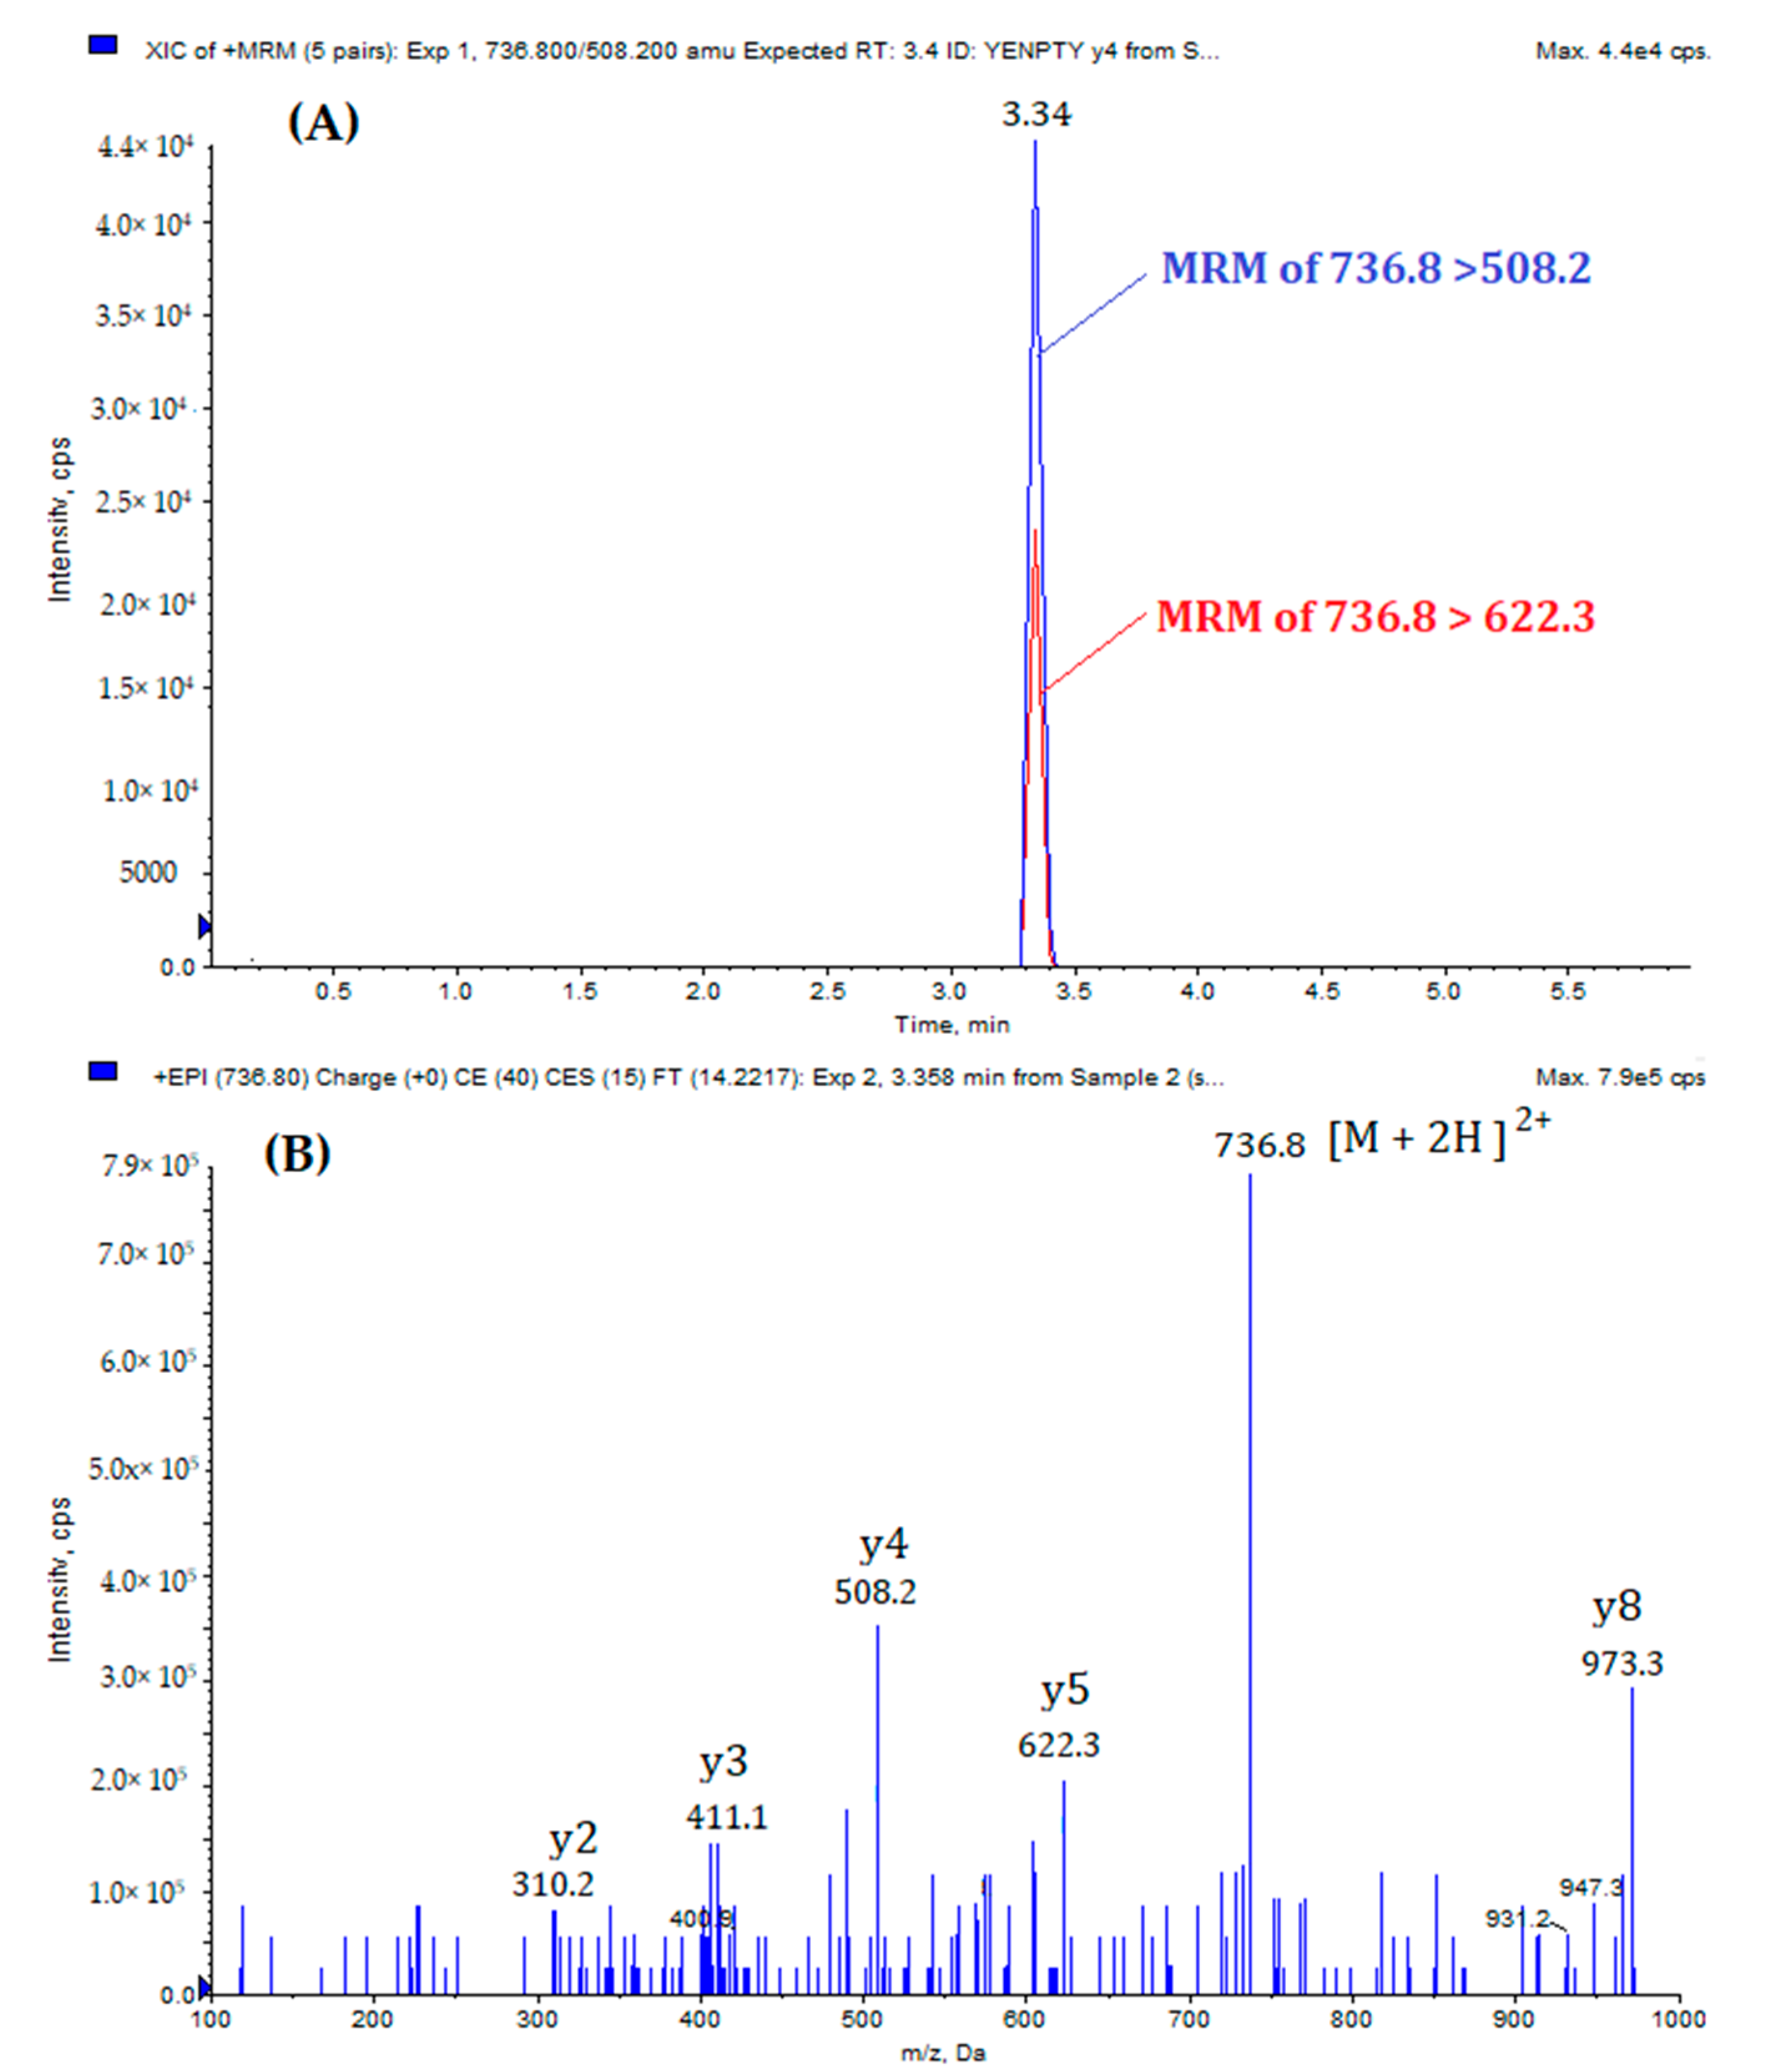
| MQQNGYENPTYK | (Quantification) | 736.8 [M +2H]2+ | 508.2 | 55 | 41 | 25 | 3.34 |
| (Qualification) | 736.8 | 622.3 | 55 | 37 | 25 | ||
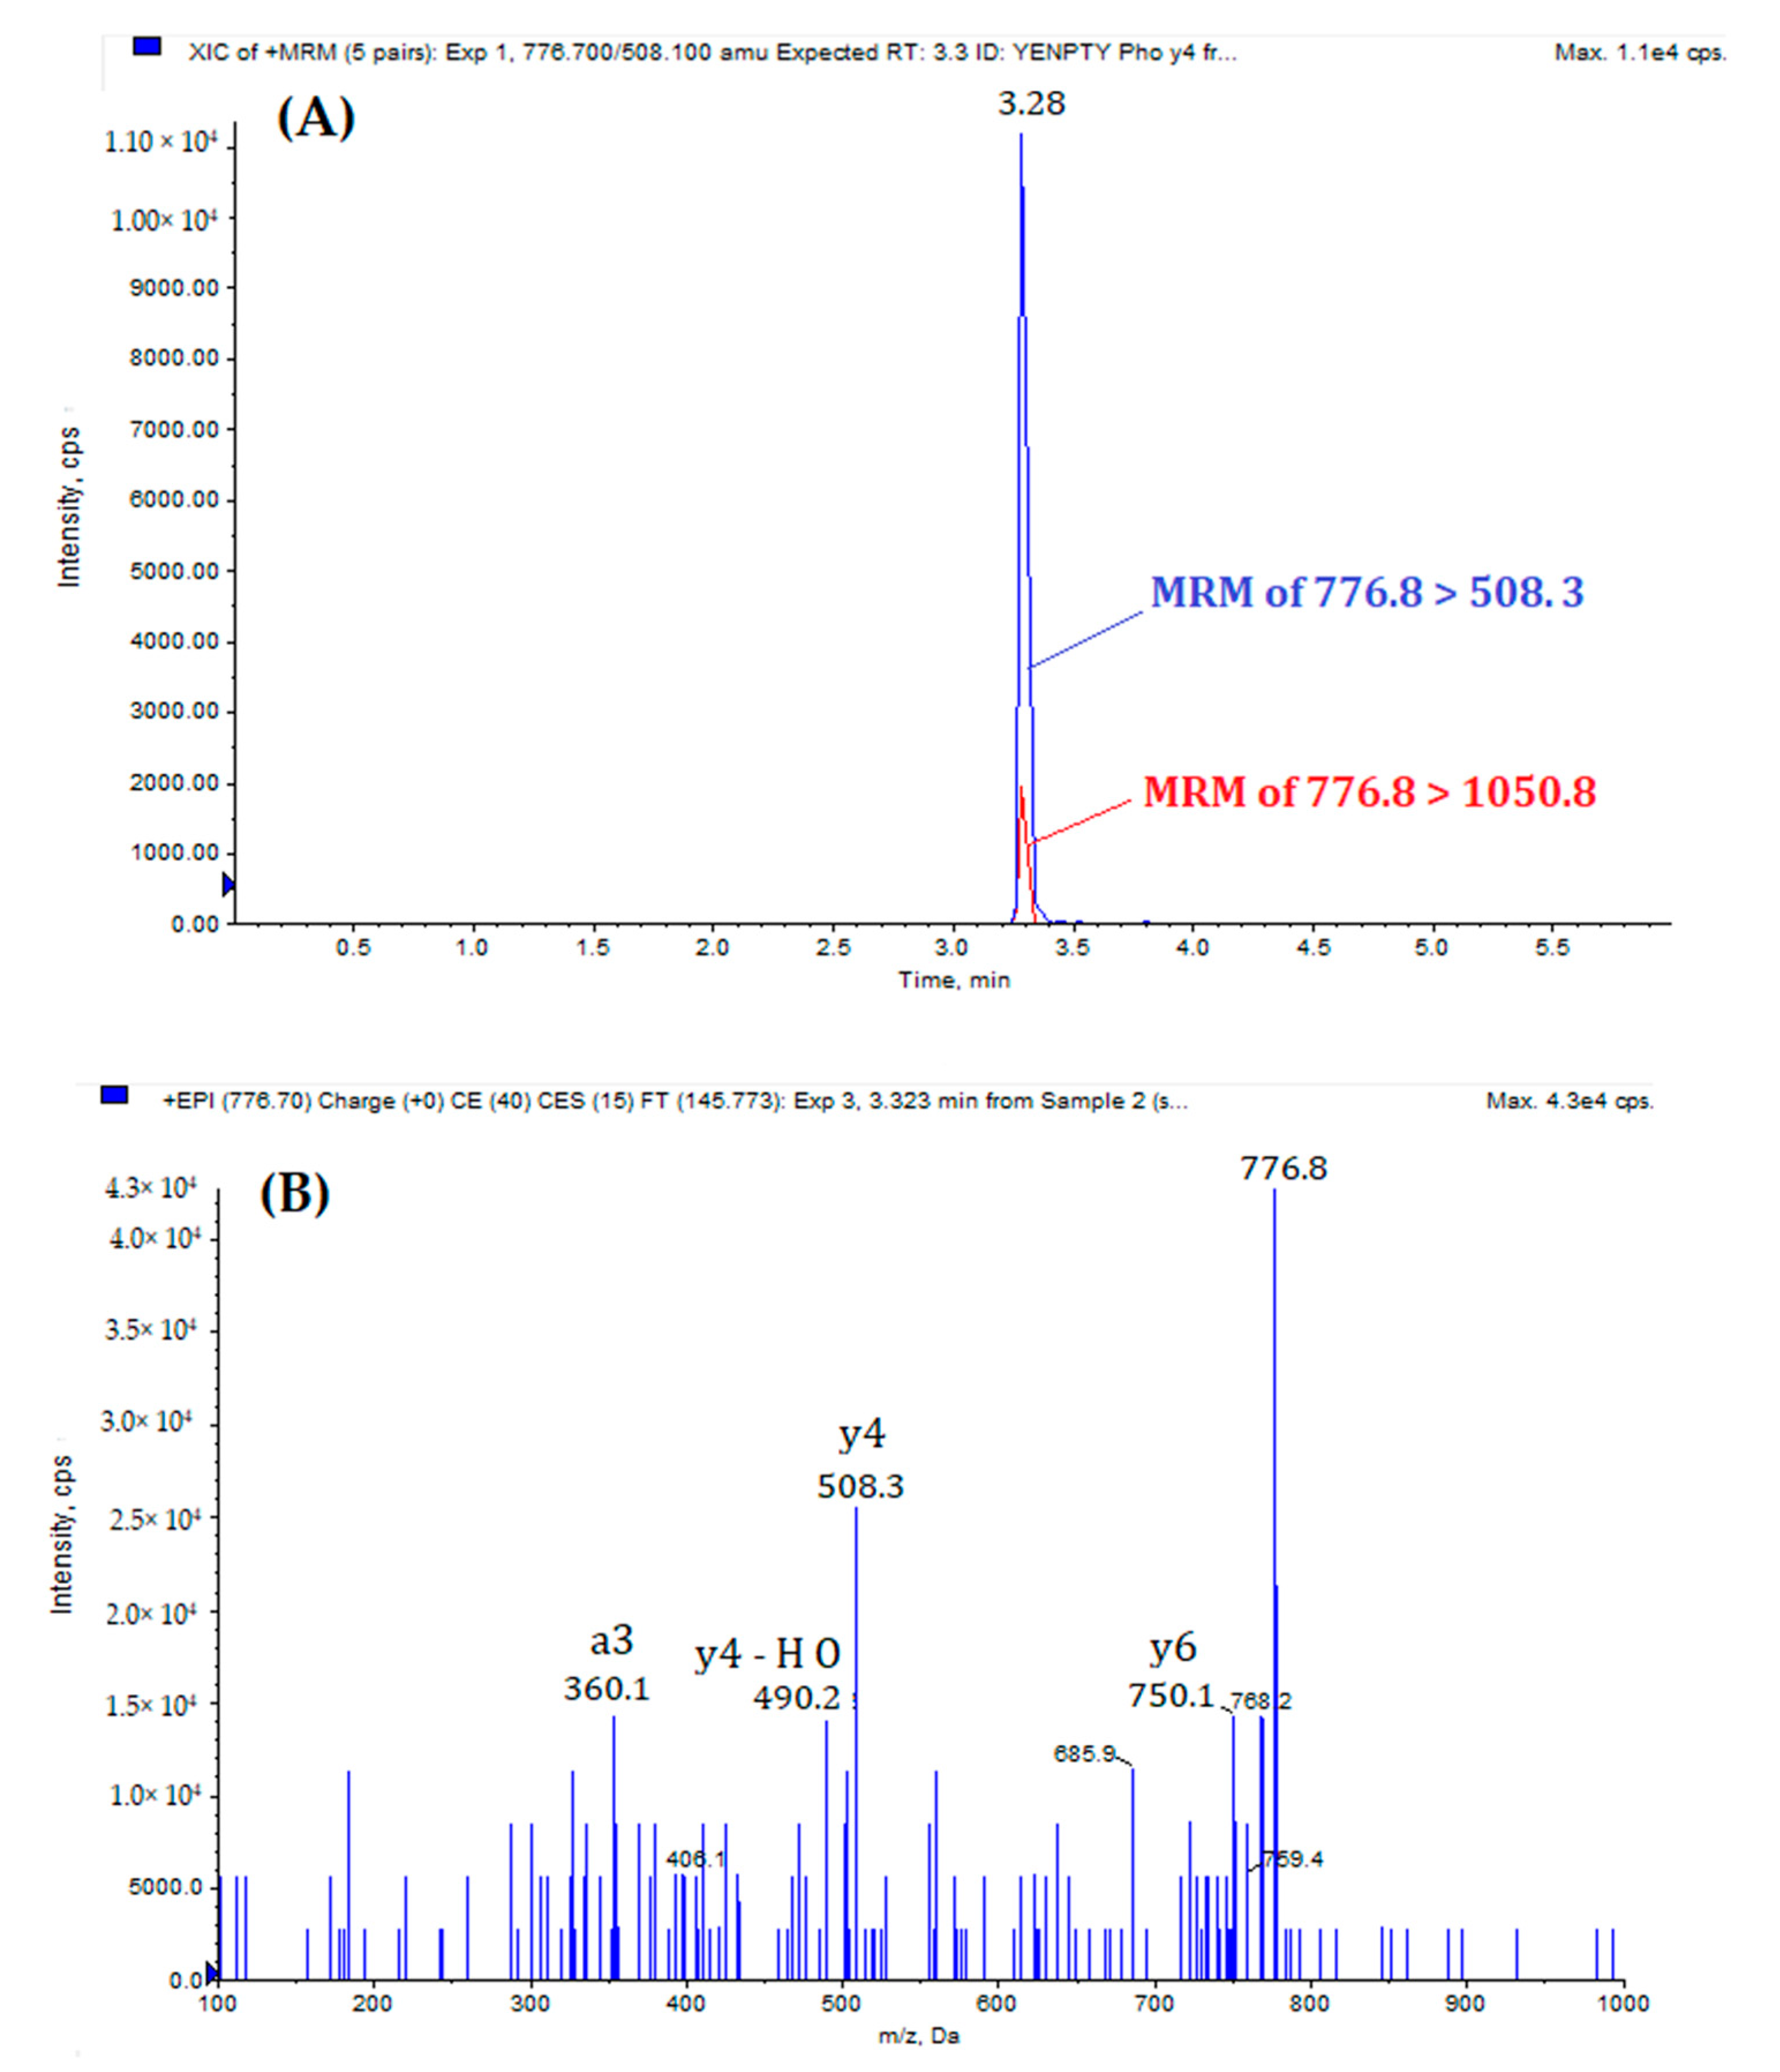
| MQQNGYpENPTYK | (Quantification) | 776.7 [M +2H]2+ | 508.1 | 55 | 41 | 25 | 3.28 |
| (Qualification) | 776.7 | 1050.8 | 55 | 37 | 25 | ||
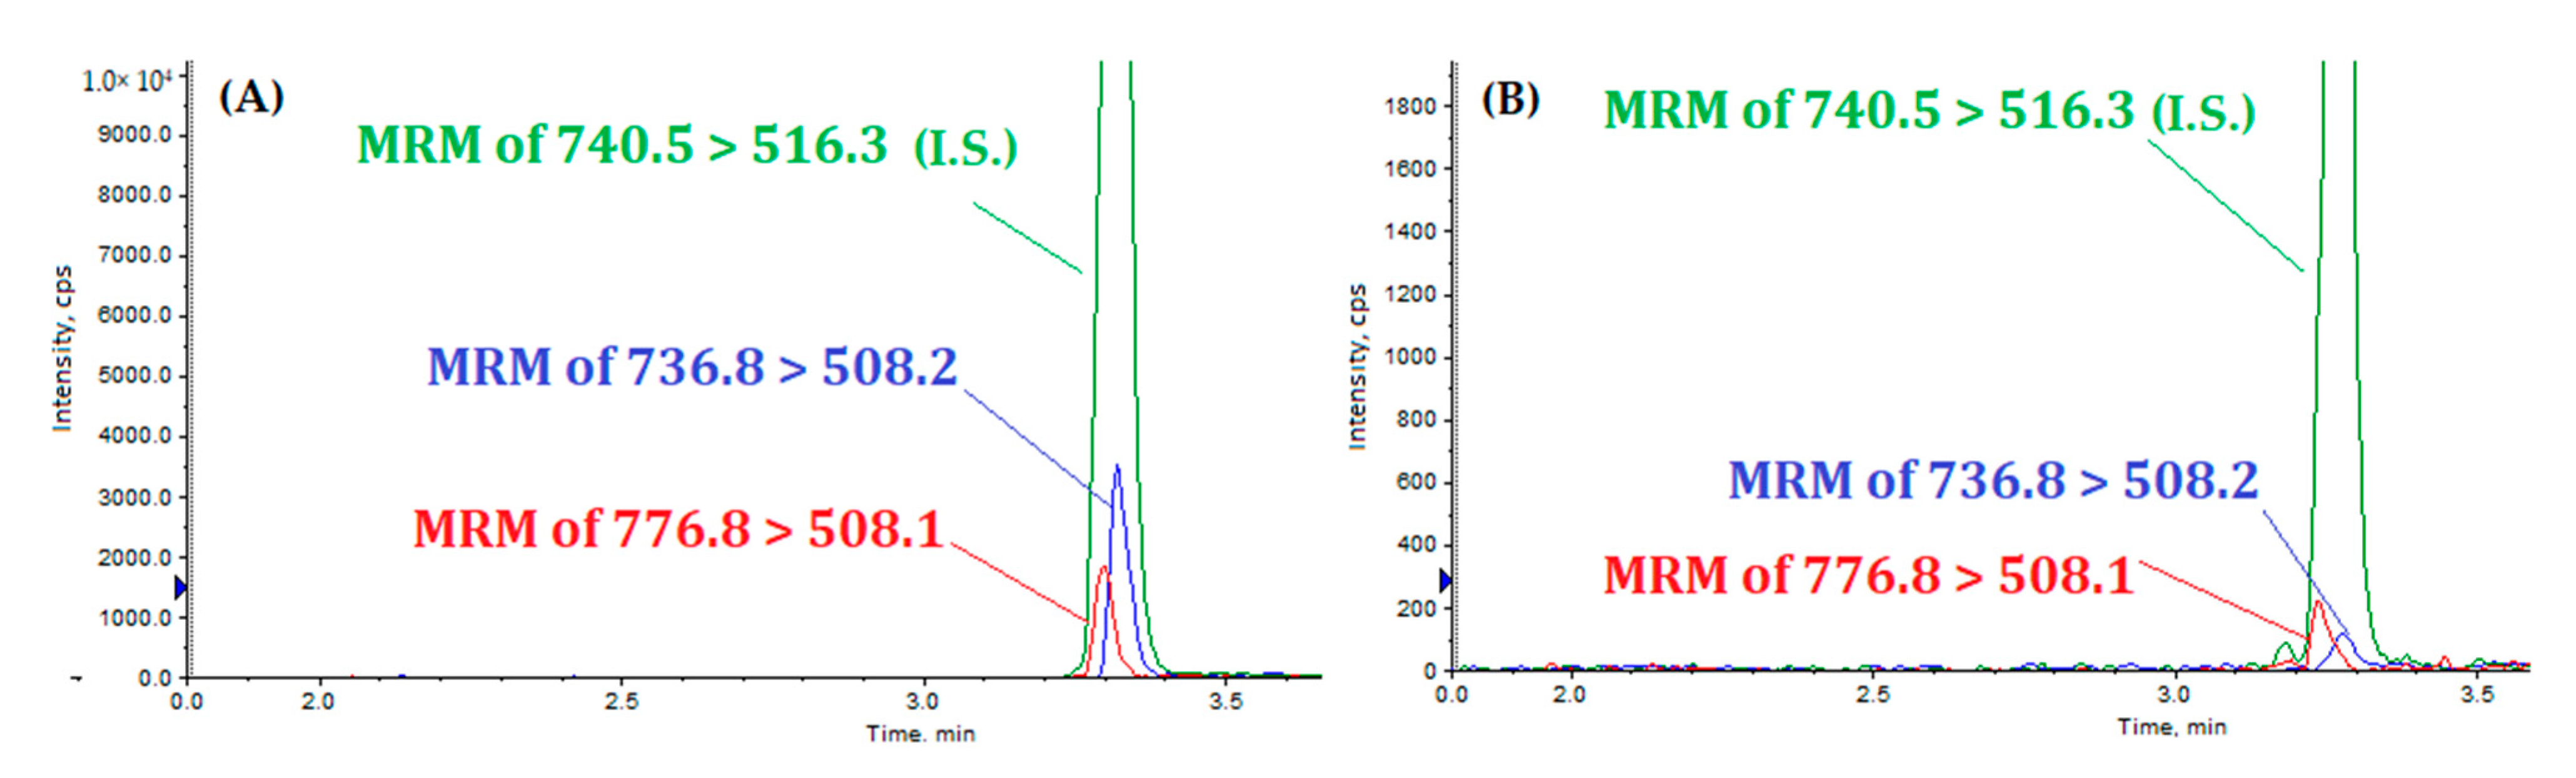
| MQQNGYENPTYK(Lys13C6,15N2) | 740.5 [M +2H]2+ | 516.3 | 55 | 41 | 25 | 3.34 | |
| Peptide | LOD | LOQ | ng of Peptide Injected | 0.25 | 2.5 | 5 | 10 | 25 | 45 |
|---|---|---|---|---|---|---|---|---|---|
| MQQNGYENPTYK y = 1.05976 × −0.00604 r = 0.9984 | 0.02 | 0.215 | Mean | 0.27 | 2.41 | 5.10 | 9.49 | 23.61 | 46.88 |
| Imprecision a | 6.1 | 7.4 | 2.0 | 1.5 | 5.3 | 2.5 | |||
| Inaccuracy b | 8.0 | −3.6 | 2.0 | −5.0 | −5.6 | 4.1 | |||
| MQQNGYpENPTYK y = 0.30900 × −0.00187 r = 0.9972 | 0.035 | 0.082 | Mean | 0.30 | 2.48 | 4.66 | 8.85 | 23.49 | 47.49 |
| Imprecision a | 16.6 | 7.6 | 2.3 | 2.5 | 5.4 | 2.2 | |||
| Inaccuracy b | 20 | −0.8 | −6.2 | −11.5 | −6.2 | 4.4 |
| Peptide | Expected Amount (ng) | Calculated Amount (ng) | Imprecision (CV%) | Inaccuracy (%) |
|---|---|---|---|---|
| MQQNGYENPTYK | 3.75 | 4.15 | 5.2 | 11.3 |
| 35.0 | 36.6 | 3.2 | 4.6 | |
| MQQNGYpENPTYK | 3.75 | 3.7 | 2.1 | −1.4 |
| 35.0 | 37.7 | 4.9 | 7.7 |
| Peptide | Expected Amount(ng) | Calculated Amount (ng) | Imprecision (CV%) | Inaccuracy (%) |
|---|---|---|---|---|
| MQQNGYENPTYK | 3.75 | 4.1 | 6.6 | 9.2 |
| 35.0 | 36.35 | 8.6 | 3.8 | |
| MQQNGYpENPTYK | 3.75 | 3.75 | 14.3 | - |
| 35.0 | 35.8 | 9.0 | 2.3 |
| Patients I.D. | Age (y) | Gender | A.D. Specific Mutation | Stage of Dementia (CDR) * | Peptide Tyr682 Phosphorylated (ng/μg of Prot) | Peptide No-Tyr682 Phosphorylated (ng/μg of Prot) |
|---|---|---|---|---|---|---|
| O.S. | 78 | M | None | Mild (1) | 0.15 | 0.13 |
| G.A. | 80 | F | None | Severe (3) | 0.10 | <LOD |
| T.V. | 75 | M | None | Terminal (5) | <LOD | <LOD |
Publisher’s Note: MDPI stays neutral with regard to jurisdictional claims in published maps and institutional affiliations. |
© 2021 by the authors. Licensee MDPI, Basel, Switzerland. This article is an open access article distributed under the terms and conditions of the Creative Commons Attribution (CC BY) license (https://creativecommons.org/licenses/by/4.0/).
Share and Cite
Reveglia, P.; Nasso, R.; Angiolillo, A.; Lecce, L.; Paolillo, C.; De Tullio, S.; Gelzo, M.; Di Costanzo, A.; Matrone, C.; Corso, G. Tandem Mass Spectrometry as Strategy for the Selective Identification and Quantification of the Amyloid Precursor Protein Tyr682 Residue Phosphorylation Status in Human Blood Mononuclear Cells. Biomolecules 2021, 11, 1297. https://doi.org/10.3390/biom11091297
Reveglia P, Nasso R, Angiolillo A, Lecce L, Paolillo C, De Tullio S, Gelzo M, Di Costanzo A, Matrone C, Corso G. Tandem Mass Spectrometry as Strategy for the Selective Identification and Quantification of the Amyloid Precursor Protein Tyr682 Residue Phosphorylation Status in Human Blood Mononuclear Cells. Biomolecules. 2021; 11(9):1297. https://doi.org/10.3390/biom11091297
Chicago/Turabian StyleReveglia, Pierluigi, Rosarita Nasso, Antonella Angiolillo, Lucia Lecce, Carmela Paolillo, Samantha De Tullio, Monica Gelzo, Alfonso Di Costanzo, Carmela Matrone, and Gaetano Corso. 2021. "Tandem Mass Spectrometry as Strategy for the Selective Identification and Quantification of the Amyloid Precursor Protein Tyr682 Residue Phosphorylation Status in Human Blood Mononuclear Cells" Biomolecules 11, no. 9: 1297. https://doi.org/10.3390/biom11091297
APA StyleReveglia, P., Nasso, R., Angiolillo, A., Lecce, L., Paolillo, C., De Tullio, S., Gelzo, M., Di Costanzo, A., Matrone, C., & Corso, G. (2021). Tandem Mass Spectrometry as Strategy for the Selective Identification and Quantification of the Amyloid Precursor Protein Tyr682 Residue Phosphorylation Status in Human Blood Mononuclear Cells. Biomolecules, 11(9), 1297. https://doi.org/10.3390/biom11091297