Systematic Review

Advances in the Automated Identification of Individual Tree Species: A Systematic Review of Drone- and AI-Based Methods in Forest Environments

by
Ricardo Abreu-Dias
1,2,
Juan M. Santos-Gago
2,*,
Fernando Martín-Rodríguez
2 and
Luis M. Álvarez-Sabucedo
2
1
Department of Computer Engineering and Multimedia, Polytechnic Institute of Viana do Castelo (IPVC), 4900-347 Viana do Castelo, Portugal
2
atlanTTic (Research Center for Telecommunication Technologies), University of Vigo, 36310 Vigo, Spain
*
Author to whom correspondence should be addressed.
Technologies 2025, 13(5), 187; https://doi.org/10.3390/technologies13050187
Submission received: 20 March 2025 / Revised: 25 April 2025 / Accepted: 30 April 2025 / Published: 6 May 2025
(This article belongs to the Collection Review Papers Collection for Advanced Technologies)

Abstract

:
The classification and identification of individual tree species in forest environments are critical for biodiversity conservation, sustainable forestry management, and ecological monitoring. Recent advances in drone technology and artificial intelligence have enabled new methodologies for detecting and classifying trees at an individual level. However, significant challenges persist, particularly in heterogeneous forest environments with high species diversity and complex canopy structures. This systematic review explores the latest research on drone-based data collection and AI-driven classification techniques, focusing on studies that classify specific tree species rather than generic tree detection. Following the Preferred Reporting Items for Systematic Reviews and Meta-Analyses guidelines, peer review studies from the last decade were analyzed to identify trends in data acquisition instruments (e.g., RGB, multispectral, hyperspectral, LiDAR), preprocessing techniques, segmentation approaches, and machine learning (ML) algorithms used for classification. Findings of this study reveal that deep learning (DL) models, particularly convolutional neural networks (CNN), are increasingly replacing traditional ML methods such as random forest (RF) or support vector machines (SVMs) because there is no need for a feature extraction phase, as this is implicit in the DL models. The integration of LiDAR with hyperspectral imaging further enhances classification accuracy but remains limited due to cost constraints. Additionally, we discuss the challenges of model generalization across different forest ecosystems and propose future research directions, including the development of standardized datasets and improved model architectures for robust tree species classification. This review provides a comprehensive synthesis of existing methodologies, highlighting both advancements and persistent gaps in AI-driven forest monitoring.

1. Introduction

Forests are essential for biodiversity and for the ecosystems that sustain life on the planet, providing critical services such as climate regulation, water purification, soil protection against erosion, and support for ecosystems that are densely inhabited by wildlife. Furthermore, they are major contributors in supporting the global economy and the livelihoods of millions of people around the world [1].
Through forestry, we obtain essential natural resources for various industries, such as furniture and construction timber, paper and pulp, and biomass, which has been growing exponentially due to climate change prevention measures [2]. Because of their importance, it is necessary to make sustainable use of forests, not only to preserve existing ecosystems and species but also to maintain the economic value chains associated with these products.
The detection and classification of individual trees in forested areas is a crucial field of study for achieving more detailed mapping of forest environments, which can significantly contribute to sustainable development and nature conservation. Traditionally, the identification of tree species has relied primarily on field surveys, either conducted on foot [3] or through visual interpretation [4] of aerial imagery captured using costly platforms such as helicopters or small aircraft. These conventional approaches typically demand substantial manpower, material, and financial resources [5], as well as significant time for data collection. As a result, conducting highly detailed surveys within short timeframes has been often impractical.
In recent years, significant progress has been made in the use of unmanned aerial vehicles (UAVs or drones) equipped with sensors and high-resolution cameras to collect forest data across the globe. This has been accompanied by the development of artificial intelligence (AI) algorithms capable of processing such data. These platforms and techniques have the potential to greatly enhance the efficiency of tree species cataloguing, considerably reducing both costs and time requirements.
In addition to forest monitoring, UAV-based imaging and AI techniques have shown significant potential in agricultural contexts. For instance, ref. [6] demonstrated strong benchmark performance on UAV-based crop classification using hyperspectral imaging (HSI). Similarly, ref. [7] introduced a hybrid statistical-swarm intelligence approach for optimal band selection in hyperspectral crop images, achieving accurate identification of vegetable crops at the plant level. The UAVINE-XAI framework [8] incorporated explainable AI for vineyard monitoring, highlighting the effectiveness of specific spectral bands. Additionally, the HSI-TransUNet model [9] leveraged transformer-based semantic segmentation to produce accurate crop maps from UAV hyperspectral imagery. These examples from the agricultural domain not only demonstrate the versatility and accuracy of UAV- and AI-based methods across land use scenarios but also reinforce the rationale for further advancing species-level tree identification through similar approaches.
The application of these methodologies in forested environments has shown promising results in recent years; however, they still face significant challenges, particularly in areas with high tree density, canopy heterogeneity, and varying stages of maturation. Despite the successes achieved in urban environments and plantations, where conditions are more controlled and homogeneous, tree detection in dense and diverse forest areas remains a complex task [10,11]. In such conditions, overlapping canopies and frequent occlusions make it difficult to accurately isolate and identify individual trees, thereby limiting the effectiveness of automated classification and analysis techniques. In this context, this systematic review is necessary to identify the advances and potential of existing proposals, as well as to find possible gaps, and to provide a comprehensive overview of current methods, addressing both data collection and the algorithms used for the classification and detection of individual trees in forest environments.
The main objective of this study is to identify the methodologies already used in the classification and identification of tree species on an individual basis. Studies that employ drones equipped with sensors and cameras to capture forest data, as well as the AI algorithms applied to the classification or identification of individual trees, will be analyzed.
Only studies where the classification was conducted on specific tree species and at the individual level were considered. This focus aims to make it possible, given a forest patch, to identify the presence of trees of invasive species or to monitor if non-commercially valuable trees are emerging in a given plantation or the creation of forest inventories, among other possible applications. Through this review, we aim to contribute a detailed synthesis of existing approaches, identify the limitations faced by researchers, and suggest possible directions for future investigations.

2. Materials and Methods

The objective stated in the previous section can be summarized in the following research question:
RQ Global: What proposals have been developed to classify or identify the species of a specific tree in a forest environment from data captured by drones using AI techniques?
In order to provide an adequate answer to this question, a systematic review of the scientific/technological literature was carried out with the aim of identifying articles published in the last 10 years that discuss—directly or indirectly—novel research focusing on the purpose at hand. From the articles located, we have attempted to extract information that allows us to answer the following specific research questions:
  • RQ1: What types of instruments were used to collect data? (What type of data is collected?)
  • RQ2: What type of AI algorithms were used for tree identification/classification?
  • RQ3: How effective are current identification/classification proposals?
This review followed the core principles of the Preferred Reporting Items for Systematic reviews and Meta-Analyses (PRISMA) [12]. Accordingly, a search strategy was designed, eligibility criteria were set, and a structured selection process was implemented. This approach resulted in a curated collection of documents, enabling the extraction of findings aligned with the defined search objectives. The following subsections detail the methodological decisions adopted.

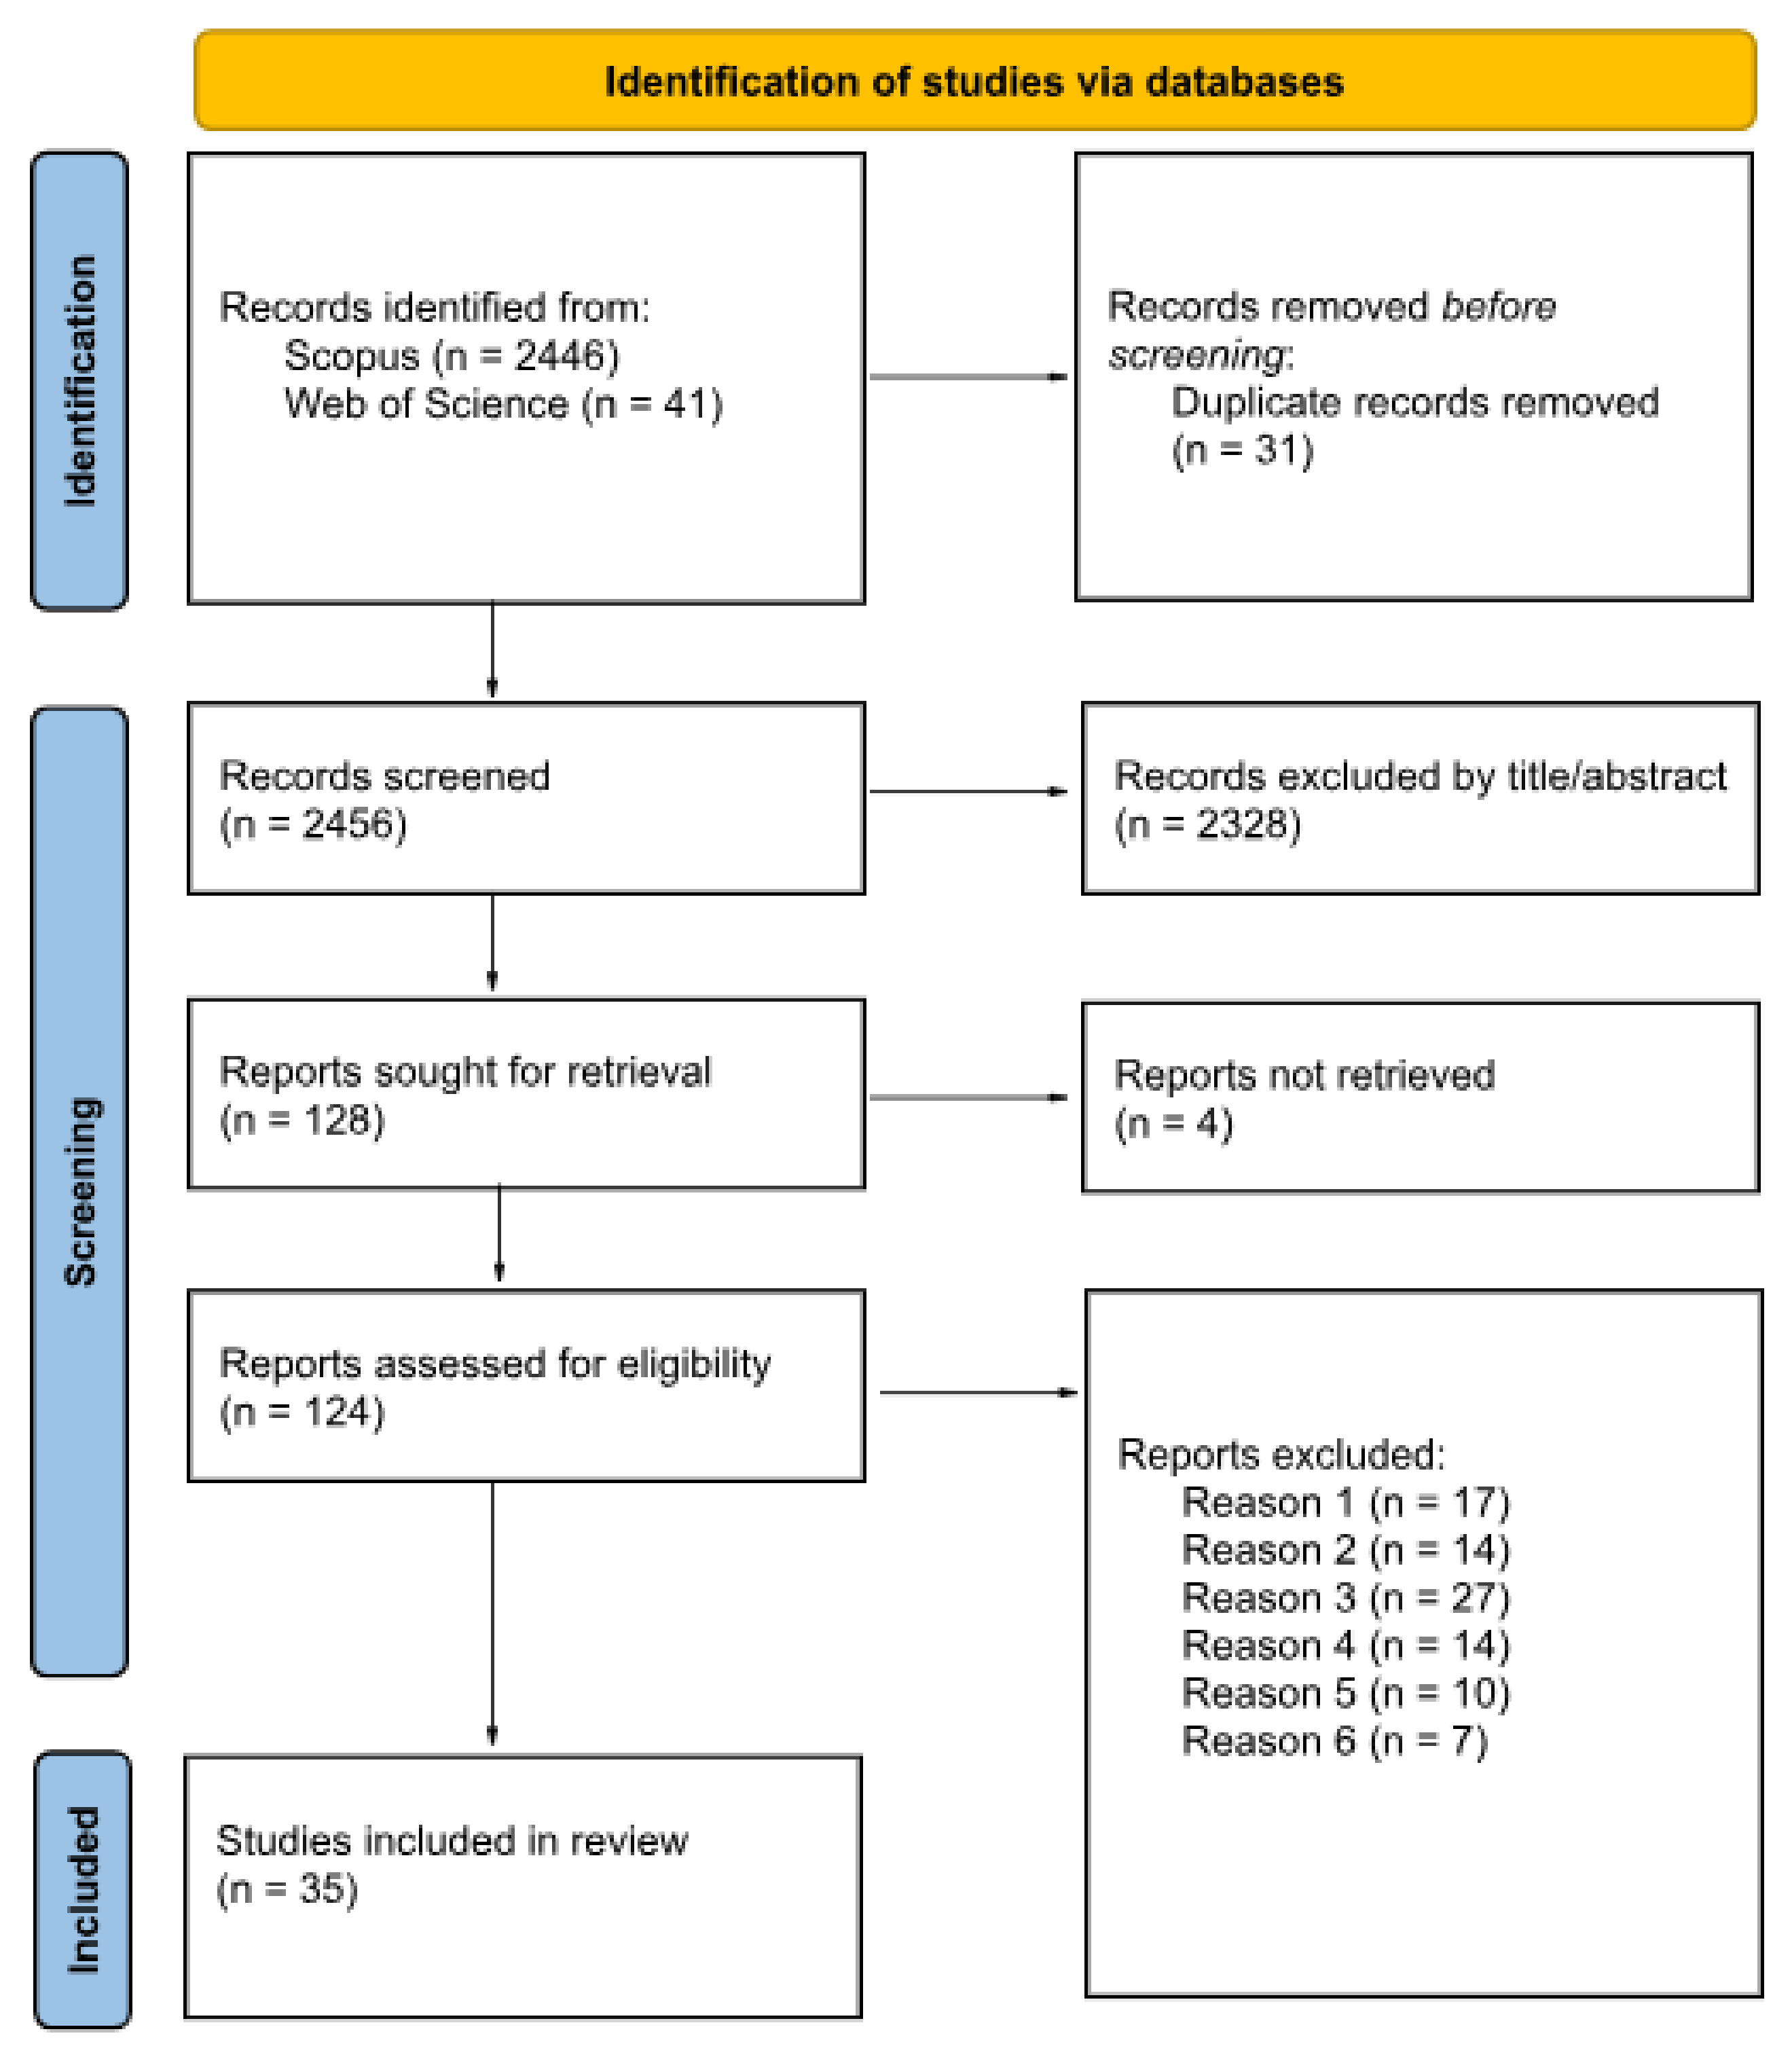
2.1. Search Strategy

The search process for the inception phase of PRISMA was conducted in September 2024 using the following databases: Scopus and Web of Science (WoS). The purpose of the search was to identify studies that (1) focused on classifying or identifying individual trees in (2) forested environments, (3) using cameras and other types of sensors (4) mounted on unmanned aerial vehicles (UAVs), and (5) employing techniques from the field of machine learning (ML). Based on the outlined search requirements, the standard query was structured into 5 blocks of terms, each corresponding to one of the specified conditions and connected by logical AND operators. Within each block, terms related to the respective condition were combined using logical OR operators:
("tree detection" OR "tree classification" OR "forest classification")
AND
("forest" OR "woods")
AND
("image" OR "high resolution" OR "RGB" OR "multispectral" OR "hyperspectral" OR "LiDAR")
AND
("drone" OR "UAV" OR "Unmanned aerial vehicle")
AND
("artificial intelligence" OR "machine learning" OR "deep learning" OR "neural networks")

2.2. Eligibility Criteria

Only manuscripts written in English that present a relevant work/study capable of answering the proposed research questions were considered. The following exclusion criteria were applied:
1.
The study focuses on an algorithm for the general segmentation of trees, but it does not include species classification or identification.
2.
The study focuses on the detection of generic tree parts (trunk, canopy, etc.).
3.
The study focuses on the identification or counting of trees in plantations of a single species.
4.
The study focuses on the classification of types of tree-covered areas.
5.
The study presents a proposed algorithm for parameterizing a tree (height, trunk thickness, etc.).
6.
The study is conducted in urban areas or uses satellite images.
7.
The manuscript corresponds to a conference paper or a thesis.

2.3. Article Selection

The list of articles retrieved from the searches was downloaded in CSV format and processed with a Python script to eliminate duplicates. The refined list was then exported to a spreadsheet to facilitate the review process. For the screening, the articles were divided into two groups, with each article being evaluated by two specialists.
During the initial analysis, the relevance of each article to the research questions was assessed based on the information in the title and abstract. Each article was assigned a label on a scale from 0 to 3 (0—irrelevant, 1—potentially irrelevant, 2—potentially relevant, and 3—relevant), following the approach used in previous scope reviews [13,14]. To ensure a well-rounded evaluation, one reviewer had expertise in remote sensing, while the other had expertise in ML techniques. Articles with an average score of 2.5 or higher were automatically advanced to the second phase, whereas those scoring 1 or lower were excluded. Articles with an average score of 1.5 or 2 were reassessed by an additional reviewer to determine whether they should proceed to full-text analysis or be discarded.
In the second phase, the articles selected for full-text analysis were reassigned to pairs of reviewers from the fields of remote sensing and ML, ensuring that the reviewers from the first phase did not reassess the papers they had previously evaluated. In cases of scoring discrepancies, an additional reviewer was assigned to resolve the decision.
The articles that advanced to the final phase underwent a comprehensive analysis, with a primary emphasis on extracting the following information: (1) location and type of area where the study was conducted, (2) hardware instruments used for data capture, (3) types of data captured, (4) workflow followed to achieve classification, (5) algorithms and software tools used in each activity, and (6) effectiveness of the methods employed.

3. Results

The PRISMA flow chart of article inclusion is shown in Figure 1. In the identification or database search process, 2487 articles were located, which were reduced to 2431 after duplicates were removed. During the screening phase, the title and abstract of these articles were evaluated by specialists, as previously explained, resulting in the removal of 2328 articles and the advancement of 128 to the next phase. Out of the 128 manuscripts, 4 were unavailable for download and review. In the full-paper analysis phase, 89 studies were excluded for falling under exclusion criteria defined in Section 2.3. The most common reason for exclusion (27 papers) was that the study focused on the identification or simple counting of trees in commercial monoculture plantations, rather than in forests. Additionally, a significant number of articles (17 of them) focused on the tree segmentation process only and did not perform identification of the species corresponding to each segmented tree.

3.1. Studies by Year
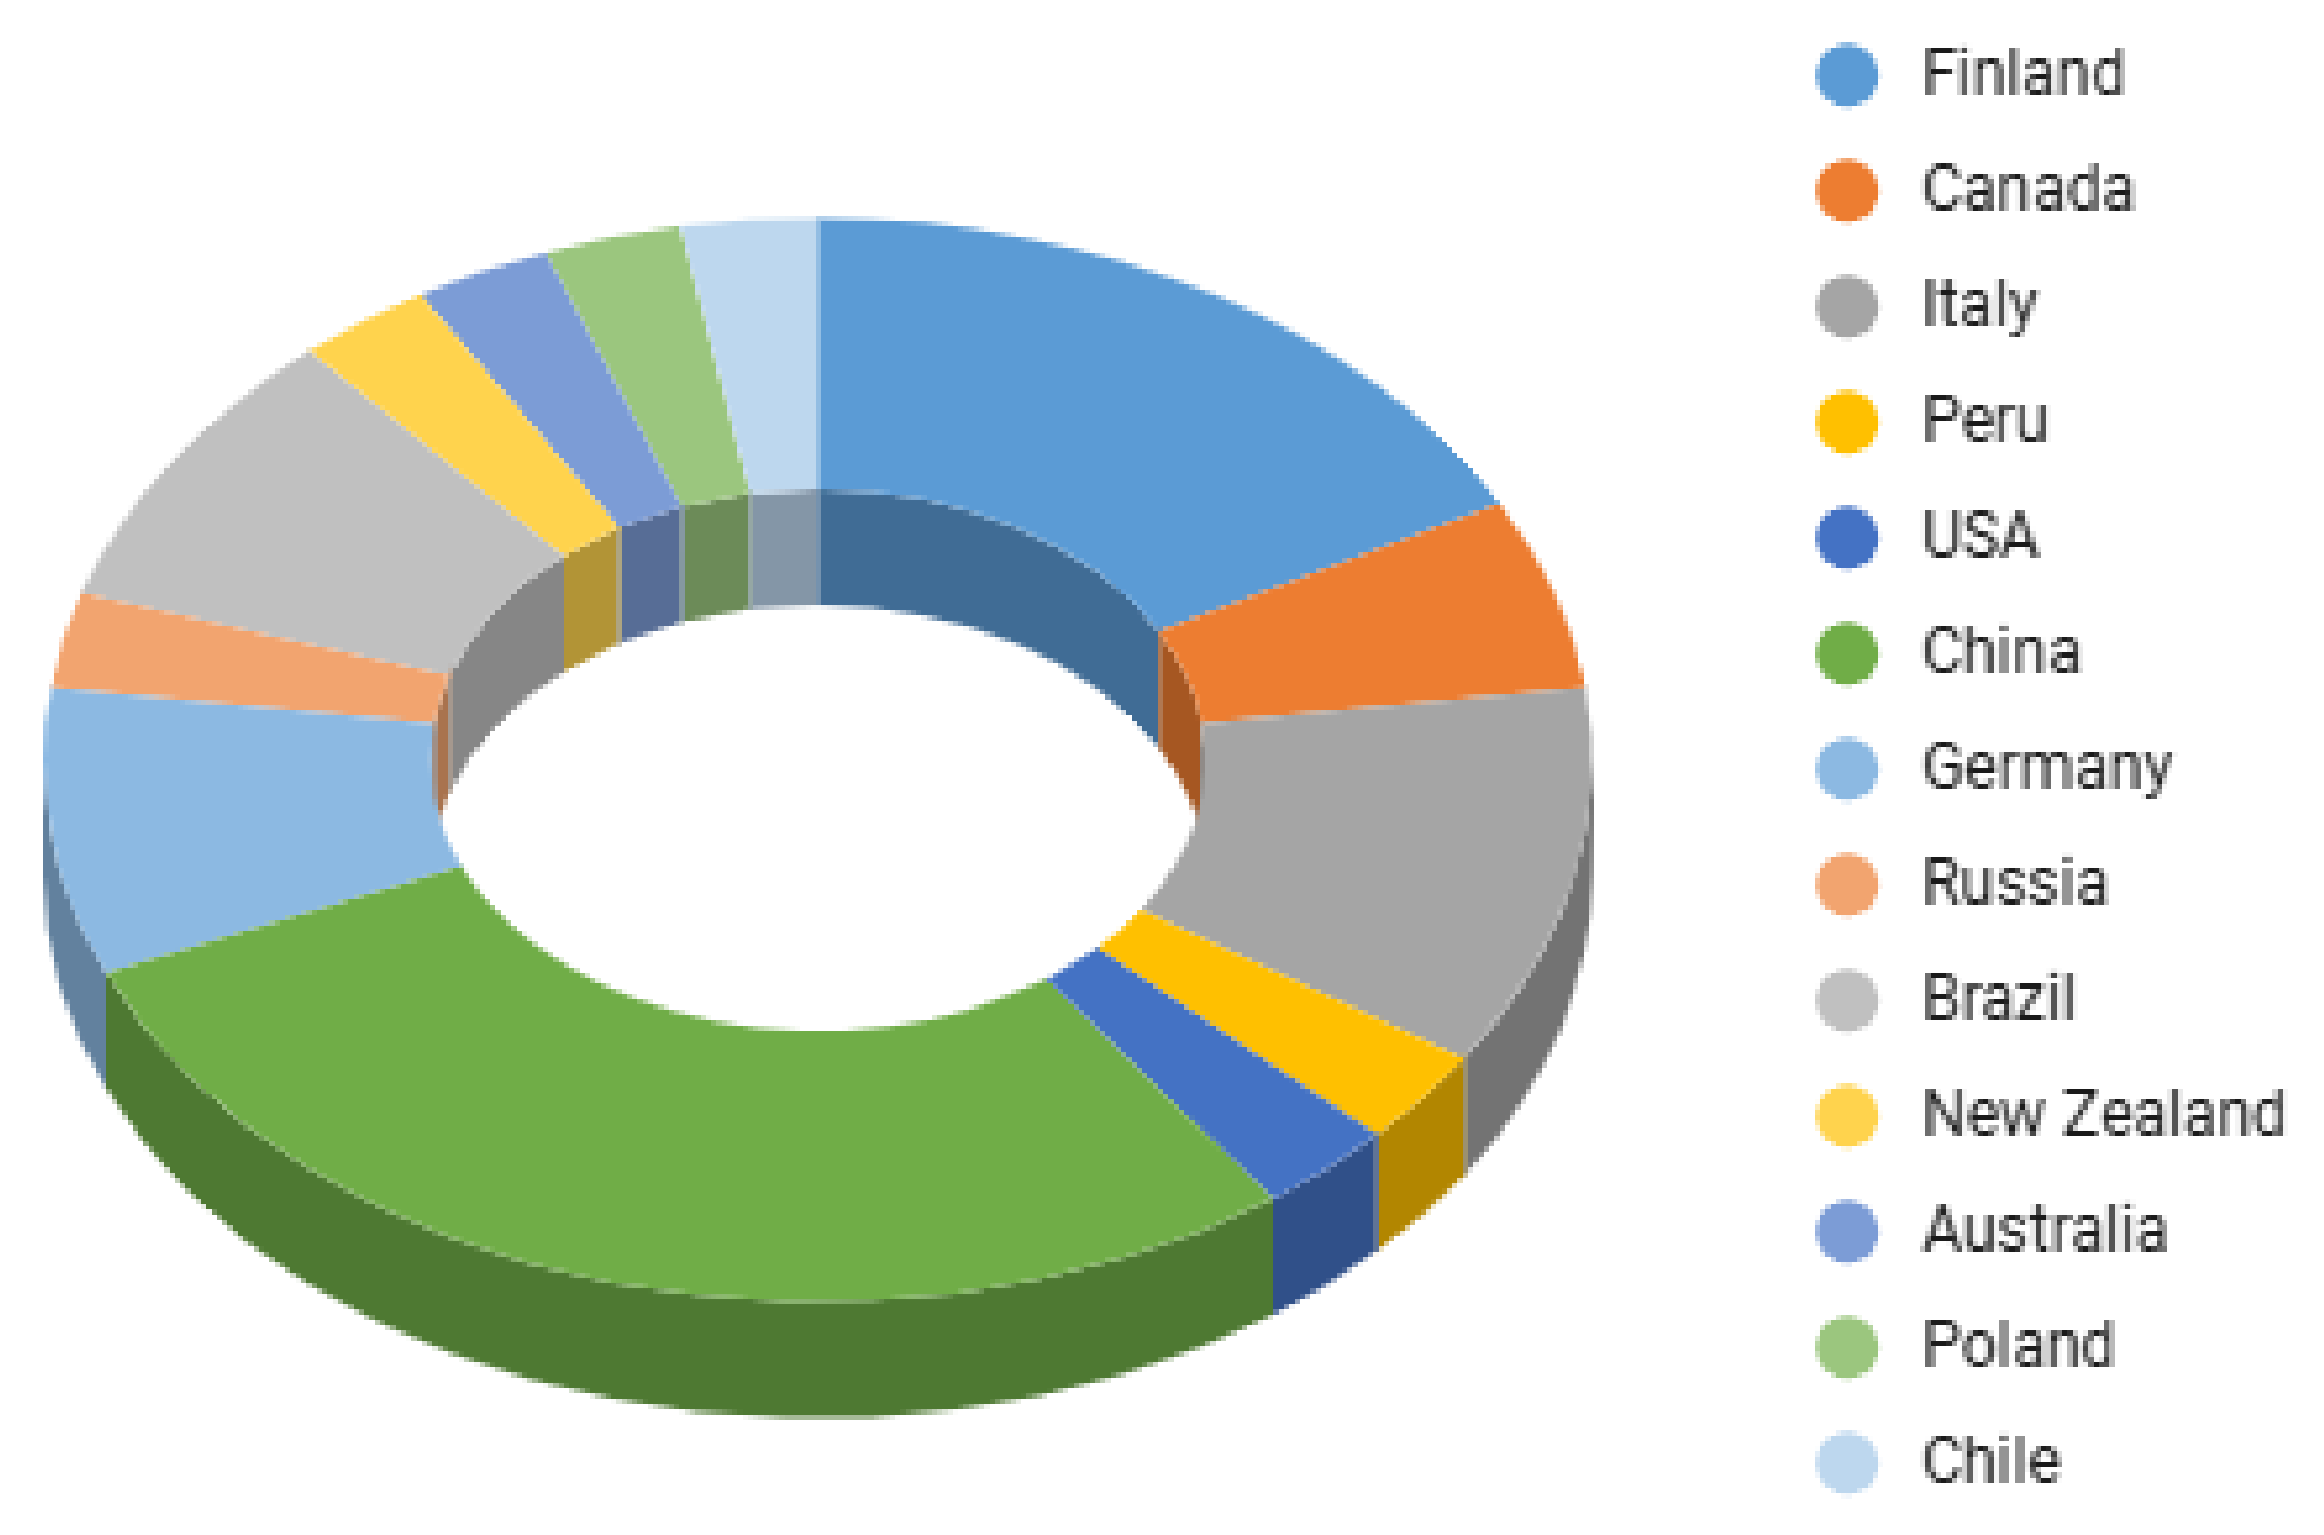
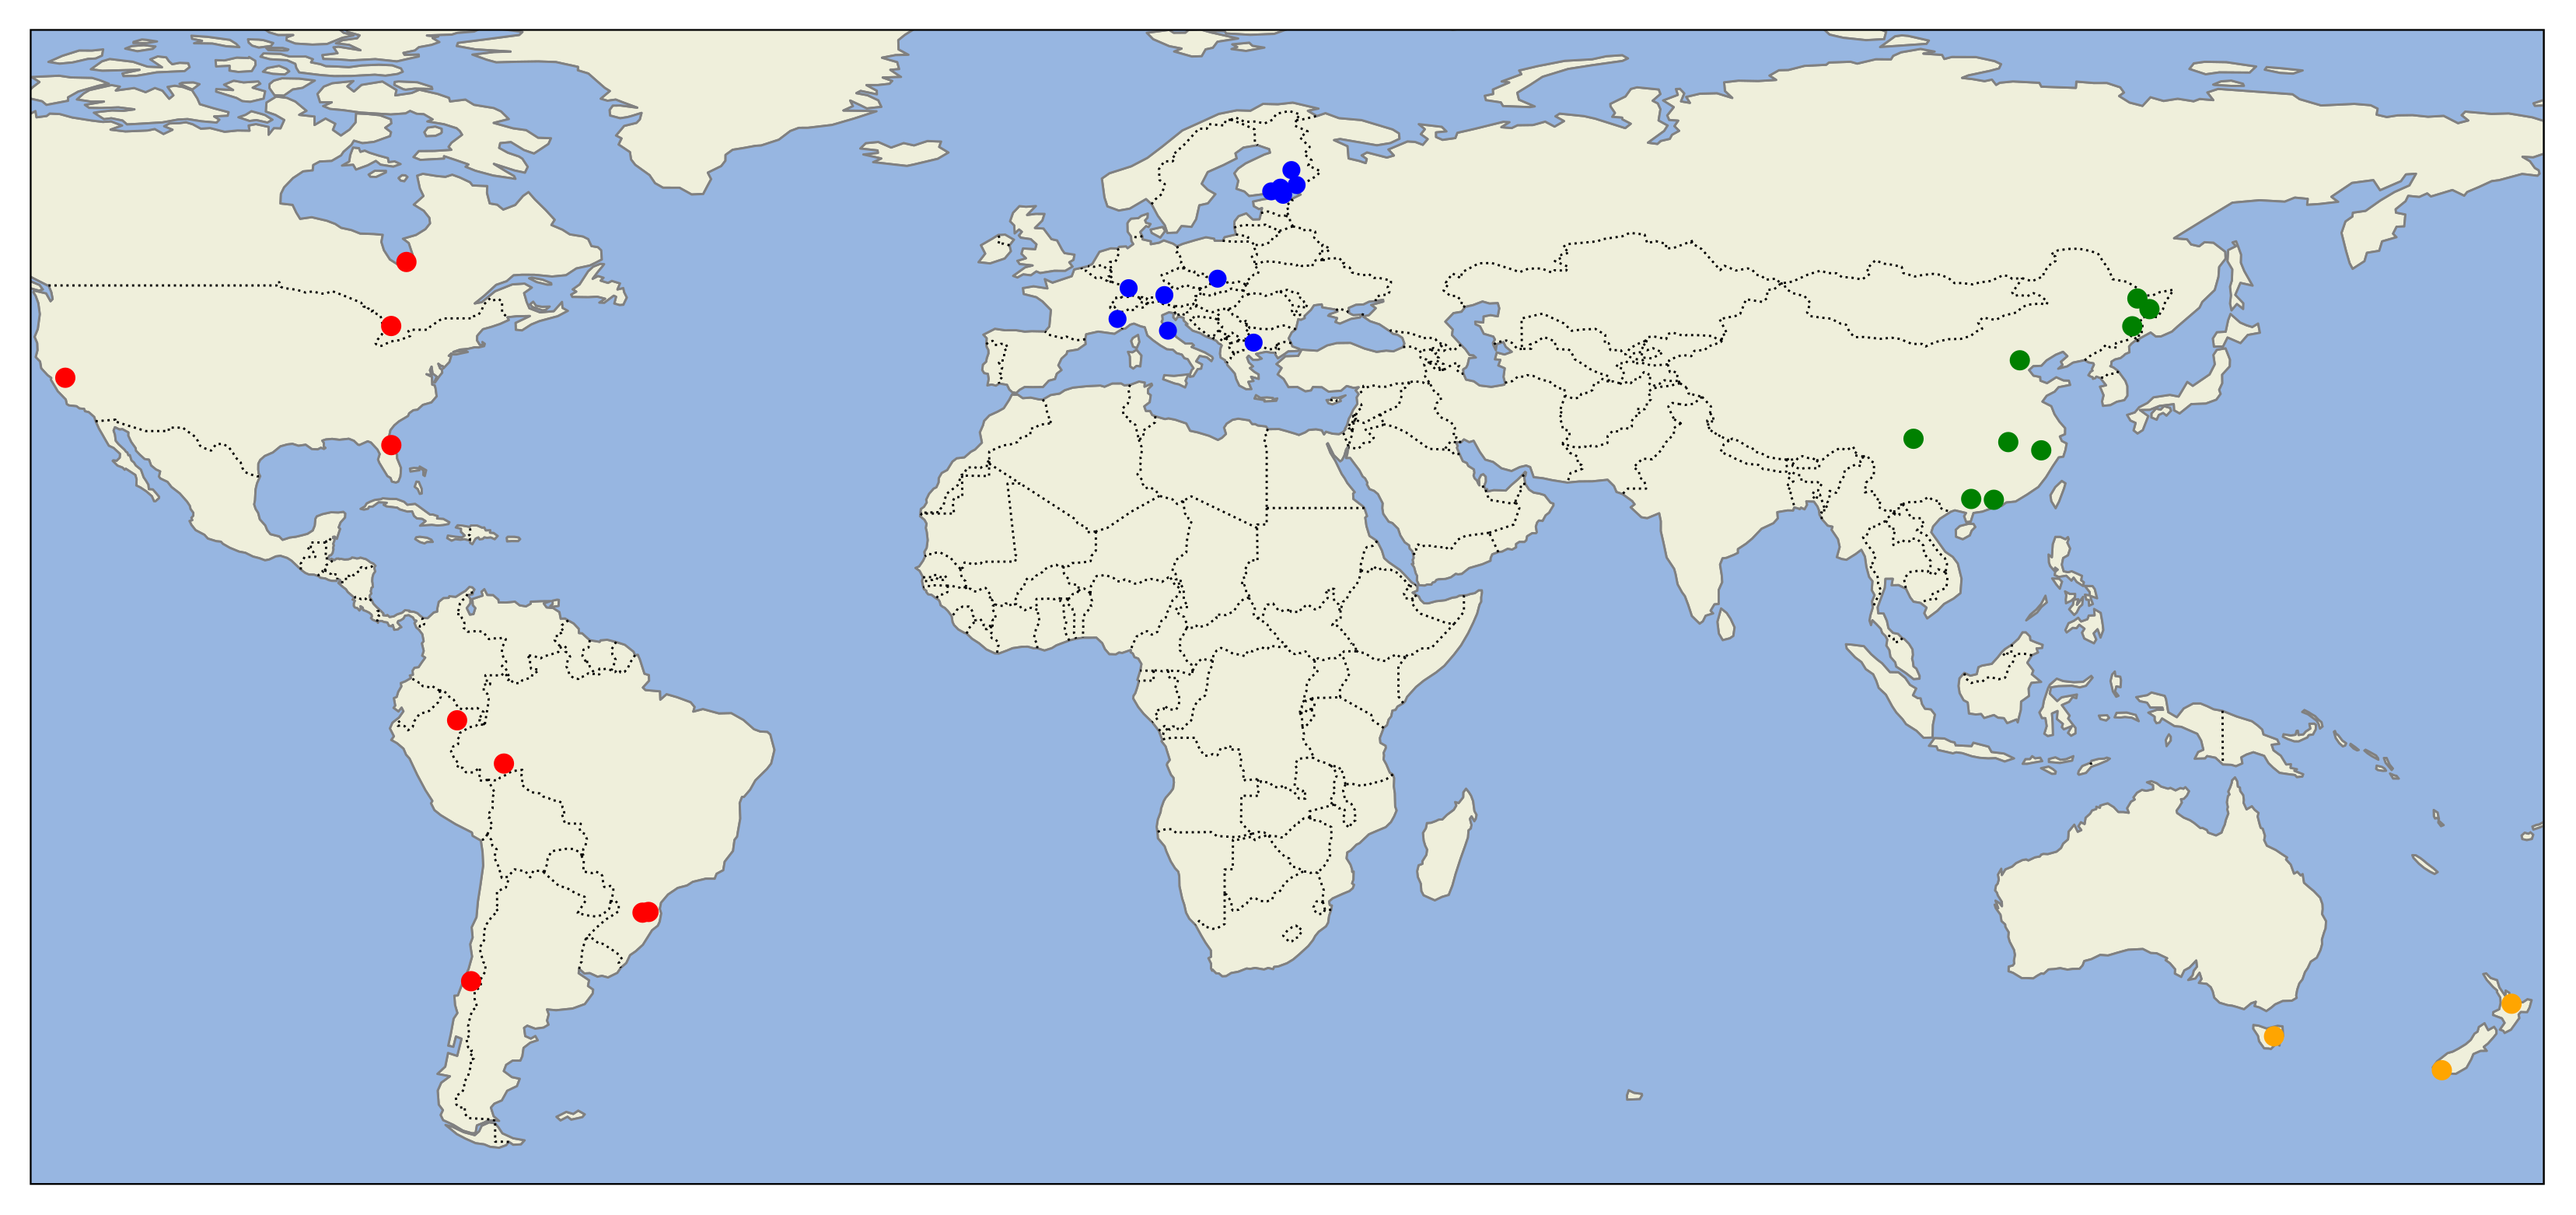
As previously mentioned, this systematic review covers studies from the last 10 years. However, only articles published from 2017 onwards met the eligibility criteria and were included in the final analysis, as shown in Figure 2. Notably, there is a significant increase in the number of relevant publications starting from 2021. This surge likely reflects recent advancements in drone technology, sensor resolution, and AI algorithms, which have facilitated more precise tree identification and classification in forest environments.
It is worth noting that while 2024 is included in the review period, fewer articles from this year met the eligibility criteria. This is likely because the search was conducted in early September, and some relevant papers may have been published later in the year. The concentration of studies in the last few years indicates a growing research interest and the potential for innovative applications of these technologies in forestry and biodiversity conservation.

3.2. Areas of Study

The analysis of author nationalities highlights the significant international interest in the classification and detection of individual trees using drone technology and AI. The most represented countries in this research area are China, Finland, Germany, and Brazil (Figure 3). These countries are actively investing in forestry research, driven by the need to monitor forests, ensure biodiversity conservation, and promote sustainable forest management.
  • China leads in the number of contributing authors (28%), reflecting the country’s increasing focus on technological solutions to forestry challenges. This aligns with China’s extensive forested regions and rapid advancements in AI and drone technologies.
  • European countries (37%), especially Finland, Germany, Poland, and Italy, show strong participation. This reflects Europe’s commitment to sustainable forestry practices and biodiversity protection, supported by policies and initiatives aimed at environmental conservation.
  • In the Americas (23%), contributions come predominantly from Brazil, Canada, and the United States. The presence of diverse and ecologically rich forests, such as the Amazon Rainforest and North American temperate forests, drives research interest in these regions.
This geographical diversity among authors ensures a broad spectrum of perspectives, methodologies, and insights, enriching the field and enabling the development of globally applicable solutions for tree classification and detection.
Figure 4 illustrates the locations where the studies included in this review were conducted. These studies span a diverse array of forest environments worldwide, underscoring the robustness and versatility of tree classification methodologies across different ecological contexts.
  • China (9 studies) is the most frequent study location, with multiple sites such as the Mao’ershan Experimental Forest Farm [15], Haizhu National Wetland Park [16], and Hongya Forestry Farm [17]. This reflects China’s commitment to leveraging advanced technologies for managing its extensive and diverse forest resources.
  • The Americas (8 studies) show a wide geographical dispersion, including locations in Brazil (e.g., Embrapa Forest [18], Ponte Branca Forest [19]), Peru (e.g., Iquitos [20]), and Canada (e.g., Ontario). These regions offer a variety of ecosystems, from the tropical rainforests of South America to the mixed forests of North America.
  • Europe (12 studies) covers locations in Germany, Italy, Poland, and Finland. In Germany, studies are conducted in the Black Forest and Kranzberg Forest [21]. Italy contributes with studies in the Alps and the Marche Region [22], while Poland adds insights through research in Bielsko-Biała [23]. Finland features prominently with studies carried out in Evo [24], Kouvola [25], Eastern Finland [26], and Vesijako Forest [27]. These locations encompass data from temperate and boreal ecosystems. Together, these studies provide data from managed and natural forests in various climatic zones across Europe.
  • Other notable locations include Australia (e.g., Swansea, Tasmania [28]) and New Zealand (e.g., Tauranga [29]). These sites cover unique ecosystems like alpine, subtropical, and tropical forests, enhancing the applicability of the findings.
This global distribution ensures that methodologies are tested under diverse conditions, including variations in species composition, forest density, topography, and climate. The findings from these studies contribute to developing more robust and adaptable techniques for forest management, conservation, and biodiversity monitoring.

3.3. Tree Identification Tasks Workflow

Most of the analyzed papers follow a regular tasks workflow, depicted in Figure 5. This general process is divided into four main stages: Acquisition, preprocessing, segmentation, and classification.
Acquisition involves collecting data using aerial platforms, primarily drones, with helicopters [23,24] or light aircraft platforms [16,30] used in rare cases. These platforms carry one or more of the following instruments:
  • LiDAR (Light detection and ranging);
  • GPS for positioning, with optional RTK (real-time kinematic) systems for enhanced accuracy;
  • Image capture cameras, such as RGB, multispectral imaging (MSI) and/or hyperspectral imaging (HSI).
LiDAR is a remote sensing technology that uses laser pulses to measure distances and create highly accurate 3D representations of surfaces and objects [31].
Real-time kinematics (RTK) is a technology that enhances the accuracy of GPS measurements by using correction data from a network of ground-based reference stations. It works by transmitting real-time corrections to a GPS receiver, reducing errors caused by factors such as atmospheric conditions, satellite orbit deviations, and clock inaccuracies. This method provides positional accuracy at the centimeter level, significantly improving the precision of geospatial data collected from aerial platforms like drones [32].
RGB, MSI, and HSI are essential technologies used for capturing and analyzing environmental data. RGB imaging, commonly found in standard cameras, captures light in red, green, and blue wavelengths, creating natural-color images that resemble human vision [33]. MSI extends this capability by recording data in specific spectral bands, including visible and near-infrared (NIR) light, enabling the detection of vegetation health, hydric stress, and other features not visible to the naked eye [34,35]. HSI imaging goes even further, capturing hundreds of narrow spectral bands across a broader range of the electromagnetic spectrum, providing highly detailed spectral information for each pixel [36].
Preprocessing prepares raw data for subsequent stages that extract the information of interest. Typically, this step integrates individual camera captures (RGB, MSI, and/or HSI) into a single global image known as a mosaic. When the mosaics are geometrically precise and allow for accurate measurements, they are referred to as orthophotos, which are created through exact orthogonal projection. MSI/HSI images often undergo radiometric corrections either prior to or during orthophoto generation. These tasks are performed using advanced photogrammetry software.
The data obtained from a LiDAR device forms a point cloud, representing the coordinates of points where the laser reflects. In some cases, the intensity of the reflected signal is also used for information extraction. In this case, the information is a 3D voxel mesh [26]. When LiDAR is unavailable, structure from motion (SfM) [37] can be used to generate point clouds from images [38], known as photogrammetric point clouds (PPCs). These PPCs, combined with digital surface models (DSMs)—which are 3D computer graphics representations of elevation data for representing terrain or overlapping objects [5]—are used to produce canopy height models (CHMs), which map vegetation height.
The purpose of segmentation is to identify the pixels in an orthophoto belonging to each region of interest (ROI), which, in this context, are the individual trees or, frequently, their crowns. Most of the reviewed papers use CHMs for segmentation. Although CHMs are not strictly images, they are processed using image analysis algorithms. Region-growing methods are the most common approach for crown segmentation from CHM data, with watershed and object-based image analysis (OBIA) being particularly prevalent [15].
Classification assigns species labels to regions of interest (ROIs) detected during segmentation. Currently, this is invariably achieved using ML methods. Traditional ML approaches utilize relatively simple models but typically require reducing raw input data to a smaller set of features. In contrast, modern deep learning (DL) techniques rely on complex neural networks formed by a multitude of interconnected nodes (each consisting of a linear regressor followed by a non-linear function) and organized hierarchically in multiple layers. These networks can directly process raw data (or with minimal preprocessing), as their initial layers automatically perform a task similar to the extraction of relevant features. In particular, the most widely used DL models in this field are variants of convolutional neural networks (CNNs) specifically designed to process data with a grid structure, such as images, through the automatic and hierarchical extraction of features [30]. In these architectures, the initial layers are essentially elements that perform convolutions, thereby enabling the detection of local spatial patterns in the input image.
In most studies, the raw data used for classification are pixels from orthophotos within the detected ROIs. A few papers [19,26,39,40] also use LIDAR reflection intensity. Feature extraction methods are sometimes statistical, involving computations such as averages and variances. Another commonly used method is principal component analysis (PCA), which reduces the data to a subspace tailored to the specific problem. Among classical ML methods, the most commonly used are [41] random forest (RF), a classification or regression model that aggregates the predictions of multiple random decision trees using majority voting or averaging to produce the final outcome, support vector machine (SVM), a prediction model that finds the optimal hyperplane that separates classes in the data by maximizing the margin between the closest classes, and multi-layer perceptron (MLP), a basic form of artificial neural network.

3.4. Instruments

In this section, sensors and flying platforms that are used in the literature are revised and classified.

3.4.1. Drones

Drones play a key role in tree identification within forest environments, providing both versatility and efficiency in data collection across diverse forested areas. As summarized in Table 1, the identified studies primarily use multirotor drones (77%), such as the DJI Phantom 4 RTK and DJI Matrice series (200/210/300/600), due to their stability, maneuverability, and ability to carry multiple sensors. These drones excel in small-to-medium-scale surveys requiring detailed imagery, particularly in environments with complex terrain where precise maneuvering is needed.
Quadcopters, with nine models listed in Table 1, are the most frequently used type of drone in forestry applications due to their versatility and ability to carry different sensors. Their stability makes them effective for small-to-medium-scale studies requiring high-resolution data. Hexacopters, with three models, such as the DJI Matrice 600 Pro and Pegasus D200, offer increased payload capacity and enhanced stability, making them suitable for medium-scale surveys or when multiple heavy sensors are used simultaneously.
Octocopters, represented by the Okto-XL, are utilized in specific scenarios requiring high payloads or redundancy for safety, though their usage is less common compared to quadcopters and hexacopters.
Fixed-wing drones (17%), such as the SenseFly eBee Plus RTK and Avartek Boxer, are preferred for larger areas due to their longer flight endurance and ability to cover vast regions efficiently. Additionally, specialized UAVs like the ING Robotic Responder and helicopter-based platforms, also referenced in the table, offer flexibility for tasks in rugged terrains or locations requiring high-altitude surveys.
The European Union Aviation Safety Agency (EASA) categories, as outlined in Table 1, classify drones based on their weight and intended use, providing a general framework for understanding their operational scope. EASA classifies drones into five categories based on weight and operational risk. Categories C0 and C1 apply to drones weighing <250 g and <900 g, respectively, typically used for recreational purposes with minimal risk. Category C2 is specifically designed for operations near people, requiring higher pilot qualifications and certification to ensure safe handling. Category C3 and higher cover larger drones, up to 25 kg, intended for professional or industrial applications in areas without people to minimize safety risks [55].
As shown in Table 1, the majority of the studies (around 47%) use drones from category C3. This reflects that the flight platforms required to capture data need to support significant weights due to the data collection instruments they must carry, which, in some cases, may exceed 20 kg (as will be addressed in the following section).

3.4.2. Data Acquisition Instruments

The integration of advanced sensors into tree identification studies highlights the strategic use of technology to gather detailed data on forest environments. By combining RGB cameras, MSI, HSI, and LiDAR, researchers address diverse study requirements, from species identification to forest structure analysis. The following summary, based on data presented in Table 2, reflects the global trends in sensor utilization for these studies.
The majority of studies (74%) employ RGB cameras in various configurations. Notably, 23% of these studies rely exclusively on RGB sensors, representing a low-cost solution that has proven effective across a wide range of contexts. A slightly larger proportion, 32%, utilizes a combination of RGB cameras with sensors capable of capturing a broader spectral range—namely, MSI or HSI—which enables the acquisition of detailed spectral signatures and high-resolution imagery. Meanwhile, 14% of the studies incorporate a combination of RGB and LiDAR sensors. This configuration supports applications such as forest inventory and terrain modeling, where spatial accuracy is essential. When considering all sensor combinations that include LiDAR, this laser-based technology is employed in 34% of the studies. LiDAR facilitates the generation of high-resolution point clouds, i.e., 3D models of the environment under study. These models are crucial for extracting structural features and, more importantly, for streamlining the segmentation process. Point clouds are so essential that, in studies where LiDAR is not used, point clouds are often generated through photogrammetry from RGB imagery. Although this approach yields lower-resolution models compared to those obtained with LiDAR, they are generally sufficient for accurate segmentation in most applications.
HSI or MSI sensors without accompanying RGB cameras are used in 31% of the studies [5,19,24,30,39,40,47,57]. These setups focus on advanced spectral measurements; however, it is important to note that HSI/MSI sensors typically include RGB bands, albeit at a lower spatial resolution. Approximately 17% of the studies combine HSI sensors with LiDAR systems. This configuration prioritizes the integration of spectral and 3D structural data, which is particularly valuable in forests characterized by complex canopies or high levels of biodiversity.
Lastly, a single study [26] relies solely on LiDAR systems. This study demonstrates that the combination of LiDAR spatial (from laser time of flight) and texture features enables the accurate classification of individual tree species, validating the feasibility of LiDAR-only approaches for species identification in boreal forests. Comprehensive configurations that include HSI, RGB, and LiDAR technologies account for approximately 10% of studies, providing spectral richness, structural detail, and high-resolution visual data for robust analysis.
These trends, detailed in Table 2, underline the adaptability of sensor configurations to diverse forestry research needs, balancing spectral, structural, and spatial data for comprehensive ecosystem analysis.
The specific instruments used in the analyzed studies are presented in Table 3, Table 4 and Table 5. Table 3, in particular, provides a systematic overview of the RGB cameras employed in the reviewed research, highlighting their resolutions and contributions to forestry studies.
These cameras demonstrate a wide range of resolutions, with most (66%, including generic cameras) falling between 15 and 25 MP. This range is generally sufficient for high-resolution data acquisition in forestry studies, particularly when paired with drone flights that typically operate below 100 m in altitude. For example, a 20-megapixel camera flying at 80 m can achieve a ground sampling distance (GSD) of approximately 1–2 cm per pixel [21], which is more than adequate for detailed mapping and monitoring of individual tree canopies. High-end cameras, such as the PhaseOne iXU 100 MP with its 100-megapixel resolution, offer exceptional detail for specialized applications [23], while more common models like the Canon 100D (18 MP) or Sony Nex-7 (24.3 MP) provide a balance of performance and accessibility for routine forestry tasks [20]. This variety in camera specifications reflects the adaptability of RGB imaging to different study requirements, ensuring that researchers can select the appropriate tool based on their resolution needs and operational constraints.
Table 4 compiles MSI sensors used in forestry studies, focusing on their spectral bands and typical applications. The most commonly used MSI cameras in the analyzed studies are the Parrot Sequoia (utilized in 40% of the studies employing MSI) and the MicaSense RedEdge-MX (featured in 30% of these studies). These are relatively lightweight devices that incorporate signal capture in the NIR, specifically in the 785–795 nm bands for the former and 717–840 nm bands for the latter. These sensors are very suitable for analyzing vegetation health and are extensively used in agriculture applications [58].
Table 5 provides an overview of HSI sensors, detailing their spectral ranges and the number of bands utilized. These sensors provide information for distinguishing tree species by capturing fine-grained spectral data across extensive wavelength ranges.
HSI cameras capture detailed spectral data, offering unique spectral signatures for materials, including tree species. Most devices focus on the visible and near-infrared (VNIR) range (400–1000 nm), ideal for vegetation studies due to its sensitivity to pigments, water content, and structural variations. Instruments like AVIRIS and the NEON Imaging Spectrometer cover a broader range (380–2500 nm) with over 400 bands, providing high-dimensional data but at the cost of weight and portability (e.g., AVIRIS weighs 100 kg). Compact options like the Rikola FPI (40 bands, 2–3 kg) and Resonon Pika L (281 bands, 1.5 kg) are more practical for field use but offer reduced spectral or band coverage.
To ensure the accuracy of HSI imaging, it is crucial to obtain correct reflectance spectra. The reflectance spectrum consists of measurements across a wide range of wavelengths, allowing for precise material characterization. HSI sensors aim to capture this spectrum as a key feature for classification. However, the quality of the acquired data depends significantly on illumination conditions. Ideally, the light source should be pure white (flat spectrum), but in most cases, available lighting deviates from this ideal condition. Therefore, radiometric corrections, such as spectral equalization, are necessary to compensate for these variations and ensure reliable spectral analysis.
Table 6 presents a summary of LiDAR sensors used for structural forest analysis, with details on wavelengths and applications. The data generated by these instruments enable the creation of accurate 3D models and are critical for understanding canopy density and tree height.
A notable trend is the predominance of sensors from the manufacturer Riegl, which offers several instruments with varying specifications. Additionally, the most frequently used wavelength bands are 905 nm and 1550 nm, both in the NIR region, and 1064 nm, with occasional use of the visible green band at 532 nm.
LiDAR systems typically operate at 905 nm (NIR), 1064 nm (NIR), and 1550 nm (SWIR), with each wavelength offering distinct advantages. The 905 nm band is versatile and ideal for lightweight UAV systems, while 1064 nm provides a balance between resolution and efficiency. The 1550 nm band, commonly used in Riegl systems, excels in eye-safe operations and atmospheric resilience, making it optimal for detailed 3D forest canopy models. The visible green 532 nm band, though occasionally beneficial for specific tasks like water penetration. Nevertheless, it is less common in structural forest studies due to the superior utility of NIR and SWIR wavelengths [59]. The preference for 1550 nm reflects its effectiveness in dense canopy environments and high-precision applications.

3.5. Preprocessing Algorithms

Preprocessing plays a core role in workflows for classifying tree species, as it ensures the raw UAV and remote sensing data are suitable for analysis. Various software tools are employed to process images, align datasets, extract features, and prepare data for ML models. The following Table 7 summarizes the most commonly used preprocessing programs across the reviewed studies.
In the category of image alignment and orthomosaic creation, Agisoft Metashape/PhotoScan was the most frequently used software, being referenced in five studies [25,27,28,42,52] for its robust capabilities in creating high-resolution orthomosaics. For specialized LiDAR data processing, LAStools [19,28] and LIDAR360 [15,40] emerged as the most utilized tools, cited in two studies each. In geographic information systems (GIS) and remote sensing tasks, ArcGIS stood out as the dominant software, appearing in ten studies [5,15,17,21,28,40,46,48,50,57], where it was employed for spatial analysis and georeferencing. Finally, for image annotation and preprocessing, LabelImg was identified as the most commonly used software, referenced in two studies [15,23] for its role in labeling and preparing datasets for ML workflows.

3.6. Tree Segmentation

Tree segmentation is a crucial preprocessing step in tree identification workflows. Its primary goal is to isolate individual trees or their crowns from raw data, such as LiDAR point clouds or orthophotos. This step converts unstructured datasets into meaningful units that can be utilized for forest inventory, biodiversity monitoring, and biomass estimation. Table 8 categorizes segmentation algorithms based on their approach and application. It highlights the diverse methodologies used to handle varying forest structures, data types, and analysis goals in remote sensing workflows.
Segmentation algorithms are chosen based on dataset characteristics, forest structure, and required precision. Among traditional methods, local maxima (CHM-based) appears in 4 out of 35 studies (11.4%), particularly in structured forests with dense canopies. MRS is applied in five studies (14.3%), especially for object-based analysis in dense forests. ITC Delineation is used in two studies (5.7%), while watershed and distance-based clustering is applied in four studies (11.4%), primarily for addressing overlapping tree regions.
ML-enhanced segmentation approaches, such as RF with pixel-based segmentation features, are the most commonly used, appearing in six studies (17.1%). These methods often integrate CHM data to analyze mixed forests, where pixel classification helps differentiate tree species and forest structures. Fuzzy k-nearest neighbors (FkNN) is used in one paper, while simple linear iterative clustering (SLIC) appears in two studies, particularly in heterogeneous and complex vegetation settings.
DL-driven methods are used in various tree segmentation approaches. U-Net and its variations appear in four studies (11.4%), particularly for dense canopies due to their ability to perform precise pixel-level segmentation. Mask R-CNN, which combines object detection and instance segmentation, is applied in three studies (8.6%). YOLO-based segmentation models that integrate segmentation and classification within a single framework are used in two studies. DeepLabv3+ and AMDNet each appear in one study.

3.7. Classification Techniques

In Table 9, the main ML algorithms used for classifying or identifying the species of a tree—delineated in a mosaic or orthophoto through the corresponding segmentation process—are presented.
As can be observed, among supervised ML algorithms, RF is the most widely applied, appearing in 12 studies (34.3%), achieving accuracy rates between 80% and 95% across different forest types and sensor data. Its robustness and adaptability contribute to its popularity in species classification studies. SVM is the second most commonly used method, appearing in five studies (14.3%), with reported accuracies ranging from 85% to 97%. Maximum likelihood is applied in two studies (5.7%), with reported accuracy values ranging from 55% to 87%, while error-correcting output codes (ECOCs) appear in one study (2.9%), achieving a 97% accuracy rate.
DL models have been applied in 13 studies (37.1%) for tree species classification. These models process MSI and HSI data by extracting complex patterns from high-dimensional datasets. Among them, ResNet-50 appears in three studies (8.6%), with reported accuracies between 92% and 97%. YOLOv8 has been used in classification tasks involving complex forest environments in two studies (5.7%), reaching 81% accuracy. DenseNet161 has been applied in one study (2.9%), with an accuracy of 72%. The implementation of DL models varies depending on data availability, species diversity, and the specific classification approach used in each study. The classification performance of these algorithms is summarized in Table 9.

4. Discussion

The studies analyzed in this systematic review highlight a wide range of UAV- and AI-based systems developed for tree species classification, all aiming toward similar—though contextually distinct—end goals. For instance, ref. [27] demonstrated the utility of individual tree classification for directly supporting biodiversity assessments and habitat monitoring. Belcore et al. [49] applied these technologies to map riparian habitats within the Natura 2000 Network, where tree-level data were essential due to the ecological significance of specific species in those environments. In Brazil, Pereira Martins-Neto et al. [19] focused on species classification in complex tropical forests to inform sustainable forest management and monitor ecologically or economically important species. Similarly, Tuominen et al. [25] evaluated the potential of tree recognition techniques in highly diverse forest ecosystems, aiming to enhance species-level inventories for conservation planning. These targeted applications underscore a growing trend: IA/UAV-based frameworks are being developed not only for structural forest analysis but also for specific ecological and management objectives, including habitat conservation [28], monitoring of rare or invasive species [5], and strategic forest resource planning.
The following subsections address in detail the research questions outlined in Section 2, aiming to analyze the findings obtained, identify the limitations of current systems, and explore potential avenues for future research.

4.1. RQ1—What Types of Instruments Were Used to Collect Data? (What Type of Data Is Collected?)

The main sensors identified in the reviewed studies can be classified into two primary types: optical sensors (cameras, which measure the reflection of natural light from an object’s surface) and LiDAR (which uses laser light to obtain spatial information based on “time-of-flight” data). Regarding the cameras, options found in the literature are RGB cameras, MSI, and HSI. In Table 2, we can see that RGB is the most used option, whereas MSI is the second one and HS follows closely. The biggest representation of RGB cameras is clearly due to their availability (most commercial drones are sold with a built-in RGB camera, and there are also many examples of compatible models). Low price is also an advantage for RGB cameras, whereas MSI can be considered an expensive option (about 5000 euros for a Micasense Rededge-MX and up to triple for more advanced options). HS cameras are even more expensive and they are also of heavy weight, thus requiring a more powerful flying platform.
For all cameras, it is important to perform some radiometric correction to take into account the wavelength spectrum (color) of the natural illumination present at capture time. None of the revised papers describe a correction for RGB cameras. Nevertheless, in RGB cameras, some correction is already built into the camera firmware (AWB: automatic white balance). MSI cameras normally use a special sensor connected to the camera that should be placed in the upper part of the flying platform (looking into sky). For any kind of camera—especially HSI-type cameras—an “offline” correction can be made for measuring light by photographing a calibration target and using these images for software correction during the preprocessing stage.
Many papers test more than one type of camera, mainly to explore different options to choose the best-performing one for later production use.
Notably, there are no examples in the reviewed studies of thermal cameras, which capture temperature information from emitted thermal infrared light (3–14 µm). This suggests that temperature data are not a key discriminant in these cases. Moreover, thermal cameras are usually expensive and capture images of very low resolution and low contrast, which makes it difficult to construct an orthophoto or even a simple stitching. Probably for all these reasons, no author considers it worthwhile to test the thermal camera option.
In most studies, the information obtained from cameras is used for classification tasks. As an exception, in [26], the authors explore the possibility of using LiDAR reflection intensity as a 3D texture information, obtaining a 3D volume of cubic voxels with mean value of reflection intensity instead of a regular 3D point cloud that contains only geometrical information obtained through the time of flight of the laser radiation.
HSI generally produces the best results, but the advantage over RGB or MSI cameras is not significantly large. However, HSI devices are considerably more expensive and complex to operate. Results for RGB and MSI cameras are very similar. Note that an RGB image can be obtained from most MSI cameras. The availability of an NIR band is interesting for studying vegetal masses (for example, the NDVI index can locate vegetation and is computed from NIR and red bands). However MSI cameras normally have lower resolution than RGB cameras.
LiDAR sensors primarily provide spatial information and are widely used for segmentation tasks. Some of the latest studies employ DL methods for segmentation directly on optical images ([15,18,39], see Table 8). However, due to the high cost of LiDAR sensors, many studies opt for SfM algorithms to derive spatial information from standard images.
Another crucial category of instruments used in the reviewed studies is the flying platform that carries the sensors. Almost all platforms, except for a few exceptions, are UAVs. The exceptions involve a helicopter [23,24] and a manned airplane [16,30]; these references were included due to the significance of their implemented processes.
Among available drone types, the choice of platform is generally not critical as long as it supports the selected sensors. HSI and LiDAR sensors are heavier, requiring more powerful aircraft. Many studies utilize widely available multicopter models equipped with built-in cameras, such as the DJI Mavic or Phantom IV/V. When studying more than one type of sensor, it is desirable to use a platform that is able to carry all the sensors at the same time so that comparisons can be made using images from the same temporal moment.
Fixed-wing drones offer greater efficiency in terms of coverage per flight due to their longer battery life, extended flight range, and ability to fly at higher altitudes. However, this latter advantage comes at the cost of slightly reduced image resolution. With any chosen flying platform, it is very important to properly adjust the relation between platform speed (m/s) and the image capture rate (time between two consecutive captures). From this relation, the overlap between two consecutive images can be obtained. For a proper orthophoto calculation, an overlap of about 70–80% is needed.
The reviewed studies highlight that while HSI provides the best classification results, its advantages over RGB and MSI cameras are often marginal given its higher cost and operational complexity. LiDAR remains a preferred choice for spatial data but is frequently replaced by SfM due to budget constraints. UAVs, particularly multicopters and fixed-wing drones, are the predominant platforms, with the latter being more efficient for large-scale data collection.
As a possible working line related to this research question, it would be valuable to design and test a specialized payload for forest monitoring that incorporates multiple sensor types. A basic implementation could utilize a simple CPU, such as an Arduino or Raspberry Pi, connected to both an RGB camera and an NIR camera (like the Raspberry Pi NoIR camera). This setup would capture essential wavelengths in the visible and near-infrared spectrum. In addition to forest monitoring, this development could have applications in agriculture and other fields, offering a cost-effective alternative to MSI cameras.

4.2. RQ2—What Type of AI Algorithms Were Used for Tree Identification/Classification?

The literature review has shown that, until two or three years ago, the most commonly used AI algorithms for tree species identification, following a prior segmentation process in a mosaic, have predominantly belonged to the category of classical ML methods. Among these, various variants of the RF and SVM classification algorithms stand out.
However, in the past two to three years, CNN variants like ResNet have gained prominence and become the preferred choice due to their superior ability to extract and process features efficiently. This trend aligns with the findings in [60], who also identified a growing reliance on DL models for tree species classification.
While classical ML models have demonstrated strong performance in various studies, they have a significant limitation: they require a complex and often labor-intensive process of selecting and extracting relevant features. Unlike DL models, classical prediction algorithms cannot process raw data directly; instead, the data must be transformed and compressed into representations that effectively characterize the segment to be identified (as mentioned earlier in Section 3.3).
Various studies have identified a wide range of features that serve as effective discriminators in classification tasks across different contexts. These include spectral indexes, vegetation indexes, spectral derivatives, texture features, echo features, structural metrics, and shape/geometric measures. These features can be extracted using two main approaches: (i) pixel-based methods, where features are extracted from individual pixels within an image, as seen in [50,57]; and (ii) object-based methods, where features are extracted from segmented tree crowns [50]. In the latter approach, segmentation can be performed using techniques such as multi-resolution segmentation, superpixels, or individual tree bounding boxes [28]. Additionally, the CHM can assist in extracting spectral features from tree crowns while minimizing the influence of ground vegetation [25].
Feature selection is a crucial step in this process, as it begins with an initial set of numerous potential candidate features. Since it is not possible to determine a priori which features will be the best discriminators, they must be evaluated systematically, and those that do not contribute meaningfully—or even degrade classification performance—should be discarded. Several feature selection techniques have been employed in the different works, including the following: (i) recursive feature elimination with cross-validation (RFECV), a greedy algorithm that iteratively eliminates insignificant features to determine an optimal subset [39]; (ii) correlation-based feature selection (CFS), a method that prioritizes subsets with high correlation to the class label while maintaining low internal correlation among features [27]; (iii) sequential forward floating selection (SFFS), a search strategy used with a separability criterion, such as the Jeffries–Matusita distance, to select the most significant features [56]; and (iv) RF importance, where the Gini coefficient can be used to assess feature importance, retaining highly significant features while discarding those with low importance values [49]. As can be inferred, this feature engineering process represents a considerable workload in tree identification systems.
The use of models from the DL field, such as CNNs, significantly mitigates the process of feature identification and selection. DL algorithms, specifically neural networks, are models organized into numerous layers, which are directly fed with raw data (or after simple preprocessing). The initial layers of the model function similarly to a feature extraction process, while the final layers are the ones that actually perform the classification. This is why, in principle, systems based on DL models are easier to design. However, DL based systems are not without their drawbacks. DL models are inherently complex, involving a large number of internal parameters that must be optimized for effective performance. As such, training a DL model requires substantial computational resources and, critically, a large volume of data for proper training. The latter is often a significant limiting factor. It is worth noting that, in the vast majority of the studies reviewed, data collection for training is performed manually. Researchers must traverse large forested areas, geolocating and individually identifying trees by hand.
For this reason, the use of DL models remains quite limited. However, these models are expected to dominate in the coming years, as various convolutional network architectures have proven highly successful in numerous computer vision applications. In this regard, there is a notable absence of models based on state-of-the-art neural network architectures among the reviewed works, particularly transformer-based models such as Vision Transformers (ViT) [47]. These models are of extremely high complexity (with trillions of parameters) but offer the potential for very high effectiveness.
Using DL models based on transformers eliminates the need for feature engineering but requires vast amounts of data, as previously mentioned. Therefore, efficient data acquisition methods are necessary, combining manual data collection techniques with automatic data generation methods (such as data augmentation or synthetic data generation). It is also important to note that once DL models are trained for a specific task (such as identifying a particular tree species), they can later be fine-tuned with a relatively small amount of training data for similar tasks (like recognizing a different species). This technique, known as “transfer learning”, not only enables the reuse of existing models but also supports the development of increasingly generalizable models that can be applied (or easily adapted) to contexts different from those for which they were originally designed.
An interesting approach found in the analysis of articles is the use of multimodal classification architectures [4], where different neural network models are applied to distinct types of data (e.g., a CNN for RGB data and a PointMLP network for DCP data). The outputs of these models are treated as features that are fed into a final neural network, which performs the final classification. These hybrid approaches have been relatively underexplored so far but show high potential for performance. They eliminate the need for feature engineering while simultaneously reducing the requirement for vast amounts of training data.
Finally, it is important to highlight the use of DL models that enable simultaneous segmentation and classification. For instance, in [15], a model based on the You Only Look Once (YOLO) algorithm is employed. Integrating segmentation and classification into a single process not only streamlines the workflow but also has the potential to reduce errors, making this approach a highly promising research direction.

4.3. RQ3—How Effective Are Current Identification/Classification Proposals?

The comparison of classification algorithms and data sources is especially difficult because each study employs its own set of metrics for its specific scenario and circumstances. For this reason, accuracy has been prioritized as the primary figure of merit in this review due to its consistent reporting across the analyzed papers. Table 9 presents a concise summary of the reported accuracies in relation to the AI classification method employed.
From the data contained in Table 9, RF and SVM are the most commonly used ML models, particularly when working with RGB and multispectral data. RF demonstrates 80–95% accuracy, while SVM reaches up to 97%, suggesting its effectiveness in handling high-dimensional spectral features. However, when applied to more complex datasets such as hyperspectral or LiDAR-integrated data, these classical ML methods tend to perform worse than DL models. Maximum likelihood classification (MLC) shows lower accuracy (55–87%), indicating its limitations in dealing with mixed spectral information. DL models outperform classical approaches when hyperspectral and LiDAR data are available. 3D-CNN, PointMLP, and InceptionV3 achieve the highest accuracy (above 97%) due to their ability to extract spatial and spectral features simultaneously. PointMLP reaches 98.52% accuracy, making it the most accurate model among those evaluated. YOLOv8 and ResNet-50 perform well with LiDAR data, demonstrating their capability to analyze structural information from forest canopies. Conversely, multispectral data alone are rarely used with DL models, suggesting that they lack the necessary spectral richness compared to hyperspectral or LiDAR fusion. The results indicate that integrating multiple remote sensing data types significantly enhances classification accuracy, with DL models achieving the best performance when both spectral and structural data are available. Regarding the generalization of results, while tree classification methods tend to achieve high accuracy in controlled settings, their applicability in environments different from those in which they were trained remains uncertain. This limitation stems from variations in tree species composition, canopy structures, and environmental factors such as altitude, climate, and seasonal changes. The main difficulties lie in the classification scheme, and it is probable that a segmentation method based on point cloud information could be more easily transferred. A major problem in tree classification lies in the balance between classification accuracy and model transferability. Examples from the revised papers indicate that combining multiple data sources significantly enhances classification performance. However, this integration can also limit the model’s adaptability to new environments due to differences in features such as spectral reflectance, canopy structures, and data acquisition settings [25]. Classical ML algorithms, such as SVM and RF, are robust and perform well with different class distributions and high-dimensional data [61]. However, they are of limited transferability because they rely on highly specific feature extraction techniques. Most revised papers focus on a particular type of forest without being trained or tested on other datasets. This limitation could be addressed by creating diverse public datasets. Conversely, DL approaches, particularly CNNs, offer improved generalization capabilities when trained on large and diverse datasets. The ability of CNNs to learn hierarchical feature representations allows them to adapt better to variations in spectral and structural features, fostering greater transferability. Ref. [62] demonstrated high generalization abilities of CNNs for detecting individual trees across four different forest types, showing that a CNN trained on all available forest types outperformed locally trained CNNs. Their results suggest that model transferability can be significantly improved when CNNs are trained over large and heterogeneous datasets rather than relying on small, localized samples [21]. The development of habitat-specific classification models has been proposed as a means to facilitate transferability across different landscapes. By modeling the dominant species within specific habitat types, these models can be adapted more easily to similar ecological conditions, reducing the need for extensive recalibration and preprocessing when applied to new areas [49]. However, this approach still requires careful validation across multiple test sites to ensure that classification accuracy is maintained beyond the original training dataset. In conclusion, achieving both high classification accuracy and strong transferability remains a challenge in tree species identification. While classical ML models offer reliable classification but limited adaptability, DL models trained on large, diverse datasets demonstrate greater potential for transferability. The reliance on preprocessing techniques and spectral calibration continues to hinder generalization, highlighting the need for standardized datasets and improved model architectures that can effectively bridge the gap between accuracy and adaptability. Optimization techniques, such as adjusting learning rates, batch sizes, and network architectures, can significantly enhance model accuracy and generalization [23]. DL approaches, which often struggle with limited training samples, can benefit from techniques like distance map regression as a secondary task to regularize semantic segmentation models, thereby improving their generalization performance [53]. Similarly, fine-tuning and dropout strategies have been identified as essential for enhancing model generalization in augmented datasets [22]. Regarding classical models such as RF, increasing the number of features without ensuring their contribution to classification may lead to higher generalization error. Irrelevant features raise the probability of being selected at decision nodes, resulting in overly complex models with high variance [53]. While SVM has been proposed as a solution for handling large, high-dimensional datasets, its reliance on kernel functions still presents challenges in achieving consistent generalization across multi-source datasets [40]. Ultimately, improving generalization requires a careful balance of feature selection, model regularization, and dataset augmentation to ensure adaptability across diverse forest environments.
The comparison of resource usage highlights that classical ML models, such as RF and SVM, require less computational power, making them more feasible for large-scale applications when data are limited to RGB or multispectral sources. However, these models rely on extensive preprocessing, including feature selection and manual segmentation, to optimize performance. In contrast, DL models, such as 3D-CNN, PointMLP, and InceptionV3, demand significantly higher computational resources and memory but reduce manual effort by automatically learning spectral and spatial patterns. The integration of LiDAR and hyperspectral data into CNNs enhances classification accuracy but also increases computational costs, requiring the use of specialized hardware such as GPUs or TPUs for efficient processing. Therefore, the choice of a classification model depends on the balance between data availability, desired accuracy, and computational capacity.

5. Conclusions

This systematic review highlights the significant progress made in the classification and identification of individual tree species using drone-based data collection and AI techniques. The integration of high-resolution sensors, such as RGB, MSI, HSI, and LiDAR, provides enhanced data acquisition capabilities, while advancements in ML and DL have improved classification accuracy. Traditional methods like RF and SVM remain widely used, but CNNs and other DL models are becoming increasingly dominant due to their superior feature extraction (feature extraction is not an explicit phase but is embedded in the convolutional stages of a CNN) and classification capabilities.
Despite these advancements, several challenges persist. The lack of standardized datasets limits the generalizability of classification models across diverse forest environments. The high cost of LiDAR and HSI imaging further restricts their widespread adoption, particularly in large-scale forestry applications. Additionally, variability in data collection methodologies, environmental conditions, and species diversity poses challenges to the transferability of AI-based models across different regions.
Future research should focus on developing open-access datasets, optimizing DL architectures for improved generalization, and integrating multimodal sensor data to enhance classification accuracy. The application of emerging AI techniques, such as transformer-based models and multimodal classification approaches, holds promise for further improving tree species identification. Additionally, efforts to reduce computational costs and improve the interpretability of AI models will be crucial for their practical deployment in forest monitoring and conservation initiatives.
By addressing these challenges, future studies can contribute to more robust and scalable solutions for automated tree species classification, ultimately supporting sustainable forest management, biodiversity conservation, and ecological monitoring at a global scale.

Author Contributions

Conceptualization, R.A.-D., J.M.S.-G., F.M.-R. and L.M.Á.-S.; methodology, R.A.-D., J.M.S.-G., F.M.-R. and L.M.Á.-S.; validation, R.A.-D., J.M.S.-G., F.M.-R. and L.M.Á.-S.; formal analysis, R.A.-D., J.M.S.-G., F.M.-R. and L.M.Á.-S.; investigation, R.A.-D., J.M.S.-G., F.M.-R. and L.M.Á.-S.; data curation, R.A.-D., J.M.S.-G., F.M.-R. and L.M.Á.-S.; writing—original draft preparation, R.A.-D., J.M.S.-G., F.M.-R. and L.M.Á.-S.; writing—review and editing, R.A.-D., J.M.S.-G., F.M.-R. and L.M.Á.-S.; visualization, R.A.-D.; supervision, J.M.S.-G., F.M.-R. and L.M.Á.-S.; project administration, J.M.S.-G. and F.M.-R. All authors have read and agreed to the published version of the manuscript.

Funding

This research received no external funding.

Institutional Review Board Statement

Not applicable.

Informed Consent Statement

Not applicable.

Data Availability Statement

No new data were created or analyzed in this study. Data sharing is not applicable to this article.

Conflicts of Interest

The authors declare no conflicts of interest.

Abbreviations

The following abbreviations are used in this manuscript:
AIArtificial Intelligence
CHMCanopy Height Models
CFSCorrelation-based Feature Selection
CNNConvolutional Neural Network
DLDeep Learning
DSMDigital Surface Models
EASAEuropean Union Aviation Safety Agency
ECOCError-Correcting Output Codes
GSDGround Sampling Distance
GISGeographic Information System
HSIHyperspectral Imaging
LiDARLight Detection and Ranging
MLMachine Learning
MLPMulti-Layer Perceptron
MRSMulti-Resolution Segmentation
MSIMultispectral Imaging
MDPIMultidisciplinary Digital Publishing Institute
NIRNear-Infrared
OBIAObject-Based Image Analysis
PCAPrincipal Component Analysis
PPCPhotogrammetric Point Clouds
PRISMAPreferred Reporting Items for Systematic Reviews and Meta-Analyses
RERed Edge
RFRandom Forest
RFECVRecursive Feature Elimination with Cross-Validation
ROIRegion of Interest
RTKReal-Time Kinematic
SfMStructure from Motion
SFFSSequential Forward Floating Selection
SVMSupport Vector Machine
SWIRShortwave Infrared
UAVUnmanned Aerial Vehicle
ViTVision Transformers
VNIRVisible and Near-Infrared

References

  1. United Nations. Forests | Department of Economic and Social Affairs. 2019. Available online: https://sdgs.un.org/topics/forests (accessed on 4 December 2024).
  2. Titus, B.D.; Brown, K.; Helmisaari, H.S.; Vanguelova, E.; Stupak, I.; Evans, A.; Clarke, N.; Guidi, C.; Bruckman, V.J.; Varnagiryte-Kabasinskiene, I.; et al. Sustainable forest biomass: A review of current residue harvesting guidelines. Energy Sustain. Soc. 2021, 11, 10. [Google Scholar] [CrossRef]
  3. Li, H.; Yang, W.; Zhang, Y. Application of High-Resolution Remote Sensing Image for Individual Tree Identification of Pinus sylvestris and Pinus tabulaeformis. Wirel. Commun. Mob. Comput. 2021, 2021, 7672762. [Google Scholar] [CrossRef]
  4. Liu, B.; Hao, Y.; Huang, H.; Chen, S.; Li, Z.; Chen, E.; Tian, X.; Ren, M. TSCMDL: Multimodal Deep Learning Framework for Classifying Tree Species Using Fusion of 2-D and 3-D Features. IEEE Trans. Geosci. Remote Sens. 2023, 61, 4402711. [Google Scholar] [CrossRef]
  5. Liu, H. Classification of tree species using UAV-based multi-spectral and multi-seasonal images: A multi-feature-based approach. New For. 2024, 55, 173–196. [Google Scholar] [CrossRef]
  6. Sankararao, A.; Pachamuthu, R.; Choudhary, S. UC-HSI: UAV Based Crop Hyperspectral Imaging Datasets and Machine Learning Benchmark Results. IEEE Geosci. Remote Sens. Lett. 2024, 21, 1. [Google Scholar] [CrossRef]
  7. Sarma, A.S.; Nidamanuri, R.R. Optimal band selection and transfer in drone-based hyperspectral images for plant-level vegetable crops identification using statistical-swarm intelligence (SSI) hybrid algorithms. Ecol. Inform. 2025, 86, 103051. [Google Scholar] [CrossRef]
  8. Kourounioti, O.; Temenos, A.; Temenos, N.; Oikonomou, E.; Doulamis, A.; Doulamis, N. UAVINE-XAI: Explainable AI-Based Spectral Band Selection for Vineyard Monitroting Using UAV Hyperspectral Data. IEEE J. Sel. Top. Appl. Earth Obs. Remote Sens. 2025, 18, 10095–10104. [Google Scholar] [CrossRef]
  9. Niu, B.; Feng, Q.; Chen, B.; Ou, C.; Liu, Y.; Yang, J. HSI-TransUNet: A transformer based semantic segmentation model for crop mapping from UAV hyperspectral imagery. Comput. Electron. Agric. 2022, 201, 107297. [Google Scholar] [CrossRef]
  10. Santos, A.A.d.; Marcato Junior, J.; Araújo, M.S.; Di Martini, D.R.; Tetila, E.C.; Siqueira, H.L.; Aoki, C.; Eltner, A.; Matsubara, E.T.; Pistori, H.; et al. Assessment of CNN-Based Methods for Individual Tree Detection on Images Captured by RGB Cameras Attached to UAVs. Sensors 2019, 19, 3595. [Google Scholar] [CrossRef]
  11. Lei, L.; Yin, T.; Chai, G.; Li, Y.; Wang, Y.; Jia, X.; Zhang, X. A novel algorithm of individual tree crowns segmentation considering three-dimensional canopy attributes using UAV oblique photos. Int. J. Appl. Earth Obs. Geoinf. 2022, 112, 102893. [Google Scholar] [CrossRef]
  12. Page, M.J.; McKenzie, J.E.; Bossuyt, P.M.; Boutron, I.; Hoffmann, T.C.; Mulrow, C.D.; Shamseer, L.; Tetzlaff, J.M.; Akl, E.A.; Brennan, S.E.; et al. The PRISMA 2020 statement: An updated guideline for reporting systematic reviews. PLoS Med. 2021, 18, e1003583. [Google Scholar] [CrossRef] [PubMed]
  13. Santos-Gago, J.M.; Ramos-Merino, M.; Valladares-Rodriguez, S.; Álvarez Sabucedo, L.M.; Fernández-Iglesias, M.J.; García-Soidán, J.L. Innovative Use of Wrist-Worn Wearable Devices in the Sports Domain: A Systematic Review. Electronics 2019, 8, 1257. [Google Scholar] [CrossRef]
  14. Lopez-Barreiro, J.; Garcia-Soidan, J.L.; Alvarez-Sabucedo, L.; Santos-Gago, J.M. Artificial Intelligence-Powered Recommender Systems for Promoting Healthy Habits and Active Aging: A Systematic Review. Appl. Sci. 2024, 14, 10220. [Google Scholar] [CrossRef]
  15. Zhong, H.; Zhang, Z.; Liu, H.; Wu, J.; Lin, W. Individual Tree Species Identification for Complex Coniferous and Broad-Leaved Mixed Forests Based on Deep Learning Combined with UAV LiDAR Data and RGB Images. Forests 2024, 15, 293. [Google Scholar] [CrossRef]
  16. Sun, Y.; Huang, J.; Ao, Z.; Lao, D.; Xin, Q. Deep Learning Approaches for the Mapping of Tree Species Diversity in a Tropical Wetland Using Airborne LiDAR and High-Spatial-Resolution Remote Sensing Images. Forests 2019, 10, 1047. [Google Scholar] [CrossRef]
  17. Huang, H.; Li, F.; Fan, P.; Chen, M.; Yang, X.; Lu, M.; Sheng, X.; Pu, H.; Zhu, P. AMDNet: A Modern UAV RGB Remote-Sensing Tree Species Image Segmentation Model Based on Dual-Attention Residual and Structure Re-Parameterization. Forests 2023, 14, 549. [Google Scholar] [CrossRef]
  18. Veras, H.F.P.; Ferreira, M.P.; da Cunha Neto, E.M.; Figueiredo, E.O.; Corte, A.P.D.; Sanquetta, C.R. Fusing multi-season UAS images with convolutional neural networks to map tree species in Amazonian forests. Ecol. Inform. 2022, 71, 101815. [Google Scholar] [CrossRef]
  19. Pereira Martins-Neto, R.; Garcia Tommaselli, A.M.; Imai, N.N.; Honkavaara, E.; Miltiadou, M.; Saito Moriya, E.A.; David, H.C. Tree Species Classification in a Complex Brazilian Tropical Forest Using Hyperspectral and LiDAR Data. Forests 2023, 14, 945. [Google Scholar] [CrossRef]
  20. Morales, G.; Kemper, G.; Sevillano, G.; Arteaga, D.; Ortega, I.; Telles, J. Automatic Segmentation of Mauritia flexuosa in Unmanned Aerial Vehicle (UAV) Imagery Using Deep Learning. Forests 2018, 9, 736. [Google Scholar] [CrossRef]
  21. Schiefer, F.; Kattenborn, T.; Frick, A.; Frey, J.; Schall, P.; Koch, B.; Schmidtlein, S. Mapping forest tree species in high resolution UAV-based RGB-imagery by means of convolutional neural networks. ISPRS J. Photogramm. Remote Sens. 2020, 170, 205–215. [Google Scholar] [CrossRef]
  22. Pierdicca, R.; Nepi, L.; Mancini, A.; Malinverni, E.S.; Balestra, M. UAV4TREE: Deep Learning-based system for automatic classification of tree species using RGB optical images obtained by an unmanned aerial vehicle. ISPRS Ann. Photogramm. Remote Sens. Spat. Inf. Sci. 2023, X-1/W1-2023, 1089–1096. [Google Scholar] [CrossRef]
  23. Maja Michałowska, J.R.; Janicka, J. Tree species classification on images from airborne mobile mapping using ML.NET. Eur. J. Remote Sens. 2023, 56, 2271651. [Google Scholar] [CrossRef]
  24. Hakula, A.; Ruoppa, L.; Lehtomäki, M.; Yu, X.; Kukko, A.; Kaartinen, H.; Taher, J.; Matikainen, L.; Hyyppä, E.; Luoma, V.; et al. Individual tree segmentation and species classification using high-density close-range multispectral laser scanning data. ISPRS Open J. Photogramm. Remote Sens. 2023, 9, 100039. [Google Scholar] [CrossRef]
  25. Tuominen, S.; Näsi, R.; Honkavaara, E.; Balazs, A.; Hakala, T.; Viljanen, N.; Pölönen, I.; Saari, H.; Ojanen, H. Assessment of Classifiers and Remote Sensing Features of Hyperspectral Imagery and Stereo-Photogrammetric Point Clouds for Recognition of Tree Species in a Forest Area of High Species Diversity. Remote Sens. 2018, 10, 714. [Google Scholar] [CrossRef]
  26. Kukkonen, M.; Lähivaara, T.; Packalen, P. Combination of Lidar Intensity and Texture Features Enable Accurate Prediction of Common Boreal Tree Species With Single Sensor UAS Data. IEEE Trans. Geosci. Remote Sens. 2024, 62, 4401508. [Google Scholar] [CrossRef]
  27. Nevalainen, O.; Honkavaara, E.; Tuominen, S.; Viljanen, N.; Hakala, T.; Yu, X.; Hyyppä, J.; Saari, H.; Pölönen, I.; Imai, N.N.; et al. Individual Tree Detection and Classification with UAV-Based Photogrammetric Point Clouds and Hyperspectral Imaging. Remote Sens. 2017, 9, 185. [Google Scholar] [CrossRef]
  28. Sivanandam, P.; Lucieer, A. Tree Detection and Species Classification in a Mixed Species Forest Using Unoccupied Aircraft System (UAS) RGB and Multispectral Imagery. Remote Sens. 2022, 14, 4963. [Google Scholar] [CrossRef]
  29. Pearse, G.D.; Watt, M.S.; Soewarto, J.; Tan, A.Y.S. Deep Learning and Phenology Enhance Large-Scale Tree Species Classification in Aerial Imagery during a Biosecurity Response. Remote Sens. 2021, 13, 1789. [Google Scholar] [CrossRef]
  30. Fricker, G.A.; Ventura, J.D.; Wolf, J.A.; North, M.P.; Davis, F.W.; Franklin, J. A Convolutional Neural Network Classifier Identifies Tree Species in Mixed-Conifer Forest from Hyperspectral Imagery. Remote Sens. 2019, 11, 2326. [Google Scholar] [CrossRef]
  31. National Oceanic and Atmospheric Administration (NOAA) Coastal Services Center. Lidar 101: An Introduction to Lidar Technology, Data, and Applications. 2012. Available online: https://coast.noaa.gov/digitalcoast/training/lidar-101.html (accessed on 10 February 2024).
  32. Desta Ekaso, F.N.; Kerle, N. Accuracy assessment of real-time kinematics (RTK) measurements on unmanned aerial vehicles (UAV) for direct geo-referencing. Geo-Spat. Inf. Sci. 2020, 23, 165–181. [Google Scholar] [CrossRef]
  33. Kior, A.; Yudina, L.; Zolin, Y.; Sukhov, V.; Sukhova, E. RGB Imaging as a Tool for Remote Sensing of Characteristics of Terrestrial Plants: A Review. Plants 2024, 13, 1262. [Google Scholar] [CrossRef] [PubMed]
  34. Prey, L.; Von Bloh, M.; Schmidhalter, U. Evaluating RGB Imaging and Multispectral Active and Hyperspectral Passive Sensing for Assessing Early Plant Vigor in Winter Wheat. Sensors 2018, 18, 2931. [Google Scholar] [CrossRef] [PubMed]
  35. Martín-Rodríguez, F.; Álvarez Sabucedo, L.M.; Santos-Gago, J.M.; Fernández-Barciela, M. Enhanced Satellite Analytics for Mussel Platform Census Using a Machine-Learning Based Approach. Electronics 2024, 13, 2782. [Google Scholar] [CrossRef]
  36. Stuart, M.B.; McGonigle, A.J.S.; Willmott, J.R. Hyperspectral Imaging in Environmental Monitoring: A Review of Recent Developments and Technological Advances in Compact Field Deployable Systems. Sensors 2019, 19, 3071. [Google Scholar] [CrossRef]
  37. Schönberger, J.L.; Frahm, J.M. Structure-from-Motion Revisited. In Proceedings of the 2016 IEEE Conference on Computer Vision and Pattern Recognition (CVPR), Las Vegas, NV, USA, 27–30 June 2016; pp. 4104–4113. [Google Scholar] [CrossRef]
  38. Westoby, M.; Brasington, J.; Glasser, N.; Hambrey, M.; Reynolds, J. ‘Structure-from-Motion’ photogrammetry: A low-cost, effective tool for geoscience applications. Geomorphology 2012, 179, 300–314. [Google Scholar] [CrossRef]
  39. Ma, Y.; Zhao, Y.; Im, J.; Zhao, Y.; Zhen, Z. A deep-learning-based tree species classification for natural secondary forests using unmanned aerial vehicle hyperspectral images and LiDAR. Ecol. Indic. 2024, 159, 111608. [Google Scholar] [CrossRef]
  40. Zhong, H.; Lin, W.; Liu, H.; Ma, N.; Liu, K.; Cao, R.; Wang, T.; Ren, Z. Identification of tree species based on the fusion of UAV hyperspectral image and LiDAR data in a coniferous and broad-leaved mixed forest in Northeast China. Front. Plant Sci. 2022, 13, 964769. [Google Scholar] [CrossRef]
  41. Sarker, I.H. Machine Learning: Algorithms, Real-World Applications and Research Directions. SN Comput. Sci. 2021, 2, 160. [Google Scholar] [CrossRef]
  42. Kuzmin, A.; Korhonen, L.; Kivinen, S.; Hurskainen, P.; Korpelainen, P.; Tanhuanpää, T.; Maltamo, M.; Vihervaara, P.; Kumpula, T. Detection of European Aspen (Populus tremula L.) Based on an Unmanned Aerial Vehicle Approach in Boreal Forests. Remote Sens. 2021, 13, 1723. [Google Scholar] [CrossRef]
  43. Safonova, A.; Hamad, Y.; Dmitriev, E.; Georgiev, G.; Trenkin, V.; Georgieva, M.; Dimitrov, S.; Iliev, M. Individual Tree Crown Delineation for the Species Classification and Assessment of Vital Status of Forest Stands from UAV Images. Drones 2021, 5, 77. [Google Scholar] [CrossRef]
  44. Franklin, S.; Ahmed, O.; Williams, G. Northern Conifer Forest Species Classification Using Multispectral Data Acquired from an Unmanned Aerial Vehicle. Photogramm. Eng. Remote Sens. 2017, 83, 501–507. [Google Scholar] [CrossRef]
  45. Zhang, C.; Xia, K.; Feng, H.; Yang, Y.; Du, X. Tree species classification using deep learning and RGB optical images obtained by an unmanned aerial vehicle. J. For. Res. 2021, 32, 1879–1888. [Google Scholar] [CrossRef]
  46. Cabrera-Ariza, A.M.; Peralta-Aguilera, M.; Henríquez-Hernández, P.V.; Santelices-Moya, R. Using UAVs and Machine Learning for Nothofagus alessandrii Species Identification in Mediterranean Forests. Drones 2023, 7, 668. [Google Scholar] [CrossRef]
  47. Dersch, S.; Schöttl, A.; Krzystek, P.; Heurich, M. Novel single tree detection by transformers using UVA-based multispectral imagery. Int. Arch. Photogramm. Remote Sens. Spat. Inf. Sci. 2022, XLIII-B2-2022, 981–988. [Google Scholar] [CrossRef]
  48. Zhang, C.; Zhou, J.; Wang, H.; Tan, T.; Cui, M.; Huang, Z.; Wang, P.; Zhang, L. Multi-Species Individual Tree Segmentation and Identification Based on Improved Mask R-CNN and UAV Imagery in Mixed Forests. Remote Sens. 2022, 14, 874. [Google Scholar] [CrossRef]
  49. Belcore, E.; Pittarello, M.; Lingua, A.M.; Lonati, M. Mapping Riparian Habitats of Natura 2000 Network (91E0*, 3240) at Individual Tree Level Using UAV Multi-Temporal and Multi-Spectral Data. Remote Sens. 2021, 13, 1756. [Google Scholar] [CrossRef]
  50. Franklin, S.E. Pixel- and object-based multispectral classification of forest tree species from small unmanned aerial vehicles. J. Unmanned Veh. Syst. 2018, 6, 195–211. [Google Scholar] [CrossRef]
  51. Kattenborn, T.; Eichel, J.; Wiser, S.; Burrows, L.; Fassnacht, F.; Schmidtlein, S. Convolutional Neural Networks accurately predict cover fractions of plant species and communities in Unmanned Aerial Vehicle imagery. Remote Sens. Ecol. Conserv. 2020, 6, 472–486. [Google Scholar] [CrossRef]
  52. Gini, R.; Sona, G.; Ronchetti, G.; Passoni, D.; Pinto, L. Improving Tree Species Classification Using UAS Multispectral Images and Texture Measures. ISPRS Int. J. Geo-Inf. 2018, 7, 315. [Google Scholar] [CrossRef]
  53. La Rosa, L.E.C.; Sothe, C.; Feitosa, R.Q.; de Almeida, C.M.; Schimalski, M.B.; Oliveira, D.A.B. Multi-task fully convolutional network for tree species mapping in dense forests using small training hyperspectral data. ISPRS J. Photogramm. Remote Sens. 2021, 179, 35–49. [Google Scholar] [CrossRef]
  54. Nezami, S.; Khoramshahi, E.; Nevalainen, O.; Pölönen, I.; Honkavaara, E. Tree Species Classification of Drone Hyperspectral and RGB Imagery with Deep Learning Convolutional Neural Networks. Remote Sens. 2020, 12, 1070. [Google Scholar] [CrossRef]
  55. European Union Aviation Safety Agency. Easy Access Rules for Unmanned Aircraft Systems (Regulation (EU) 2019/947 and 2019/945). 2023. Available online: https://www.easa.europa.eu/sites/default/files/dfu/D0593E_2024-07-10_06.26.37_EAR-for-Unmanned-Aircraft-Systems.pdf (accessed on 10 February 2024).
  56. Liao, L.; Cao, L.; Xie, Y.; Luo, J.; Wang, G. Phenotypic Traits Extraction and Genetic Characteristics Assessment of Eucalyptus Trials Based on UAV-Borne LiDAR and RGB Images. Remote Sens. 2022, 14, 765. [Google Scholar] [CrossRef]
  57. Zhao, D.; Pang, Y.; Liu, L.; Li, Z. Individual Tree Classification Using Airborne LiDAR and Hyperspectral Data in a Natural Mixed Forest of Northeast China. Forests 2020, 11, 303. [Google Scholar] [CrossRef]
  58. Wang, C. At-Sensor Radiometric Correction of a Multispectral Camera (RedEdge) for sUAS Vegetation Mapping. Sensors 2021, 21, 8224. [Google Scholar] [CrossRef]
  59. Rajab Pourrahmati, M.; Baghdadi, N.; Fayad, I. Comparison of GEDI LiDAR Data Capability for Forest Canopy Height Estimation over Broadleaf and Needleleaf Forests. Remote Sens. 2023, 15, 1522. [Google Scholar] [CrossRef]
  60. Zhong, L.; Dai, Z.; Fang, P.; Cao, Y.; Wang, L. A Review: Tree Species Classification Based on Remote Sensing Data and Classic Deep Learning-Based Methods. Forests 2024, 15, 852. [Google Scholar] [CrossRef]
  61. Ghosh, A.; Fassnacht, F.E.; Joshi, P.; Koch, B. A framework for mapping tree species combining hyperspectral and LiDAR data: Role of selected classifiers and sensor across three spatial scales. Int. J. Appl. Earth Obs. Geoinf. 2014, 26, 49–63. [Google Scholar] [CrossRef]
  62. Weinstein, B.G.; Marconi, S.; Bohlman, S.A.; Zare, A.; White, E.P. Cross-site learning in deep learning RGB tree crown detection. Ecol. Inform. 2020, 56, 101061. [Google Scholar] [CrossRef]
Figure 1. PRISMA Flow Chart illustrating the systematic review process.
Technologies 13 00187 g001
Figure 2. Publication years of the papers included in this review.
Technologies 13 00187 g002
Figure 3. Nationalities of first authors in the reviewed papers.
Technologies 13 00187 g003
Figure 4. Places where studies were conducted.
Technologies 13 00187 g004
Figure 5. Typical workflow described in the reviewed papers for individual tree species identification.
Technologies 13 00187 g005
Table 1. List of drones and their characteristics.
DroneTypeEASAWeightPaper
eBee Plus RTKFixed WingC21.1 kg[42]
JOUAV CW-15Fixed WingC314 kg[5]
SenseFly eBee SeriesFixed WingC21–1.5 kg[42,43,44]
Aeryon SkyRangerQuadcopterC22.5 kg[20]
Avartek BoxerQuadcopterC325 kg[26]
DJI Inspire 2QuadcopterC24 kg[45]
DJI Matrice 200/210QuadcopterC34 kg[42]
DJI Matrice 300 RTKQuadcopterC36.3 kg[15,40,46]
DJI Matrice 600 ProHexacopterC310 kg[39,47]
DJI Mavic SeriesQuadcopterC10.7–0.9 kg[20,48]
DJI Phantom 4 SeriesQuadcopterC21.4 kg[4,17,18,21,28,42,43,49]
ING Robotic ResponderQuadcopterC33 kg[50]
Multirotor GV2000QuadcopterC3 [4]
Okto-XLOctocopterC3 [21,51]
Pegasus D200HexacopterC3 [40]
Tarot 960HexacopterC35 kg[25,27]
TurboAce Matrix-EQuadcopterC32.2 kg[20]
Generic UAV [19,22,52,53,54]
Helicopter [23,24]
Small Airplane [16,30]
Table 2. Sensor modalities used in the reviewed studies.
RGBMSIHSILiDARArticles
[17,18,20,22,29,45,46,48,51]
[25,28,42,43,44,49,50,52]
[27,53,54]
[4,15,16,21,23]
[56]
[5,24,47]
[19,30,39,40,57]
[26]
Table 3. RGB cameras used in the reviewed studies.
InstrumentPaperResolutionWeight
Canon 100D (Canon Inc., Tokyo, Japan)[51]18 MP (5184 × 3456 pixels)575 g
FC6310R RGB (DJI, Shenzhen, China)[4]20 MP (5472 × 3648 pixels)200 g
FC7303 RGB (DJI, Shenzhen, China)[22]12 MP (4000 × 3000 pixels)200 g
Nikon J1 Camera (Nikon Corporation, Tokyo, Japan)[52]10.1 MP (3872 × 2592 pixels)277 g
PhaseOne iXU 100 MP (Phase One, Copenhagen, Denmark)[23]100 MP (11,664 × 8750 pixels)1200 g
Samsung NX1000 (Samsung Elec. Co., Suwon, South Korea)[54]20.3 MP (5472 × 3648 pixels)222 g
Samsung NX300 (Samsung Elec. Co., Suwon, South Korea)[25]20.3 MP (5472 × 3648 pixels)331 g
Sony Alpha 7R (Sony Corporation, Tokyo, Japan)[21]36.4 MP (7360 × 4912 pixels)465 g
Sony DSC-WX220 (Sony Corporation, Tokyo, Japan)[44,50]18.2 MP (4896 × 3672 pixels)121 g
Sony Nex-7 CMOS (Sony Corporation, Tokyo, Japan)[20]24.3 MP (6000 × 4000 pixels)291 g
Zenmuse P1 (DJI, Shenzhen, China)[46]45 MP (8192 × 5460 pixels)900 g
Zenmuse X5S (DJI, Shenzhen, China)[45]20.8 MP (5280 × 3956 pixels)430 g
MT9F002 (ON Semiconductor, Phoenix, USA)[20]14 MP (4384 × 3288 pixels)150 g
Generic RGB Camera[16,17,18,27,28,29,43,48,49,53,57]
Table 4. Multispectral sensors used in the reviewed studies.
InstrumentPaperBandsWeight
Tetracam MiniCam MCA6 (Tetracam Inc., CA, USA)[50]RGB, NIR700 g
Tetracam ADC Lite (Tetracam Inc., CA, USA)[52]RG, NIR200 g
MicaSense RedEdge-MX Dual (MicaSense Inc., WA, USA)[47]RGB, RE, NIR, plus 5 bands510 g
Parrot Sequoia (Parrot SA, Paris, France)[42,43,44,50]RG, NIR110 g
MicaSense RedEdge-MX (MicaSense Inc., WA, USA)[5,28,42]RGB, RE, NIR230 g
Table 5. Hyperspectral sensors used in the reviewed studies.
InstrumentPaperSpectral Range/BandsWeight
AVIRIS Hyperspectral NG (NASA, CA, USA)[30]380–2510 nm, 425 bands100 kg
CASI-1500 (ITRES Research Ltd., Alberta, Canada)[57]380–1050 nm, 288 bands15 kg
Fabry-Perot FPI (VTT Research Centre, Espoo, Finland)[53,54]400–1000 nm2–3 kg
Hyperspectral Camera (FPI)[27,39] 2–3 kg
NEON Imaging Spectrometer (NEON, CO, USA)[56]380–2500 nm, 426 bands20 kg
Resonon Pika L (Resonon Inc., MT, USA)[40]400–1000 nm, 281 bands1.5 kg
Rikola FPI-based (Rikola Ltd., Oulu, Finland)[25]VNIR 400–1000 nm, 40 bands2–3 kg
Rikola Hyperspectral (Rikola Ltd., Oulu, Finland)[19]VNIR 500–900 nm, 50 bands2–3 kg
Xenics Bobcat-1.7-320 (Xenics NV, Leuven, Belgium)[25]900–1700 nm0.5 kg
Table 6. LiDAR instruments used in the reviewed studies.
InstrumentPaperBandsWeight
Riegl mini VUX-3UAV (RIEGL GmbH, Horn, Austria)[24]905 nm1.55 kg
Riegl VQ-840-G (RIEGL GmbH, Horn, Austria)[24]532 nm12 kg
Riegl VUX-1HA (RIEGL GmbH, Horn, Austria)[24]NIR 1550 nm3.5 kg
Riegl VUX-1 (RIEGL GmbH, Horn, Austria)[26]NIR 1550 nm3.5 kg
Riegl VUX-240 (RIEGL GmbH, Horn, Austria)[23]NIR 1550 nm4.3 kg
RIEGL VUX-1LR (RIEGL GmbH, Horn, Austria)[4]NIR 1550 nm3.5 kg
Trimble Harrier 68i Scanner (Trimble Inc., California, USA)[16]1064 nm3 kg
RIEGL LMS-Q680i LiDAR (RIEGL GmbH, Horn, Austria)[19]NIR 1550 nm17.5 kg
LiDAR Gemini Mapper (3D Laser Mapping Ltd., Nottingham, UK)[56]1550 nm87 kg
LiteMapper 5600 (RIEGL and IGI mbH, Kreuztal, Germany)[57]1550 nm16 kg
Riegl mini VUX-1UAV (RIEGL GmbH, Horn, Austria)[39,40]905 nm1.55 kg
Zenmuse L1 (DJI, Shenzhen, China)[15]905 nm NIR + RGB1 kg
Generic LiDAR[21,30]
Table 7. Software used in the reviewed studies.
CategorySoftwarePapers
Image Alignment & OrthomosaicAgisoft Metashape 1, PhotoScan, Pix4Dmapper 2, Pix4UAV, Agisoft[5,18,25,27,28,42,44,50,52]
Specialized LiDAR SoftwareLAStools, LiDAR360 3, FUSION 4, DASOS[15,16,19,28,40]
GIS & Remote Sensing ToolsENVI 5, ArcGIS 6, ArcGIS Pro 7, QGIS, eCognition[5,15,16,17,21,27,28,40,43,44,46,48,49,50,52,57]
Image Annotation & PreprocessingLabelImg 8, Capture One Pro, IrfanView[15,23]
1 Agisoft Metashape Professional 1.6.4 [28]; 2 Pix4Dmapper Pro 2.1.61 [44,50]; 3 LiDAR360 4.1.3 [15]; 4 FUSION 3.7 [16]; 5 ENVI 5.1 [50,52]; ENVI 5.3 [15]; 6 ArcGIS Desktop v10.4 [48]; 7 ArcGIS Pro 2.8 [46]; 8 LabelImg 1.8.6 [15].
Table 8. Segmentation algorithms used in the reviewed studies.
CategorySegmentation AlgorithmPapers
Traditional AlgorithmsLocal maxima (CHM-based)[16,25,27,42]
Multi-resolution segmentation[21,28,44,49,50]
ITC delineation[18,56]
Watershed and distance-based clustering[26,40,53,57]
Classic Machine LearningRF with segmentation features[24,28,44,46,50]
Fuzzy k-nearest neighbors (FkNN)[24]
Simple linear iterative clustering (SLIC)[19,39]
Deep LearningU-Net[21,48]
U-Net variations[20,39]
Post-processed YOLOv4 + CHM[47]
YOLOv8 + gather-and-distribute mechanism[15]
DeepLabv3+[18]
Dual-attention residual network (AMDNet)[17]
Mask R-CNN[48]
Table 9. Classification algorithms and techniques.
CategoryClassification AlgorithmAccuracyPapers
Classic MLRF80–95%[5,19,24,25,26,27,28,40,44,46,49,50]
SVM85–97%[40,42,43,56,57]
Maximum Likelihood55–87%[50,52]
DLYOLOv881%[15]
ResNet-5092–97%[23,29,45]
DenseNet16172%[22]
VGG1673%[16]
PointMLP98.52%[4]
AMDNet93.8%[17]
1D-CNN, CBAM83%[39]
3D-CNN97–99%[54]
Generic CNN87%[30,51]
InceptionV382.9%[23]
Disclaimer/Publisher’s Note: The statements, opinions and data contained in all publications are solely those of the individual author(s) and contributor(s) and not of MDPI and/or the editor(s). MDPI and/or the editor(s) disclaim responsibility for any injury to people or property resulting from any ideas, methods, instructions or products referred to in the content.

