Article

Factors Affecting Travel Mode Choice between High-Speed Railway and Road Passenger Transport—Evidence from China

1
College of Economics, Shenzhen University, Shenzhen 518060, China
2
School of Economics and Management, Tongji University, Shanghai 200092, China
*
Author to whom correspondence should be addressed.
Sustainability 2022, 14(23), 15745; https://doi.org/10.3390/su142315745
Submission received: 24 September 2022 / Revised: 22 November 2022 / Accepted: 24 November 2022 / Published: 26 November 2022
(This article belongs to the Section Sustainable Transportation)

Abstract

:
High-speed rail (HSR) is advancing at an unprecedented speed in China. However, its impact on the road passenger transport (RPT) is under-investigated. In this paper, a questionnaire survey of RPT and HSR passengers in Shaoguan, Wenzhou, and Shantou, China, was carried out to pursue the sustainable development of RPT and HSR from the aspect of passenger mode choice behavior. The travel mode in the three cities was further investigated using a binary logit model. The findings show that improving the safety and comfort of RPT, as well as the fares and convenience of HSR, are most likely to change passenger choice. For every one unit increase in passenger satisfaction with either the safety or comfort of RPT, the ratio of the probability of passengers choosing RPT to the probability of passengers choosing HSR will increase by 1.6 times and 4.8 times, respectively. Additionally, for every one unit increase in passenger satisfaction with either HSR fares or convenience, the ratio of probability of passengers choosing HSR to the probability of passengers choosing RPT will increase by 4.95 times and 7.011 times, respectively. This study’s results reveal the factors influencing passengers’ choice of HSR and RPT, providing crucial perspectives on sustainable developments for future HSR and RPT projects. Findings from this study may be used by transport planners to provide policy recommendations not just for China, but also for other countries that are building HSR systems.

1. Introduction

As a major passenger transport infrastructure, high-speed rail (HSR) has been widely brought into various countries [1], such as China, Japan, The Netherlands, France, etc. [2]. Research on the positive impact of HSR has attracted a lot of attention. It is proven that HSR plays a positive role in the economic development of countries [3], especially in less developed areas [4]. HSR trains greatly reduce the travel time between cities [5], alleviate labor spatial misallocation [6], and improve investment efficiency [7], thereby strengthening the economic and social links between the cities [8]. It should be acknowledged that the introduction of HSR has provided travelers with a new travel choice, but it is also gradually replacing transport modes such as airlines, intercity coaches, and private cars. In order to support the sustainable growth of various forms of transportation, it is essential to investigate the factors that affect travelers’ choice of travel mode.
This paper focuses on China which has seen a rapid growth of HSR in recent years. According to the statistics of UIC in 2022, China’s HSR network’s length is 40,474 km, more than 10 times that of the second place. Meanwhile, China possesses the world’s fastest HSR system, with a top speed of 350 km/h. The introduction of HSR not only gives travelers another more convenient, environmentally friendly, and time-saving travel option, but it also disarranges the current passenger transportation market. For a long period, RPT has been the preferred transport mode in China. For example, in 2007, RPT handled a total of 20.51 billion passenger trips, or 93.79 percent of China’s passenger traffic, while the share of the railway was of 6.21 percent. Since China’s first HSR line was launched in 2008, it has become popular with the public for its speed, safety, and comfort. In 2013-2020, the proportion of RPT gradually decreased, while the proportion of HSR exhibited a significant upward trend. In the aftermath of COVID-19, to avoid being exposed to others, passengers prefer to take private transport, such as bikes and vehicles [9]. As a result, in 2020, the proportion of HSR decreased by 40%, while the share of RPT descended even more by 47% (Figure 1).
With economic development and increasing travel demand, China will continue to increase the construction of its HSR network, which will more severely impact the RPT industry. However, an HSR system necessitates a long construction period [10], significant investments [11,12], and to meet demanding terrain requirements [13]. In contrast, RPT still plays an important role in passenger transport due to its greater flexibility in the selection of route, station, and schedule, as well as lower industry barriers and less operating costs. Therefore, studying the factors that influence the passengers’ choice between them, so as to explore how HSR and RPT can be synergistically and sustainably developed, is not only an important practical issue for China, but can also provide lessons for other countries that are building HSR systems.
The features of the travel mode preferences of HSR and RPT passengers are revealed in this research, which is based on a questionnaire survey. To this end, the remainder of this paper is arranged as follows: Section 2 reviews and comments on the existing literature; Section 3 proposes the survey methodology and econometric model and illustrates the data and variables; the statistical characteristics and regression results are presented in Section 4; conclusions and implications are offered in Section 5.

2. Literature Review

Two research streams are relevant to this paper, each of which we review below.

2.1. High-Speed Rail System and Other Transportation Modes

The establishment of a new HSR system can markedly alter the geographical distribution and market shares of present transportation modes. The majority of the previous literature studies show how the rise of HSR affects airlines, and airlines and HSR transportation are frequently considered as alternatives rather than enhancements.
One of the first to establish a model of competition between the two modes appears to be Janic (2003), who argues that HSR can compete with airlines over a broad range of distances, from 400 km to more than 2000 km [14]. Similarly, Rothengatter (2010) shows that air travel and HSR may compete intensely on routes longer than 1000 km in length [15]. Adler et al., (2010) analyze the competition between the two modes in the different distance transport markets based on game theory [16]. The increased speed of HSR has a deeper detrimental effect on the demand and price of airlines, especially for short-distance routes [17].
Gonzalez-Savignat (2004) suggests that if HSR upgrades its services, it will largely replace the airline, predicting that in the commercial sector, HSR is anticipated to capture 40% of the market, and in the leisure sector, approximately 60% [18]. The substitution effect of HSR on air transport is produced by luring traditional air travelers [19,20]. HSR could draw about 25% of the passenger market share once the infrastructure has been updated, according to Martin and Nombela (2007) [21] and Roman et al., (2007) [22]. Yang et al., (2018) find that the introduction of HSR typically results in a 27% decrease in demand for airlines [23].
Chou et al., (2018) find that, in the long term, HSR has an adverse impact on traditional rail and airlines, and in the short term, it meets different passenger needs [24]. The competition between HSR and airlines in Western Europe was examined by Dobruszkes (2011), who also carried out an empirical analysis of five city pairings. He discovers that a number of factors, including timing, frequency, costs, airline hubs, and the physical layout of urban centers, have an impact on the rivalry between these two means of transportation [25]. Chantruthai et al., (2014) suggest that HSR and low-cost airlines are competitive depending on a number of parameters, including trip time, income, fares, user occupation, and educational attainment [26]. Zhang et al., (2019) find that on routes accompanied by HSR services, airlines have less monopoly power, provide fewer services, and offer lower fares [27]. There are a few studies that hold a different view, arguing that HSR and airlines are not always in competition, and some major European airports have HSR transfer hubs, which have significantly increased the efficiency of passenger travel [28,29].
In addition, HSR also has an impact on traditional railway transport (TRT). Considering other factors such as cost, habit, and time, most low- and middle-income passengers prefer TRT [30], especially for long-distance travel, where traditional trains with sleepers are more comfortable than HSR trains [31]. The capacity of a freight train is increased by HSR’s substitution effect on TRT, according to Cheng and Cheng (2021) [32]. Li et al., (2020) found that while the trip duration and price were not significantly affected by the introduction of HSR, the frequency of regular trains was markedly reduced [33].
While HSR is given a lot of attention, research on its impact on RPT is relatively scarce due to the unavailability and lack of data. Zhou (2019) analyzes the impact of HSR on highway passengers and civil aviation passengers based on the data from the Ministry of Transport’s internal thematic research [34]. He finds that HSR has had a significant impact on parallel RPT lines, especially on long-distance lines (more than 400 km). Additionally, he concludes that the convenience of transfer to HSR is a key factor in the traffic of RPT, but this effect tends to weaken as the travel distance increases. An innovative type of study observes the change in air quality on the highways following the availability of HSR. Guo et al., (2020) reach the conclusion that the reduction in air pollution stems from the substitution effect of HSR on highways [35].

2.2. Discrete Choice Analysis

The nature of transportation modal choice decision-making is a discrete choice analysis. Based on the random utility theory, this analysis makes the assumption that a passenger favors the mode that offers the greatest benefit [36]. A large number of studies have used the discrete choice model to analyze the behavior of the passenger decision process such as passenger’s modal choice (PMC) [37,38], choice of car type [39], and choice of tourist destinations [40]. In order to examine the factors influencing passengers’ modal choice between HSR and airlines, many typical factors are taken into consideration, such as travel time, cost, and frequency [41]. By employing a mixed logit model and two novel variables, i.e., safety and availability of duty-free shopping, Lee et al., (2016) conclude that business travelers and leisure travelers have different factors to consider when selecting their method of transportation [42].
Regarding changes in the preferred mode of transportation, the majority of the literature uses the logit model, which can take many different forms, including binary and multinomial logit models. Lee et al., (2016) analyze the PMC between HSR and airlines using the binary logit model [42]. If the number of PMCs is three or more, the multinomial logit model is a good choice [43,44]. The nested logit model is used by Wen et al., (2012) to depict the diversity mode correlation structure and traveler demand diversity [45].
Gundelfinger-Casar and Coto-Mill (2017) find that when deciding whether HSR will complement or replace airlines, the price and journey time seem to have the most significant effects [46]. Kwan et al., (2018) study the travel patterns in Kuala Lumpur and reach the conclusion that people’s choice of mass rail transit for weekday travel was influenced by a number of factors such as distance and purpose, while weekend travel was mainly influenced by travel time and the presence of children [47]. Su et al., (2019) surveyed the Beijing–Shanghai HSR line in China, and argue that passengers are less likely to choose airlines if it becomes more crowded and has longer waiting times. In terms of passenger characteristics, airlines are preferred by female and younger passengers, and leisure passengers are more price-conscious [48]. Shi et al., (2022) investigate that the important factors that determine transportation modes are gender, the cost and time of the trip, as well as companions [49]. According to a questionnaire survey conducted by Talpur et al., (2022) in Badin on 100 randomly selected homes, rural households’ decision-making about travel may be negatively impacted by factors such as larger households, lower income, and longer travel distances and times [50].

2.3. Research Contribution and Novelty

This literature review implies that, on one hand, a considerable number of researchers have examined how HSR affects economic and social development, and its impact on airlines and TRT, while little research has been conducted on the impact of HSR on RPT. On the other hand, most of the existing literature uses secondary statistics for analysis and the few that use questionnaires are mostly on relatively small samples from one region. According to the authors’ knowledge, this study is innovative in at least three aspects: (1) From the research perspective, this is the first work to focus on the competition between HSR and RPT from the perspective of travel mode choice. (2) In terms of methodology, this is the first econometric analysis of the factors affecting passengers’ choice between HSR and RPT based on a field survey with a large sample, rather than just a theoretical analysis. (3) Furthermore, this paper carries out a comparative analysis across regions where HSR has been in operation for many years as well as across those with newly established HSR systems.

3. Methodology and Data

3.1. Survey

In the field of transportation research, surveys are crucial for gathering data and identifying the ground realities of the research subjects [51]. The survey among RPT operators shows that HSR significantly affects the long-haul RPT industry, but has little impact on the short-haul RPT industry. Therefore, the survey in this paper focuses on the long-haul RPT industry. Since first-tier cities with a large workforce population contain a high number of companies and colleges, the road segments between the first-tier cities and their nearby cities have the largest ridership. Therefore, three second- or third-tier cities close to first-tier cities, namely Shantou, Shaoguan, and Wenzhou, are selected as field survey sites in this paper. On one hand, they all have a long operating time in the PRT market with high passenger volumes. On the other hand, they serve as important transportation hubs, passing through HSR lines with different operating schedules. Specifically, the Xiamen–Shenzhen line passing through Shantou was newly opened at the time of the survey, while the Wuhan–Guangzhou line passing through Shaoguan and the Shanghai–Hangzhou line passing through Wenzhou had been operating for a long time. Therefore, the three segments as survey subjects will contribute to the comparative analysis of the impact of HSR on RPT and the plausibility of the conclusions.
We conducted our research from March to May 2015 at HSR and RPT stations in Shaoguan (Figure 2), Shantou (Figure 3), and Wenzhou (Figure 4). Five researchers from our team distributed questionnaires in the squares, waiting rooms, and nearby convenience stores, fast food restaurants, and cafes of each high-speed railway and passenger station. We surveyed a random sample of passengers and gave the surveyed passengers a city map to motivate the respondents. A total of 1324 questionnaires were sent out and 1269 questionnaires were collected. After eliminating nonsense answers or incomplete questionnaires, 1142 valid questionnaires were obtained, with a sampling efficiency of 89.9%, including 371 for Shaoguan, 298 for Wenzhou, and 473 for Shantou, covering various ages, genders, income levels, and occupations in the sample.
The following data were successfully identified and extracted using a structured questionnaire: (1) passengers’ personal situation, including age, gender, income, education level, etc.; (2) passengers’ travel situation, including travel purpose, travel frequency, travel habits, ticket purchase channels, factors influencing the choice of transportation mode, etc.; and (3) passengers’ satisfaction with high-speed rail and highway passenger transportation, including satisfaction evaluation of fares, comfort, safety, punctuality, convenience (including convenient ticket purchase and convenient transfers) and service quality of high-speed rail and passenger cars.

3.2. Model

The binary logit regression has been widely used in the analysis of discrete choice for traffic [47,52]. In order to examine the factors influencing the passengers’ modal choice of HSR or RPT, we adopt the binary logit model with a binary dependent variable, where the explained variable is the transport mode (RPT or HSR) chosen by passengers and can take only two values, namely “0” and “1”. y_i = 1 indicates passenger i takes HSR to travel, and y_i = 0 indicates the i-th passenger chooses RPT. There are ten explanatory variables which are passengers’ evaluations of the two modes in terms of five indicators, including fare level [43], extent of comfort [53], safety [54], ease of ticket-buying [11], and customer service [55]. Then, we define the odds ratio as the ratio of the probability of passenger i opting for HSR to the probability of passenger i opting for RPT 1 − p_i, to remove the upper limit of the value range:
Ω i = p i 1 p i
Next, we take the log of the odds ratio to remove the lower limit of the value range:
l o g i t ( p i ) = ln ( Ω i ) = l n ( p i 1 p i )
Assuming the factors affecting l n ( p i 1 p i ) include x 1 ,   x 2 ,   ,   x j ,   j = 10 , and they obey the linear model, then the regression equation of the logit model is as follows:
l o g i t ( p i ) = l n ( p i 1 p i ) = x j β ,   j = 1 ,   2 ,   ,   10
where xi is a vector containing explanatory variables, and x 1 ,   x 2 ,   ,   x 10 are index variables. Following Su et al., (2019) and Shi et al., (2020) [48,49], these represent fare level, extent of comfort, safety, ease of ticket-buying, and customer services of HSR and RPT, respectively. β is the coefficient vector.
Since logit transformation inputs the data into a one-to-one correspondence (bijection), we can obtain the probability of passenger i to take HSR with the inverse function of the above equation. Thus, the explained variable can be defined as:
y i = p ( x i ) + ε i = e x p ( x j β ) 1 + e x p ( x j β ) + ε i

3.3. Data and Variables

In order to analyze every indicator and factor for passengers’ choice of transport modes between RPT and HSR, we collected 1142 effective questionnaires completed by RPT and HSR passengers, including 371 for Shaoguan, 298 for Wenzhou, and 473 for Shantou. During the process of model analysis, following the previous literature, we selected 5 factors influencing passengers’ choice of transport modes, such as fare level, extent of comfort, safety, ease of ticket-buying, and customer service. These variables are assigned values based on the satisfaction of passengers, with 1 being for “Very satisfied”, 0.8 for “Satisfied”, 0.6 for “Fair”, 0.4 for “Dissatisfied”, and 0.2 for “Very dissatisfied”. The main variable definition and descriptive statistics features are listed in Table 1:

4. Results and Discussion

4.1. Statistical Characteristics

A total of 1442 effective questionnaires were used in the analysis. Figure 5, Figure 6, Figure 7, Figure 8, Figure 9, Figure 10, Figure 11 and Figure 12 show the statistics of the respondents’ characteristics and considerations in choosing to travel by HSR or RPT. By accounting for the gender balance of survey participants during the survey process, sample biases were avoided. According to the respondents’ age distribution, people between the ages of 50 and 60 represent the majority of the respondents (approximately 64%). In contrast to self-employed individuals and other categories, students (26.8%) and office workers (41.3%) represented the bulk of the respondents. As seen in Figure 5 and Figure 6, the surveys of both passengers choosing HSR or RPT indicate that HSR has, in varying degrees, affected the majority of the passengers’ trips.
Figure 7 shows the income distribution of RPT and HSR passengers: RPT is chosen primarily by passengers with a monthly income below CNY 3500, while the HSR service is available to a relatively wider range of income levels, with a majority of passengers coming from the CNY 3500 to CNY 7000 income range. Figure 8 reveals that both RPT and HSR passengers are sensitive to fare increases, with the majority of them only accepting increases of less than 20%. However, there is still a significant portion of passengers who are not sensitive to fare increases, primarily driven by business travel (expenses can be reimbursed by employers), high incomes, as well as holidays and festivals. Therefore, we can conclude that income level affects the choice of HSR or RPT for most passengers traveling.
As shown in Figure 9, speed and comfort are the two factors that passengers who choose RPT or HSR consider most when selecting their method of transportation. Furthermore, the passengers who choose HSR are more concerned about timely performance, while the passengers who choose RPT pay more attention to fare level and safety. According to the suggestions for improvements in Figure 10, both HSR and RPT passengers expect lower fares, higher comfort of RPT, as well as better road conditions.
Figure 11 and Figure 12 indicate that passengers chose RPT primarily due to its flexible routes, door-to-door service, and long-standing travel habits. A significant amount of passengers most likely have to take RPT because they fail to buy HSR tickets. A survey on passengers who choose HSR shows that they do not choose RPT because it takes too long and is less comfortable and safe.

4.2. Benchmark Regression

Table 2 shows the binary logit results from model (3) using the full datasets. From the regression results, we can see that the passengers’ choice of transportation mode is influenced, at different significance levels, by the fares and extent of comfort of HSR and RPT, the ease of ticketing of HSR, and the safety of RPT.
The coefficients after the exponentiation process are listed in the third column of Table 2. The value of eb indicates the change factor of the odds ratio of passengers choosing HSR when the related indicator changes by one unit holding other variables constant. The value of ebStdX in column 4 indicates the change factor of the odds ratio of passengers choosing HSR when the related indicator changes one standard deviation. Given the fact that the logit model is nonlinear, we also analyzed the marginal effect. The value of dy/dx in column 5 presents the AME (average marginal effect) of the marginal effect of the observation value. In this logit model, it indicates the fluctuation in the probability of passengers choosing HSR when the value assigned to an indicator changes by one unit. We can see that different indicators have different influences on passengers’ decisions for choosing HSR or RPT at different significance levels. Specifically, the effects of these indicators are as follows:
  • We can see from the regression results that enhancing the safety and comfort of RPT and reducing the rate of accidents may be the best way to increase the probability of passengers choosing RPT. The eb values of safety and extent of comfort indicators of RPT are 0.186 and 0.402, respectively, and the AME values are −0.382 and −0.207, respectively. This shows that, with the other conditions remaining unchanged, when the passengers’ satisfaction with either the safety or comfort of RPT augments by one unit, the average probability of choosing HSR will decrease by 0.382 and 0.207, respectively. Additionally, the ratio of the probability of passengers choosing RPT to the probability of passengers choosing HSR will increase by 1.6 times and 4.8 times, respectively.
  • We also note that providing support for deserving RPT operators to optimize operating costs and provide more room for lowering RPT fares could also stimulate more passengers to choose RPT travel. The eb and the AEM values of Cprice are 0.27 and −0.297, respectively. This indicates that, with the other conditions remaining unchanged, and when the satisfaction of the passengers toward the fare of RPT increases by one unit, the average probability of passengers choosing HSR will decrease by 0.297. Thus, the ratio of the probability of passengers choosing RPT to the probability of passengers choosing HSR will increase by 2.7 times (the value of eb is 0.27, indicating that when the satisfaction of the passengers toward the fare of RPT changes by one unit, the odds ratio of passengers choosing bullet trains will decrease to 0.27 times the original value. In other words, the odds ratio of choosing RPT increases to 1/0.27 times the original value, which is an increase of 1/0.27−1 = 2.7 times. The calculation is the same below).
  • Conversely, lower fares, better comfort, and convenient ticketing channels for HSR will make travelers prefer HSR, reducing the probability of passengers choosing RPT. The eb values of fare, extent of comfort, and ease of ticketing are 5.95, 5.776, and 8.011, respectively. Additionally, the AME values are 0.405, 0.398, and 0.472, respectively. Specifically, with the other conditions constant, when the passengers’ satisfaction with the fare of HSR increases by one unit, the average probability of choosing HSR will increase by 0.405 and the odds ratio will increase by 4.95 times; when the passengers’ satisfaction with the comfort of HSR increases by one unit, the average probability of choosing HSR will increase by 0.398 and the odds ratio will increase by 4.776 times; when the passengers’ satisfaction toward the ease of HSR ticketing increases by one unit, the average probability of choosing HSR will increase by 0.472 and the odds ratio will increase by 7.011 times. Unexpectedly, the ease of HSR ticketing has a greater impact on the passengers’ choice of transportation mode than the fare and comfort levels.

4.3. Regional Heterogeneity

Meanwhile, we conducted a regression analysis on subsamples of passenger questionnaires from Shaoguan, Wenzhou, and Shantou, evaluating their contribution to the odds ratio and AEM values. Table 3 indicates that the five indicators, namely fare level, comfort, safety factor, ease of ticketing, and customer service have different degrees of influence on passengers’ choice of HSR or RPT, which may be caused by the travel options available in the region and the passengers’ preferences. However, we can see that the accuracy of the regression prediction is between 58.05% and 70.62%, which is relatively high.
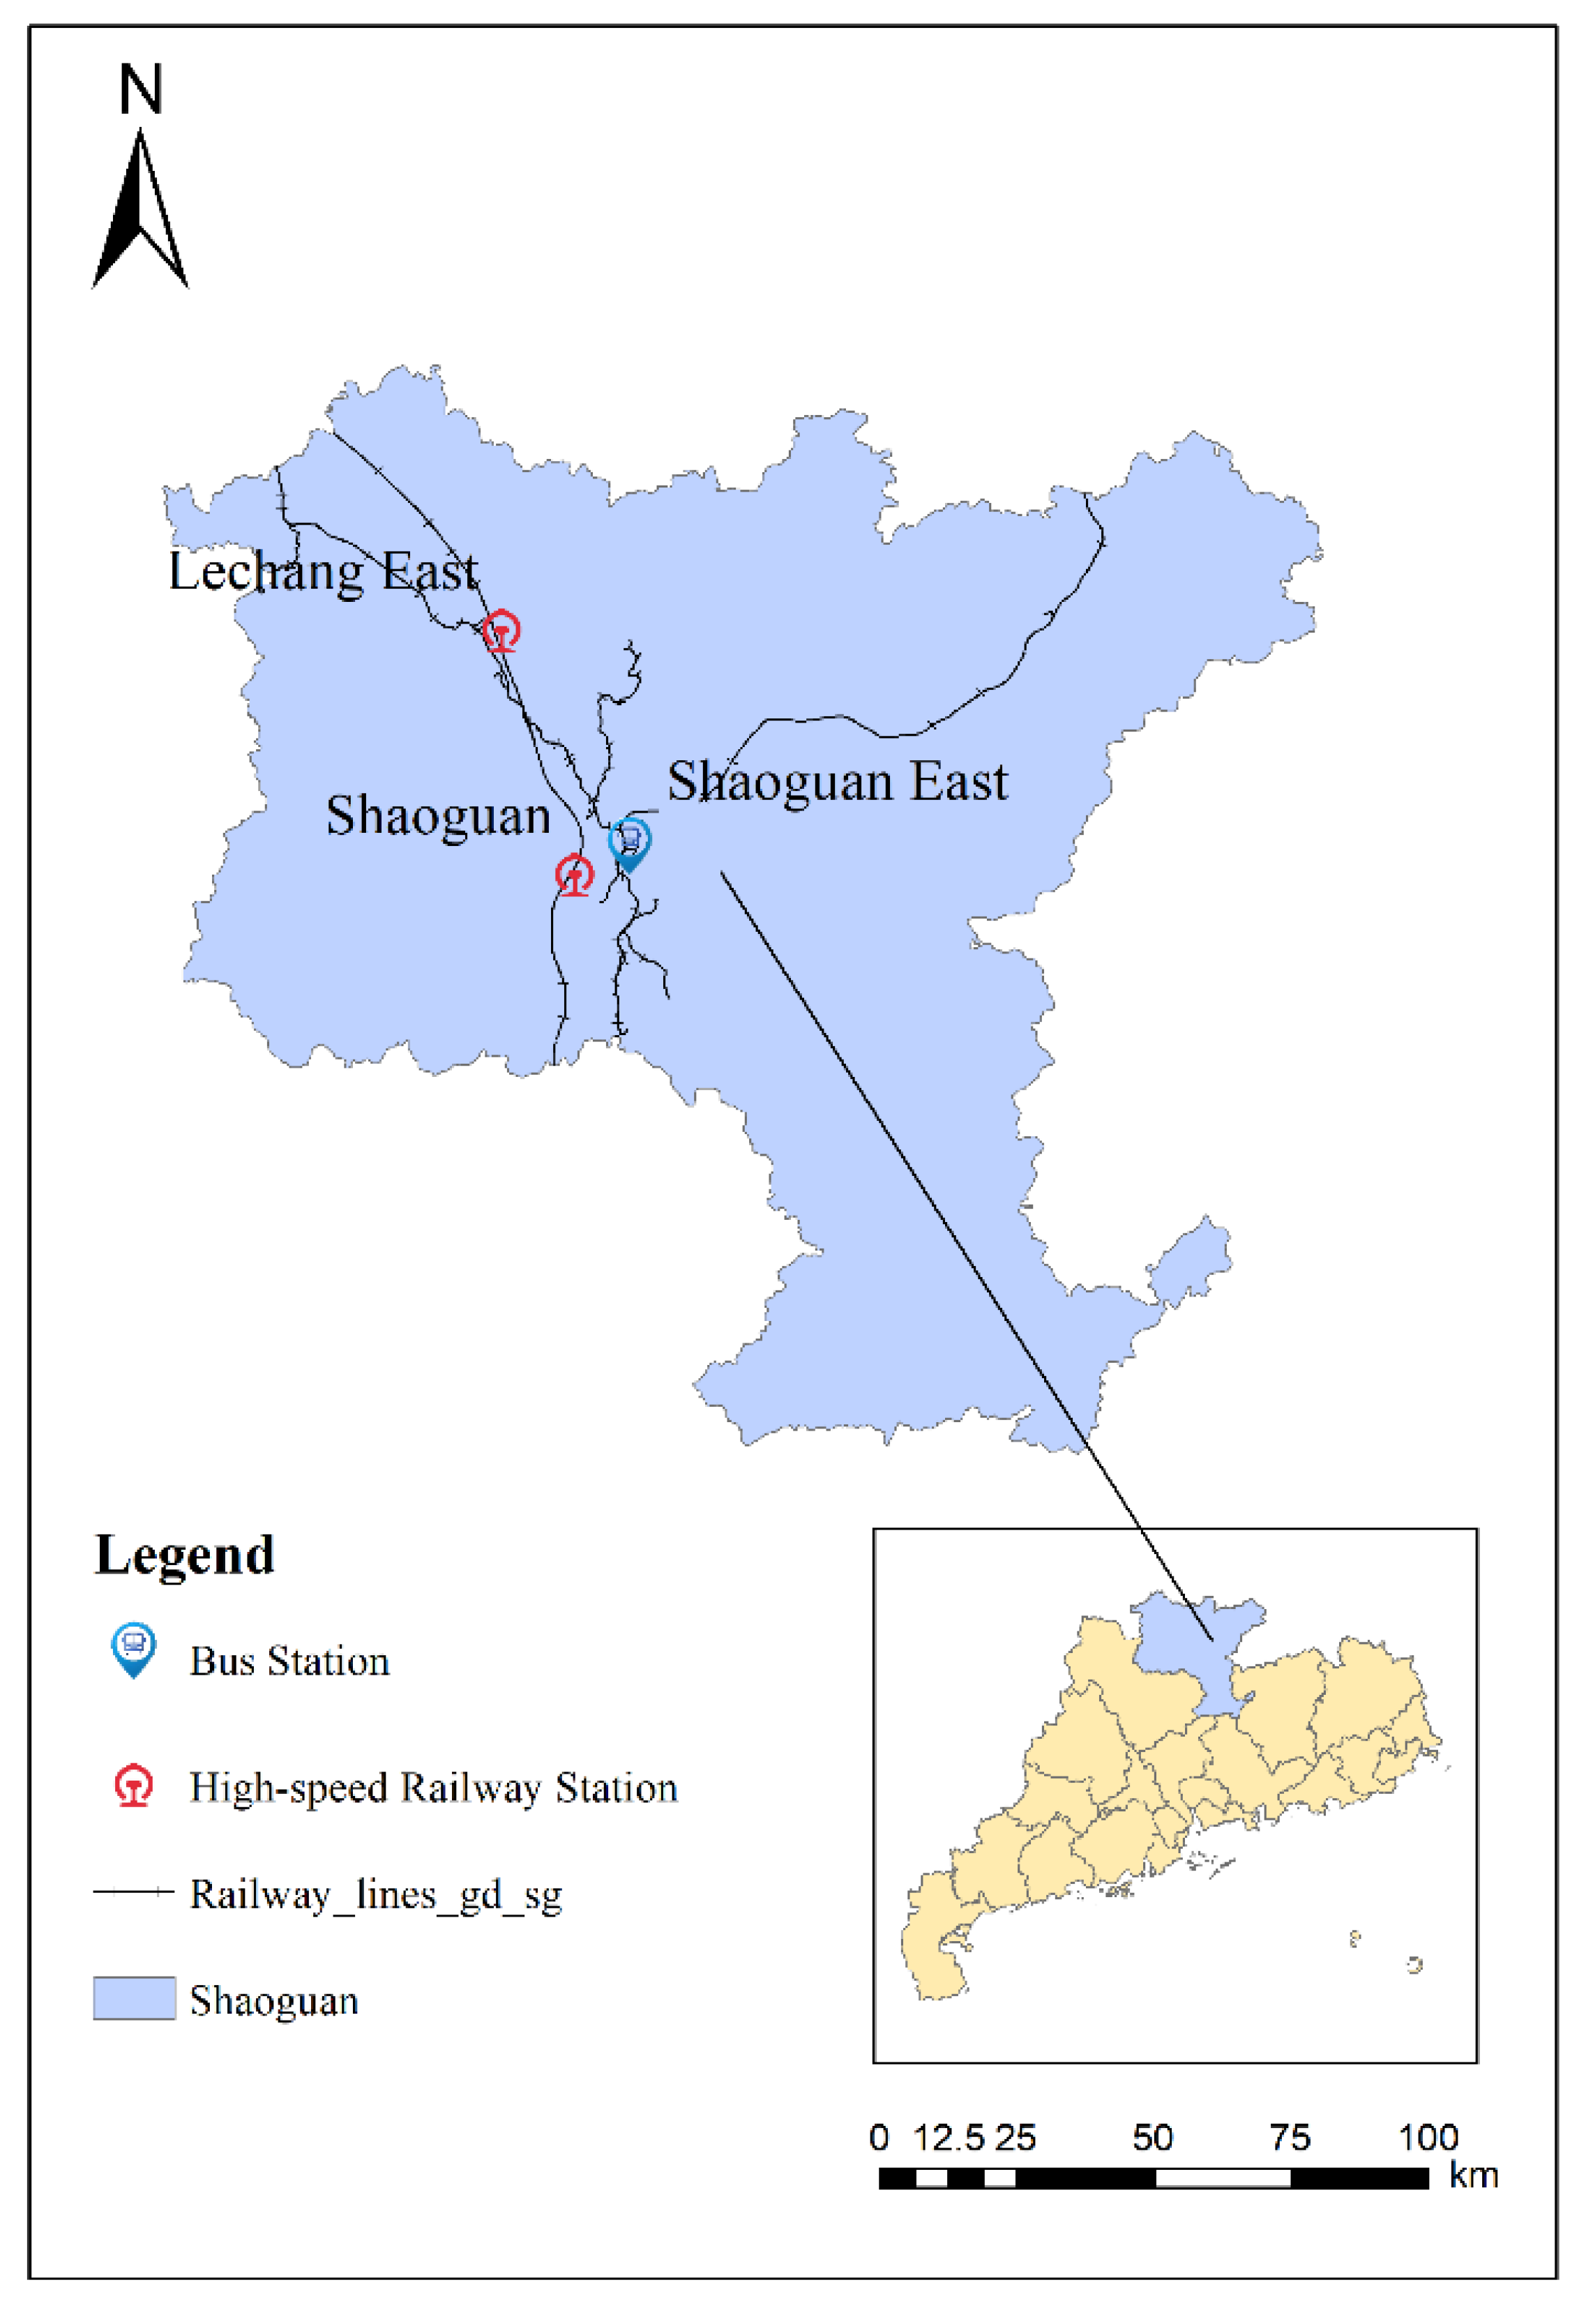
  • For passengers in Shaoguan, many factors have a significant impact on their choice between HSR and RPT. The fare and ease of ticketing of HSR, as well as the fare, the comfort, and the safety of RPT have a significant impact on the passengers’ decisions at the significance level of 1%, while the safety and customer service of HSR have a significant impact at the 10% level. Among these, the most significant factors are the fares of HSR and RPT, the ease of HSR ticketing, and the safety and comfort of RPT. Holding all other factors constant, if the satisfaction with either the fare or ease of ticketing of HSR increases by one unit, the probabilities of the passengers’ choosing HSR will rise by 0.582 and 0.652, respectively, and the odds ratios will rise by 20.503 and 29.981, respectively. If the passengers’ satisfaction with either fares, safety, or comfort of RPT increases by one unit, the probabilities of the passengers’ choosing HSR will decrease by 0.584, 0.546, and 0.592, respectively, and the odds ratios will decrease by 20.7, 16.9, and 21.7 times, respectively.
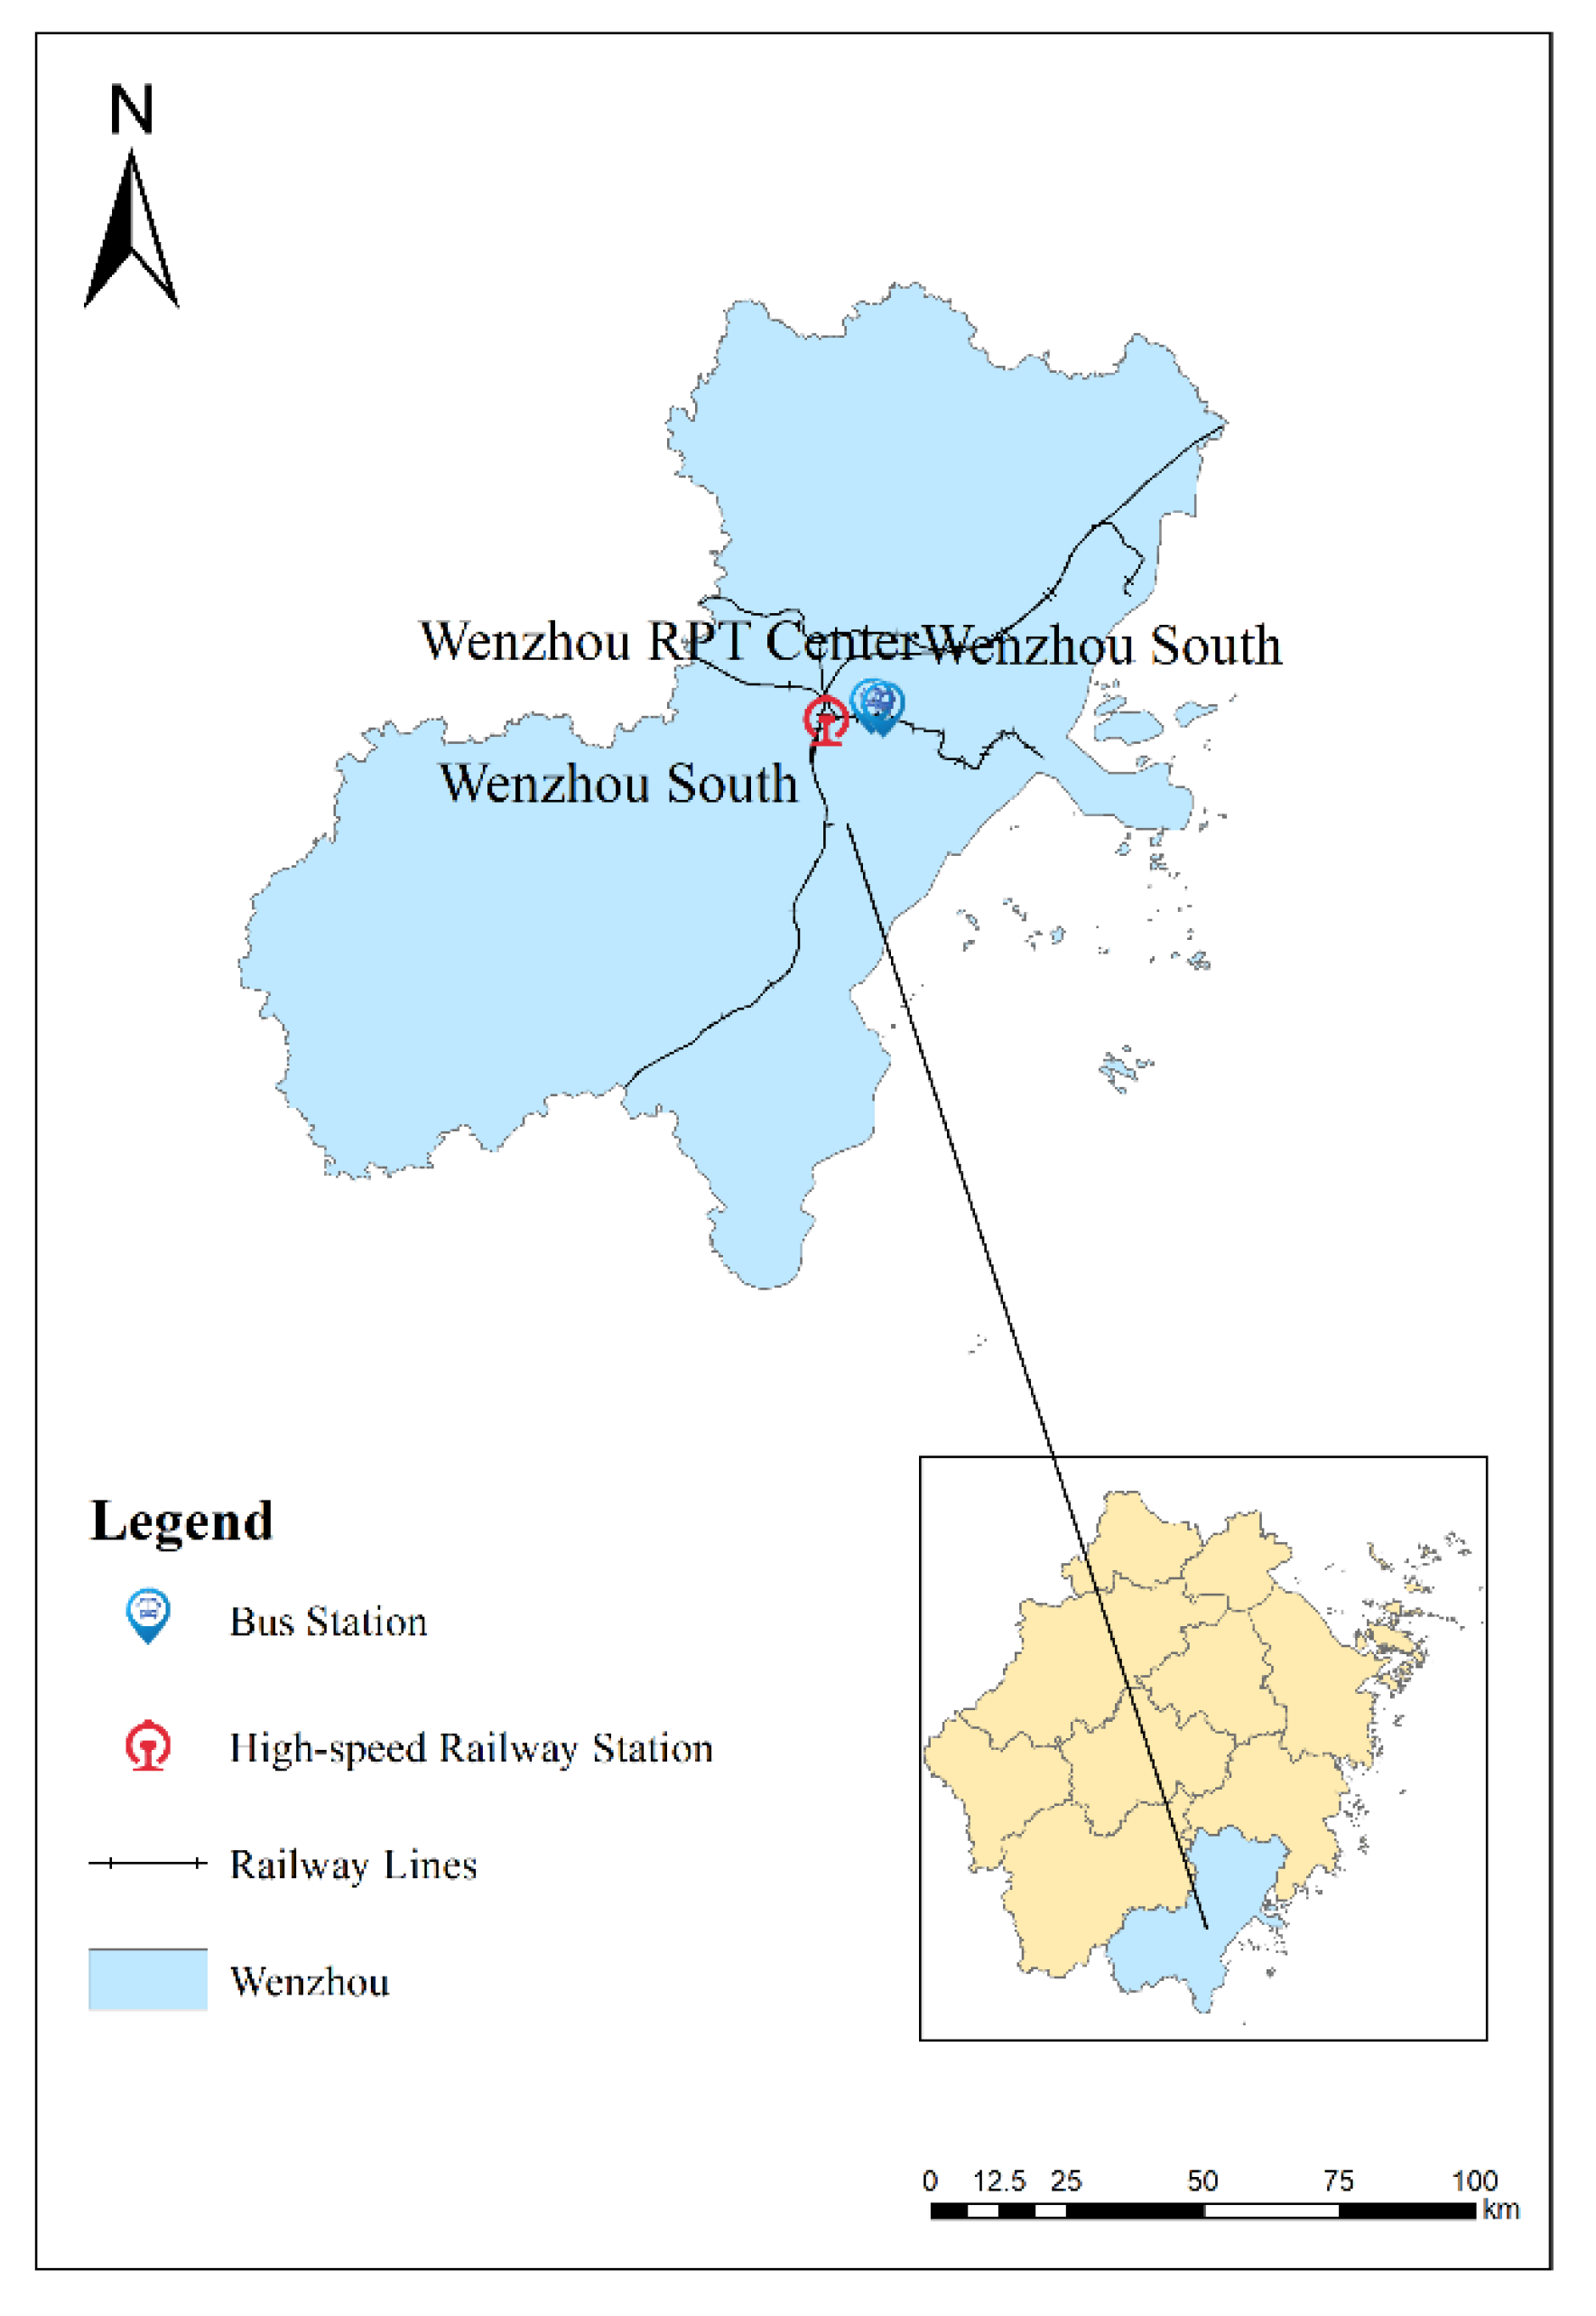
  • There are relatively limited factors affecting the travel choices of Wenzhou passengers. Among these fourteen explanatory variables, only the fare of RPT has a significant impact on the odds ratio. For samples from Wenzhou, the eb and AEM values of fare index for RPT are, respectively, 0.175 and −0.417. In other words, holding other factors constant, if the Wenzhou passengers’ satisfaction with RPT increases by one unit, their probability of taking HSR will decrease by 0.417 and the odds ratio for them taking RPT will rise by 4.7 times. We must consider that, in the questionnaire, the satisfaction scores of the Wenzhou passengers were generally higher than those of the other two cities. Therefore, we speculate that the insensitivity of the Wenzhou passengers’ travel mode choices to most indicators may be due to their high level of passenger satisfaction.
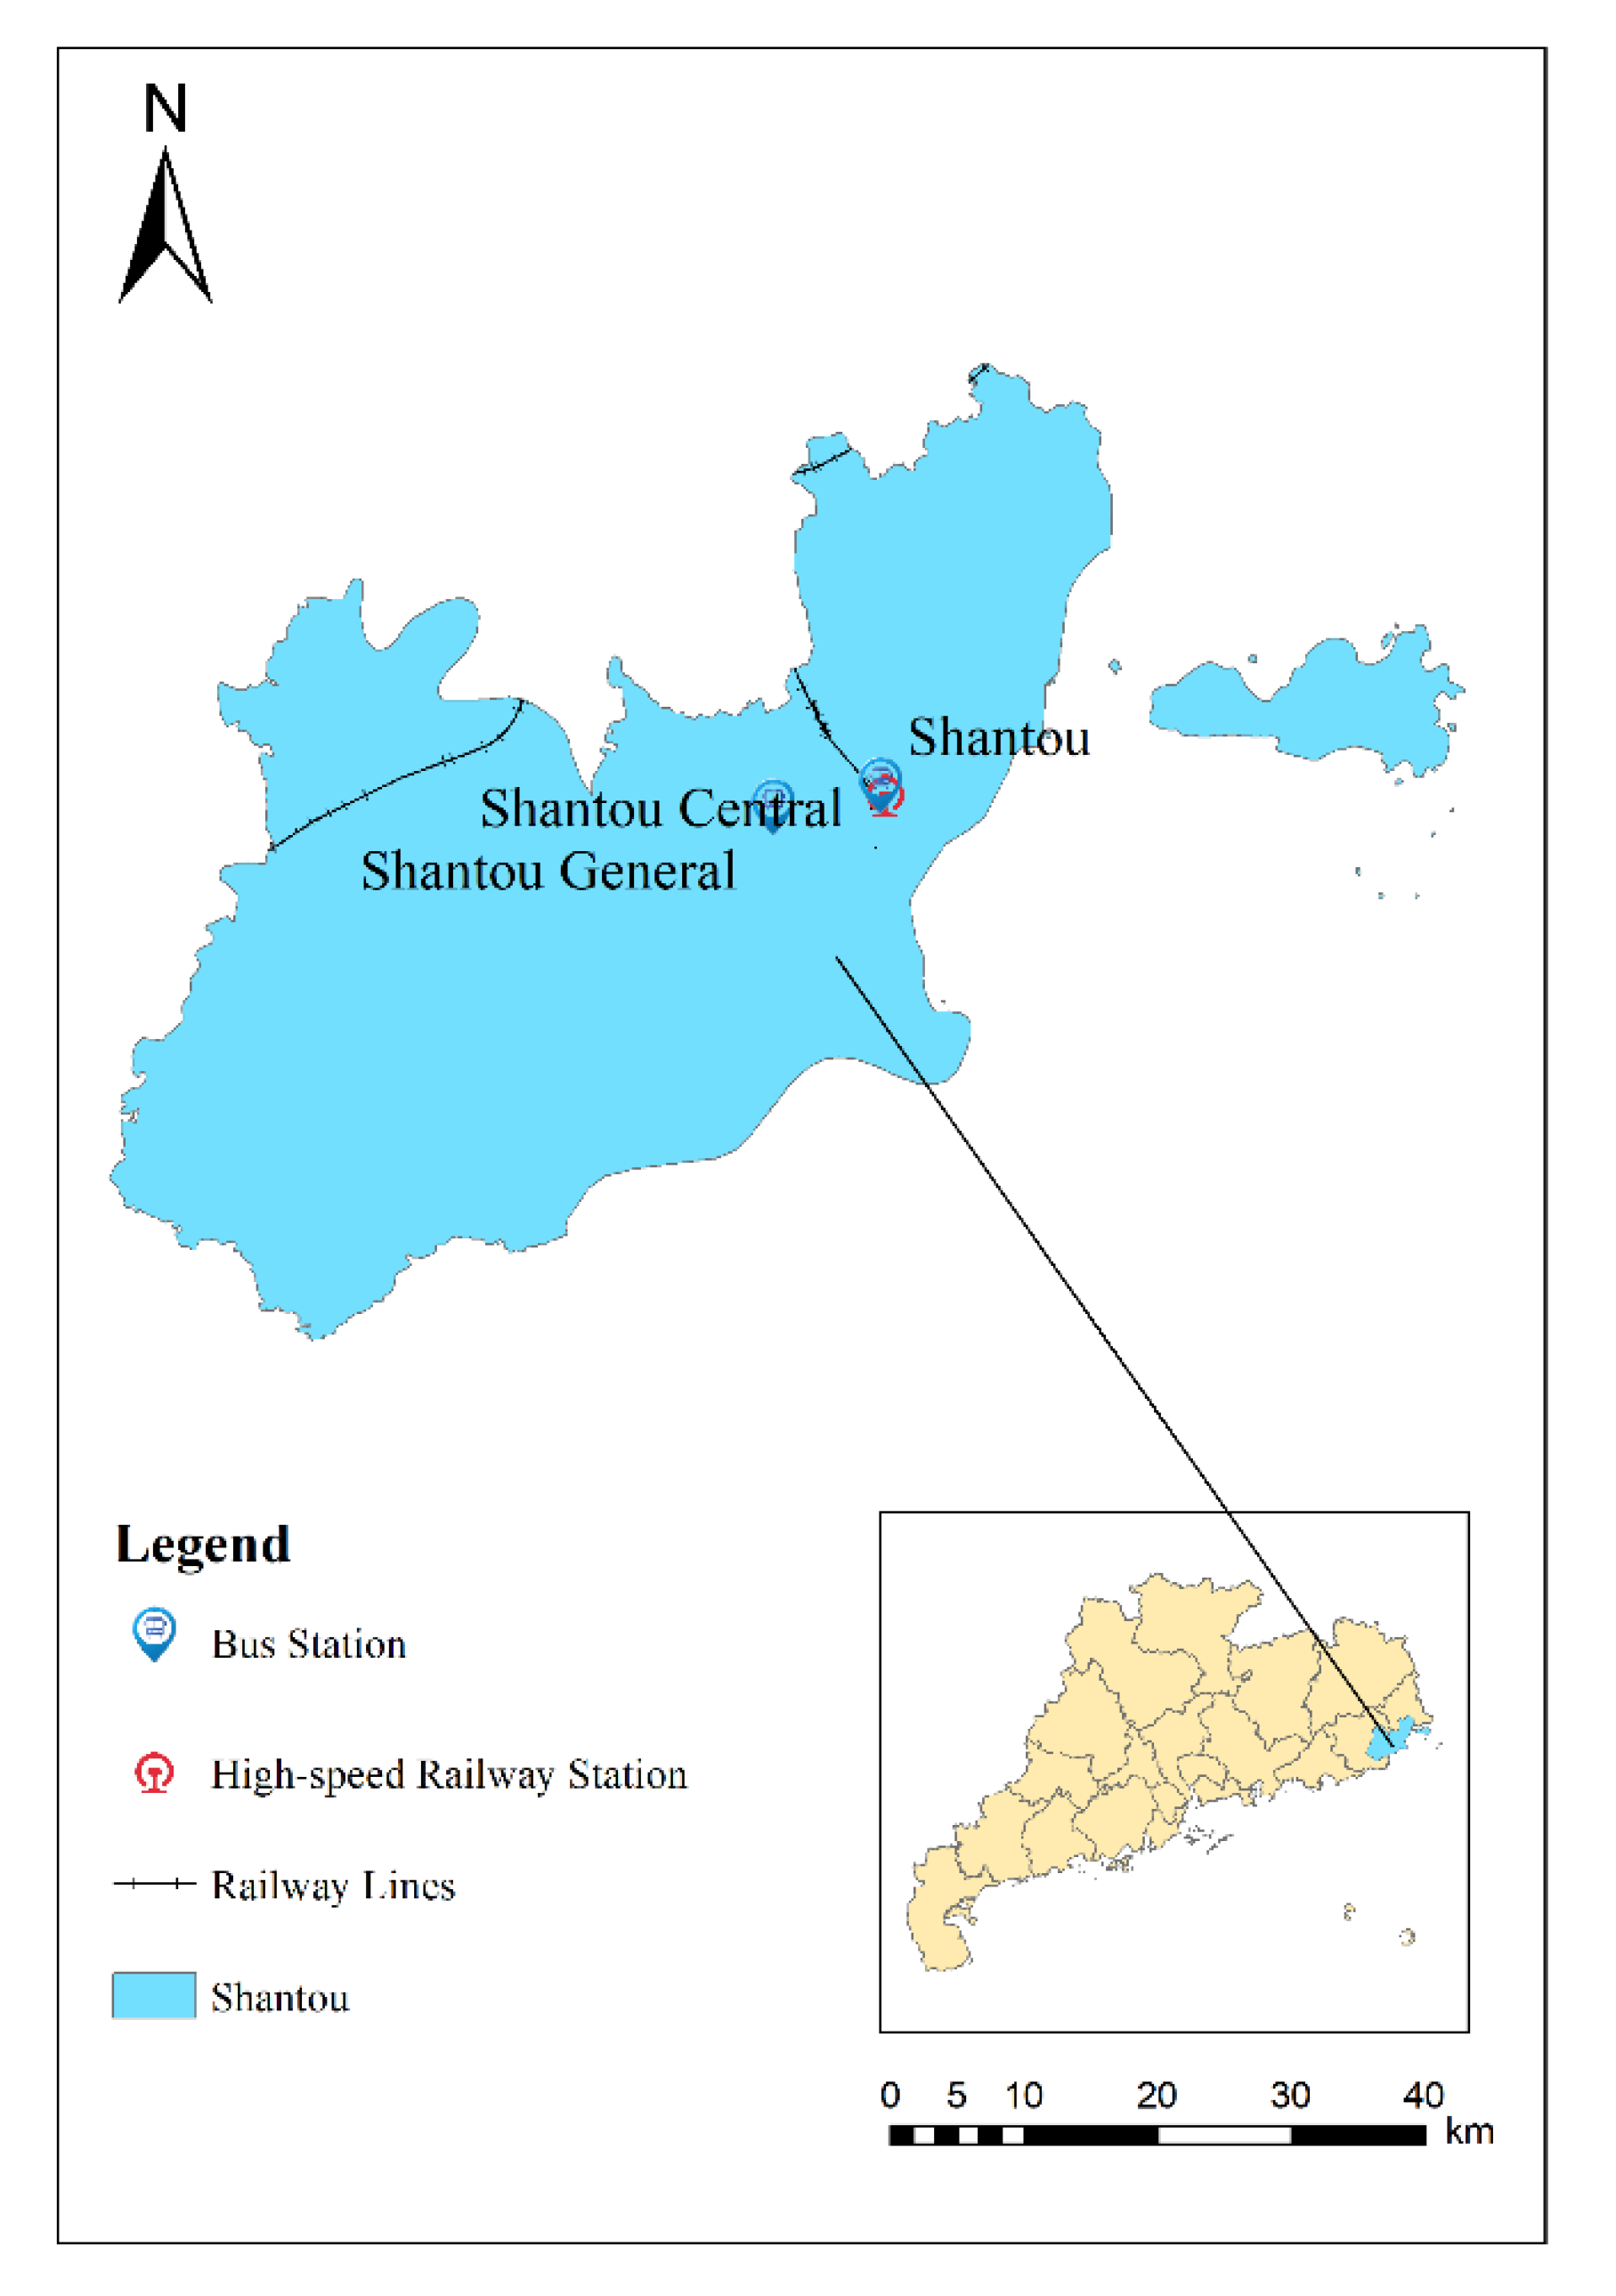
  • For passengers in Shantou, the impact of an increase in the HSR indicator on their choice of transportation mode is more pronounced compared to RPT. With other factors constant, if the satisfaction with either fare, comfort, or ease of ticketing increases by one unit, the average probability of passengers’ choosing HSR will increase by 0.394, 0.509, and 0.398, respectively, and the odds ratio will increase by 4.787, 8.68, and 4.897 times, respectively. If the passengers’ satisfaction with the safety of RPT increases by one unit, their probability of their taking HSR will decrease by 0.303, and the odds ratio of taking RPT will increase by 2.86 times. Judging from that, unlike the passengers from Shaoguan and Wenzhou, the passengers in Shantou are more sensitive to the comfort of HSR when choosing their transport mode. Additionally, they do not care about the fare of RPT.

5. Conclusions and Implications

HSR and RPT are both indispensable and irreplaceable in China, yet studies on the factors influencing the passengers’ transportation mode choices between HSR and RPT are scarce. We conducted a survey on HSR and RPT passengers from Shaoguan, Wenzhou, and Shantou to better understand how they choose between these two crucial modes of transportation. This was conducted to encourage the sustainable and synergistic development of HSR and RPT.

5.1. Conclusions

First, the statistical analysis leads us to the following conclusions: (1) The main factors that passengers consider when choosing a transport mode are running speed and comfort. In particular, passengers who choose HSR care more about punctuality than those who choose RPT, while passengers who choose RPT care more about fare level and safety factors. (2) Passengers with high incomes prefer HSR to RPT and those with lower incomes are likely to choose RPT, and passengers choosing RPT are more sensitive to fare change than those choosing HSR. (3) The main reasons for which passengers choose RPT are flexible routes, door-to-door service, and long-term habits. Additionally, the reasons for abandoning RPT are slow speed, long time, poor comfort, and low safety. (4) For passengers choosing RPT, they expect for road conditions to improve along with lower fares and higher comfort levels.
Then, to analyze the factors affecting transport mode choice between HSR and RPT, this research applies the survey results to construct a logit model of HSR and RPT in Shaoguan, Wenzhou, and Shantou. The conclusions suggest that: (1) Reducing the fare of RPT and improving its comfort and safety factors will greatly increase the probability of passengers choosing RPT. (2) Reducing the fare of RPT and improving its comfort and ease of ticketing will lead to an increase in odds ratio at the 1% significance level. With a one-unit increase in satisfaction with either fare, comfort, or ease of ticketing of HSR, the odds ratios of choosing HSR will increase by 5.95, 5.776, and 8.011 times, respectively. In addition, improving the comfort of HSR can raise the odds ratio of passengers taking it to some degree. (3) Passengers in different cities have different sensitivities to the five indicators. For example, the fare and ease of ticketing of HSR, as well as the safety factor of RPT have more impact on passengers in Shaoguan and Shantou than those in Wenzhou. However, the passengers in Wenzhou are more concerned about the fare of RPT.

5.2. Policy Implications

Based on the above analysis, in order to make RPT and HSR complementary and sustainable, as well as to maximize their overall utility, RPT should build on its strengths and avoid its weaknesses. To be more specific, for RPT companies: (1) They should expand their routes beyond the HSR system’s reach in view of RPT flexibility. At the same time, they should also reduce internal competition and establish combined transportation to improve their management system. (2) Reasonable prices should be set according to operating costs and the external environment, and reasonable adjustments to fare fluctuations should also be made based on operating conditions and time intervals. (3) In order to improve the safety of RPT, RPT companies should improve the relevant safety standards, conduct regular safety inspections, and strictly enforce 24/7 dynamic monitoring. (4) RPT companies should also update their equipment and optimize their routes in time. At the same time, they should attach importance to the internal cleaning of the cars and improve the satisfaction with the comfort level by improving the service quality of their employees. For government departments: (1) Since RPT passenger traffic varies greatly between holidays and non-holidays, government departments can set a range of local RPT fare fluctuations and subsidize RPT companies that comply with the regulations and operate legally. (2) The government should legislate relevant safety standards for RPT and conduct random inspections from time to time, to reduce overloading and driver violations, as well as to impose serious penalties or even shut down companies that violate the rules. (3) The government should make greater investments in road building and maintenance, as well as in city road planning, in order to lessen the traffic on inner-city roads and improve passenger comfort on RPT.

5.3. Limitations and Future Research

By identifying variables influencing the decision between HSR and RPT as a transport mode, this research may help improve transportation planning in countries where HSR is being built. However, there are certain limitations to this study, which opens up possibilities for future research: Although we have tried to collect as large a sample as possible, due to financial and time constraints, the scope of our survey was limited to three Chinese cities over the course of three months. As a result, our sample is likely to be biased and less generalizable, and the total sample size of the survey is still below the ideal amount. Future studies should, on one hand, investigate passengers’ behavior and preferences in a wider range as well as more remote areas, and it would be preferable to have access to national or even cross-country population census data. On the other hand, a more comprehensive analysis of the factors affecting travel mode choice should be provided, by adding factors from other theories, such as motivation, frequency, and geographic location.

Author Contributions

Investigation, Q.C.; Resources, Q.C.; Data curation, J.Y.; Writing—original draft, J.Y.; Writing—review & editing, Q.C., J.Y.; Visualization, Q.C.; Project administration, W.Y. All authors have read and agreed to the published version of the manuscript.

Funding

This research received no external funding.

Institutional Review Board Statement

Ethical review and approval were waived for this study for the following reasons. The survey is risk-free for any respondent, who will only be asked to answer about their views on high-speed rail and road passenger transport. In addition, the results of the survey will be used for academic surveys only and will not be analyzed for personal use or have any impact on individuals, and all personal information will be kept strictly confidential.

Informed Consent Statement

Written informed consent has been obtained from the respondent s to publish this paper.

Data Availability Statement

The data presented in this study are available on request from the corresponding author. The data are not publicly available due to they are all derived from questionnaire statistics from a field survey conducted by the authors.

Conflicts of Interest

The authors declare no conflict of interest.

References

  1. Jin, M.; Lin, K.-C.; Shi, W.; Lee, P.T.W.; Li, K.X. Impacts of high-speed railways on economic growth and disparity in China. Transp. Res. Part A Policy Pract. 2020, 138, 158–171. [Google Scholar] [CrossRef]
  2. Givoni, M. Development and Impact of the Modern High-speed Train: A Review. Transp. Rev. 2006, 26, 593–611. [Google Scholar] [CrossRef]
  3. Blanquart, C.; Koning, M. The local economic impacts of high-speed railways: Theories and facts. Eur. Transp. Res. Rev. 2017, 9, 12. [Google Scholar] [CrossRef] [Green Version]
  4. Liang, Y.; Zhou, K.; Li, X.; Zhou, Z.; Sun, W.; Zeng, J. Effectiveness of high-speed railway on regional economic growth for less developed areas. J. Transp. Geogr. 2020, 82, 102621. [Google Scholar] [CrossRef]
  5. Wu, W.; Liang, Y.; Wu, D. Evaluating the Impact of China’s Rail Network Expansions on Local Accessibility: A Market Potential Approach. Sustainability 2016, 8, 512. [Google Scholar] [CrossRef] [Green Version]
  6. Yan, L.; Tu, M.; Chagas, A.L.S.; Tai, L. The impact of high-speed railway on labor spatial misallocation—Based on spatial difference-in-differences analysis. Transp. Res. Part A Policy Pract. 2022, 164, 82–97. [Google Scholar] [CrossRef]
  7. Wu, Y.; Lee, C.-C.; Lee, C.-C.; Peng, D. Geographic proximity and corporate investment efficiency: Evidence from high-speed rail construction in China. J. Bank. Financ. 2022, 140, 106510. [Google Scholar] [CrossRef]
  8. Jiao, J.; Wang, J.; Jin, F. Impacts of high-speed rail lines on the city network in China. J. Transp. Geogr. 2017, 60, 257–266. [Google Scholar] [CrossRef]
  9. Ku, D.-G.; Um, J.-S.; Byon, Y.-J.; Kim, J.-Y.; Lee, S.-J. Changes in Passengers’ Travel Behavior Due to COVID-19. Sustainability 2021, 13, 7974. [Google Scholar] [CrossRef]
  10. Guo, Y.; Cao, L.; Song, Y.; Wang, Y.; Li, Y. Understanding the formation of City-HSR network: A case study of Yangtze River Delta, China. Transp. Policy 2022, 116, 315–326. [Google Scholar] [CrossRef]
  11. Delaplace, M.; Dobruszkes, F. From low-cost airlines to low-cost high-speed rail? The French case. Transp. Policy 2015, 38, 73–85. [Google Scholar] [CrossRef]
  12. Ma, L.; Niu, D.; Sun, W. Transportation infrastructure and entrepreneurship: Evidence from high-speed railway in China. China Econ. Rev. 2021, 65, 101577. [Google Scholar] [CrossRef]
  13. Zhai, W.; Wang, K.; Cai, C. Fundamentals of vehicle–track coupled dynamics. Veh. Syst. Dyn. 2009, 47, 1349–1376. [Google Scholar] [CrossRef]
  14. Janic, M. High-speed rail and air passenger transport: A comparison of the operational environmental performance. Proc. Inst. Mech. Eng. Part F J. Rail Rapid Transit 2003, 217, 259–269. [Google Scholar] [CrossRef]
  15. Rothengatter, W. Competition between airlines and high-speed rail. In Critical Issues in Air Transport Economics and Business; Routledge: London, UK, 2010; pp. 329–352. [Google Scholar]
  16. Adler, N.; Pels, E.; Nash, C. High-speed rail and air transport competition: Game engineering as tool for cost-benefit analysis. Transp. Res. Part B Methodol. 2010, 44, 812–833. [Google Scholar] [CrossRef]
  17. Wang, K.; Xia, W.; Zhang, A.; Zhang, Q. Effects of train speed on airline demand and price: Theory and empirical evidence from a natural experiment. Transp. Res. Part B Methodol. 2018, 114, 99–130. [Google Scholar] [CrossRef]
  18. González-Savignat, M. Competition in air transport: The case of the high-speed train. J. Transp. Econ. Policy 2004, 38, 77–107. [Google Scholar]
  19. Zhang, Q.; Yang, H.; Wang, Q. Impact of high-speed rail on China’s Big Three airlines. Transp. Res. Part A Policy Pract. 2017, 98, 77–85. [Google Scholar] [CrossRef]
  20. Kroes, E.; Savelberg, F. Substitution from Air to High-Speed Rail: The Case of Amsterdam Airport. Transp. Res. Rec. J. Transp. Res. Board 2019, 2673, 166–174. [Google Scholar] [CrossRef]
  21. Martín, J.C.; Nombela, G. Microeconomic impacts of investments in high speed trains in Spain. Ann. Reg. Sci. 2007, 41, 715–733. [Google Scholar] [CrossRef]
  22. Román, C.; Espino, R.; Martín, J.C. Competition of high-speed train with air transport: The case of Madrid–Barcelona. J. Air Transp. Manag. 2007, 13, 277–284. [Google Scholar] [CrossRef]
  23. Yang, H.; Zhang, Q.; Wang, Q. Airline Deregulation, Market Competition, and Impact of High-speed Rail on Airlines in China. In Advances in Airline Economics in Asia; Emerald Publishing Limited: Bingley, UK, 2018; pp. 79–101. [Google Scholar]
  24. Chou, C.C.; Shen, C.W.; Gao, D.; Gao, Y.; Wang, K.; Tsai, S.B. Modelling the Dynamic Impacts of High Speed Rail Operation on Regional Public Transport—From the Perspective of Energy Economy. Energies 2018, 11, 1151. [Google Scholar] [CrossRef] [Green Version]
  25. Dobruszkes, F. High-speed rail and air transport competition in western Europe: A supply-oriented perspective. Transp. Policy 2011, 18, 870–879. [Google Scholar] [CrossRef]
  26. Chantruthai, P.; Taneerananon, S.; Taneerananon, P. A Study of competitiveness between low cost airlines and high-speed-rail: A case study of southern corridor in Thailand. Eng. J. 2014, 18, 141–162. [Google Scholar] [CrossRef] [Green Version]
  27. Zhang, R.; Johnson, D.; Zhao, W.; Nash, C. Competition of airline and high-speed rail in terms of price and frequency: Empirical study from China. Transp. Policy 2019, 78, 8–18. [Google Scholar] [CrossRef]
  28. Givoni, M.; Banister, D. Airline and railway integration. Transp. Policy 2006, 13, 386–397. [Google Scholar] [CrossRef]
  29. Albalate, D.; Bel, G.; Fageda, X. Competition and cooperation between high-speed rail and air transportation services in Europe. J. Transp. Geogr. 2015, 42, 166–174. [Google Scholar] [CrossRef]
  30. Ren, X.; Chen, Z.; Wang, F.; Wang, J.; Wang, C.; Dan, T.; Du, Z. Impact of high-speed rail on intercity travel behavior change: The evidence from the Chengdu-Chongqing Passenger Dedicated Line. J. Transp. Land Use 2019, 12, 265–285. [Google Scholar] [CrossRef] [Green Version]
  31. Wu, R.N. Passenger Experience of China’s High Speed Rail (HSR) Service. Open J. Soc. Sci. 2018, 6, 253–259. [Google Scholar] [CrossRef] [Green Version]
  32. Cheng, J.; Chen, Z. Impact of high-speed rail on the operational capacity of conventional rail in China. Transp. Policy 2021, 110, 354–367. [Google Scholar] [CrossRef]
  33. Li, H.; Wang, K.; Yu, K.; Zhang, A. Are conventional train passengers underserved after entry of high-speed rail?-Evidence from Chinese intercity markets. Transp. Policy 2020, 95, 1–9. [Google Scholar] [CrossRef]
  34. Zhou, J. The Impact of High-speed Train on the Change of Comprehensive Passenger Structure. China Transp. Outlook 2019, 41, 7–11. [Google Scholar]
  35. Guo, X.; Sun, W.; Yao, S.; Zheng, S. Does high-speed railway reduce air pollution along highways? Evidence from China. Transp. Res. Part D Transp. Environ. 2020, 89, 102607. [Google Scholar] [CrossRef]
  36. Train, K. Discrete Choice Method With Simulation, 2nd ed.; Cambridge University Press: New York, NY, USA, 2009. [Google Scholar]
  37. Commins, N.; Nolan, A. The determinants of mode of transport to work in the greater Dublin area. Transp. Policy 2011, 18, 259–268. [Google Scholar] [CrossRef] [Green Version]
  38. Habib, K.M.N. Modeling commuting mode choice jointly with work start time and work duration. Transp. Res. Part A 2012, 46, 33–47. [Google Scholar]
  39. Choo, S.; Mokhtarian, P.L. What type of vehicle do people drive? The role of attitude and lifestyle in influencing vehicle type choice. Transp. Res. Part A Policy Pract. 2004, 38, 201–222. [Google Scholar] [CrossRef] [Green Version]
  40. Nicolau, J.L.; Más, F.J. The influence of distance and prices on the choice of tourist destinations: The moderating role of motivations. Tour. Manag. 2006, 27, 982–996. [Google Scholar] [CrossRef]
  41. Danapour, M.; Nickkar, A.; Jeihani, M.; Khaksar, H. Competition between high-speed rail and air transport in Iran: The case of Tehran–Isfahan. Case Stud. Transp. Policy 2018, 6, 456–461. [Google Scholar] [CrossRef]
  42. Lee, J.K.; Yoo, K.E.; Song, K.H. A study on travelers’ transport mode choice behavior using the mixed logit model: A case study of the Seoul-Jeju route. J. Air Transp. Manag. 2016, 56, 131–137. [Google Scholar] [CrossRef]
  43. Jung, S.-Y.; Yoo, K.-E. Passenger airline choice behavior for domestic short-haul travel in South Korea. J. Air Transp. Manag. 2014, 38, 43–47. [Google Scholar] [CrossRef]
  44. Yang, M.; Wang, Z.; Cheng, L.; Chen, E. Exploring satisfaction with air-HSR intermodal services: A Bayesian network analysis. Transp. Res. Part A Policy Pract. 2022, 156, 69–89. [Google Scholar] [CrossRef]
  45. Wen, C.-H.; Wang, W.-C.; Fu, C. Latent class nested logit model for analyzing high-speed rail access mode choice. Transp. Res. Part E Logits Transp. Rev. 2012, 48, 545–554. [Google Scholar] [CrossRef]
  46. Gundelfinger-Casar, J.; Coto-Millán, P. Intermodal competition between high-speed rail and air transport in Spain. Util. Policy 2017, 47, 12–17. [Google Scholar] [CrossRef]
  47. Kwan, S.C.; Sutan, R.; Hashim, J.H. Trip characteristics as the determinants of intention to shift to rail transport among private motor vehicle users in Kuala Lumpur, Malaysia. Sustain. Cities Soc. 2018, 36, 319–326. [Google Scholar] [CrossRef] [Green Version]
  48. Su, M.; Luan, W.; Yuan, L.; Zhang, R.; Zhang, Z. Sustainability development of high-speed rail and airline—Understanding pas-sengers’ preferences: A case study of the Beijing–Shanghai corridor. Sustainability 2019, 11, 1352. [Google Scholar] [CrossRef] [Green Version]
  49. Shi, J.; Hussain, M.; Kong, X.P. Factors Affecting Travel Mode Choice between High-speed Railway and Air Transportation among University Students for Tourism—Evidence from China. J. China Tour. Res. 2022, 18, 106–120. [Google Scholar] [CrossRef]
  50. Talpur, M.A.H.; Khahro, S.H.; Ali, T.H.; Waseem, H.B.; Napiah, M. Computing travel impendences using trip generation regression model: A phenomenon of travel decision-making process of rural households. Environ. Dev. Sustain. 2022, 1–24. [Google Scholar] [CrossRef]
  51. Talpur, M.A.H.; Napiah, M.; Chandio, I.; Khahro, S.H. Transportation Planning Survey Methodologies for the Proposed Study of Physical and Socio-economic Development. Mod. Appl. Sci. 2012, 6, 1–16. [Google Scholar] [CrossRef]
  52. Lashari, Z.A.; Ko, J.; Jang, J. Consumers’ intention to purchase electric vehicles: Influences of user attitude and perception. Sustainability 2021, 13, 6778. [Google Scholar] [CrossRef]
  53. Wang, Y.; Yan, X.; Yan, X.; Zhou, Y.; Li, X. Using AHP for evaluating travel mode competitiveness in long-distance travel. In Proceedings of the 2015 International Conference on Transportation Information and Safety ICTIS, Wuhan, China, 25–28 June 2015; pp. 213–218. [Google Scholar]
  54. Chuang, H.M.; Chu, C.P.; Lin, Y.T. HSR buying behavior modeling-Taiwan High Speed Railway case. In Proceedings of the 2011 IEEE International Conference on Industrial Engineering and Engineering Management, Singapore, 6–9 December 2011; pp. 679–683. [Google Scholar]
  55. Jou, R.-C.; Hensher, D.A.; Hsu, T.-L. Airport ground access mode choice behavior after the introduction of a new mode: A case study of Taoyuan International Airport in Taiwan. Transp. Res. Part E Logist. Transp. Rev. 2011, 47, 371–381. [Google Scholar] [CrossRef]
Figure 1. Passenger traffic by mode of travel in China. Data source: Ministry of Transport of China.
Sustainability 14 15745 g001
Figure 2. Research area I—Shaoguan.
Sustainability 14 15745 g002
Figure 3. Research area II—Shantou.
Sustainability 14 15745 g003
Figure 4. Research area III—Wenzhou.
Sustainability 14 15745 g004
Figure 5. Results of survey among passengers at RPT stations.
Sustainability 14 15745 g005
Figure 6. Results of survey among passengers at HSR stations.
Sustainability 14 15745 g006
Figure 7. Income distribution of passengers.
Sustainability 14 15745 g007
Figure 8. Sensitivity of passengers to fare.
Sustainability 14 15745 g008
Figure 9. Primary considerations of passengers in choosing a transport mode.
Sustainability 14 15745 g009
Figure 10. Passengers’ suggestions for improving RPT.
Sustainability 14 15745 g010
Figure 11. Distribution of reasons of passengers at bus and HSR stations for choosing RPT.
Sustainability 14 15745 g011
Figure 12. Distribution of reasons of passengers at HSR stations for not choosing RPT.
Sustainability 14 15745 g012
Table 1. Main variable definition and descriptive statistics.
Variable NameObservation ValueAverageStandard DeviationVariable Definition
Option11420.45971980.498593For passengers’ choice of transport mode, 1 indicates HSR and 0 indicates RPT
Rprice11420.7253940.161835Utility of fare level assessment when passengers choose HSR
Rcom11420.78914190.158281Utility of extent of comfort assessment when passengers choose HSR
Rsafe11420.81628720.128284Utility of safety assessment when passengers choose HSR
Rcon11420.76322240.172356Utility of ease of ticket-buying assessment when passengers choose HSR
Rser11420.79789840.149539Utility of customer service assessment when passengers choose HSR
Cprice11420.63572680.160144Utility of fare level assessment when passengers choose RPT
Ccom11420.60280210.164913Utility of extent of comfort assessment when passengers choose RPT
Csafe11420.66112080.158691Utility of safety assessment when passengers choose RPT
Ccon11420.69824870.163379Utility of ease of ticket-buying assessment ticket when passengers choose RPT
Cser11420.62014010.151119Utility of customer service assessment ticket when passengers choose RPT
Table 2. Estimation results of binary logit regression (N = 1442).
OptionCoef. (Std. Err.)ebebStdXdy/dx
Rprice1.783 ***5.951.3350.405
(0.46)
Rcom1.754 ***5.7761.320.398
(0.47)
Rsafe0.3531.4231.0460.080
(0.57)
Rcon2.081 ***8.0111.4310.472
(0.42)
Rser−0.7630.4660.892−0.173
(0.51)
Cprice−1.311 ***0.270.811−0.297
(0.48)
Ccom−0.912 **0.4020.86−0.207
(0.44)
Csafe−1.682 ***0.1860.766−0.382
(0.45)
Ccon−0.5690.5660.911−0.129
(0.44)
Cser0.4741.6061.0740.108
(0.50)
Constant−1.513 ***
(0.58)
Pseudo-R20.0656
LR103.39
CC63.75%
Note: *** and ** indicate being significant at 1% and 5% confidence levels, respectively.
Table 3. Estimation results of the subsample from Shaoguan, Wenzhou, and Shantou.
ShaoguanWenzhouShantou
OptionCoef. (Std. Err.)ebdy/dxCoef. (Std. Err.)ebdy/dxCoef. (Std. Err.)ebdy/dx
Rprice3.068 ***21.5030.5820.5211.6840.1251.756 **5.7870.394
(0.91)(0.94)(0.72)
Rcom2.0377.6690.3871.1733.230.2812.270 ***9.680.509
(1.26)(1.35)(0.69)
Rsafe1.821 *6.1760.346−0.7480.473−0.1790.0831.0860.019
(1.09)(1.24)(0.88)
Rcon3.433 ***30.9810.652−0.6960.499−0.1671.774 ***5.8970.398
(0.75)(1.00)(0.68)
Rser−2.160 *0.115−0.4101.4424.2280.345−0.430.65−0.096
(1.23)(1.30)(0.70)
Cprice−3.079 ***0.046−0.584−1.743 *0.175−0.417−0.6630.515−0.149
(1.07)(0.98)(0.68)
Ccom−3.120 ***0.044−0.5921.1783.2480.282−0.3460.708−0.078
(1.02)(1.19)(0.62)
Csafe−2.876 ***0.056−0.546−1.2140.297−0.291−1.350 **0.259−0.303
(1.08)(1.14)(0.60)
Ccon−1.3340.263−0.2530.1791.1970.043−0.5860.556−0.132
(0.94)(1.00)(0.68)
Cser1.1513.1630.219−0.3190.727−0.0770.1091.1150.025
(1.03)(1.30)(0.73)
Constant−0.711 0.207 −2.416 ***..
(1.29)(1.16)(0.91)
Pseudo-R20.1847 0.0239 0.0584
LR94.05 9.82 37.53
CC70.62% 58.05% 65.12%
Note: ***, **, and * indicate being significant at the levels of 1%, 5%, and 10%, respectively.
Publisher’s Note: MDPI stays neutral with regard to jurisdictional claims in published maps and institutional affiliations.

