Abstract
There is an abundance of research on road-crash-influencing factors; however, it often relies on a limited subset of variables. The aim of this work was to analyze the significance of road-crash-influencing variables on rural roads and to estimate the crash frequencies during different conditions by introducing a holistic approach and analyzing a wide range of driver–vehicle–road–environment variables. The input data comprised long-term vehicle speed data, obtained using inductive loop traffic counters, and short-term data, obtained using a calibrated police radar. A combination of both was augmented with driver traits and meteorological conditions, gender, age, years possessing a driver’s license, crashes, vehicle, and environmental data. The crash data used for the analysis was based on police records. The results indicate that crash frequencies and driving speed have strong daily and weekly seasonality. The average hourly crash frequencies per kilometer driven during the week varied between 0.2 and 2.2 crashes per million km; the major cause was speeding, which contributed to nearly 32% of fatal crashes. Speed choice could be affected by alcohol-consuming drivers involved in crashes, as the percentage of drivers with any level of alcohol detected expressed daily and weekly patterns similar to those of crash frequencies per kilometer. Contrary to the highest relative crash frequency, which occurred during nighttime, the majority of daily crashes occurred during the afternoon peak hours; thus, the societal impact of crashes is the highest during the day.
1. Introduction
Driving speed is an important factor in road traffic safety, affecting crash probability and consequences, indicating that speed not only affects the severity of a crash but is also related to the risk of being involved in a crash. This relationship has been established in several studies, either in connection with absolute speed or speed deviations [1,2,3].
A very old but often-cited study that analyzed the relationship between speed, driver characteristics, vehicles, and crashes is of principal importance to the understanding of highway traffic operations and safety [1]. For major rural highways in the US, Solomon compared the estimated speeds of 10,000 vehicles that had been involved in police-reported crashes and the measured speeds of 29,000 control vehicles. Control vehicle speed was measured alongside the roads during different times of the day. Finally, the impact of vehicle speed on the relative crash rates was determined by comparing the crash rates at different speed intervals (defined in classes of 10 mph ≈ 17 km/h). It was established that vehicles moving at approximately 6 mph (≈10 km/h) faster than the mean speed had the lowest crash rates. Vehicles moving much faster or much slower (i.e., >50 km/h) than the mean speed had substantially higher crash rates. This resulted in the well-known U-curve. It was concluded that driving speed on rural roads significantly affects the probability of crashes and their consequences and that driving speed has a significantly negative impact on the level of safety compared to any other known risk factor [1]. Other studies have also focused on the relationship between an increase in road crash risk due to the speed difference between the vehicles involved and the mean speed on the road section [2].
Only a few take into account the average driving speed in their study of the impact of driving speed as a key factor in road safety [4]. For example, observations of 5 min intervals of continuously monitored mean speed data from an expressway in Japan and an analysis of the impacts of mean speed and its change in the 5 min interval at the occurrence of a crash over a given segment of motorway on the per vehicle-kilometer crash rates by applying a two-dimensional additive Poisson model were carried out [5]. A conclusion was that the highest probability of a crash occurred when the speed was reduced from 110 to 85 km/h. Another increase in crash probability was indicated when the average speed increased from 65 to 90 km/h. Additionally, crash rates were higher when the weather was sunny rather than when it was cloudy [5].
Based on an analysis of driving speed in various past studies of the topic, as well as the proposed concept of the combined driver–vehicle–road–environment system, it has been established that the negative impact on traffic safety does not only depend on speed but is also a reflection of the condition of all elements in the traffic; therefore, travel speed should be taken into consideration as a constituent and connecting part of the entire system [6]. Other studies investigating factors associated with traffic crashes have been carried out. They mostly count speed as a key factor in understanding the level of road crashes and the severity of crashes, and they are based on a model of the impact of driving speed on the driver, vehicle, road, and environment [7,8].
A similar concept was proposed in a study related to public transport system safety, which concluded that the “human factor” influences the proper functioning of the public transport system. A driver perceives information about the modes and parameters of all road users, environment conditions, traffic situations, and vehicle component conditions. A driver should operate the vehicle in a safe way, being part of a process integrating the driver, road, vehicle, and the environment into one system in which everything is interconnected. This system is called the “driver–car–road–environment” system [9].
Different characteristics of the driver, vehicle, road, and environment affect the choice of driver speed on rural roads and, consequently, the probability of crashes, where the key factor is the driver with their abilities and reactions [10,11,12]. Important road characteristics include lane width and other technical characteristics.
A driver, as a vehicle operator with their psychophysical processes (thinking, motivation, emotions, and ability to remember) and personality (character), to a large extent, has a decisive influence on safety. According to situational awareness models, a driver reacts by processing a combination of premeditated, strategic decisions and short-term automatic reactions, which has been stressed as being crucial for recovery from driving errors [13]. In road traffic, humans can be involved directly (as road users) and indirectly (as road maintenance personnel and builders, traffic signaling fitters, and rule makers). In both roles, measures to minimize the risk for road users and infrastructure should be taken into consideration [14,15].
A table of key factors influencing driver behavior was presented in the study [16]. The so-called factors influencing driver behavior are meteorological conditions (weather conditions and time of day and night) and traffic density (with daily and seasonal fluctuations). Demographic factors, cognitive and temporal factors, and other driver-independent factors (driving characteristics, vehicle characteristics, road environment, and environmental factors) were considered in several studies [11,17,18,19,20,21]. These factors were also found to influence the driver speed choice.
Apart from driver traits, the road as an element of safety has significant importance. Through research on the speed of vehicles, it was found that an increase in speed is influenced by the following characteristics of the road: a flat road, a negative higher road slope, better visibility, free roadside space, lane width, and a wider and larger sidewalk [10,17,22,23].
Andersen et al. analyzed whether speed choice is strongly influenced by the road environment and the drivers’ assessment of a safe speed level at a selected road where the speed was limited to 80 km/h, taking into consideration such variables as driver age and gender, yearly mileage if available, the age of the vehicle, carriageway width, shoulder width, strip width, and the density of intersections. The results indicated significant influences of the road, shoulder width, and the presence of road markings (9 km/h faster). It was also found that the presence of woodland and intersections influenced speed choice. Moreover, minor impacts of gender (on average, males drove 1 km/h faster than women), the age of the vehicle, and the time of day were indicated. Trips carried out during the afternoon between 3:00 p.m. and 5:00 p.m. tended to be 0.8 km/h slower than those carried out during the rest of the day. The greatest amount of daily traffic was on the road during those 2 h (approximately 30%); therefore, an explanation could be congestion [24].
In the case of environmental factors, we mainly encounter two basic approaches: The first treats the environment as a weakly coupled system of passive and constant presence, regardless of the variability of other systems [25]. The theory of dynamics, however, treats the environment as a time-varying process, and it is coupled, which means that it affects other subsystems with different weights [23].
Schlögl analyzed variables contributing to the occurrence of road crashes during a calendar year from 2016 with a temporal resolution of 1 h (i.e., 8784 h in total) on the whole highway network of Austria, which has a total length of 1719 km. A set of 48 explanatory variables related to weather and climate, road geometry, road condition, traffic code, traffic volume, and time were analyzed. The findings showed the merits of the proposed approach in terms of model quality and the robustness of the results, consistently displaying accuracies of around 80% while exhibiting sensitivities of approximately 50%. A number of weather variables were found to be significant for predicting crash occurrence [25].
Chen et al. investigated which driver and environmental factors contribute to the severity of truck traffic crashes. An Ordinal Probit Regression analysis indicated that the conditions ‘Nighttime (9:00 p.m.–6:00 a.m.)’, ‘Vehicle–single’, and ‘Vehicle to Pedestrian’ contributed to the truck traffic crash severity. In the logistics influencing area, truck traffic crashes had a higher frequency than those in the non-influencing area. ‘Lane violation’ and ‘Signal violation’ were identified as significant truck traffic crash causes [26]. Low visibility due to different reasons, such as fog, rain, and nighttime driving, was the focus of other studies that indicated that driving during the nighttime is associated with a higher crash risk due to fatigue and visibility restriction [27,28]. However, the nighttime use of alcohol in some regions and the more frequent nighttime use of cell phones in others significantly contribute to crash probability [29,30].
Factors such as vehicle power were also analyzed, but no significant correlation was found between speed choice and power, and we could not find reliable research on the impact of vehicle brand [31].
As shown, road crashes are a consequence of a large number of complexly coupled contributing variables; therefore, recent advances in analytic algorithms and machine learning methods have enabled researchers to predict road crashes by mining data from different sources and by processing real-time multi-dimensional data streams, thus providing a strong prediction capability. Real-time information is provided by on-road equipment, such as induction loops, cameras, and radar detectors. Therefore, the study of road crash prediction is a rapidly developing research problem, open to the innovation of the algorithm research and data analysis techniques that respond to the challenge of generating a more secure traffic environment, which considers the particularities of each country or region (i.e., traffic composition, weather conditions, road conditions, and demography) [32,33].
Another innovative approach is the application of microsimulation tools that can be used to compare operational and safety performances in different traffic and speed management scenarios on a road. A study with a microsimulation of a motorway was carried out to obtain a forecasting estimation of potential conflicts, implementing different conceptual scenarios of operational management and considering different speed management and traffic flow values. The results showed that, beyond the capacity rise, due to the increase in the number of lanes, speed and the selection of traffic conditions for the opening and closing of the shoulder play a critical role in both road safety and operational levels of service [34].
Traffic safety also affects the societal aspect of the risk that can be quantified by the modeling of lost time and other negative consequences of road crashes. Crashes may lead to congestion, which is commonly used in risk assessments to establish the frequency and consequences of crashes [32,35]. The delay costs, which represent lost time, constitute on average 10% of the total annual social costs of crashes and are nearly 70% higher than the material costs of crashes [36].
Although many of the reviewed works indicate that driving speed is the most significant factor contributing to crash rates, they also express concern that there could be numerous other influencing factors, such as the driver’s characteristics, the vehicle, and the environment, that could impact speed choice [16,21,25].
2. Materials and Methods
In order to analyze the impact of diverse factors, such as driver traits, vehicle type, traffic, and meteorological conditions, different data sources were combined. A list of the meteorological data sources is shown in Table 1. The site of the weather station relative to the measurement points is shown in Figure 1.

Table 1.
Meteorological data.
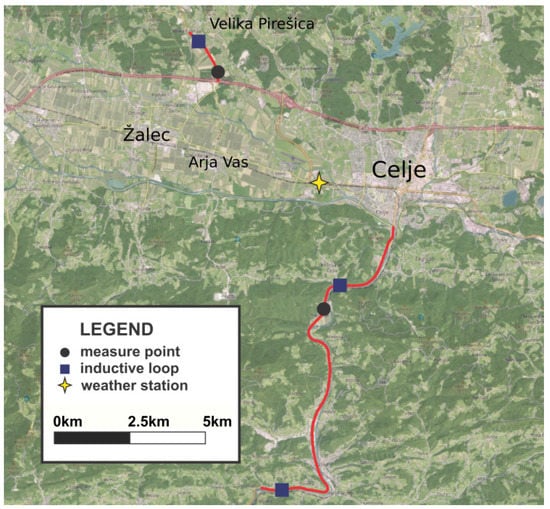
Figure 1.
Measurement points and weather station.
For traffic measurements, two extra-urban road sections in Slovenia were selected, Arja Vas and Tremerje, as representative sections in the Slovenian road network based on their low safety level and frequent traffic crashes directly caused by speeding. The annual average daily traffic (AADT per day) is 13,358 vehicles on the Tremerje road section and 12,297 vehicles on the Arja Vas road section. The time periods of the data and sampling frequencies are shown in Table 2.

Table 2.
Traffic data sources.
Speed measurements were carried out using inductive loop traffic counters and with calibrated police radar placed by Slovenian Police operators on the following points: road Arja Vas (133—Arja Vas, Tremerje (90—Košnica and 580—Strmca).
The included measurements made with the inductive loop traffic counters were taken from the period of 2017–2020. In Figure 1, an overview of the measurement points and roads of interest can be seen.
The measurements carried out using the calibrated police radar of the Slovenian Police were taken between 14 May 2014 and 31 May 2014. The point measurements using the calibrated police radar Multaradar include 7455 motorized vehicles, of which 6486 are personal vehicles.
In Table 3, the obtained road crash data are shown. The crash severity and injury/fatality data partially overlap because crash severity can be determined by injury data. Crash severity is an attribute classifying crashes into those with only material damage, those with minor injuries, and those with severe injuries and fatalities. The injury and fatality data are numerical and indicate the number of affected persons.

Table 3.
Crash statistics.
In order to obtain a merged model of speed and traffic crash causes, the data were merged and resampled. Resampling was performed as follows:
- By averaging the values at intervals for temperature, visibility, and road surface temperature.
- By adding the amount of precipitation at each interval.
To assess the variables influencing crash frequency, a Slovenian Police crash database with data from 2014 to 2020 was used. This database includes crash location, causes, participant data, and weather conditions. To assess the impact of meteorological conditions, crashes within a 20 km radius from a weather station were analyzed. The impact of freezing conditions was analyzed by introducing a discrete variable that was true when the air temperature was less than 1 °C and the ground temperature 5 cm below the surface was less than 5 °C.
In order to obtain relative crash frequencies, crashes within periods of each hour, Nacc (date,h), were counted throughout the period of 2014–2020. Hourly crashes were then summed up for each day in the observation period and area, as shown in Equation (1):
Traffic volume was also summed for each hourly interval of each day within the observation period, as shown in Equation (2):
where i is the number of subintervals from the traffic counter aggregates between hour h and hour h + 1; for example, q0 is the sum of hourly traffic volume from 00:00–01:00. The average hourly crash frequencies were obtained by dividing hourly crashes by the hourly traffic volume, as shown in Equation (3):
However, for the whole national territory, it is impossible to estimate the amount of traffic within each hour, and the only available data regarding traffic were cumulative vehicle kilometers per type of road; thus, relative hourly traffic shares, rh, were introduced. They were calculated from the traffic counter data by dividing the hourly traffic within a whole observed period, qh, by the total traffic, Qtot, as shown in Equation (4):
The results of Equation (4) were used to estimate hourly total vehicle kilometers for the whole national territory by multiplying the total road traffic by its relative share. They can also be used to normalize hourly crashes by traffic share in order to estimate individual risk in road traffic during a certain period of time.
To analyze the impact of driver traits, the data were analyzed using linear regression and variance analyses in order to establish the influences of gender and driver age on speed choice.
3. Results
Figure 2 shows the frequency of road crashes per million km between 2014 and 2020 on motorways and extra-urban roads in Slovenia.
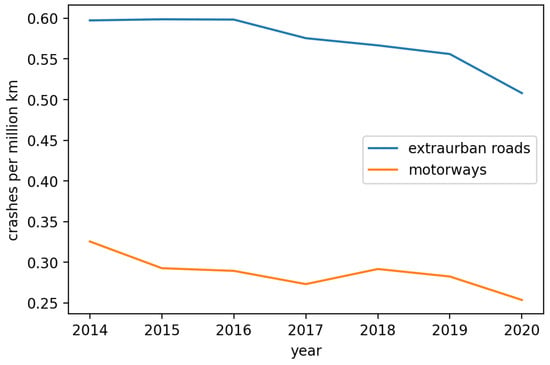
Figure 2.
Frequency of road crashes per million km for motorways and extra-urban roads from 2014 to 2020 in Slovenia.
In Figure 3, there is an absolute number of crashes per hour and the crash frequency per million km on Slovenian rural roads. The crash frequency at night increases, but the yearly trend shows an overall decrease in the number of crashes. It is shown that the crash frequency is the highest during the quiet hours at night, around 3 a.m., when the traffic flow is the lowest. However, the absolute number of crashes is the highest during active daily hours, between 7 a.m. and 2 p.m.
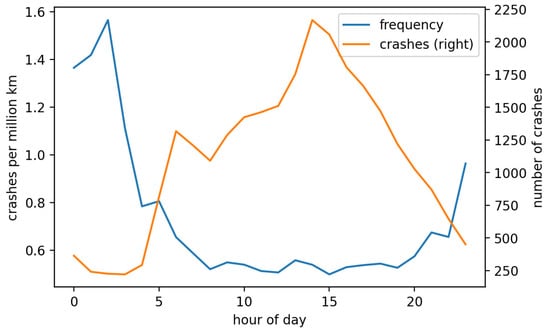
Figure 3.
Absolute number of crashes per hour and crash frequency on extra-urban roads.
Figure 4 shows the absolute number of crashes per hour and the crash frequency per million km on Slovenian motorways. The daily pattern of crash frequencies and the absolute number of crashes is similar to that on extra-urban roads.
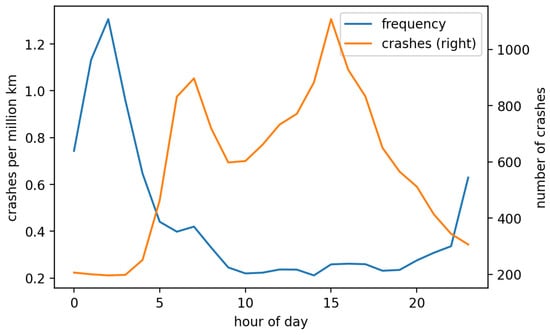
Figure 4.
Absolute number of crashes per hour and crash frequency on motorways.
3.1. Variables Influencing Crash Rate
Out of 124,205 analyzed crash records from the period between 2014 and 2020, only crashes with severe injuries and fatalities on extra-urban roads were selected. The cause of 7779 severe traffic crashes was mostly speeding, followed by driving in the opposite direction/side, priority violations, other, etc. Figure 5 shows that 1379 severe crashes occurred due to speeding, another 1119 due to driving in the wrong (opposite direction) lane, and 886 due to priority violations. ‘Other’ includes crashes with undetermined or unspecified causes. The numbers of fatal crashes follow in the same order.
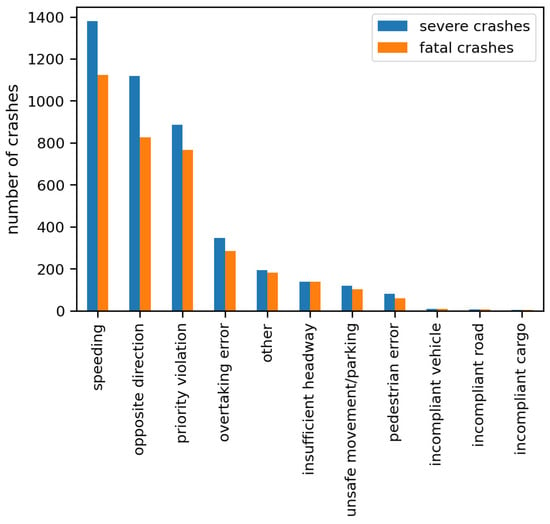
Figure 5.
The cause of crashes on rural roads.
Figure 6 shows the absolute number of crashes by hour of day on all road types, including urban roads, extra-urban roads, and motorways. A large absolute number of traffic crashes occurred between 2 and 4 p.m. Between midnight and 4 a.m., the numbers of crashes were similar. The highest absolute number of crashes by hour of day was slightly less than 10,000 crashes. Between 4 and 5 p.m., there were about 8000 crashes during the observed period. The serious offense rate was higher from 10 p.m. to 2 a.m. The results show that the most severe crashes (resulting in severe injuries/deaths) occurred between 5 and 6 p.m. When the traffic volume and density are lower, the possibility of speeding increases. Severe and fatal crashes show similar daily patterns.
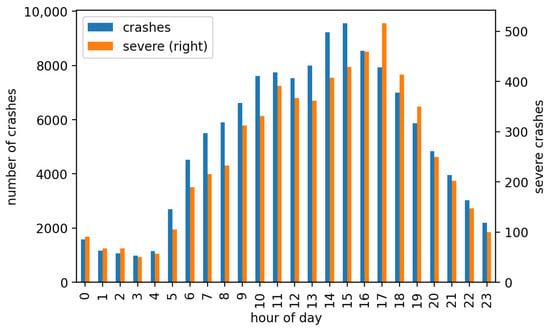
Figure 6.
Number of crashes per hourly interval on all road types.
Figure 7 shows the relative hourly crash frequency normalized by traffic shares per hour. The relative frequency increases during the nighttime for all crashes, including severe crashes. The results are quite similar to those of the hourly crash frequencies per distance driven, which are shown in Figure 3 and Figure 4. This parameter is useful for indicating the time of the day where the crash risk is the highest for an individual road user.
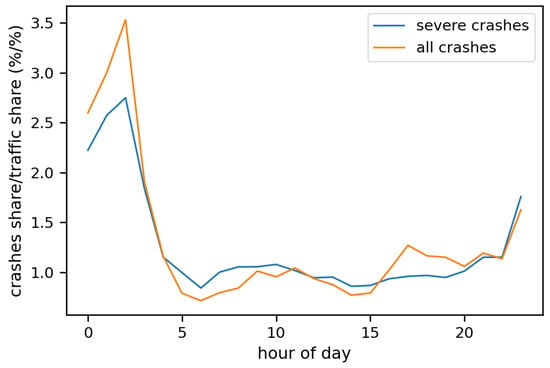
Figure 7.
Relative frequency of crashes normalized by traffic share by hour of the day.
The crash frequency by hour of week is shown in Figure 8. The results show significant daily and weekly seasonality, with a higher crash frequency per vehicle kilometer during the quiet hours (nights and weekends).
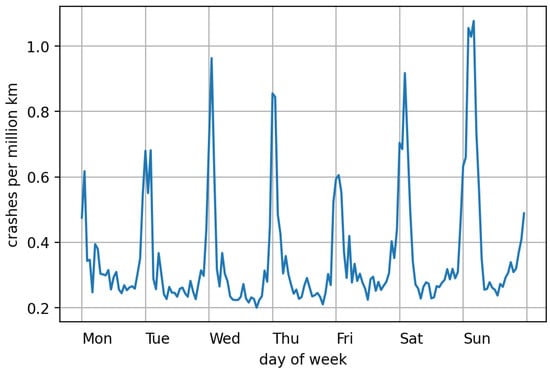
Figure 8.
Relative crash frequency during the week on extra-urban roads.
Daily and weekly variabilities in crash frequencies and relative traffic shares were evident for all crashes and severe crashes. For all crashes, speeding was identified as the most frequent crash cause. This confirms the assumption that the factors for speed choice should be further analyzed in detail. Since the police crash records also include alcohol testing results, we analyzed the hourly shares of drivers who were involved in crashes and tested positive for any amount of alcohol in their blood, even if it was below the legal limits. The results in Figure 9 show a very similar daily pattern for both variables, which confirms that alcohol consumption significantly contributes to driver errors and offences. However, these results are only based on drivers involved in crashes and do not represent the general population of drivers.
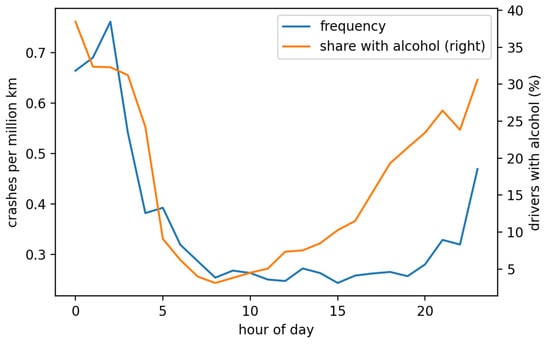
Figure 9.
Crash frequencies and percentages of drivers with alcohol detected.
3.2. Driver and Vehicle Impact on Driving Speed
Table 4 shows the correlation coefficients for the driver’s age, years possessing a driver’s license, and gender. During the analysis, we focused on the p value, which expresses the correlation between the variables.

Table 4.
Correlation coefficients for driver’s age and years possessing a driver’s license.
Assuming 95% confidence intervals, the analysis showed a p value of 0.360 for gender (male or female), indicating that gender did not influence the average travel speed on rural roads in this comparison.
When analyzing the statistical significance of the correlation between the age of the driver and years possessing a driver’s license as an influence on travel speed, it was established that the Pearson correlation coefficient for the driver’s age was 0.15, and for the years possessing a driver’s license, it was 0.1.
There was no link established between the driver’s age and speed since the p value was 0.170 and higher than the test or limit value, which was defined as 0.05 at a 95% confidence interval. It can thus be concluded that the driver’s age did not impact the travel speed in the observed dataset.
Years possessing a driver’s license had a p value of 0.370 and was thus larger than the limit value of 0.05 at the 95% confidence interval. So, it can be concluded that years possessing a driver’s license does not influence a car’s travel speed on rural roads. From the obtained statistical data, the average driver’s age was calculated, which was 45 years, with an established average travel speed of 58 km/h.
The observed sample included 4882 male and 1603 female drivers. Even though the mean speed of the female group was 56.1 km/h and that of the male group was 55.7 km/h, the ANOVA analysis gave an F-value 1.47 and a p value of 0.220, which means that the difference was not statistically significant.
Figure 10 shows the plots of ANOVA for speed and vehicle brands. The results show that there is no significant link between speed and vehicle brand, with an F-value of 0.75 and a p value of 0.910.
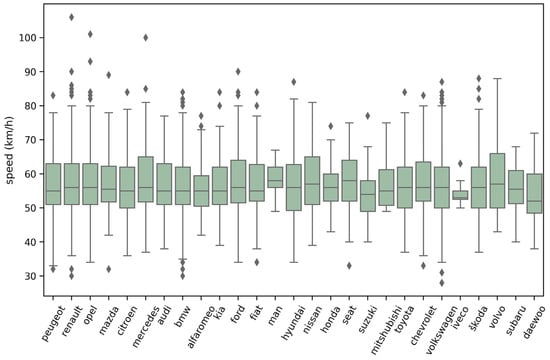
Figure 10.
Box plots for speed and vehicle brand.
Table 5 shows the mean values and dispersion between the measured speed and car engine power. The results show that the p value is 0.334. It is established that there is no significant link between the engine power and measured speed at given sites.

Table 5.
Mean values between speed and car kilowatts.
3.3. Traffic Conditions
Traffic conditions are expected to have an impact on traffic flow, as empty roads with low traffic volume provide plenty of opportunities for speeding. In Figure 11, a scatter plot of hourly shares of severe offences (more than 30 km/h over speed limit) as recorded by the traffic counters is shown.
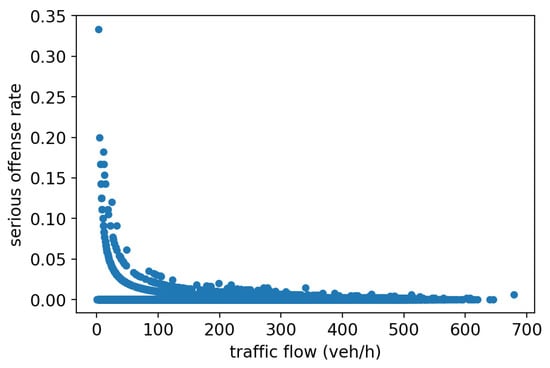
Figure 11.
Impact of traffic volume on severe offense rate.
As the majority of values are very low, showing the same data as those presented in Figure 11 using average values for the 10 intervals on the x axis, the data clearly indicate an exponential relationship, confirming that speeding violations are significantly more common on relatively empty rural roads. This result is shown in Figure 12.
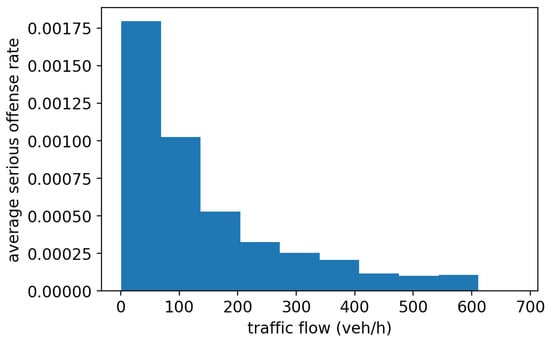
Figure 12.
Average values in intervals.
3.4. Environmental Impact on Driving Speed
The data used to perform the linear regression and to calculate the Pearson correlation coefficient in order to establish the influence of the air temperature on travel speed are shown in Figure 13.
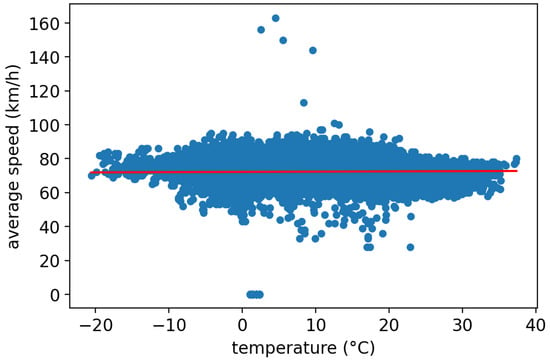
Figure 13.
Linear regression of average speed on temperature.
Even though the correlation can be confirmed for 95% and 99% confidence intervals, the Pearson correlation coefficient is very low, 0.013. This indicates that the air temperature does not have a significant impact on speed choice.
An analysis of the influence of the environmental factors on speed is carried out with visibility. The obtained result in Figure 14 shows the linear regression of the average speed on visibility.
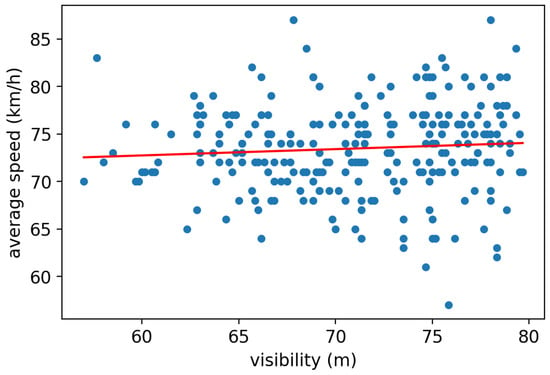
Figure 14.
Linear regression between visibility and average speed.
Figure 15 shows the linear regression of the average speed on precipitation. It shows that there is a significant correlation, as the average speed decreases by 2.2 km/h for every 10 mm of precipitation, which means that drivers in general adjust their speed accordingly to the change in weather conditions, especially when the amount of rainfall is high. During a low rainfall intensity, speed variance is much higher than at higher speeds.
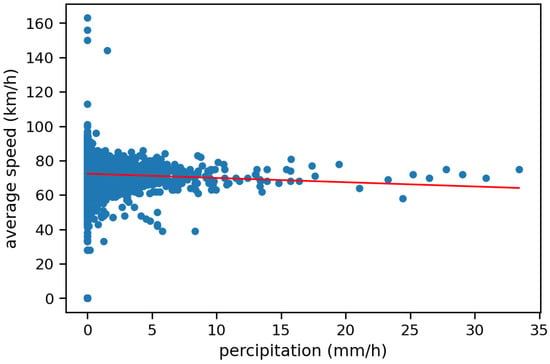
Figure 15.
Linear regression between precipitation and average speed.
Table 6 shows the data of the multiple regression model, comprising p values and coefficients. The regressions of the model include environmental factors and data on the dependence of the average speed on the traffic flow.

Table 6.
Obtained coefficients and p values for environmental factors and traffic flow.
The results show low p values for visibility, temperature, and precipitation. However, the performed multiple regression indicated rather unusual results suggesting that visibility has hardly any impact in this specific area. The reason for this is the very small number of days with low visibility. A somewhat higher correlation coefficient was observed for precipitation, which means that drivers adapt their speed accordingly when rainfall is stronger.
The impact of meteorological conditions on crash frequency was established by comparing crash data in a 15 km radius around the weather station. Figure 16 shows the weather during traffic crashes as recorded by the police. In clear weather, there were 2692 car crashes, followed by 1324 in cloudy conditions, 459 in rainy conditions, 116 in snowy conditions, and 44 in foggy conditions.
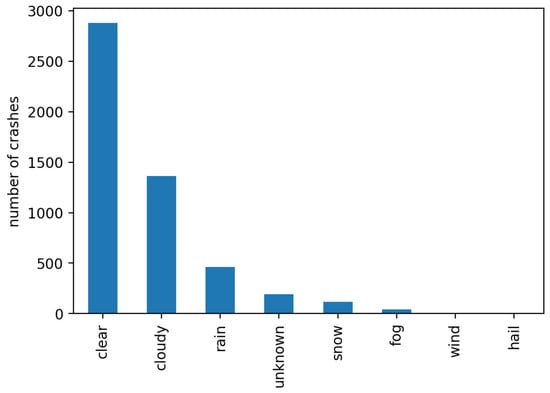
Figure 16.
Weather conditions during traffic crashes.
In Figure 17, an analysis of the time share of each weather condition was established. The time share of a weather condition is the percentage of time with the given weather condition present. From the available weather station data, it was impossible to distinguish between cloudy and clear weather, so these conditions were combined into a single period. The results indicate that the time shares and crash shares for clearly/cloudy weather and rain are aligned. The crash shares of a certain weather condition is the percentage of all crashes that occurred during that specific weather condition.
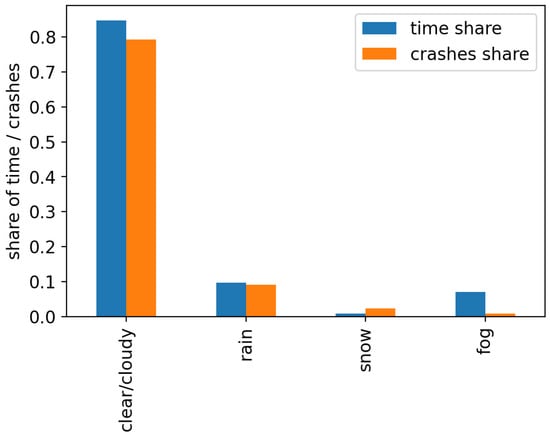
Figure 17.
Time shares and crash shares for different weather conditions.
Snow and fog show some deviations between crash and time shares, but this is probably due to the relatively low number of foggy days and the meteorological definition of fog being when visibility is less than 1000 m. The police reports probably indicate fog when the visibility is so low that it affects the road traffic.
Figure 18 shows the correlation between the average speed and the presence of daylight. The obtained data showed a strong correlation between speed and daylight. The presence of daylight was determined using ephemerid data and by calculating angle of the sun above the horizon. Daylight was assumed when the sun was higher than 3 degrees below the horizon.
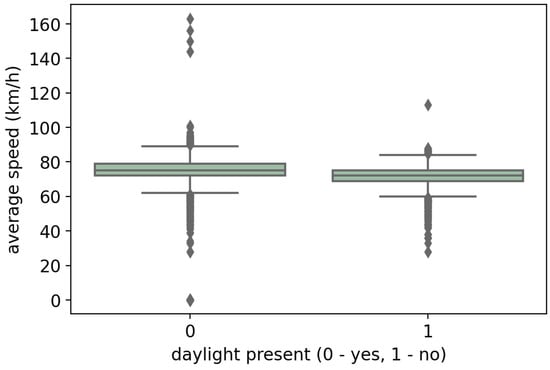
Figure 18.
Correlation between average speed and daylight.
4. Discussion
The literature review and the quantitative analysis of the selected impacts of the driver, vehicle, and environment on rural road crash rates yielded numerous conclusions.
It was shown that the causes of major crashes are mostly speeding, priority violations, and driving in the opposite direction.
The obtained annual average road crash frequencies indicated a decreasing trend, with strong daily and weekly seasonality. Analyzing the long-term traffic counter data showed that the relative frequency of serious offenses significantly increased during the night, between 10 p.m. and 2 a.m. This could be explained by the lower traffic volume and density. It was also shown that the traffic flow had a significant impact on serious offense rates, as a lower traffic volume provides opportunities to speed and, consequently, increases the probability of serious crashes. This was especially pronounced during weekends and during nighttime. The highest number of serious traffic crashes occurred between 4 p.m. and 5 p.m.; however, if normalized by traffic volume, the probability of a particular vehicle being involved in a crash was not very high compared to that in the nighttime. This indicates that, during the nighttime, the share of reckless drivers significantly increases, even though fewer crashes occur during this period.
The impact of driver characteristics on driving speed was determined by calculating the values of significance (p values) of the driver variables: gender (p = 0.220), age (p = 0.170), and years possessing a driver’s license (p = 0.370).
Based on the obtained data of vehicle characteristics, no significant association between measured speed and vehicle engine power was confirmed (p = 0.334). Likewise, the ANOVA analysis of speed dependence on vehicle brand showed no correlation.
The environmental impact on driving speed was analyzed using the following variables: temperature, ground temperature, visibility, precipitation, weather conditions, and daylight.
When a driver operates a vehicle, low visibility may strongly affect their speed choice and the efficiency of the vehicle following reactions and speed control. Low visibility was assumed when the visibility was lower than a distance of three vehicles in front with typical headways. It was assumed that the driver observes approximately three vehicles in front of them while driving.
The environmental factors that influenced driving speed were temperature (p = 0.000), visibility (p = 0.000), and precipitation (p = 0.001). Moreover, the traffic volume had a significant impact on driving speed (p = 0.000), but all the environmental variables had relatively low correlation coefficients.
The analyzed driver, vehicle, and environment (including weather conditions and traffic) factors can be holistically considered a driver–vehicle–road–environment system. The holistic approach is useful to approach all potentially relevant factors in the same manner in order to identify which are the most significant and to try to mitigate the risk. According to the results, individual drivers are exposed to the highest risk when driving at night and during weekends due to the higher average speeds and the higher rate of violations, including driving under the influence of alcohol.
For traffic safety agencies, the data are useful to increase awareness among drivers to pay more attention during night driving, not only due to the most commonly expected risks, such as lower visibility, icy road surfaces, and wild animals, but also due to the greater possibility of speeding due to lower traffic volumes and the higher probability of encountering offenders not respecting speed limits and potentially consuming alcohol. Moreover, the introduction of stricter speed limit enforcement and more frequent alcohol-level checks could contribute to overall safety levels.
From the perspective of society and the traffic police, it would be most effective to conduct targeted patrols during the daytime peak hours, as this is the period when the highest number of violations and crashes occur. This way, a high number of fines could be issued; however, it should not be ignored that significant increases in traffic crash frequencies at night are also not acceptable, taking into consideration the road users that have to drive during this time.
5. Conclusions
This study examined the impacts of the driver, vehicle, and environment on rural road crashes using a combination of local measurement data, police records, traffic counters, and meteorological data from the period between 2014 and 2020. According to the road crash data, speeding was the most frequent crash cause. It was established that driving speed was mostly influenced by road factors, precisely traffic conditions, as well as the driver and environment subsystem factors.
Vehicle brand and engine power had no significant impact on driving speed and the frequency of violations. These results are aligned with those of previous studies [31].
The analyzed driver traits that could have had an impact on traffic safety were gender, age, and years possessing a driver’s license, but they showed no significant correlation with driving speed.
Similar results were obtained for meteorological conditions, and the traffic flow density seemed to be among the most significant variables affecting speed.
Normalizing the number of crashes during certain hours of the day with the traffic volume yielded the interesting conclusion that, during the night, the share of reckless drivers significantly increases. The other interesting conclusion was that the daily pattern of crash frequencies and the absolute number of crashes on motorways is similar to that on extra-urban roads. Moreover, increased crash frequencies during the quiet hours of the day have a daily pattern similar to that of the percentage of drivers involved in crashes and under the influence.
The obtained results represent the basis for additional research on the impact of driving speed choice on rural and other roads within the more complex model of the driver-vehicle–road–environment system. The data are also useful for road traffic safety officers, the planning of the construction and maintenance of roads and vehicles, targeted supervision and traffic control, spatial planning, and psychophysiology and driving education. The results could be used to update traffic safety action plans, and they may also be useful for more efficient crash prevention through law enforcement. Finally, a significant increase in crash frequencies during the nighttime should be mitigated.
Future work could include a more in-depth analysis of environmental conditions over a larger area to obtain a more widely applicable model that could be used as a basis for road risk analyses.
Author Contributions
Writing—original draft, S.T. and B.L. All authors have read and agreed to the published version of the manuscript.
Funding
The authors acknowledge the financial support from the Slovenian Research Agency (project No. P2-0075).
Institutional Review Board Statement
No applicable.
Informed Consent Statement
No applicable.
Data Availability Statement
The data in this study are available on request from the authors.
Conflicts of Interest
The authors declare no conflict of interest.
References
- Solomon, D.H. Accidents on Main Rural Highways Related to Speed, Driver, and Vehicle; U.S. Department of Transportation, Federal Highway Administration: Washington, DC, USA, 1964. [Google Scholar]
- Aarts, L.; van Schagen, I. Driving Speed and the Risk of Road Crashes: A Review. Accid. Anal. Prev. 2006, 38, 215–224. [Google Scholar] [CrossRef]
- Ramírez, A.F.; Valencia, C. Spatiotemporal Correlation Study of Traffic Accidents with Fatalities and Injuries in Bogota (Colombia). Accid. Anal. Prev. 2021, 149, 105848. [Google Scholar] [CrossRef] [PubMed]
- van der Horst, A.R.A.; Thierry, M.C.; Vet, J.M.; Rahman, A.K.M.F. An Evaluation of Speed Management Measures in Bangladesh Based upon Alternative Accident Recording, Speed Measurements, and DOCTOR Traffic Conflict Observations. Transp. Res. Part F Traffic Psychol. Behav. 2017, 46, 390–403. [Google Scholar] [CrossRef]
- Tanishita, M.; van Wee, B. Impact of Vehicle Speeds and Changes in Mean Speeds on per Vehicle-Kilometer Traffic Accident Rates in Japan. IATSS Res. 2017, 41, 107–112. [Google Scholar] [CrossRef]
- Zavasnik, Z.; Polič, M.; Tollazzi, T.; Žura, M.; Lipar, P. Osnovno Strokovno Usposabljanje Presojevalcev Varnosti Cest; Javna Agencija RS za Varnost Prometa: Ljubljana, Slovenia, 2016. [Google Scholar]
- Aksjonov, A.; Beglerovic, H.; Hartmann, M.; Jugade, S.; Vaseur, C. On Driver-Vehicle-Environment Integration for Multi-Actuated Ground Vehicles Safety Advancement: An Overview of the Interdisciplinary Training Network in Multi-Actuated Ground Vehicles. In Proceedings of the 2019 IEEE International Conference on Connected Vehicles and Expo (ICCVE), Graz, Austria, 4–8 November 2019; pp. 1–6. [Google Scholar]
- Yang, J.; Chu, D.; Wang, R.; Gao, M.; Wu, C. Coupling Effect Modeling of Driver Vehicle Environment Factors Influencing Speed Selections in Curves. Proc. Inst. Mech. Eng. Part D J. Automob. Eng. 2020, 234, 2066–2078. [Google Scholar] [CrossRef]
- Postranskyy, T.; Vovk, Y. Changing of the Bus Driver’s Functional State in City Conditions. Transp. Technol. 2020, 1, 12–21. [Google Scholar] [CrossRef]
- Gledec, M. Brzina Kretanja Vozila i Sigurnost Cestovnog Prometa; Institut Prometnih Znanosti: Zagreb, Croatia, 1991. [Google Scholar]
- Ellison, A.B.; Greaves, S.P.; Daniels, R. Profiling Drivers’ Risky Behaviour towards All Road Users. In Proceedings of the Australasian College of Road Safety Conference, Sydney, Australia, 9–10 August 2012. [Google Scholar]
- Casado-Sanz, N.; Guirao, B.; Gálvez-Pérez, D. Population Ageing and Rural Road Accidents: Analysis of Accident Severity in Traffic Crashes with Older Pedestrians on Spanish Crosstown Roads. Res. Transp. Bus. Manag. 2019, 30, 100377. [Google Scholar] [CrossRef]
- Ranney, T.A. Models of Driving Behavior: A Review of Their Evolution. Accid. Anal. Prev. 1994, 26, 733–750. [Google Scholar] [CrossRef] [PubMed]
- Powers, R.; Hall, J.A.; Hall, L.; Turner, D. The “Forgiving Roadside” Design of Roadside Elements. Transp. Res. Circ. 1998, 13, 1–7. [Google Scholar]
- Tollazzi, T. Varnost v Cestnem Prometu (Zbrano Gradivo); Fakulteta za Gradbeništvo: Maribor, Slovenia, 2001. [Google Scholar]
- Quimby, A.; Maycock, G.; Palmer, C.; Buttress, S. The Factors That Influence a Driver’s Choice of Speed: A Questionnaire Study; TRL Report No 325; Transport Research Laboratory: Crowthorne, UK, 1999. [Google Scholar]
- Rotim, F. Elementi Sigurnosti Cestovnog Prometa. Sv. 1, Ekspertize Prometnih Nezgoda; Udžbenici Fakulteta prometnih znanosti Sveučilišta u Zagrebu; 1. izd.; Znanstveni Savjet za Promet JAZU: Zagreb, Croatia, 1990. [Google Scholar]
- Elvik, R. The Power Model of the Relationship between Speed and Road Safety: Update and New Analyses; The Institute of Transport Economics: Oslo, Norway, 2009; ISBN 978-82-480-1001-2. [Google Scholar]
- Misaghi, P.; Hassan, Y. Modeling Operating Speed and Speed Differential on Two-Lane Rural Roads. J. Transp. Eng. 2005, 131, 408–418. [Google Scholar] [CrossRef]
- La Torre, F.; Saleh, P.; Cesolini, E.; Goyat, Y. Improving Roadside Design to Forgive Human Errors. Procedia Soc. Behav. Sci. 2012, 53, 235–244. [Google Scholar] [CrossRef]
- Liang, M.; Zhao, D.; Wu, Y.; Ye, P.; Wang, Y.; Yao, Z.; Bi, P.; Duan, L.; Sun, Y. Short-Term Effects of Ambient Temperature and Road Traffic Accident Injuries in Dalian, Northern China: A Distributed Lag Non-Linear Analysis. Accid. Anal. Prev. 2021, 153, 106057. [Google Scholar] [CrossRef]
- Kazemzadehazad, S.; Monajjem, S.; Larue, G.S.; King, M.J. Evaluating New Treatments for Improving Driver Performance on Combined Horizontal and Crest Vertical Curves on Two-Lane Rural Roads: A Driving Simulator Study. Transp. Res. Part F Traffic Psychol. Behav. 2019, 62, 727–739. [Google Scholar] [CrossRef]
- Ping, P.; Qin, W.; Xu, Y.; Miyajima, C.; Takeda, K. Impact of Driver Behavior on Fuel Consumption: Classification, Evaluation and Prediction Using Machine Learning. IEEE Access 2019, 7, 78515–78532. [Google Scholar] [CrossRef]
- Andersen, C.S.; Reinau, K.H.; Agerholm, N. The Relationship between Road Characteristics and Speed Collected from Floating Car Data. J. Traffic Transp. Eng. 2016, 4, 291–298. [Google Scholar] [CrossRef][Green Version]
- Schlögl, M. A Multivariate Analysis of Environmental Effects on Road Accident Occurrence Using a Balanced Bagging Approach. Accid. Anal. Prev. 2020, 136, 105398. [Google Scholar] [CrossRef] [PubMed]
- Chen, M.; Zhou, L.; Choo, S.; Lee, H. Analysis of Risk Factors Affecting Urban Truck Traffic Accident Severity in Korea. Sustainability 2022, 14, 2901. [Google Scholar] [CrossRef]
- Park, W.; Jin, M.; Kim, Y.; Kim, K.; Lee, S. Investigating the Effect of Road Lighting Color Temperature on Road Visibility in Night Foggy Conditions. Appl. Ergon. 2023, 106, 103899. [Google Scholar] [CrossRef] [PubMed]
- Evans, T.; Stuckey, R.; Macdonald, W. Young Drivers’ Perception of Hazards: Variation with Experience and Day versus Night. Transp. Res. Part F Traffic Psychol. Behav. 2022, 88, 258–280. [Google Scholar] [CrossRef]
- Keall, M.D.; Frith, W.J.; Patterson, T.L. The Contribution of Alcohol to Night Time Crash Risk and Other Risks of Night Driving. Accid. Anal. Prev. 2005, 37, 816–824. [Google Scholar] [CrossRef]
- Yan, Y.; Zhong, S.; Tian, J.; Song, L. Driving Distraction at Night: The Impact of Cell Phone Use on Driving Behaviors among Young Drivers. Transp. Res. Part F Traffic Psychol. Behav. 2022, 91, 401–413. [Google Scholar] [CrossRef]
- Perez, M.A.; Sears, E.; Valente, J.T.; Huang, W.; Sudweeks, J. Factors Modifying the Likelihood of Speeding Behaviors Based on Naturalistic Driving Data. Accid. Anal. Prev. 2021, 159, 106267. [Google Scholar] [CrossRef] [PubMed]
- Gutierrez-Osorio, C.; Pedraza, C. Modern Data Sources and Techniques for Analysis and Forecast of Road Accidents: A Review. J. Traffic Transp. Eng. (Engl. Ed.) 2020, 7, 432–446. [Google Scholar] [CrossRef]
- Jha, A.N.; Chatterjee, N.; Tiwari, G. A Performance Analysis of Prediction Techniques for Impacting Vehicles in Hit-and-Run Road Accidents. Accid. Anal. Prev. 2021, 157, 106164. [Google Scholar] [CrossRef]
- Cafiso, S.; Di Graziano, A.; Giuffrè, T.; Pappalardo, G.; Severino, A. Managed Lane as Strategy for Traffic Flow and Safety: A Case Study of Catania Ring Road. Sustainability 2022, 14, 2915. [Google Scholar] [CrossRef]
- Qureshi, A.I.; Huang, W.; Khan, S.; Lobanova, I.; Siddiq, F.; Gomez, C.R.; Suri, M.F.K. Mandated Societal Lockdown and Road Traffic Accidents. Accid. Anal. Prev. 2020, 146, 105747. [Google Scholar] [CrossRef]
- Bardal, K.G.; Jørgensen, F. Valuing the Risk and Social Costs of Road Traffic Accidents—Seasonal Variation and the Significance of Delay Costs. Transp. Policy 2017, 57, 10–19. [Google Scholar] [CrossRef]
Publisher’s Note: MDPI stays neutral with regard to jurisdictional claims in published maps and institutional affiliations. |
© 2022 by the authors. Licensee MDPI, Basel, Switzerland. This article is an open access article distributed under the terms and conditions of the Creative Commons Attribution (CC BY) license (https://creativecommons.org/licenses/by/4.0/).