Article

Econometric and Machine Learning Methods to Identify Pedestrian Crash Patterns

by
Maria Rella Riccardi
*,
Francesco Galante
,
Antonella Scarano
and
Alfonso Montella
Department of Civil, Architectural and Environmental Engineering, University of Naples Federico II, 80125 Naples, Italy
*
Author to whom correspondence should be addressed.
Sustainability 2022, 14(22), 15471; https://doi.org/10.3390/su142215471
Submission received: 9 October 2022 / Revised: 4 November 2022 / Accepted: 18 November 2022 / Published: 21 November 2022

Abstract

:
Walking plays an important role in overcoming many challenges nowadays, and governments and local authorities are encouraging healthy and environmentally sustainable lifestyles. Nevertheless, pedestrians are the most vulnerable road users and crashes with pedestrian involvement are a serious concern. Thus, the identification of pedestrian crash patterns is crucial to identify appropriate safety countermeasures. The aims of the study are (1) to identify the road infrastructure, environmental, vehicle, and driver-related patterns that are associated with an overrepresentation of pedestrian crashes, and (2) to identify safety countermeasures to mitigate the detected pedestrian crash patterns. The analysis carried out an econometric model, namely the mixed logit model, and the association rules and the classification tree algorithm, as machine learning tools, to analyse the patterns contributing to the overrepresentation of pedestrian crashes in Italy. The dataset consists of 874,847 crashes—including 101,032 pedestrian crashes—that occurred in Italy from 2014 to 2018. The methodological approach adopted in the study was effective in uncovering relations among road infrastructure, environmental, vehicle, and driver-related patterns, and the overrepresentation of pedestrian crashes. The mixed logit provided a clue on the impact of each pattern on the pedestrian crash occurrence, whereas the association rules and the classification tree detected the associations among the patterns with insights on how the co-occurrence of more factors could be detrimental to pedestrian safety. Drivers’ behaviour and psychophysical state turned out to be crucial patterns related to pedestrian crashes’ overrepresentation. Based on the identified crash patterns, safety countermeasures have been proposed.

1. Introduction

The European Union is facing multiple interconnected challenges, from climate change to the even worse air pollution, from a stagnant number of road deaths to the increasing urbanization. Everything is exacerbated by rising obesity and the ageing population [1]. The rapid increase in motorization followed by the increasing use of private motor vehicles is impacting non-renewable energy consumption, pollution, obesity, congestion, and collisions. What is more, the United Nations reported that 99% of the world’s urban population breathes polluted air [2]. Cities are responsible for more than 70% of the global greenhouse gas emissions produced and this is a significant threat to human health worldwide, especially considering that more than half the world’s population live in cities nowadays and it is estimated that seven out of ten people will likely live in urban areas by 2050.
Among the EU countries, some governments are currently applying walking strategies at a national level. Since 2017, the English government has adopted a Walking Investment Strategy [3] with the aim to increase the levels of walking up to 300 stages per person per year. A similar national walking promotion strategy has also been adopted in Finland since 2018 [4]. Among the targets, the Finnish program aims to increase the walking modal share by 30% by 2030. Including pedestrian safety in every step of the planning, design, implementation, and management process is another key factor to ensure that the main pedestrians’ problems are identified and then mobilised.
Over being carbon and emission-free, walking is also the most common mode of transport, making part of our everyday lives and trips. Progress in road safety has been made in recent years. Nevertheless, there is still evidence that safety improvements are not equally shared by all road users and vulnerable road users’ safety has not improved as much as that of vehicle drivers. Pedestrian crashes, indeed, still represent a serious issue in the EU. Over the period 2010–2018, the number of pedestrian deaths decreased by 2.6% on average each year in the EU compared to a 3.1% annual reduction in motorised road user deaths [1]. In the same period, in Italy, the number of pedestrian deaths decreased annually by only 0.1% [5]. Zegeer and Bushell [6] further found a greater pedestrian risk in urban areas where both pedestrians and vehicle activities are most intense. Thus, the greatest evidence is the ever-growing need for better knowledge among planners and engineers about the possible countermeasures that may balance the safety needs of pedestrians, drivers, and all road users. For a serious shift to walking, mainly for local journeys in densely populated areas, the design of urban spaces needs to change, establishing a modal priority on the basis of the vulnerability of road users. Hence, a study on the identification of pedestrian crash patterns appears strategic for planning, designing, and managing a safer transport system to guide safer urban development. Extensive prior research focused on the identification of contributory factors of severe and fatal crashes using the econometric models, mainly the multinomial logit (e.g., [7,8,9,10]) and the ordered logit models [11,12]. The need for models capable of capturing the unobserved heterogeneity highlighting hidden correlations among data has led to the implementation of the mixed logit (or random parameters) model [13,14,15,16,17,18]. Currently, the mixed logit is considered a precise estimator and the most used, proven, and consolidated model that explicitly accounts for crash-specific variations in the effects of explanatory variables. The model implies that the parameter effects can vary in magnitude across individual crashes, also ranging from negative to positive impacts [19], or be fixed within an observation group [20].
According to the review of the existing literature, prior recent research has also applied machine learning algorithms. Recognized as data-driven models, their use is to be preferred with large datasets [21]. They are free from a priori probabilistic and parametric assumptions about the phenomena of understudying, typical of the econometric models. A downside of the machine learning tools is their difficulty in uncovering causality. Nevertheless, some machine learning methods, such as the rule discovery technique and the classification trees, show better capabilities in detecting valuable information. Particularly powerful for dealing with prediction and classification problems, the association rules (e.g., [22,23,24,25,26]), as well as the classification trees (e.g., [24]), have been used in several studies to find out patterns affecting the pedestrian crash severity by identifying sets of patterns or rules. Prior studies performed by Montella et al. [27] showed that both the classification trees and the association rule straightforwardly detected non-trivial associations among crash patterns and their interdependencies in the data. The tree structure allowed a graphical visualization of the phenomenon investigated whereas the association rules revealed new information previously unknown in the data. Moreover, the results provided by the two different approaches were never conflicting and the joint use of the two machine learning tools as complementary methods was encouraged.
Several studies investigated the possible advantages provided by the combined use of econometric models and machine learning tools [28,29]. The implicit assumption in developing a traditional statistical model is that it will reveal causal effects while preserving the best prediction accuracy. However, the latest applications of machine learning tools, together with the issues of causality in traditional statistical modelling, advise safety analysts to find a compromise between uncovering causality and prediction accuracy. When choosing among the logit models or the data-driven methods, the main result provided by previous studies is that the traditional models and the machine learning tools agree on many aspects, including the importance of the variables and the direction of association between several explanatory variables and the response variable, and their joint use provides a trade-off between the predictive accuracy and the soundness and interpretability of the results [13,14].
Since previous research found that the joint application of the econometric and data-driven approaches is successful in providing non-trivial insights about crash contributory patterns and their interdependencies, this paper performed both an econometric model, namely the mixed logit model, and the association rules and the classification tree algorithm, as machine learning tools, to evaluate the patterns contributing to the greater propensity of pedestrian crashes. These methods have been generally used to analyse crash severity, whereas this study provided an application of such a methodological approach to detect the features associated with an increase in pedestrian crash proportion.
The aims of the study are (1) to detect the road infrastructure, environmental, vehicle, and driver-related patterns that affect the overrepresentation of pedestrian crashes in Italy, and (2) to identify safety countermeasures to mitigate the detected pedestrian crash patterns.
The paper is organized as follows: Section 2 shows the crash data and the related descriptive statistics, Section 3 introduces the methodology, Section 4 provides the results of pedestrian crash occurrence, Section 5 reports a comparison of the results provided by the different methods, Section 6 provides the discussion followed in Section 7 by the conclusions.

2. Crash Data

The Italian National Institute of Statistics (Istat, Rome, Italy) provided the crash data used in this study. The database includes only fatal crashes or crashes with injuries that occurred on Italian roads from 2014 to 2018. Crash severity is collected in two different levels: injury crashes and fatal crashes, without distinction between slight or serious injuries. Consistently with the datasets from Australasia, the European Union, and the United States [30], the Istat database defines a fatal crash as a crash where at least one person dies in the crash or within the 30 days following it. Crashes are classified through 118 variables describing the crash characteristics (including the time, the location of the crash, and the presumed circumstances of crashes), the roadway characteristics and the environmental conditions, the traffic units (including the vehicle characteristics), and the people implicated in the crash (including the characteristics of drivers, passengers, and pedestrians). Further variables regarding detailed crash information and driver psychophysical states were provided by Istat for research support. Finally, the dataset included 15 categorical variables and consisted of 874,847 crashes. Of which, 101,032 were pedestrian crashes (Table 1 and Table 2) representative of 11.55% of the total crashes. Among the pedestrian crashes, 2.94% resulted in fatal crashes. Regarding all fatal crashes (n = 15,780), almost one fatal crash out of five is with pedestrian involvement (18.81%).
The variable lighting, classified as a binary variable (day/night), was obtained evaluating the sunrise and sunset by the “SUNCALC” R-Package.

3. Method

This study presents the analysis of the road infrastructure, environmental, vehicle, and driver-related patterns affecting pedestrian crash propensity in Italy trough the implementation of the mixed logit model, the rule discovery, and the CART algorithm. The entire dataset containing 874,847 crashes was used in the analysis. All 15 variables presented in Table 1 and Table 2 were tested as potential explanatory variables. The dependent variable was the pedestrian crash that has a binary response: yes, if a pedestrian crash occurred, no otherwise.

3.1. The Mixed Logit Model

The mixed logit model is a random utility model that schematizes a specific category jth (that is the propensity of a crash of being classified as a crash involving—or not involving—a pedestrian in this study) with a utility given by the sum of Vij (the systematic component) and εij (the unobservable stochastic error):
U i = V j i + ε j i = β j   x i j + ε i j
where:
  • xij are the characteristics that may potentially affect a pedestrian crash,
  • βj are the parameters to be estimated,
  • εij is the disturbance term.
The hypothesis of the estimated parameters of being fixed is relaxed, so that one or more coefficients could potentially vary across crashes or be fixed within a group of crashes [20]. In that case, each β can be random and is derived as:
β j = β j   + σ j
where
  • βj is the column vector of random parameters capturing unobserved crash-specific attributes,
  • β j is the mean of βj random coefficient,
  • σ j is the standard deviations of the random coefficient.
The probability Pi(j) that a crash i (i = 1, ..., I) is classified as a pedestrian crash/not a pedestrian crash j (j = 1, ..., J) is given by:
P i j = e β j x i j J e β j x i j f β θ d β
where:
  • f  β σ is the β density function,
  • θ describes the β coefficients density function in terms of mean and variance.
The model was developed using the forward stepwise procedure with a p-value at most equal to 0.05. Finally, the McFadden’s Pseudo R2 index was used to assess how the model fits the data:
R 2 M c F a d d e n = 1 L L f u l l L L 0
where:
  • LLfull represents the log-likelihood of the model of interest which includes all statistically significant variables,
  • LL0 is the log-likelihood of the null model.
The R-cran environment with “Rchoice” was used to perform the mixed logit model.
For each significant coefficient, the Odds Ratio (OR) was assessed to evaluate the relative amount by which the odds of the outcome increased (OR > 1) or decreased (OR < 1) when the value of the corresponding indicator variable is set equal to 1.

3.2. Machine Learning Models

Two machine learning tools, namely association rules and classification trees, were used to detect pedestrian crash patterns.

3.2.1. Association Rules

The association rules are a descriptive-analytic method that extracts information from big data in rules having the form AB. Each rule is made up of at least one pattern, called antecedent (indicated with A), and a consequent (indicated with B). In our analysis, the consequent is the pedestrian crash. The a priori algorithm (proposed by Agrawal et al. [31]) examines all candidate item-sets. The valid rules must satisfy minimum values of support, confidence, and lift. The support represents the percentage of the entire data set covered by the rule (Equation (5)), the confidence evaluates the reliability of the inference of the rule (Equation (6)), and the lift measures the statistical interdependence of the rule (Equation (7)):
S   A B = # A B N ;   S A = # A N ; S   B = # B N ;
Confidence   = S   A B S A
Lift = S   A B S   A × S   B
where:
  • S(A B), S(A), and S(B) are respectively the supports of the rule, of the antecedent A, and of the consequent B,
  • #(A B), #(A), and #(B) are respectively the number of crashes having the antecedent A and the consequent B, the number of crashes with A as antecedent, and the number of crashes with B as consequent,
  • N is the total number of crashes in the dataset (874,847 total crashes).
Each rule with one antecedent and one consequent is a 2-item rule and is used as a starting point. Each rule with two antecedents and one consequent is a 3-item rule, and so on. Each rule with n + 1 items is validated by the lift increase (LIC), set equal to 5% [32,33].
The LIC values is calculated as follows:
L I C = L i f t A n L i f t A n 1
where:
  • An−1 is the antecedent of the n-1 item rule,
  • An is the antecedent of the n-item rule.
Support (S), confidence (C), and lift (L) threshold values were set as follows: S ≥ 0.1%, C ≥ 4.0%, L ≥ 1.2, and LIC ≥ 1.05. The association rules were performed in the R-cran software environment using the package “arules”.

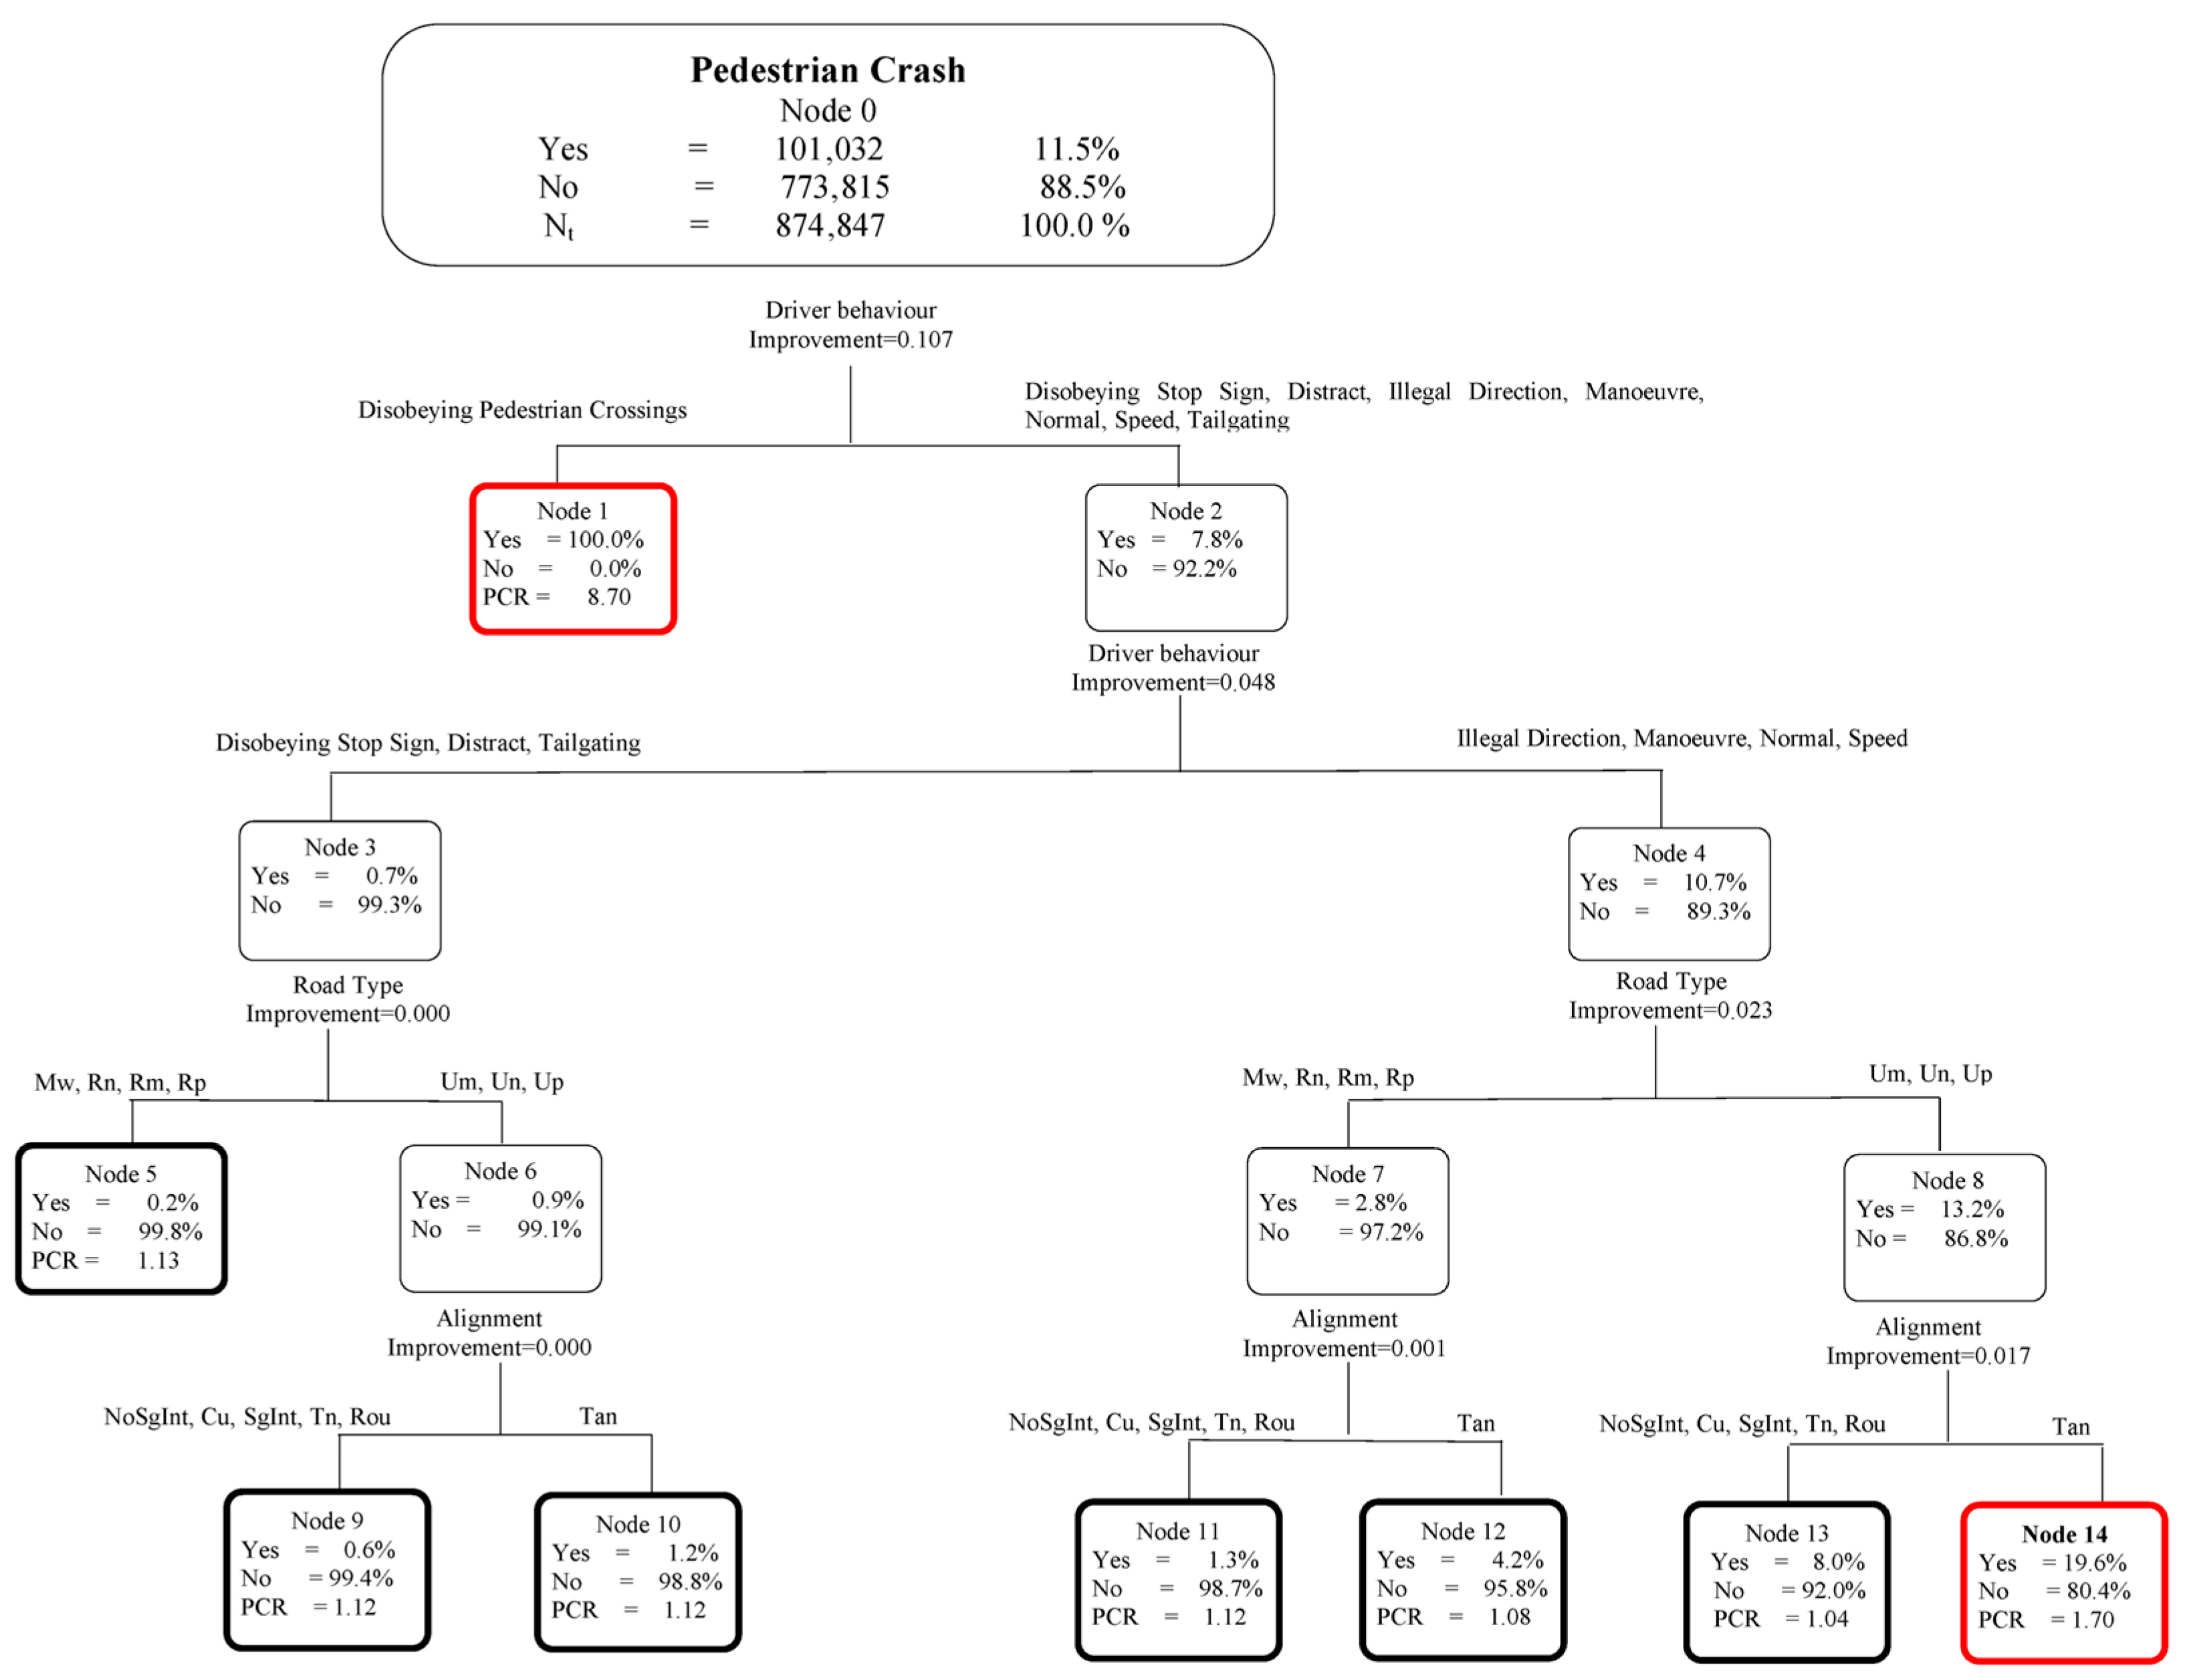
3.2.2. Classification Trees

A classification tree is an oriented graph where the root node (containing all data) is divided by a splitter into a finite number of leaf nodes [34]. We developed the CART binary tree proposed by Breiman et al. [35]. Each of the road infrastructure, environmental, vehicle, and driver-related patterns considered in the study are candidates for splitting. The splitting variable is determined to separate the observations into two groups that are as homogenous as feasible. To perform each split, the Gini index or the node impurity is assessed (as a measure of the total variance among all classes in the node). The impurity is given by:
i Y   t = 1 j p j | t 2
where:
  • iY(t) is the node t impurity,
  • p(j|t) represents the crashes in the node t belonging to class j.
The total impurity of any tree T is given by:
i Y T = t     T ˜   i Y   t p t
where:
  • i Y T is the total impurity of a tree T
  • p(t) = N(t)/N is the weight of the node t, N(t) is the number of crashes falling in node t whereas N is the total number of crashes,
  • T ˜ is the set of terminal nodes of the tree T.
The tree growing process was stopped based on two criteria: (1) the impurity reduction is less than 0.0001 (minimum default value); and (2) the tree can have at most four levels. At each node, the class assignment depends on the greatest value of the posterior classification ratio (PCR). The PCR compares the tree terminal nodes’ classification with the root node classification [27]:
P C R   ( j | t ) = p   ( j | t ) p   ( j | t r o o t )
where:
  • p(j|t) represents the crashes in the node t belonging to the class j,
  • troot is the tree root node.
For each node, the class j* with the greatest value of PCR gives the class of that node that is selected as follows:
j *   |   t   :   m a x j   P C R   ( j | t )
Then, to integrate the classification tree and the association rule discovery results, the classification tree was transformed into rules. All the splits are the antecedents of the rule while the class j* determines the consequent. The association rule thresholds of Support (S), confidence (C), lift (L), and lift increase (LIC) were also evaluated for each terminal node t.
The classification tree was carried out with SPSS 26 software (IBM, Armonk, NY, USA).

4. Results

4.1. Mixed Logit Model

The mixed logit model exhibited a McFadden Pseudo R2 of 0.56 indicating an excellent fit. Overall, 14 independent variables and 44 indicators were statistically significant (see Table 3) with fixed effects. The indicator variable is driver gender male resulting in normally distributed random effects and statistically significant standard deviation, both indicating the presence of unobserved heterogeneity in the data. The mean and standard deviation were respectively equal to 0.18 and 0.17 implying that for 86% of the crashes the probability of a pedestrian crash is increased by the presence of a male driver whereas, for the remaining 14% of the crashes, it leads to a decrease in that probability.

4.1.1. Roadway

As expected, urban municipal roads, considered as the baseline, show a greater propensity for pedestrian crashes while motorways show a lower propensity. Road alignment has a key role in pedestrian crashes. The simpler alignment, which is the tangent segment, has a higher propensity for pedestrian crashes while roundabouts have a lower probability of pedestrian crashes (OR = 0.23). Interestingly, pedestrian crashes in roundabouts are underrepresented compared to signalised and unsignalised intersections.

4.1.2. Environment

Results show a statistically significant higher probability of pedestrian crashes on weekdays, in winter (OR = 1.58), autumn (OR = 1.43), and spring (OR = 1.19), and in darkness. It is noteworthy to observe that weather conditions associated with pedestrian crashes are raining and snowing while wet, snowy, and slippery pavement are both associated with a pedestrian crash probability decrease.

4.1.3. Vehicles

Assuming cars as the baseline condition, trucks are overrepresented in pedestrian crashes while the involvement of PTWs and bicycles shows a lower probability of pedestrian crashes (OR = 1.24 vs OR = 0.69 and 0.36). Furthermore, older vehicles and vehicles with defects have a lower probability of pedestrian crashes (i.e., a higher probability of other crash types).

4.1.4. Drivers

Drivers’ significant variable results: behaviour (with a positive coefficient of manoeuvring, which includes right-turn, left-turn, and U-turn manoeuvres), psychological state (with a positive coefficient for defective eyesight, OR = 4.10), age (with an increase in the probability of being involved in a pedestrian crash for older driver age), and gender (random variable with male gender associated to a higher probability of pedestrian crashes for 86% of the observations, OR = 1.20).

4.2. Machine Learning Models

The rule discovery tool generated 63 valid rules. In detail, the algorithm identified three two-item rules (Table 4), 14 three-item rules (Table 4), 31 four-item rules (Table 4), and 15 five-item rules (Table 5). The rules were ordered by the decreasing value of the lift. Then, the rules were grouped according to the number of items.
The CART tree is reported in Figure 1. The algorithm provided eight terminal nodes, two of which predicted pedestrian crashes (node 1 and node 14) and were reported in red. Moreover, only these nodes (rules T_1, T_14, in Table 6) satisfied the LIC criterion (Equation (8)), identifying as predictors the following variables driver behaviour, road type, and alignment.
The PCR was evaluated for all the nodes. However, in the tree, it was provided only for the terminal nodes to understand how representative each terminal node is in relation to the predicted class. Node 1 exhibited a very high PCR equal to 8.70, this is synonymous with the robustness of this terminal node for pedestrian crash classification.

4.2.1. Roadway

Together with drivers aged ≥75 and drivers manoeuvring, tangent alignment, intersections, urban areas, and urban municipal roads were associated with pedestrian crashes. Urban roads and tangent alignment were also patterns identified by the tree.

4.2.2. Environment

The rules highlighted environmental conditions associated with pedestrian crashes such as night-time, wet pavement, rainy weather, winter, and autumn.

4.2.3. Vehicles

As regards vehicle type, both trucks and cars were associated with pedestrian crashes. As for the vehicle age, newer cars were associated with pedestrian crashes.

4.2.4. Drivers

All rules have as the first antecedent driver factors. Among them, eighty-six rules have elderly drivers (driver aged ≥75) as the first antecedent, twenty-three rules have driver’s manoeuvring as the first antecedent, and one rule has the driver’s failure to yield to pedestrians crossing on the zebra as the antecedent (rule 1, L = 8.66). The rule with the driver’s failure to yield to pedestrians crossing on the zebra was also identified by the classification tree (rule T_1, L = 8.66). Driver behaviour was also the primary split of the classification tree.

4.2.5. Interaction among Contributory Factors

The association rules and the classification tree showed several combinations of patterns associated with an overrepresentation of frequency pedestrian crashes (Table 4, Table 5 and Table 6). The combined presence of driver manoeuvring and intersection (rules 38 and 39) were identified as the strongest three-item rules with a lift greater than 7 and LIC greater than 4, meaning that vehicle manoeuvring at intersections is associated with a probability of pedestrian crashes greater than vehicle manoeuvring in segments or roundabouts. The combined presence of driver manoeuvring, unsignalised intersection, and car involvement increased the lift of rule 39 (without car involvement) producing a lift equal to 8.61 (rule 40). The five-item rule with the higher lift included the combined presence of older drivers (≥75), night-time, tangent alignment, and urban municipal road (rule 49, L = 4.26). Manoeuvring, speeding, and illegal travel directions were identified also by the classification tree (rule T_14, L = 1.70) and combined with urban roads on tangent alignment. The association of such driver behaviours and urban roads with tangent increase the probability of the occurrence of pedestrian crashes by almost 50%.

5. Comparison between the Econometric and the Machine Learning Methods

To compare the results of the mixed logit and the machine learning models, the significant explanatory variables, as well as their impact on the probabilities of pedestrian crash occurrence, are discussed below.

5.1. Roadway

Area as a contributory factor was identified only by the rule discovery technique with the urban areas associated with the pedestrian crash occurrence. Both the mixed logit and the machine learning tools, instead, identified the road type variable. They provided consistent results detecting an overrepresentation of pedestrian crashes on urban municipal roads. Consistency was also found for alignment. All the methods detected the tangent alignment as a contributory pattern. The association rules further identified signalised and unsignalised intersections, combined with driver’s manoeuvring, contributing to the pedestrian crash occurrence.

5.2. Environment

Both the mixed logit model and the association rules identified the day of the week as a significant pattern. The probability of pedestrian crash occurrence increases during the weekday. Night-time increases the pedestrian crash propensity. Raining and snowing weather condition increases the likelihood of pedestrian crash occurrence. Rain’s effect was captured both by the mixed logit model and the association rules whereas fog and high winds contributing to the decrease in pedestrian crash occurrence were significant only in the mixed logit.

5.3. Vehicles

The vehicle involved in a pedestrian crash is decisive. Indeed, the vehicle type influences the likelihood of observing a pedestrian crash. The results of both the mixed logit model as well as the association rules were consistent, pointing out that a pedestrian struck by a car or a truck rather than a bike or a PTW has a higher attendance risk. New vehicles (vehicles registered less than 10 years ago) have a positive effect on pedestrian crashes. These results suggest that the innovation in vehicle technology equipment intended to reduce the likelihood of crashes fails to detect pedestrians and does not take adequate account of their safety.

5.4. Drivers

The driver behaviour exhibited a significant effect in both the mixed logit model and the machine learning tools. Driver manoeuvring contributes to the overrepresentation of pedestrian crashes. Inappropriate behaviour, such as speeding and travelling in opposite the right direction, was found by the classification tree further contributing to pedestrian crashes. Furthermore, the association rules and the classification tree identified drivers disobeying pedestrian crossing facilities as critical.
The relation between the driver psychophysical state and the pedestrian crashes was identified only by the mixed logit model. Poor eyesight conditions involve an increase in pedestrian crash propensity.
Driver age was correlated with pedestrian crash overrepresentation, especially the involvement of elderly drivers (at least 75 years old) was identified by both groups of methods. Male driver involvement in pedestrian crash overrepresentation was found significant with random effect only in the mixed logit.

6. Discussion

The study results identified several patterns associated with an overrepresentation of pedestrian crashes. The roadway attributes contributing to an increase in pedestrian crash propensity were urban areas, urban municipal roads, tangent alignment, and intersections combined with drivers’ manoeuvring. These results indicate that the roadway patterns impacting the occurrence of pedestrian crashes differ from those affecting the pedestrian crash severity. Indeed, highly dense urban settings may provide more facilities for pedestrians whereas, in rural areas, there are likely to be poor infrastructures that accommodate pedestrians [36,37,38]. Despite this, pedestrian crashes are overrepresented on urban roads whereas fatal pedestrian crashes are overrepresented on other road types. Therefore, pedestrian-oriented safety countermeasures are strongly required for all road types. Based on the study results, on urban roads, special emphasis should be given to pedestrian treatments at mid-block locations. Walking should be prioritised in every new infrastructure scheme as well as when designing regenerated streets in an area experiencing land development, even during maintenance treatments. This may create an opportunity to reconsider some aspects of the street design useful to accommodate safe pedestrian mobility [39] and better incorporate pedestrian–vehicle safety considerations at locations where pedestrian crashes are more likely to occur [40,41,42]. The establishment of a suitable road user hierarchy should be based on safety, vulnerability, and sustainability, with walking being at the top of the hierarchy. The creation of pedestrian paths together with the reduction of vehicle-destined space is not easy to understand and digest for habitual road users. Hence, national, provincial, and municipal policies should work on public acceptance and emphasize the City’s interest and investment in developing safe and accessible streets that allow for safe movements.
Interestingly, the probability of pedestrian crashes at roundabouts is lower than at unsignalised and signalised intersections (ORs respectively equal to 0.23, 0.38, and 0.44). Hence, the safety benefits of the presence of roundabouts are relevant in decreasing the fatal pedestrian crash probability as well as in providing a reduction in the pedestrian crash probability. This is due to the reduction of pedestrian–vehicle conflict points and lower vehicle speeds [43,44]. This is a quite relevant result considering that in Italy there are often roundabouts with undesired safety features that negatively influence roundabout safety [45,46]. Based on the study result, if warranty conditions for the installation of roundabouts are satisfied converting unsignalised and signalised intersections in roundabouts is strongly recommended. Refuge islands at the legs of roundabouts further increase the safety of pedestrians at roundabouts [47].
The environmental patterns affecting the increase in pedestrian crash propensity were night-time, dry pavement, wet pavement combined with older drivers (≥75), or with drivers’ manoeuvring, weekday, autumn, winter, and spring seasons, raining, and snowing. Pedestrian visibility in darkness is a well-known safety concern. Both drivers’ and pedestrians’ sight reduce with dark lighting whereas increase their reaction times to avoid potential conflicts. Furthermore, higher driving speeds are generally observed at night, increasing the crash risk. The combination of these conditions increases the required braking distance of vehicles and leads to higher impact at the time of crashes. Traffic calming as well as low-speed zones in areas with significant pedestrian activity are the most effective solutions to mitigate pedestrian crash frequency at night. Providing adequate pedestrian visibility during the night-time further provides drivers with sufficient time to identify and appropriately react to other road users and hazards [48]. Pedestrian visibility during the night-time can be improved by providing pedestrian crossings lighting with light-emitting diodes (LEDs). Flashing in-curb LEDs as well as pedestrian-activated overhead beacons at crosswalks or in-pavement warning lights with advance signing are effective strategies to warn motorists of pedestrian crossings, increasing their attention, especially at night [49,50]. Campaigns to raise awareness of the importance of using reflective clothing to improve pedestrian conspicuity at night [51,52].
The vehicle patterns affecting the increase in pedestrian crash propensity were truck, car, and vehicles aged at most 10 years. Although the severity of truck-pedestrian crashes has already been found by prior research [53,54], this study further detected a detrimental relation between trucks and pedestrian crash occurrence. To mitigate the consequences of such crashes, traffic management strategies may be implemented separating pedestrian flow and truck routes.
The driver patterns affecting the increase in pedestrian crash propensity were manoeuvring, speeding, illegal travel direction, defective sight, very young age (≤ 17), medium age (45–64), and old age (≥65). Previous research found that the probability of complex vehicular manoeuvres increases the pedestrian crash occurrence, mainly at intersections [55]. The speeding behaviour of drivers was also found to increase the risk of conflicts and its associated crash risk [56]. The driver disobedience of pedestrian crossing facilities was also identified as a pattern contributing to pedestrian crash overrepresentation. The mixed logit model showed a significant odds ratio (equal to 1.41) for drivers with sight issues increasing the likelihood of pedestrian crashes. The rule discovery and the CART algorithm identified the strongest predictor in the drivers’ disobeying pedestrian crossing facility. Consistently with previous studies [39], the quality and complexity of the walking environment, exacerbated by poor visibility in the proximity of road crossing opportunities, increase the possibility of pedestrian-vehicle conflicts. Empirical studies have proved the effectiveness of appropriate design modifications aimed at reducing pedestrian crashes and removing barriers to walking [6]. The use of bulb-outs to improve pedestrian visibility is further encouraged. Provided at junction corners, the bulb-outs shorten the pedestrian crossing distance and offer a better view of the oncoming vehicles. Previous research has found that their presence affects the vehicles’ operating speeds. In-site measurements revealed lower speeds recorded in sections where bulb-outs are located [57]. Other scholars suggest narrowing the road cross-section (bulb-outs) and introducing pedestrian crossings with blinking lights turning on automatically when a pedestrian is identified [58]. Furthermore, safety awareness and education campaigns should target drivers on pedestrian right-of-way. To stimulate individuals towards safety-oriented actions, education campaigns are fundamental.
This study further identified a greater propensity of older drivers for pedestrian crashes, probably because of their lower reaction times and more difficult interaction with pedestrians.

7. Conclusions

The investigation of the patterns affecting pedestrian crash occurrence is not a well-developed topic as pedestrian crash severity. Whereas many studies aimed at reducing fatal and severe pedestrian crashes, the main aim of this paper was to help to raise awareness among practitioners and provide better guidance in planning and designing infrastructures for pedestrians that are safe, of course, but also accessible and sustainable, to prevent the occurrence of pedestrian crashes towards a vision of walkable cities. This study used an econometric model, namely the mixed logit model, the rule discovery technique, and the CART algorithm, as machine learning tools, to analyse the road infrastructure, environmental, vehicle, and driver-related patterns affecting the pedestrian crash overrepresentation in Italy. The mixed logit, the rule discovery, and the CART algorithm have been generally used to analyse crash severity, whereas this study provided an application of such a methodological approach to detect those features affecting the pedestrian crash occurrence.
The dataset contains 874,847 road crashes resulting in fatalities or injuries that occurred in Italy from 2014 to 2018. Of these, 101,032 were pedestrian crashes.
The results provided by the two groups of methods provide strong evidence of the importance of promoting urban sustainable complete street planning and development as well as raising awareness in support of safer behaviour if walking has to forge an effective—and mainly safe—solution against private car dependence, traffic noise, air pollution, health disease, and pedestrian vulnerability. To this aim, walking should be at the top of the hierarchy in every new infrastructure scheme as well as in street re-generation designs.
The methodological approach adopted in this study was effective in uncovering relations among road infrastructure, environmental, vehicle, and driver-related patterns, and the overrepresentation of pedestrian crashes. The latest applications of machine learning tools suggest that analysts must opt for a compromise between prediction accuracy and uncovering causality, trying to achieve prediction accuracy and, at the same time, exhaustive and reliable factors contributing to crashes. Despite this, the results of this study advocate the econometric model and the machine learning tools as complementary approaches. The mixed logit provided a clue on the impact of each pattern on the pedestrian crash occurrence whereas the association rules and the classification tree detected the associations among the patterns with insights on how the co-occurrence of more factors could be detrimental to pedestrian safety. Furthermore, the strength of the co-occurrence of the patterns impacting the pedestrian crash occurrence can be measured via the lift increase for the association rules and the posterior classification ratio for the classification tree with the factors mostly contributing to pedestrian crashes being the patterns providing the higher increase in the lift values (association rules) or the splitter modalities providing the highest proportion of pedestrian crashes in a node concerning the root node of the tree. By contrast, the mixed logit model provides information about the directions and magnitude of variable indicators. By the joint use of the econometric methods and machine learning tools, the analyst can exploit the interpretability of the results of the econometric methods and the ability of the machine learning tools to provide comprehensible scenarios (as those provided by association rules and classification tree), further highlighting the co-occurrence and the relative strength of the patterns that contribute to vehicle-pedestrian crashes.
According to the results obtained in the study, safety countermeasures have been proposed. Including pedestrian safety in every step of the planning, design, implementation, and management process is a key factor to ensure that their main problems are identified and mobilised.
The insights gained from the study may help to raise awareness among local authorities and transport agencies in planning and designing appropriate spaces for pedestrians. Furthermore, the results provided by the study may be also considered by the automotive industry to address the important challenge of how vehicle onboard devices can prevent pedestrian crashes.
A significant contribution of this paper relies on the detection of the detrimental impact of drivers’ psychophysical states and drivers’ behaviours on pedestrian crashes. The availability of such information in the data is crucial. It detects the need for conducting safety awareness and education campaigns to increase safety-oriented actions.

Author Contributions

Conceptualization, A.M. and M.R.R.; Methodology A.M., A.S., F.G. and M.R.R.; Formal Analysis, A.S. and M.R.R.; Validation, A.M. and M.R.R.; Writing—Original Draft, M.R.R.; Writing—Review & Editing, A.M., A.S., F.G. and M.R.R.; Supervision, A.M. All authors have read and agreed to the published version of the manuscript.

Funding

This research received no external funding.

Institutional Review Board Statement

Not applicable.

Informed Consent Statement

Not applicable.

Data Availability Statement

The Italian National Institute of Statistics (Istat) provided the crash data used in this study.

Conflicts of Interest

The authors declare that they have no known competing financial interests or personal relationships that could have appeared to influence the work reported in this paper.

References

  1. ETSC, 2020. How Safe is Walking and Cycling in Europe? (PIN Flash 38). Available online: https://etsc.eu/wp-content/uploads/PIN-Flash-38_FINAL.pdf (accessed on 3 October 2022).
  2. United Nations. The Sustainable Development Goals Report. 2022. Available online: https://unstats.un.org/sdgs/report/2022/ (accessed on 3 October 2022).
  3. Department for Transport—DfT, 2017. Cycling and Walking Investment Strategy. Available online: http://bit.ly/2BRtQ35 (accessed on 5 October 2022).
  4. Liikenne- ja Viestintäministeriö, 2018. Kävelyn ja pyöräilyn edistämisohjelma. Available online: https://bit.ly/33vxR98 (accessed on 5 October 2022).
  5. Istat, National Institute of Statistics, 2019. Road accidents in Italy, year 2018. Available online: https://www.istat.it/en/archivio/232376 (accessed on 5 October 2022).
  6. Zegeer, C.V.; Bushell, M. Pedestrian crash trends and potential countermeasures from around the world. Acc. Anal. Prev. 2012, 44, 3–11. [Google Scholar] [CrossRef] [PubMed]
  7. Chen, Z.; Fan, W.D. A multinomial logit model of pedestrian-vehicle crash severity in North Carolina. Int. J. Transp. Sci. Technol. 2019, 8, 43–52. [Google Scholar] [CrossRef]
  8. Casado-Sanz, N.; Guirao, B.; Galera, A.L.; Attard, M. Investigating the Risk Factors Associated with the Severity of the Pedestrians Injured on Spanish Crosstown Roads. Sustainability 2019, 11, 5194. [Google Scholar] [CrossRef] [Green Version]
  9. Noh, Y.; Kim, M.; Yoon, Y. Elderly pedestrian safety in a rapidly aging society—Commonality and diversity between the younger-old and older-old. Traffic Inj. Prev. 2018, 19, 874–879. [Google Scholar] [CrossRef] [PubMed]
  10. Olszewski, P.; Szagala, P.; Wolanski, M.; Zielinska, A. Pedestrian fatality risk in accidents at unsignalized zebra crosswalksin Poland. Acc. Anal. Prev. 2015, 84, 83–91. [Google Scholar] [CrossRef] [PubMed]
  11. Pour-Rouholamin, M.; Zhou, H. Investigating the risk factors associated with pedestrian injury severity in Illinois. J. Saf. Res. 2016, 57, 9–17. [Google Scholar] [CrossRef]
  12. Yasmin, S.; Eluru, S.; Ukkusuri, S. Alternative Ordered Response Frameworks for Examining Pedestrian Injury Severity in New York City. J. Transp. Saf. Secur. 2014, 6, 275–300. [Google Scholar] [CrossRef]
  13. Rella Riccardi, M.; Mauriello, F.; Sarkar, S.; Galante, F.; Scarano, A.; Montella, A. Parametric and Non-Parametric Analyses for Pedestrian Crash Severity Prediction in Great Britain. Sustainability 2022, 14, 3188. [Google Scholar] [CrossRef]
  14. Rella Riccardi, M.; Mauriello, F.; Scarano, A.; Montella, A. Analysis of contributory factors of fatal pedestrian crashes by mixed logit model and association rules. Int. J. Inj. Contr. Saf. Promot. 2022, in press. [Google Scholar] [CrossRef]
  15. Haleem, K.; Alluri, P.; Gan, A. Analyzing pedestrian crash injury severity at signalized and non-signalized locations. Acc. Anal. Prev. 2015, 81, 14–23. [Google Scholar] [CrossRef]
  16. Islam, S.; Jones, S. Pedestrian at-fault crashes on rural and urban roadways in Alabama. Acc. Anal. Prev. 2014, 72, 267–276. [Google Scholar] [CrossRef]
  17. Tulu, G.S.; Washington, S.; Haque, M.; King, M. Injury severity of pedestrians involved in road traffic crashes in Addis Ababa, Ethiopia. J. Transp. Saf. 2017, 9, 47–66. [Google Scholar] [CrossRef]
  18. Zhai, X.; Huang, H.; Sze, N.N.; Song, Z.; Hon, K.K. Diagnostic analysis of the effects of weather condition on pedestrian crash severity. Acc. Anal. Prev. 2019, 122, 3118–3324. [Google Scholar] [CrossRef]
  19. Milton, J. Highway accident severities and the mixed logit model: An exploratory empirical analysis. Acc. Anal. Prev. 2006, 40, 260–266. [Google Scholar] [CrossRef]
  20. Washington, S.P.; Karlaftis, M.G.; Mannering, F.L. Statistical and Econometric Methods for Transportation Data Analysis, 3rd ed.; Chapman and Hall/CRC: Boca Raton, FL, USA, 2020. [Google Scholar]
  21. Mannering, F.L.; Bhat, C.R.; Shankar, V.; Abdel-Aty, M. Big data, traditional data and the tradeoffs between prediction and causality in highway-safety analysis. Anal. Methods Accid. Res. 2020, 25, 100113. [Google Scholar] [CrossRef]
  22. Besharati, M.M.; Kashani, A.T. Which set of factors contribute to increase the likelihood of pedestrian fatality in road crashes? Int. J. Inj. Control Saf. Promot. 2017, 25, 247–256. [Google Scholar] [CrossRef]
  23. Das, S.; Avelar, R.; Dixon, K.; Sun, X. Investigation on the wrong way driving crash patterns using multiple correspondence analysis. Acc. Anal. Prev. 2018, 111, 43–55. [Google Scholar] [CrossRef]
  24. Jung, S.; Qin, X.; Oh, C. Improving strategic policies for pedestrian safety enhancement using classification tree modeling. Transp. Res. Part A Policy Pract. 2016, 85, 53–64. [Google Scholar] [CrossRef]
  25. Pour, T.A.; Moridpour, S.; Tay, R.; Rajabifard, A. Modelling pedestrian crash severity at mid-blocks. Transp. A 2017, 13, 273–297. [Google Scholar] [CrossRef]
  26. Sivasankaran, S.K.; Natarajan, P.; Balasubramanian, V. Identifying Patterns of Pedestrian Crashes in Urban Metropolitan Roads in India using Association Rule Mining. Transp. Res. Procedia 2020, 48, 3496–3507. [Google Scholar] [CrossRef]
  27. Montella, A.; de Oña, R.; Mauriello, F.; Rella Riccardi, M.; Silvestro, G. A data mining approach to investigate patterns of powered two-wheeler crashes in Spain. Acc. Anal. Prev. 2020, 134, 105251. [Google Scholar] [CrossRef] [PubMed]
  28. Zhao, X.; Yan, X.; Yu, A.; Hentenryck, P.V. Prediction and behavioral analysis of travel mode choice: A comparison of machine learning and logit models. Travel. Behav. Soc. 2020, 20, 22–35. [Google Scholar] [CrossRef]
  29. Mokhtarimousavi, S.; Anderson, J.C.; Hadi, M.; Azizinamini, A. A temporal investigation of crash severity factors in worker-involved work zone crashes: Random parameters and machine learning approaches. Transp. Res. Interdiscip. Perspect. 2021, 10, 100378. [Google Scholar] [CrossRef]
  30. Montella, A.; Chiaradonna, S.; Criscuolo, G.; De Martino, S. Development and evaluation of a web-based software for crash data collection, processing and analysis. Acc. Anal. Prev. 2019, 130, 108–116. [Google Scholar] [CrossRef] [PubMed]
  31. Agrawal, R.; Imielinski, T.; Swami, A. Mining association rules between sets of items in large databases. In Proceedings of the 1993 ACM SIGMOD International Conference on Management of Data, Washington, DC, USA, 25–28 May 1993; pp. 207–216. [Google Scholar] [CrossRef]
  32. López, G.; Abellán, J.; Montella, A.; de Oña, J. Patterns of Single-Vehicle Crashes on Two-Lane Rural Highways in Granada Province, Spain: In-Depth Analysis through Decision Rules. Transp. Res. Rec. 2014, 2432, 133–141. [Google Scholar] [CrossRef]
  33. Montella, A.; Mauriello, F.; Pernetti, M.; Rella Riccardi, M. Rule discovery to identify patterns contributing to overrepresentation and severity of run-off-the-road crashes. Acc. Anal. Prev. 2021, 155, 106119. [Google Scholar] [CrossRef]
  34. Moral-Garcia, S.; Castellano, J.G.; Mantas, J.G.; Montella, A.; Abellan, J. Decision tree ensemble method for analyzing traffic accidents of novice drivers in urban areas. Entropy 2019, 21, 360. [Google Scholar] [CrossRef] [Green Version]
  35. Breiman, L.; Friedman, J.H.; Olshen, R.A.; Stone, C.J. Classification and Regression Trees; Wadsworth International Group: Belmont, CA, USA, 1984. [Google Scholar]
  36. Montella, A.; Guida, C.; Mosca, J.; Lee, J.; Abdel-Aty, M. Systemic approach to improve safety of urban unsignalized intersections: Development and validation of a Safety Index. Acc. Anal. Prev. 2020, 141, 105523. [Google Scholar] [CrossRef]
  37. Montella, A.; Chiaradonna, S.; Claudi, A.; Lovegrove, G.; Nunziante, P.; Rella Riccardi, M. Sustainable complete streets design criteria and case study in Naples, Italy. Sustainability 2022, 14, 13142. [Google Scholar] [CrossRef]
  38. Stoker, P.; Carfinkel-Castro, A.; Khayesi, M.; Odero, W.; Mwangi, M.N.; Peden, M.; Ewing, R. Pedestrian safety and the built environment: A review of the risk factors. J. Plann. Lit. 2015, 30, 377–392. [Google Scholar] [CrossRef]
  39. Tinessa, F.; Pagliara, F.; Biggiero, L.; Delli Veneri, G. Walkability, accessibility to metro stations and retail location choice: Some evidence from the case study of Naples. Res. Transp. Bus. Manag. 2021, 40, 100549. [Google Scholar] [CrossRef]
  40. Cottrill, C.D.; Thakuriah, P. Evaluating pedestrian crashes in areas with high low-income or minority populations. Acc. Anal. Prev. 2010, 42, 1718–1728. [Google Scholar] [CrossRef]
  41. Cafiso, S.; Montella, A.; D’Agostino, C.; Mauriello, F.; Galante, F. Crash modification functions for pavement surface condition and geometric design indicators. Acc. Anal. Prev. 2021, 149, 105887. [Google Scholar] [CrossRef]
  42. Wang, X.; Yang, J.; Lee, C.; Ji, Z.; You, S. Macro-level safety analysis of pedestrian crashes in Shanghai, China. Acc. Anal. Prev. 2016, 96, 12–21. [Google Scholar] [CrossRef] [Green Version]
  43. Rodegerdts, L.; Bansen, J.; Tiesler, C.; Knudsen, J.; Myers, E.; Johnsonm, M.; Moule, M.; Persaud, B.; Lyon, C.; Hallmark, S.; et al. Roundabouts: An Informational Guide. In Transportation Research Board, 2nd ed.; NCHRP Report 672: Washington, DC, USA, 2010. [Google Scholar]
  44. Montella, A.; Turner, S.; Chiaradonna, S.; Aldridge, D. International overview of roundabout design practices and insights for improvement of the Italian standard. Can. J. Civ. Eng. 2013, 40, 1215–1226. [Google Scholar] [CrossRef]
  45. Montella, A. Roundabout in-service safety reviews: Safety assessment procedure. Transp. Res. Rec. 2007, 2019, 40–50. [Google Scholar] [CrossRef]
  46. Rella Riccardi, M.; Augeri, M.G.; Galante, F.; Mauriello, F.; Nicolosi, V.; Montella, A. Safety Index for evaluation of urban roundabouts. Acc. Anal. Prev. 2022, 158, 106858. [Google Scholar] [CrossRef]
  47. Distefano, L.; Leonardi, S.; Pulvirenti, G. Experimental analysis of pedestrian behavior at different configurations of crosswalks at roundabout legs. J. Eur. Transp. 2021, 85, 3. [Google Scholar] [CrossRef]
  48. IRAP. Road safety toolkit. Available online: https://toolkit.irap.org/safer-road-treatments/sight-distance-obstruction-removal/ (accessed on 20 September 2022).
  49. Fitzpatrick, K.; Turner, S.M.; Brewer, M.; Carlson, P.J.; Ullman, B.; Trout, N.D.; Park, E.S.; Whitacre, J.; Lalani, N.; Lord, D. TCRP Report 112/NCHRP Report 562: Improving Pedestrian Safety at Unsignalised Crossings; TRB of the National Academies: Washington, DC, USA, 2006. [Google Scholar]
  50. Lantieri, C.; Costa, M.; Vignali, V.; Acerra, E.M.; Marchetti, P.; Simone, A. Flashing in-curb LEDs and beacons at unsignalised crosswalks and driver’s visual attention to pedestrians during nighttime. Ergonomics 2021, 64, 330–341. [Google Scholar] [CrossRef]
  51. Zegeer, C.V.; Stutts, J.; Huang, H.; Cynecki, M.J.; Van Houten, H.; Alberson, B.; Pferer, R.; Neuman, T.R.; Slack, K.L.; Hardy, K.K. NCHRP Report 500: Guidance for Implementation of the AASHTO Strategic Highway Safety Plan 10: A Guide for Reducing Collisions Involving Pedestrians; TRB of the National Academies: Washington, DC, USA, 2004. [Google Scholar]
  52. Babić, D.; Babić, D.; Fiolić, M.; Ferko, M. Factors affecting pedestrian conspicuity at night: Analysis based on driver eye tracking. Saf. Sci. 2021, 139, 105257. [Google Scholar] [CrossRef]
  53. Li, Y.; Fan, W.D. Modelling severity of pedestrian-injury in pedestrian-vehicle crashes with latent class clustering and partial proportional odds model: A case study of North Carolina. Acc. Anal. Prev. 2019, 131, 284–296. [Google Scholar] [CrossRef] [PubMed]
  54. Salon, D.; McIntyre, A. Determinants of pedestrian and bicyclist crash severity by party at fault in San Francisco, CA. Acc. Anal. Prev. 2018, 110, 149–160. [Google Scholar] [CrossRef] [PubMed]
  55. Guo, Q.; Xu, P.; Pei, X.; Wong, S.C.; Yao, D. The effect of road network patterns on pedestrian safety: A zone-based Bayesian spatial modeling approach. Acc. Anal. Prev. 2017, 99, 114–124. [Google Scholar] [CrossRef] [PubMed] [Green Version]
  56. Su, J.; Sze, N.N.; Bai, L. A joint probability model for pedestrian crashes at macroscopic level: Roles of environment, traffic, and population characteristics. Acc. Anal. Prev. 2021, 150, 105898. [Google Scholar] [CrossRef]
  57. Solowczuk, A. Efficient Improvement of the Visibility of Pedestrians on Junctions in Tempo–30 Zones. IOP Conf. Ser. Mater. Sci. Eng. 2019, 603, 022042. [Google Scholar] [CrossRef] [Green Version]
  58. Szagala, P.; Brzezinski, A.; Kiec, M.; Budzynski, M.; Wachnicka, J.; Pazdan, S. Pedestrian Safety at Midblock Crossings on Dual Carriageway Roads in Polish Cities. Sustainability 2022, 14, 5703. [Google Scholar] [CrossRef]
Figure 1. Classification tree. In bold are reported all terminal nodes. In red are highlighted the terminal nodes predicting a pedestrian crash. For Road Type: Mw = Motorway, Rn = Rural national, Rp = Rural provincial, Rm = Rural municipal, Un = Urban national, Up = Urban provincial; Um = Urban municipal. For Alignment: Cu = Curve, NoSgInt = Unsignalised Intersection, Rou = Roundabout, SgInt = Signalised Intersection, Tan = Tangent, Tn = Tunnel.
Sustainability 14 15471 g001
Table 1. Descriptive statistics of total crashes (Part A).
VariableCodeTotal CrashesPedestrian Crashes
Count%Count%
Total-874,847100.00101,03211.55
Fatal crashes-15,7801.80296918.81
Injury crashes-859,06798.2098,06311.42
Area
RuralR222,48025.4348782.19
UrbanU652,36774.5796,15414.74
Road type
MotorwayMw46,5195.323300.71
Rural nationalRn51,6705.9110592.05
Rural provincialRp87,85110.0418512.11
Rural municipalRm36,4404.1716384.50
Urban nationalUn31,2473.57316310.12
Urban provincialUp58,1486.6549688.54
Urban municipalUm562,97264.3588,02315.64
Alignment
CurveCu91,27910.4343774.80
Unsignalised IntersectionNoSgInt267,03830.5223,3988.76
RoundaboutRou38,9864.4621415.49
Signalised IntersectionSgInt55,4326.34628211.33
TangentTan407,48946.5863,33415.54
TunnelTn32950.381023.10
OtherOt11,3281.29139812.34
Day of Week
WeekdayWeekday649,06374.1980,03012.33
WeekendWeekend225,78425.8121,0029.30
Season
AutumnAut274,26931.3535,90913.09
SpringSpr231,91126.5123,52510.14
SummerSum180,44420.6314,9288.27
WinterWin188,22321.5126,67014.17
Lighting
DayDy645,01173.7370,90310.99
NightNt229,83626.2730,12913.11
Pavement
DryDry724,29182.7983,11711.48
SlipperySl75740.872363.12
Snowy/FrozenS/F35940.412547.07
WetWt139,38815.9317,42512.50
Weather
ClearCl727,50683.1682,79611.38
FogFo81040.936898.50
High windsHW12660.141007.90
RainingRa84,8369.7011,97414.11
SnowingSn20240.2321112.32
OtherOt51,1115.84523710.25
Table 2. Descriptive statistics of total crashes (Part B).
VariableCodeTotal CrashesPedestrian Crashes
Count%Count%
Vehicle type
BicycleBc26,3103.0118376.98
CarCar647,26573.9976,39011.80
PTWPTW126,82914.5012,1929.61
TruckTr62,6287.1670045.52
OtherOt11,8151.35360930.55
Vehicle age
0–100–10407,49146.5849,6000.12
10–2010–20185,59321.2120,8880.11
>20>2025,9602.9727810.11
MissingMissing230,75126.3825,9850.11
Not appliedNA25,0522.8617780.07
Vehicle defect
DefectYes91291.043063.35
No defectNo865,71898.96100,72611.63
Driver behaviour
Disobeying pedestrian crossing facilityDisobeyingPedCrossings35,5634.0735,563100.00
Disobeying stop signDisobeyingStop38,5474.411310.34
DistractionDistract127,16614.548080.64
Illegal travel directionIllegalDirection13,4561.547405.50
ManoeuvringManoeuvre58,9156.7310,90418.51
NormalNormal196,94822.5126,09613.25
SpeedingSpeed90,37510.33941610.42
TailgatingTailgating76,4458.747310.96
OtherOt237,43227.1416,6437.01
Driver psychophysical state
Defective sightDefSight23270.2767829.14
ImpairedImpaired36,3784.1612123.33
NormalNormal836,14295.5899,14211.86
Driver age
≤170–1713,8081.5812829.28
18–2418–24111,56912.7584747.60
25–4425–44331,22337.8630,3899.17
45–5445–54171,49619.6020,07411.71
55–6455–64109,12812.4714,23813.05
65–7465–7468,6837.8510,71015.59
≥75≥7552,0735.95964518.52
MissingMissing16,8671.93622036.88
Driver gender
FemaleF235,18426.8824,46710.40
MaleM635,23572.6173,85011.63
MissingMissing44280.51271561.31
Table 3. Mixed logit: parameter estimates and goodness of fit measures.
VariableβORStd. Err.p-ValueVariableβORStd. Err.p-Value
Intercept0.441.560.01<0.001Vehicle Type
Road type Bicycle−1.030.360.09<0.001
Motorway−2.940.050.03<0.001PTW−0.370.690.01<0.001
Rural Municipal−1.110.330.02<0.001Truck0.211.240.01<0.001
Rural national−2.000.140.02<0.001Car
Rural provincial−1.900.150.01<0.001Vehicle Age
Urban national−0.630.530.02<0.00110–20−0.100.910.01<0.001
Urban provincial−0.750.470.01<0.001>20−0.190.830.02<0.001
Urban Municipal 0–10
Alignment Vehicle Defect
Curve−0.830.440.01<0.001Yes−0.560.570.04<0.001
No Signalized Intersection−0.970.380.01<0.001No
Roundabout−1.490.230.02<0.001Driver Behaviour
Signalized Intersection−0.820.440.01<0.001Disob. ped. crossing facility−3.530.030.04<0.001
Tunnel−0.840.430.06<0.001Distraction−3.230.040.02<0.001
Tangent Illegal travel direction−0.770.460.02<0.001
Day of Week Manoeuvring0.061.070.01<0.001
Weekend−0.160.850.01<0.001Speeding−0.170.840.01<0.001
Weekday Tailgating−2.900.050.02<0.001
Season Normal
Autumn0.361.430.01<0.001Driver Psychophysical State
Spring0.171.190.01<0.001Defective sight1.414.100.05<0.001
Winter0.451.580.01<0.001Impaired−0.810.450.02<0.001
Summer Normal
Lighting Driver Age
Night0.221.250.01<0.001≤170.171.180.02<0.001
Day 18–24−0.140.870.01<0.001
Pavement 45–540.211.240.01<0.001
Snowy/Frozen−0.410.670.060.0055–640.301.350.01<0.001
Slippery−1.220.300.05<0.00165–740.441.560.01<0.001
Wet−0.210.810.01<0.001≥750.591.810.01<0.001
Dry 25–44
Weather Driver Gender
Fog−0.180.840.03<0.001Mean Male0.181.200.01<0.001
High winds−0.510.600.08<0.001Sd.Male0.171.190.05<0.001
Raining0.251.290.02<0.001Female
Snowing0.271.310.07<0.001Number of observations874,847
Clear Log-likelihood null model−816,487.90
Log-likelihood full model−357,890.20
R2McFadden0.56
Table 4. Association rules with two, three, and four items.
RuleAssociation RulesSCLLIC
IDAntecedent%%
1Driver Behaviour = DisobeyingPedCrossings4.07100.008.66n.a.
2Driver Age ≥ 751.1018.521.60n.a.
3Driver Age ≥ 75 & Lighting = Nt0.2830.412.631.64
4Driver Age ≥ 75 & Lighting = Nt & Alignment = Tan0.1839.273.401.29
5Driver Age ≥ 75 & Lighting = Nt & Road Type = Um0.2338.033.291.25
6Driver Age ≥ 75 & Lighting = Nt & Area = U0.2736.743.181.21
7Driver Age ≥ 75 & Lighting = Nt & Season = Win0.1234.893.021.15
8Driver Age ≥ 75 & Weather = Ra0.1426.822.321.45
9Driver Age ≥ 75 & Weather = Ra & Road Type = Um0.1235.823.101.34
10Driver Age ≥ 75 & Weather = Ra & Area = U0.1333.722.921.26
11Driver Age ≥ 75 & Alignment = Tan0.7025.852.241.40
12Driver Age ≥ 75 & Alignment = Tan & Pavement = Wt0.1233.692.921.30
13Driver Age ≥ 75 & Alignment = Tan & Road Type = Um0.6033.202.871.28
14Driver Age ≥ 75 & Alignment = Tan & Area = U0.6731.662.741.22
15Driver Age ≥ 75 & Alignment = Tan & Season = Win0.1831.032.691.20
16Driver Age ≥ 75 & Alignment = Tan & Driver Behaviour = Normal0.1529.622.571.15
17Driver Age ≥ 75 & Alignment = Tan & Season = Aut0.2729.462.551.14
18Driver Age ≥ 75 & Road Type = Um0.9623.872.071.29
19Driver Age ≥ 75 & Road Type = Um & Pavement = Wt0.1632.242.791.35
20Driver Age ≥ 75 & Road Type = Um & Season = Win0.2628.852.501.21
21Driver Age ≥ 75 & Road Type = Um & Season = Aut0.3627.432.381.15
22Driver Age ≥ 75 & Road Type = Um & Driver Behaviour = Normal0.1926.942.331.13
23Driver Age ≥ 75 & Road Type = Um & Vehicle Type = Car0.9126.232.271.10
24Driver Age ≥ 75 & Pavement = Wt0.1923.632.051.28
25Driver Age ≥ 75 & Pavement = Wt & Area = U0.1830.202.611.28
26Driver Age ≥ 75 & Area = U1.0622.551.951.22
27Driver Age ≥ 75 & Area = U & Season = Win0.2827.232.361.21
28Driver Age ≥ 75 & Area = U & Season = Aut0.4026.152.261.16
29Driver Age ≥ 75 & Area = U & Driver Behaviour = Normal0.2226.032.251.15
30Driver Age ≥ 75 & Driver Behaviour = Normal & Vehicle Type = Car0.2225.022.171.13
31Driver Age ≥ 75 & Season = Win0.2922.551.951.22
32Driver Age ≥ 75 & Season = Win & Vehicle Age = 0–100.1224.852.151.10
33Driver Age ≥ 75 & Driver Behaviour = Normal0.2322.051.911.19
34Driver Age ≥ 75 & Season = Aut0.4221.611.871.17
35Driver Age ≥ 75 & Season = Aut & Vehicle Age = 0–100.1723.672.051.10
36Driver Age ≥ 75 & Vehicle Age = 0–100.4620.381.761.10
37Driver Behaviour = Manoeuvre1.2518.511.60n.a.
38Driver Behaviour = Manoeuvre & Alignment = SgInt0.1081.787.084.42
39Driver Behaviour = Manoeuvre & Alignment = UnSgInt0.2681.377.054.40
40Driver Behaviour = Manoeuvre & Alignment = UnSgInt & Vehicle Type = Car0.2299.388.611.22
41Driver Behaviour = Manoeuvre & Vehicle Type = Tr0.1624.132.091.30
42Driver Behaviour = Manoeuvre & Vehicle Type = Tr & Road Type = Um0.1430.012.601.24
43Driver Behaviour = Manoeuvre & Vehicle Type = Tr & Area = U0.1428.192.441.17
44Driver Behaviour = Manoeuvre & Season = Win0.3123.462.031.27
45Driver Behaviour = Manoeuvre & Season = Win & Road Type = Um0.2828.402.461.21
46Driver Behaviour = Manoeuvre & Season = Win & Area = U0.2926.582.301.13
47Driver Behaviour = Manoeuvre & Road Type = Um1.1123.162.011.25
48Driver Behaviour = Manoeuvre & Area = U1.1721.141.831.14
Table 5. Association rules with five items.
RuleAssociation RulesSCLLIC
IDAntecedent%%
49Driver Age ≥ 75 & Lighting = Nt & Alignment = Tan & Road Type = Um0.1549.254.261.25
50Driver Age ≥ 75 & Lighting = Nt & Alignment = Tan & Area = U0.1748.064.161.22
51Driver Age ≥ 75 & Lighting = Nt & Season = Win & Area = U0.1141.053.551.18
52Driver Age ≥ 75 & Alignment = Tan & Road Type = Um & Pavement = Wt0.1044.223.831.33
53Driver Age ≥ 75 & Alignment = Tan & Road Type = Um & Vehicle Type = Car0.5736.813.191.11
54Driver Age ≥ 75 & Alignment = Tan & Area = U & Pavement = Wt0.1241.983.641.33
55Driver Age ≥ 75 & Alignment = Tan & Area = U & Vehicle Type = Car0.6434.963.031.10
56Driver Age ≥ 75 & Alignment = Tan & Area = U & Driver Behaviour = Normal0.1434.863.021.10
57Driver Age ≥ 75 & Alignment = Tan & Season = Win & Road Type = Um0.1639.213.401.26
58Driver Age ≥ 75 & Alignment = Tan & Season = Win & Area = U0.1837.443.241.21
59Driver Age ≥ 75 & Alignment = Tan & Driver Behaviour = Normal & Vehicle Type = Car0.1433.292.881.12
60Driver Age ≥ 75 & Alignment = Tan & Season = Aut & Road Type = Um0.2337.443.241.27
61Driver Age ≥ 75 & Alignment = Tan & Season = Aut & Area = U0.2535.803.101.22
62Driver Age ≥ 75 & Road Type = Um & Driver Behaviour = Normal & Vehicle Type = Car0.1831.192.701.16
63Driver Age ≥ 75 & Area = U & Driver Behaviour = Normal & Vehicle Type = Car0.2129.932.591.15
Table 6. Rules identified by the classification tree with pedestrian crash as consequent.
RuleAssociation RulesSCLLIC
IDAntecedent%%
T_1Driver Behaviour = Disobeying pedestrian crossing facility4.07100.008.66n.a.
T_14Driver Behaviour = Manoeuvring/Speeding/Normal/Illegal travel direction & Road Type = Urban municipal/Urban national/Urban provincial & Alignment = Tangent4.5219.651.701.49
Publisher’s Note: MDPI stays neutral with regard to jurisdictional claims in published maps and institutional affiliations.

