
Risk Aversion of B2C Cross-Border e-Commerce Supply Chain


1
School of Information, Beijing Wuzi University, Beijing 101149, China
2
School of Economics and Management, Xidian University, Xi’an 710126, China
3
School of Management Science and Engineering, Chongqing Technology and Business University, Chongqing 402160, China
4
International College, Krirk University, Bangkok 10220, Thailand
5
National Research Base of Intelligent Manufacturing Service, Chongqing Technology and Business University, Chongqing 400067, China
*
Author to whom correspondence should be addressed.
Sustainability 2022, 14(13), 8088; https://doi.org/10.3390/su14138088
Submission received: 2 June 2022
/
Revised: 21 June 2022
/
Accepted: 22 June 2022
/
Published: 1 July 2022
Abstract
:In recent years, with the booming development of the B2C cross-border e-commerce industry, the supply chain of B2C cross-border e-commerce faces many potential risk factors, which must be prevented. To solve this problem, this paper studies the supply chain risk factors of B2C cross-border e-commerce and puts forward avoidance strategies. First, the fitness network model of a dual local world is constructed by combining the fitness model with the local world model. Then, the fitness network model of the dual local world is verified by the risk dynamics simulation model to fit the actual network situation. On this basis, the SIRS virus transmission model is constructed to simulate the risk transmission of the B2C cross-border e-commerce supply chain, and the evaluation index system of the supply chain risk immunity ability and external risk intensity are established according to the supply chain risk immunity ability and external risk intensity. AHP is used to calculate the factors that have the greatest influence on supply chain risk immunity and external risk intensity. The results show that: from the point of view of the enterprise’s own risk immunity, it is more necessary to ensure the stability of the company’s capital and to establish a perfect risk monitoring and coping mechanism to avoid risks. From the perspective of enterprise external risk intensity, the risk should be avoided from two aspects of transaction security and logistics.
1. Introduction
With the acceleration of global economic integration, the traditional way of international trade has been unable to keep pace with the development and changes of the world economy. The rapid development of the Internet and the wide application of information technology have accelerated the integration of cross-border trade and e-commerce. Compared with domestic e-commerce, cross-border e-commerce has a longer supply chain, more links involved, longer logistics process, more complex information flow and slower capital turnover [1]. Enterprises in the supply chain cooperate and influence each other, and any small deviation may have a huge impact on the operation of the whole supply chain through the cascade effect [2,3]. However, at present, the international situation and unstable political environment make the adjustment of relationships between countries and cross-border logistics timeliness hard to control, and the supply chain upstream and downstream of the multi-level goods trade is likely to bring a cross-border B2C electrical supply chain risk; therefore, research on the supply chain risk conduction mechanism and preventive measures against possible risks appear important.
At present, a large number of scholars have carried out studies on supply chain, such as Beheshtinia et al. An improved genetic algorithm, GA-Topkor, was proposed to solve the supply chain scheduling problem in DMS in consideration of the environment and economy in order to optimize the supply chain [4]. In terms of supply chain performance, Park focuses on the new supply chain management based on block chain and its sustainability performance in environmental protection, social equity, governance efficiency and other aspects. Research shows that block chain technology has the potential to improve the sustainability performance of the supply chain [5]. Lin et al., in order to make the supply chain more coordinated, constructed a model framework to consider the risks caused by the uncertainty of supply and demand, and the production and procurement decisions under centralized and decentralized systems were discussed. Finally, a procurement strategy was proposed and verified to be effective in improving the coordination of the influenza vaccine supply chain [6]. Liu et al enabled optimal operation of a closed-loop supply chain under dual regulation through strategic management of product recycling and its environmental impact. A dual regulatory system characterized by deposit–refund policy and a minimum acquisition rate of used products was introduced, and a two-level closed-loop supply chain (CLSC) composed of brand owner and original equipment manufacturer (OEM) was established under the dual regulations [7]. He et al. considered a two-channel closed-loop supply chain (CLSC) where manufacturers can distribute new products through independent retailers and sell remanufactured products through third-party companies or platforms (3P) where government subsidies may exist. On this basis, manufacturers’ channel structure and pricing decisions as well as government subsidy policies for competitive new products and remanufactured products were explored [8].
Some scholars have also carried out research on green supply chain. For example, Dy et al. believed that a sustainable supply chain should be green and low carbon. They maximized the total profit of the system by obtaining the optimal value of production speed, volume, shipment and preservation investment, so as to make the supply chain sustainable and reduce waste. The product with low negative cross price elasticity or high positive cross price elasticity proposed by them was a profitable portfolio, which could reduce 20% of investment wastage in guaranteed technology [9]. For single-retailer and multi-retailer closed-loop supply chain models, Ullah et al. studied the remanufacturing strategy and reusable packaging capacity under random demand and random return rate, showing that remanufacturing is a relatively cheap strategy for supply chains with high setup and ordering costs [10]. Sepehri et al. believed that reducing carbon emissions plays an important role in the development of a sustainable inventory system, but few scholars have conducted research on the impact of carbon emissions on deteriorating inventory systems. Therefore, it is concluded that when carbon cap-and-trade rules fill the above gap, the price of perishable goods depends on demand [11]. Liu et al. proposed a location–storage–path integration model of perishable products considering carbon emissions and product freshness. This model can significantly improve the efficiency of perishable supply chain management from the perspective of global optimization, and vehicle speed can significantly affect economic cost and carbon emissions, thus achieving a sustainable supply chain [12]. Zhang believed that green improvement and green supply chain coordination of customers’ green preferences should be considered in the supply chain of emissions-intensive industries to achieve high supply chain performance. He also found that under the circumstance of high green investment cost, government intervention does not necessarily bring higher green improvement, and the government should shift from taxation to subsidies [13]. Liu et al. believed that suitable suppliers should be selected based on sustainable standards in the supply chain, proposed a fuzzy three-stage multi-criteria-integrated decision-making (MCDM) method to select the most qualified suppliers, and established sustainable supplier standards from economic, environmental and social aspects. Taking environmental factors into consideration, this method can make the supply chain achieve better sustainability [14].
In addition, some scholars believe that by using elastic network science and the intersection of supply chain research, such as Li on the presence of a chain reaction or risk, the research of supply chain network science overall flexibility (SCNR), namely a few enterprises in the supply chain network (SCN), can cause interruptions to spread to nearby enterprises, eventually spreading to other enterprises [15] in the SCN. Meng et al. analyzed the elasticity of the supply chain in a crowd network from static and dynamic perspectives. They first defined the elasticity of the supply chain, and then proposed a graphical and game theory framework to evaluate the elasticity, under which the supply chain network would reach a highly elastic equilibrium after experiencing repeated prisoner’s dilemmas [16].Li et al. proved that the investigation of network characteristics can better understand supply chain elasticity, showed that the use of a reduced feature list will produce the same performance as the use of a full feature set, and summarized the key points that can support the interpretation of the impact of network characteristics on elasticity [17].
In recent years, some scholars have also carried out studies on the risk transmission mechanism of the supply chain, such as Pankaj et al. Two sample t tests were conducted to find the impact of different risks in the cross-border e-commerce supply chain on supply chain performance, as well as the impact of one risk relative to another [18]. Tie et al. used the BBV model to build an enterprise R&D network and used the SIR model to simulate the diffusion of network risks. The robustness of the network under different risks was studied, and several indicators of three types of technical risks were compared and analyzed [19]. Zhang established a risk propagation model of an enterprise R&D network and solved the priority of various attacks by studying the parameters of anti-risk capabilities [20]. Syed et al. proposed a grey-based hybrid decision experiment and evaluation laboratory (DEMATEL) model to evaluate the relationship between the major risks identified in FSC [21]. Wang combined the complex supply chain network model with the cascading failure model to observe the dynamic transmission process of supply chain network risks and to conduct robustness analysis [22]. Chhimwal et al. analyzed how risk transmission occurs in the circular supply chain network of automobile organizations by using the Bayesian network method, and the research showed that the reverse side of the circular supply chain could be the source of risk transmission in the implementation of the circular concept [23]. Gouda studied the impact of sustainability practices on supply chain risk and showed that risk mitigation strategies do not always reduce the actual supply chain risk experienced by companies, while sustainability efforts can help reduce supply chain risk, especially in emerging market environments. In addition, while passive risk mitigation strategies cannot reduce supply chain risks by themselves, they are effective when used in conjunction with sustainable development efforts [24].
In the study of supply chain risk communication model methods, Lei et al. combined the complex network model and the optimization method of risk control strategy selection and proposed an improved SIS model, as well as discussed the dynamic changes and trends of risk transmission and the relationship and influence of different suppliers and supply chain structures on risk transmission, including the choice of risk control strategy for transnational supply chain [25]. Zheng, based on the SIRS infectious risk model, described the transmission process of credit risk transfer among enterprises after the stock market burst process, clearing the diffusion mechanism and effects. The results show that when the risk of infection intensity exceeds a certain threshold, the infected enterprise exceeds a certain level, and the proportion in the economy inevitably leads to unsafe [26] across the economy.
Through sorting out the above relevant literature, existing research on the cross-border e-commerce supply chain mainly focuses on supply chain optimization, performance evaluation, collaborative development, optimal operation under dual regulation, etc. [27,28,29,30]. Some scholars also studied the intersection of supply chain elasticity and network science. There are relatively few studies on the risk of the cross-border e-commerce supply chain. Supply chain risk research generally includes risk identification, risk assessment, risk dissemination and risk control [31,32,33,34,35,36]. The current research mainly focuses on the characteristics of a supply chain network, the bullwhip effect, and uncertain factors in networks under external attack. In terms of supply chain risk communication model methods, current research studies mainly focus on the SIS model and SIRS model, which are relatively single and fail to combine with other methods to increase the scientific nature of their communication mechanism. In this paper, the SIRS model is used to simulate the risk transmission of the SIRS virus on the basis of constructing the dual local world network model, and the main factors affecting the risk transmission of supply chain are analyzed by AHP. In addition, based on the analysis of the existing literature, this paper also sorts out the author’s contribution table as shown in Table 1.
On the basis of establishing the dual local world network model used to simulate the actual situation, this paper explores the risk transmission mechanism in the B2C cross-border e-commerce supply chain network by combining the RISK transmission model of the SIRS virus and proposes an avoidance strategy. At first, this paper builds a double local world fitness network model, and the actuality of the model is validated with a risk dynamics simulation model. Then, it builds a SIRS virus spread risk model, establishes influence on the spread of the risk evaluation index system, and then uses the analytic hierarchy process (AHP) to calculate the spread of B2C cross-border electricity supply chain risk weights of the affecting factors. The results show that in terms of risk immunity of the enterprise itself, whether the company’s capital is stable and whether the company has established a perfect risk monitoring and coping mechanism has a great impact on its risk transmission. From the perspective of enterprise external risk intensity, whether the transaction is safe or not regarding logistics problems has a greater impact on its risk dissemination.
The theoretical contributions of this paper are as follows:
- (1)
- The research of this paper provides a new idea for the establishment of a B2C cross-border e-commerce supply chain model and the exploration of a risk transmission mechanism. The fitness model and the local world model are combined and improved, and the fitness network model based on the dual local world is established.
- (2)
- The SIRS virus model is applied to the study of a supply chain risk transmission mechanism, and the factors influencing supply chain risk transmission of B2C cross-border e-commerce are explored.
The practical significance of this paper mainly includes the following points:
- (1)
- In this paper, a risk dynamics simulation is used to verify the constructed dual local world fitness network model, and the results show that the model is consistent with the real supply chain network model, which provides a model reference for the enterprise simulation experiment in the real supply chain.
- (2)
- Based on the RISK transmission model of the SIRS virus, this paper establishes an evaluation index system affecting risk transmission, calculates the main factors affecting risk transmission by using analytic hierarchy process, and puts forward specific measures and suggestions to control and avoid risks, which have a positive impact on the response to supply chain risks in reality.
2. Method
2.1. Fitness Network Model Based on Dual Local World
Based on the comprehensive observation and analysis of the previous literature and the actual situation, it can be seen that the network process of a cross-border B2C e-commerce supply chain is complicated, and the information feedback and reinforcement of the system itself can still evolve into various forms through the intervention of artificial behavior under certain environmental conditions. Although it is greatly affected by the external political and economic environment, risk management, cost control and other methods will also make the system tend to a new state, which is consistent with the characteristics of a complex network. Based on the above characteristics, it is not feasible to predict the overall results by observing and recording individual behaviors. Therefore, we finally choose to analyze the characteristics of cross-border B2C e-commerce networks by using complex network theory.
The cross-border B2C e-commerce network is abstracted into a graph composed of point set and edge set , , where represents the set of nodes, and represents the connections between nodes. The connection of the edge is divided into weighted and unweighted, thus forming a weighted network and unweighted network. Weight represents the strength of cooperation between nodes and can be measured by trading volume or transaction amount. In this chapter, only the transaction relationship between nodes is considered, not the direction of the transaction or the volume of the transaction; that is, the network is regarded as an undirected and unweighted network. There are many kinds of connections between enterprises, such as information sharing, project cooperation, product supply, etc. The structure of the network will be different according to the definition of the connection. In order to make a more detailed description of the model, the following definitions are made for the cross-border B2C e-commerce supply chain network model.
Definition 1.
Nodes in a network. In this paper, nodes in the complex network of the cross-border B2C e-commerce supply chain are divided into four categories: brand owners, purchasers, cross-border e-commerce platforms and logistics service providers; denote different types of enterprises. Purchasers refer to the middlemen who purchase products from the brand side and sell to the e-commerce platform downstream of the supply chain. In the actual supply chain, purchasers refer to the agent procurement platform that provides interprocurement and direct procurement services.
Definition 2.
Edges in a network. The edge in the complex network of the cross-border B2C e-commerce supply chain represents the transaction relationship between nodes. If there is a direct transaction relationship between nodes and , a connection is formed between the two nodes; otherwise, there is no connection between the two nodes. Denote the edge and edge as , and call and the end points of .
Definition 3.
The fitness of nodes. Fitness is a property intrinsically related to nodes. According to the principle of “survival of the fittest”, the fitness of the nodes affects the probability of the nodes being connected preferentially to other nodes. In the BA network model, the edge growth mechanism is only determined by the degree of nodes. The nodes that enter the network earlier have a higher degree and become hub nodes in the network. However, the actual network connection mechanism is not only determined by the “age” of the nodes. In the cross-border B2C e-commerce supply chain network, each node has its own fitness attribute.
In this study, the fitness of the nodes in the supply chain network consists of the production/operation scale, product quality, product price, logistics capacity, information capacity and other fitness factors of the nodes [37]; it is a comprehensive index, expressed by Formula (1):
where respectively represent the production/operation scale, product quality, product price and other fitness of node i, and component corresponds to the weight of the fitness factor, .
Since fitness components belong to different dimensions, and normalization is carried out according to Formula (2):
where represents the scale value of the node with the largest production/operation scale among all such nodes. Other fitness factors are normalized in the same way, and the Formula is rewritten as (3):
Definition 4.
Local world of nodes. A node’s local world refers to the range of nodes that can be connected when a new node joins the network. In a supply chain network, the local world is determined by the type of nodes and the connection mechanism of the network. The local world of each type of node is described in more detail later.
In the cross-border B2C e-commerce supply chain, the distribution of market shares is not uniform, in a state of “one exceeds many strong”, and a few enterprises with strong comprehensive strength occupy the majority of market shares. Therefore, we can think that the node fitness in the network conforms to the power-law distribution. The node fitness obeys the power-law distribution with parameter , where is the coefficient, is the power index, is the constant, and represent the brand, purchaser, cross-border e-commerce platform and logistics service provider, respectively. The fitness in this model does not change over time.
The power-law distribution of fitness indicates that the fitness of a few nodes is large while that of most nodes is small. In a practical supply chain network, some companies with strong comprehensive strength can cooperate across levels, such as the stronger brand can not only reach a cooperation with buyers, but can also reach directly with the electric business platform to build cooperation or to arrange logistics delivery to the customer directly; similarly, the other nodes in the network may also be because the fitness is big and has the ability of across hierarchy connection, as shown in Table 2.
The selection of the dual world is determined by the connection capacity of the node itself and is affected by the parameters in the model. During simulation, the changes of network structure are observed by adjusting the parameters.
2.2. Model Formulation
In the cooperation evolution of a cross-border B2C e-commerce supply chain, nodal enterprises select partners according to their comprehensive strength and survival and according to adaptability, and the establishment of cooperative relations between nodes is the result of mutual selection. The fitness model in a complex network is improved and supplemented on the basis of a BA scale-free network model, and the concept of “fitness” is introduced; that is, the survivability of nodes is also taken into account in the priority connection mechanism. In the fitness network model, the priority connection mechanisms between new nodes and existing nodes in the network are not only related to the degree of nodes, but are also related to the fitness of nodes, which is determined by the product of degree and fitness. However, in the fitness model, all nodes are regarded as similar nodes without distinction, which is inconsistent with the actual cross-border e-commerce supply chain network. In the actual cross-border e-commerce supply chain network, different selection ranges need to be established according to the different types of brand parties, purchasers, cross-border e-commerce platforms and logistics service providers, which is consistent with the concept of the local world [38]. The local world of a node is determined according to its position in the supply chain. The local world of a node refers to the node that can establish a trading relationship with it. For example, purchasers can establish a trading relationship with brand owners and cross-border e-commerce platforms but cannot establish a trading relationship with similar purchasers. In addition, the local world selected by the new node in the local world evolution model is randomly selected, which obviously does not conform to the actual characteristics of a cross-border B2C e-commerce supply chain network.
In the fitness model proposed by Bianconi [39], the fitness of nodes is subject to a certain distribution, but there is no unified conclusion on which distribution should be subjected. It needs to be determined according to the actual characteristics of nodes and the specific connotation of fitness in the network. According to the study of Servedio et al. [40], no matter what distribution of fitness is adopted, as long as the network is generated according to the fitness model, it will have the characteristics of a scale-free network.
The supply chain network is a fitness network model based on dual LANs. The model divides a dual LANs according to the class of nodes and then selects the dual LANs that can be connected according to the characteristics of the nodes. In addition, the number of edges of new nodes in the model is determined by node category and fitness and is combined with the characteristics of cross-border B2C e-commerce supply chain modeling. The description is supplemented as follows.
Interventionary studies involving animals or humans, and other studies that require ethical approval, must list the authority that provided approval and the corresponding ethical approval code.
- Construction of a supply chain network. The nodes in the cross-border B2C e-commerce supply chain network are divided into four types: brand side, purchaser, cross-border e-commerce platform and logistics service provider, and a four-level supply chain network composed of “brand side, purchaser, cross-border e-commerce platform and logistics service provider” is constructed.
- Local world selection. First, the new node’s LANs are determined according to the type of new node, that is, all related nodes (including five nodes) that the new node can link to. Then, nodes are randomly selected from the new node’s LANs as ;
- Determination of connection mechanism. The connection mechanism of new nodes is determined according to their fitness, the scope of one local world is determined according to node type, and the connection probability of existing nodes in the two local worlds is determined according to degree and fitness.
- Selection of fitness. In this paper, the fitness of nodes is the attribute of the internal competitiveness of the nodes, which reflects the attractiveness of a node to form supply chain cooperation with other nodes. It is a comprehensive index composed of many factors such as node scale, product quality, price, product type, reputation, business ability and so on.
2.3. Connection Mechanism
When a new node is added to the network, it first needs to determine the type of node and local world and then randomly select nodes from as the duel local world , and connect to nodes among them.
The probability of a node in the dual local world connected to a new node is determined by the degree and fitness of the node, as shown in Formula (4):
where is the fitness of the node ; is the degree of the node . The above formula shows that the connection probability of a node to a new node in the local world depends on the proportion of the product of degree and fitness of this node to the product of degree and fitness of all nodes in the local world.
2.4. Connection Mechanism
- Initial network. At the beginning , the network begins as a small network of nodes . These nodes include brand parties, purchasers, cross-border e-commerce platforms and logistics service providers. The network is randomly connected into edges according to the upstream and downstream adjacent levels of the supply chain. The fitness of all types of nodes is selected according to the power-law distribution, assuming that the proportion of nodes in the network is .
- Network growth. Every time t increases by one node, the category of the new node is randomly generated according to the proportion of all types of nodes in the network. First, the category of new nodes is judged, and fitness values are assigned to them according to fitness distribution . The edge number of the new node is determined by the node type. The primary and secondary LANs are selected corresponding to the new node according to the above rules, and nodes are connected in the secondary LANs according to the above formula.
This step is repeated until the set time t, and the network with nodes is finally obtained. By controlling the total number of nodes in the network, networks of different sizes can be generated according to the above algorithm. The growth process of the network is shown in Figure 1.
2.5. Simulation Analysis
In this paper, the risk dynamics model is used to establish a simulation analysis of the fitness network model of the dual local world, in order to verify that the fitness network model of the dual local world is consistent with the actual situation and to lay a foundation for the risk propagation model below. Refer to relevant literature [18] to set various parameter values of the model as follows:
- Initial network. Set the number of various nodes in the initial network as 4 for brand parties , 3 for purchasers , 2 for cross-border e-commerce platforms and 1 for logistics service providers . Set initial connection according to the full connection between the adjacent layers of “brand party—purchaser—cross-border e-commerce platform—logistics service provider”. The number of nodes and the number of connected edges in the initial network can be calculated.
- Network growth. Set the generation ratio of various nodes on the network to . The power index of non-uniform network is small, and the power index of some large-scale complex networks is generally between 2–3. For example, the power index of the Internet is between 2.2 and 2.48, and the power index of a metabolic network is about 2.2. Due to the limited scale of the model in this paper, the power index of the above large-scale network is adjusted, and finally the fitness distribution parameters of all nodes are set as , , , . See Section 2.3 and Section 2.4 for details on the local world of the new node and the connection mechanism.
MATLAB is used for model simulation, and the relationship between network scale and network averageness is shown in Figure 2. The relationship between the average degree of various nodes and the network size is shown in Table 3.
The power index of network degree distribution varies with network size as shown in Figure 3. By observing the simulation results, it can be seen that the degree distribution power index of the BA network increases with the increase in network size, but it is still smaller than the BA network.
The average path length of a cross-border e-commerce supply chain network varies with network size as shown in Figure 4. Both the average path length of the cross-border e-commerce supply chain network and the average path length of the supply chain increase with the increase in network size, which is consistent with the average path length of a BA scale-free network of the same size. With the growth of the nodes, compared with the BA network, the average path length of the dual LANs fitness network is reduced, but the effect is still not obvious; that is, nodes with high fitness account for a smaller proportion of the total nodes, and there are still a few enterprises that can connect across hierarchies.
3. Risk Transmission Analysis of Supply Chain Network Based on SIRS Model
The dynamic research of network risk communication is an important aspect of risk communication research. There are all kinds of risks in the supply chain network. Nodal enterprises not only have to deal with their own risks due to management problems, they also resist the risks caused by the spread of other enterprises’ risks through the network. Research on the modes and characteristics of risk transmission on the network are helpful for enterprises to reasonably avoid risks and unnecessary losses. The analytic hierarchy process (AHP) is a kind of hierarchical weight analysis method proposed by American operational research scientist Saaty when he studied the problems related to power distribution. The method is decomposed into multiple hierarchical structures according to the order of general objective, sub-objective of each level, evaluation criterion and backup scheme. It calculates the eigenvector of judgment matrix to obtain the weight value of each layer relative to the upper layer and the weighted recursive merging of the final weight, and the final weight determines the optimal scheme. On the basis of the SIRS model, this paper uses the analytic hierarchy process (AHP) to explore the factors that have the greatest influence on supply chain risk immunity and external risk intensity. The model assumes that each factor is independent and undisturbed from each other.
The basic steps of AHP are as follows:
The first step is to establish a hierarchy.
The problem can be divided into target layer, criterion layer and scheme layer according to needs. The number of layers is related to the complexity of the problem. Generally, there are no more than nine sub-factors under a single factor; otherwise, the subsequent comparison will be more difficult.
The second step is to determine the scale and construct the judgment matrix.
In order to distinguish the importance of different indicators in different levels, a scale is introduced. Scale is an important measure regarding the relative importance of two indicators, and the 1–9 scale method is commonly used. Too many scales will affect the decision makers’ judgment and reduce decision-making efficiency, while too few scales are not conducive to distinguishing the relative importance of each indicator, as shown in Table 4.
The third step is to calculate the eigenvectors and weights.
The calculation of index weight can usually use the sum product method or the root method. The root method used in this paper needs to normalize the weight value after calculation.
The fourth step is the consistency test.
Subjective judgment may cause contradictions in the results of the matrix, the consistency test can precisely detect such contradictions, and the matrix can be modified according to the detection results. Consistency index CI is used to measure the degree of deviation from the complete consistency of the judgment matrix, and the greater the value, the greater the deviation degree. The calculation formula is shown in Formula (5):
CI is the consistency index, CR is the relative consistency index, and RI is the average random consistency index.
The random consistency of different orders is shown in Table 5.
3.1. Risk Communication Model Construction
In the SIRS risk transmission model, the population has three states of susceptibility, infection and immunity [40]; the state of the enterprise is risk susceptibility, risk infection and risk immunity. However, in the actual supply chain network, besides these three states, the enterprise may withdraw from the network because it cannot resist risks [21]. Therefore, the SIRS model is improved, and the elimination coefficient is introduced. The improved propagation mechanism of the model is shown in Figure 5.
The definitions of relevant variables and parameters in the model are shown in Table 6.
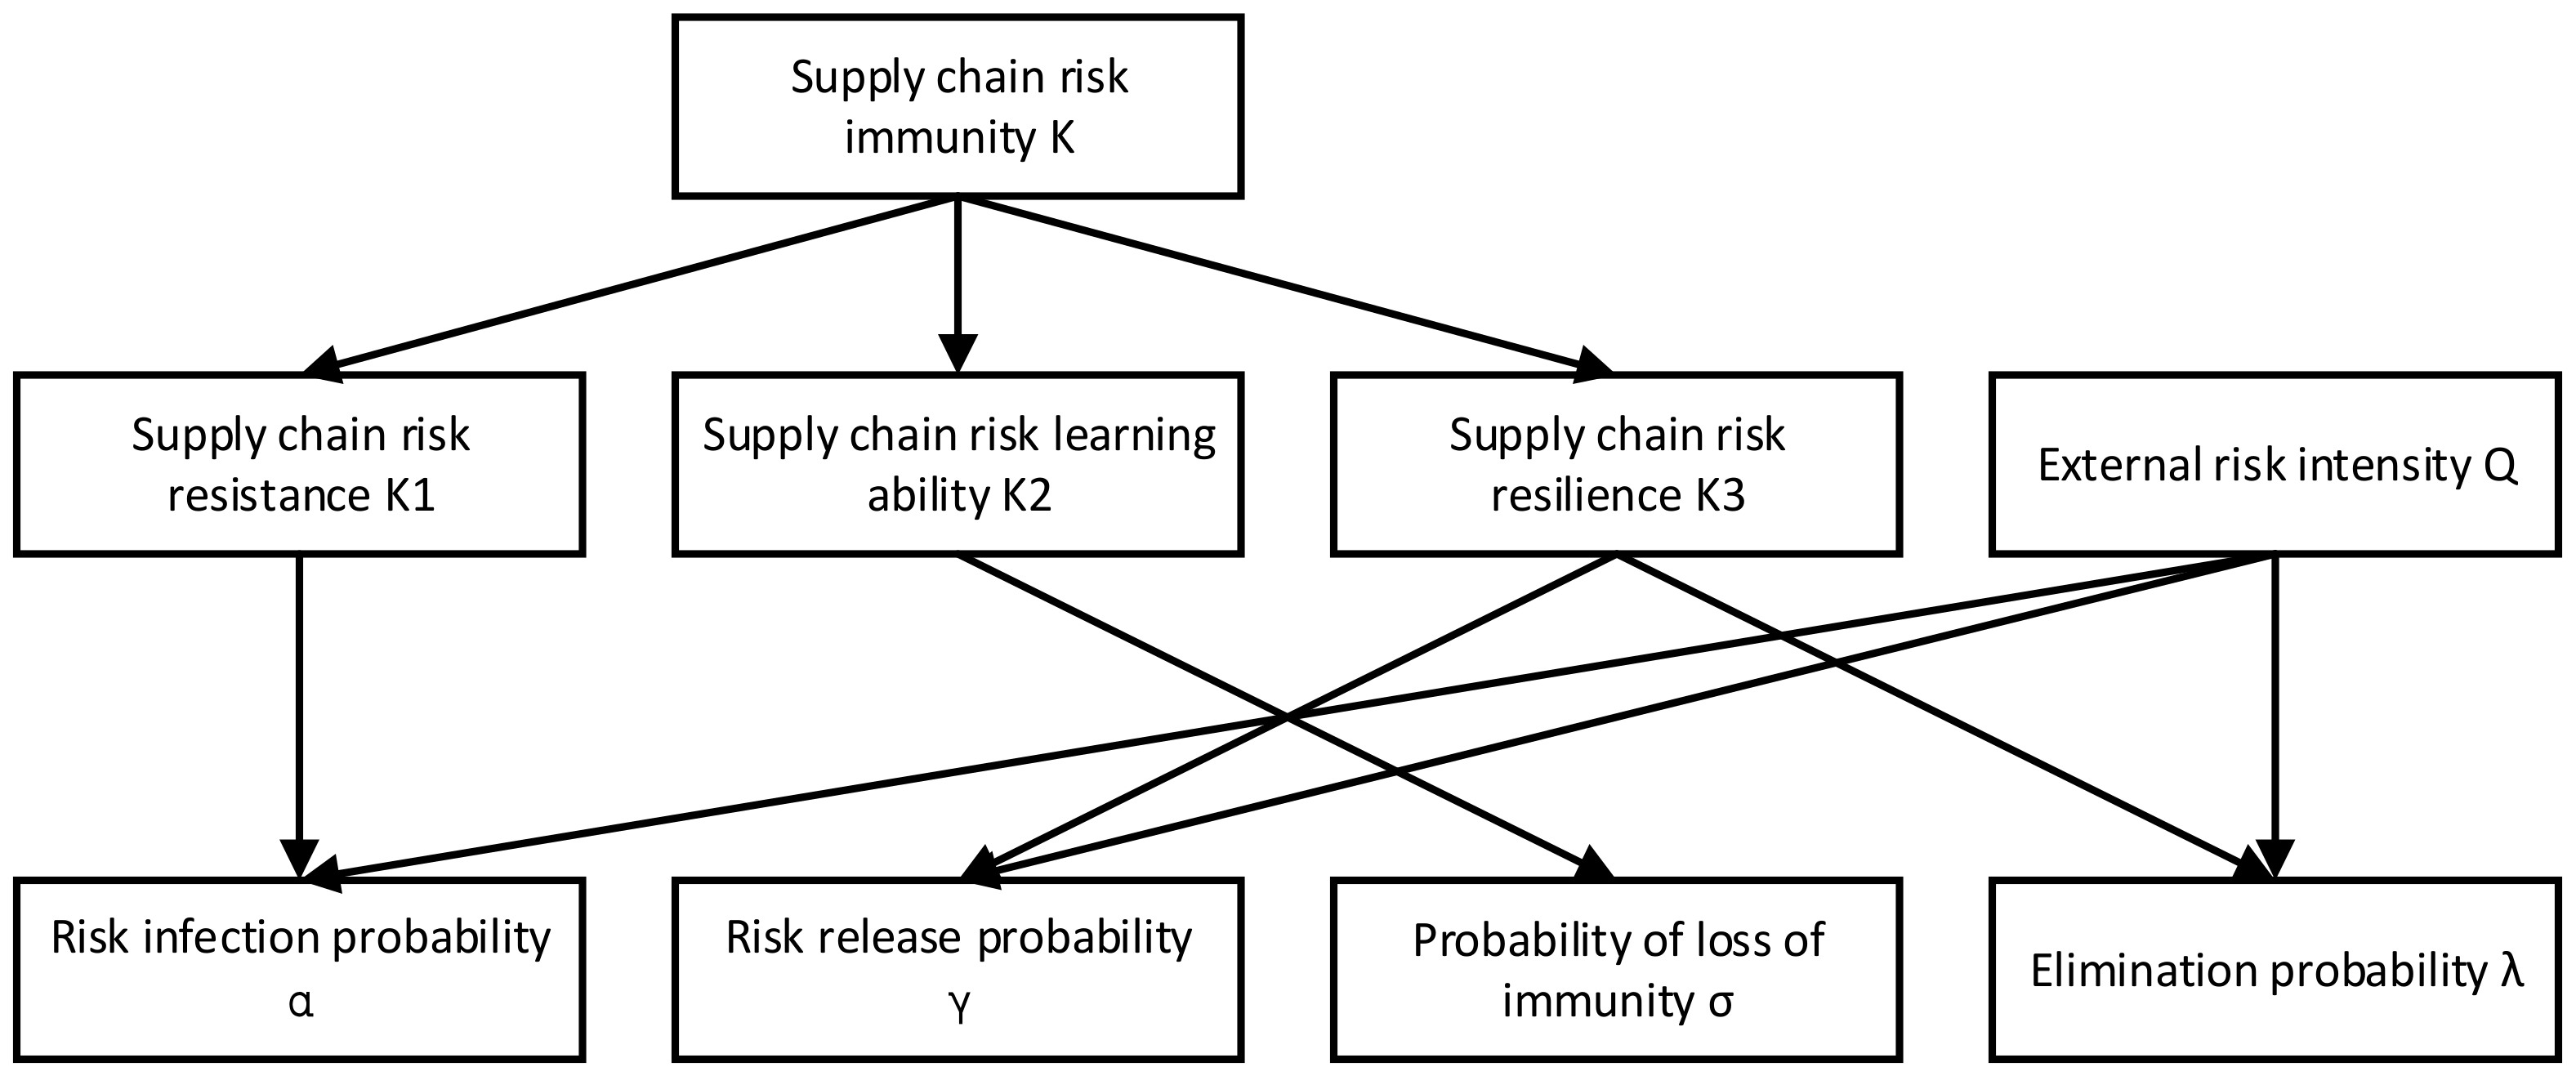
3.2. Influencing Factors of Model Parameters
The risk tolerance of the supply chain itself and the external risk intensity jointly determine the risk transmission and enterprise damage among the cross-border B2C e-commerce supply chains. According to the relevant literature, the risk immunity of supply chain is divided into three parts: resistance ability, learning ability and recovery ability. The influence of each factor on parameters is shown in Figure 6.
3.2.1. Establishment of Evaluation Indicators
By referring to the relevant literature [16,17,18,19,20,21,22,23,24,25,26,27,28,29] and consulting experts and scholars in supply chain and cross-border e-commerce, this paper sets three s-level indicators and 13 third-level indicators for enterprise supply chain risk immunity, as shown in Table 7, and three s-level indicators and 10 third-level indicators for the intensity of external risks, as shown in Table 8.
3.2.2. Determination of Index Weight
- Supply chain risk immunity
First, the comparison matrix of secondary indicators of supply chain risk immunity is listed, as shown in Table 9. Then, the weight of each secondary indicator is determined by AHP, as shown in Table 10. Finally, the consistency test is conducted, as shown in Table 11.
The judgment matrix and weight of the three-level indicators of risk resistance are shown in Table 12.
Table 13 shows the judgment matrix and weight of the three-level indicators of risk recovery capability.
The judgment matrix and weight of the third-level indicators of risk learning ability are shown in Table 14.
The overall index weight of supply chain risk immunity is shown in Table 15.
- 2.
- External risk intensity
First, the comparison matrix of secondary indicators of external risk intensity is listed, as shown in Table 16. Then, AHP is used to determine the weight of each secondary indicator, as shown in Table 17. Finally, the consistency test is conducted, as shown in Table 18.
The judgment matrix and weight of the three-level environmental indicators are shown in Table 19.
The judgment matrix and weight of three-level trading indicators are shown in Table 20.
The judgment matrix and weight of logistics three-level indicators are shown in Table 21.
The overall index weight of external risk degree is shown in Table 22.
3.3. Model Parameter Calculation
The premise of the enterprise infection risk is that the cooperation with the enterprise with the infection risk fails to successfully resist the risk, and Formula (6) shows the risk infection probability as follows:
The probability of risk removal and elimination are both related to risk recovery ability and external risk intensity. If the risk recovery ability is strong, the risk can be removed and enter the immune state; if the risk recovery ability is weak, the risk removal probability and elimination probability are shown in Formulas (7) and (8):
After the risk is removed, the enterprise will summarize the learning experience from the risk and obtain risk immunity for a certain period of time. If the enterprise fails to continuously monitor the risk and relax its vigilance, it may enter the susceptible state again, and Formula (9) is the probability for the enterprise to lose immunity, as follows:
4. Risk Control Strategy
In view of the above results, the following risk prevention and control strategies can be proposed for enterprises related to the cross-border B2C e-commerce supply chain.
From the perspective of the enterprise’s own risk immunity, the first is to ensure the stability of the company’s funds, and the second is to establish a sound risk detection and response mechanism. When choosing a partner, an enterprise should avoid relying too much on a specific enterprise and reserve alternative enterprises to prevent the enterprise from having risks, such as the company being unable to initiate emergency plans in time, thus causing huge losses. At the same time, the company should set aside a contingency fund in case the capital chain is hit hard and cannot function properly if a sudden risk occurs. In addition, a sound risk detection and response mechanism is also an important factor to prevent risk spread and to reduce corporate losses. Enterprises should train their employees in risk identification and response and respond to risks immediately once they are discovered to prevent their further spread. After the risk is removed, there should be continued follow up, summarizing and reviewing the cause, processing and results of the risk, as well as the advantages and disadvantages of the response plan, so as to ensure that the enterprise can obtain continuous immunity to such risks.
From the perspective of the external factors of enterprises, risks arising from transaction security and logistics problems have a more direct impact on enterprises. Due to the characteristics of cross-border B2C e-commerce, payment risk and credit risk are greater in the transaction process, which requires enterprises to be more cautious in the transaction process, and enterprises should have a clear record and assessment of the credit status of cooperative enterprises. In the process of logistics distribution, due to being cross-border and far away, there is a certain gap in the regional logistics facilities, which are unable to achieve unified management and scheduling; thus, distribution timeout and cargo damage may exist. In the process of transport logistics, service enterprises should strengthen the monitoring and management of goods and control the location and status information and feedback to the customer in real time, so as not to affect customer shopping experience due to information asymmetry. Different from domestic trade, cross-border e-commerce needs to go through customs. Customs in different regions have different efficiency and relevant requirements and regulations. Logistics service providers should familiarize themselves with relevant information in advance and make arrangements to avoid affecting the overall operation efficiency of the supply chain due to low customs clearance efficiency.
5. Conclusions
Based on the B2C cross-border, the electricity industry boom also faces the potential risk of problems. At the same time, the complex network theory, combined with the local world model fitness model, is constructed to simulate the actual situation of a double local fitness network model of the world, and a risk dynamics simulation of the model is used to validate laminating actualities. Combined with the risk transmission model of the SIRS virus, this paper explores the risk transmission mechanism in the supply chain network of B2C cross-border e-commerce. Finally, suggestions are put forward from the aspects of enterprise immunity and enterprise external risk intensity to help enterprises avoid potential risk factors in the supply chain as much as possible. The main innovations of this paper are as follows:
- (1)
- This paper constructed a fitness network model based on a dual local world.
- (2)
- Based on the SIRS model, this paper introduced the elimination rate, which is used to describe the situation that some participants in the supply chain network withdraw from the network because they cannot resist risks, such that the model as a whole is more consistent with the actual situation.
The management views of this paper are as follows:
- (1)
- When choosing partners, enterprises should not rely too much on any one enterprise and should try their best to set aside alternative enterprises.
- (2)
- Establish a sound risk monitoring and response mechanism.
- (3)
- Train employees on risk identification and response.
- (4)
- Summarize and review in time after encountering risks.
- (5)
- Be cautious when transactions occur, and make clear records and assessments of the credit status of the venture.
- (6)
- Enhance the informatization degree of enterprises and improve the operation efficiency of unified management and scheduling.
Although some achievements have been made in this paper, there are still some limitations, mainly as follows:
- (1)
- The fitness in the fitness network model based on the dual local world is static; that is, it does not change with time, which is inconsistent with the actual network.
- (2)
- In the process of constructing the supply chain network model, only the growth of the network is considered, but the situation of quitting the network due to temporary lack of cooperation and other reasons is considered.
- (3)
- In order to simplify the model, the undirected and powerless network is constructed without considering the weight of the network, such as the direction of the edge and the volume of transactions.
- (4)
- This paper lacks research on a risk transmission model for actual cases.
In the future, the deficiencies of this paper can be improved from the following aspects:
- (1)
- Future research can refer to the competitive network model to explore the supply chain network model with time-varying fitness, so that the model can be more consistent with the actual situation.
- (2)
- In the process of constructing the supply chain network model, more comprehensive considerations can be taken into account, including withdrawal from the network due to temporary lack of cooperation and other reasons.
- (3)
- In future research, the direction of the model network connection and the weight of trading volume can be further taken into account.
- (4)
- Practical cases of a risk communication model can be explored in the future to verify the effectiveness of this model.
Author Contributions
J.W. contributed to the writing of the first draft of this study, model building, case analysis, and analysis of relevant experimental results. L.Z. contributed to the concept, method design, research work, and experimental analysis. F.L. and Y.X. contributed to the background research of this study and put forward constructive suggestions for revision. J.Z. and J.S. helped to analyze and make important suggestions for the framework of this article and to make some modifications to the original draft. All authors have read and agreed to the published version of the manuscript.
Funding
This research was funded by the National Social Science Fund of China (20BJY185), Beijing Social Science Foundation (18GLA009), Project of 2020 “Shipei plan” of Beijing Wuzi University, Beijing Collaborative Innovation Center for Intelligent Logistics System (BILSCI-2019KF-12), and the Natural Science Foundation of Shaanxi Province (2021JM-146).
Conflicts of Interest
The authors declare no conflict of interest.
References
- Shi, R.; Yang, R. Research on the development of Cross-border e-commerce in China in the context of COVID-19. Bus. Econ. 2021, 7, 92–93, 171. [Google Scholar]
- Wu, D. Research on Procurement and Inventory Management Based on Supply Chain Management. Trade Show Econ. 2021, 15, 58–60. [Google Scholar]
- Lu, S. Empirical Study of the Influencing Factors of Supply Chain Risks. Appl. Mech. Mater. 2010, 34, 1175–1179. [Google Scholar] [CrossRef]
- Beheshtinia, M.A.; Feizollahy, P.; Fathi, M. Supply Chain Optimization Considering Sustainability Aspects. Sustainability 2021, 13, 11873. [Google Scholar] [CrossRef]
- Park, A.; Li, H. The Effect of Blockchain Technology on Supply Chain Sustainability Performances. Sustainability 2021, 13, 1726. [Google Scholar] [CrossRef]
- Lin, Q.; Zhao, Q.; Lev, B. Influenza vaccine supply chain coordination under uncertain supply and demand. Eur. J. Oper. Res. 2021, 297, 930–948. [Google Scholar] [CrossRef]
- Liu, Z.; Li, K.W.; Tang, J.; Gong, B.G.; Huang, J. Optimal operations of a closed-loop supply chain under a dual regulation. Int. J. Prod. Econ. 2021, 233, 107991. [Google Scholar] [CrossRef]
- He, P.; He, Y.; Xu, H. Channel structure and pricing in a dual-channel closed-loop supply chain with government subsidy. Int. J. Prod. Econ. 2019, 213, 108–123. [Google Scholar] [CrossRef]
- Yadav, D.; Kumari, R.; Kumar, N.; Sarkar, B. Reduction of waste and carbon emission through the selection of items with cross-price elasticity of demand to form a sustainable supply chain with preservation technology. J. Clean. Prod. 2021, 297, 126298. [Google Scholar] [CrossRef]
- Ullah, M.; Asghar, I.; Zahid, M.; Omair, M.; Sarkar, B. Ramification of remanufacturing in a sustainable three-echelon closed-loop supply chain management for returnable products. J. Clean. Prod. 2021, 290, 125609. [Google Scholar] [CrossRef]
- Sepehri, A.; Mishra, U.; Tseng, M.L.; Sarkar, B. Joint Pricing and Inventory Model for Deteriorating Items with Maximum Lifetime and Controllable Carbon Emissions under Permissible Delay in Payments. Mathematics 2021, 9, 470. [Google Scholar] [CrossRef]
- Liu, A.; Zhu, Q.; Xu, L.; Lu, Q.; Fan, Y. Sustainable supply chain management for perishable products in emerging markets: An integrated location-inventory-routing model. Transp. Res. Part E Logist. Transp. Rev. 2021, 150, 102319. [Google Scholar] [CrossRef]
- Zhang, X.; Yousaf, H.M.A.U. Green supply chain coordination considering government intervention, green investment, and customer green preferences in the petroleum industry. J. Clean. Prod. 2020, 246, 118984. [Google Scholar] [CrossRef]
- Liu, A.; Xiao, Y.; Lu, H.; Tsai, S.B.; Song, W. A fuzzy three-stage multi-attribute decision-making approach based on customer needs for sustainable supplier selection. J. Clean. Prod. 2019, 239, 118043. [Google Scholar] [CrossRef]
- Li, Y.; Zobel, C.W. Exploring supply chain network resilience in the presence of the ripple effect. Int. J. Prod. Econ. 2020, 228, 107693. [Google Scholar] [CrossRef]
- Meng, S.; Dong, W.; Hu, H.; Li, Y. Analysis of supply chain’s resilience in crowd networks. Int. J. Crowd Sci. 2021, 5, 166–184. [Google Scholar] [CrossRef]
- Li, Y.; Zobel, C.W.; Seref, O.; Chatfield, D. Network characteristics and supply chain resilience under conditions of risk propagation. Int. J. Prod. Econ. 2020, 223, 107529. [Google Scholar] [CrossRef]
- Pankaj, D.; Pravin, S.; Pallav, G.; Arnab, D. Managing risk for e-commerce supply chains: An empirical study. IFAC PapersOnLine 2019, 52, 13. [Google Scholar]
- Tie, R.X.; Yang, N.D.; Zhang, Y.L.; Hou, W.J. Risk propagation model construction and simulation of R&D network technology. J. Manag. Eng. 2018, 32, 188–194. [Google Scholar]
- Zhang, Y.L.; Yang, N.D. Control method model and simulation for R&D network risk propagation. J. Syst. Manag. 2018, 27, 500–511. [Google Scholar]
- Syed, M.A.; Abdul, M.; Golam, K.; Jewel, C.; Jalal, U.R.; Tawhidul, I. Framework for evaluating risks in food supply chain: Implications in food wastage reduction. J. Clean. Prod. 2019, 228, 786–800. [Google Scholar]
- Wang, J.Z.; Chen, H.Z. Risk Propagation Model of Complex Product Supply Chain Based on Complex Network. Stat. Decis. 2021, 37, 176–180. [Google Scholar]
- Chhimwal, M.; Agrawal, S.; Kumar, G. Measuring Circular Supply Chain Risk: A Bayesian Network Methodology. Sustainability 2021, 13, 8448. [Google Scholar] [CrossRef]
- Gouda, S.K.; Saranga, H. Sustainable supply chains for supply chain sustainability: Impact of sustainability efforts on supply chain risk. Int. J. Prod. Res. 2018, 56, 5820–5835. [Google Scholar] [CrossRef]
- Lei, Z.; Lim, M.K.; Cui, L.; Wang, Y. Modelling of risk transmission and control strategy in the transnational supply chain. Int. J. Prod. Res. 2019, 59, 148–167. [Google Scholar] [CrossRef]
- Zheng, C. Complex network propagation effect based on SIRS model and research on the necessity of smart city credit system construction. Alex. Eng. J. 2021, 61, 403–418. [Google Scholar] [CrossRef]
- Du, Z.P.; Ou, Y.X. Research Status, Hotspots and Trends of Cross-border Logistics based on CiteSpace. Price Mon. 2021, 4, 77–86. [Google Scholar]
- Allman, A.; Che, L.; Martín, M. Biomass Waste-to-Energy Supply Chain Optimization with Mobile Production Modules. Comput. Chem. Eng. 2021, 150, 107326. [Google Scholar] [CrossRef]
- Gao, X. Research on the performance of cross-border e-commerce B2C import supply chain model. J. Anhui Norm. Univ. (Humanit. Soc. Sci. Ed.) 2019, 47, 134–141. [Google Scholar]
- Bendadou, A.; Kalai, R.; Jemai, Z. Impact of merging activities in a supply chain under the Guaranteed Service Model: Centralized and decentralized cases. Appl. Math. Model. 2021, 93, 509–524. [Google Scholar] [CrossRef]
- Lu, Y.T.; Sun, X.Y. Research on cross-border e-commerce risk analysis and management model based on SD. Bus. Res. 2017, 12, 162–167. [Google Scholar]
- Fakhrzad, M.B.; Firozpour, M.R.; Hosseininasab, H. Comparing Supply Chain Risks Ranking in Multi-Attribute Decision-Making Methods Using the Proposed Three-Dimensional Integration Mean Method. Asia. Pac. J. Oper. Res. 2021, 38, 2150006. [Google Scholar] [CrossRef]
- Zhou, F.; Yan, Y.P.; Su, R.; Qiu, H. Construction and application of imported food quality safety risk assessment model of cross-border e-commerce. Economist 2021, 5, 21–22, 24. [Google Scholar]
- Filho, N.G.; Rego, N.; Claro, J. Supply chain flows and stocks as entry points for cyber-risks. Procedia Comput. Sci. 2021, 181, 261–268. [Google Scholar] [CrossRef]
- Wang, S.J.; Li, R.H. The theory and practice of cross-border e-commerce to promote the “Belt and Road” value chain. Enterp. Econ. 2021, 40, 75–82. [Google Scholar]
- Ivanov, D. Exiting the COVID-19 pandemic: After-shock risks and avoidance of disruption tails in supply chains. Ann. Oper. Res. 2021, 4, 1–18. [Google Scholar] [CrossRef]
- Wang, J.B.; Li, W.T.; Yang, F.Y. Traveling waves in a nonlocal dispersal SIR model with nonlocal delayed transmission. Commun. Nonlinear Sci. Numer. Simul. 2015, 27, 136–152. [Google Scholar] [CrossRef]
- Xiang, L.; Chen, G. A local-world evolving network model. Physica A 2003, 328, 274–286. [Google Scholar]
- Bianconi, G.; Barabási, A. Supramolecular Condensation of Bose Condensation in Complex Networks. Acta Phys. Sin. Chin. Ed. 2001, 86, 5632–5635. [Google Scholar]
- Servedio, V.; Caldarelli, G.; Butta, P. Vertex Intrinsic Fitness: How to Produce Arbitrary Scale-Free Networks. Phys. Rev. 2004, 70, 056126. [Google Scholar] [CrossRef] [Green Version]
Figure 1.
Network growth process.
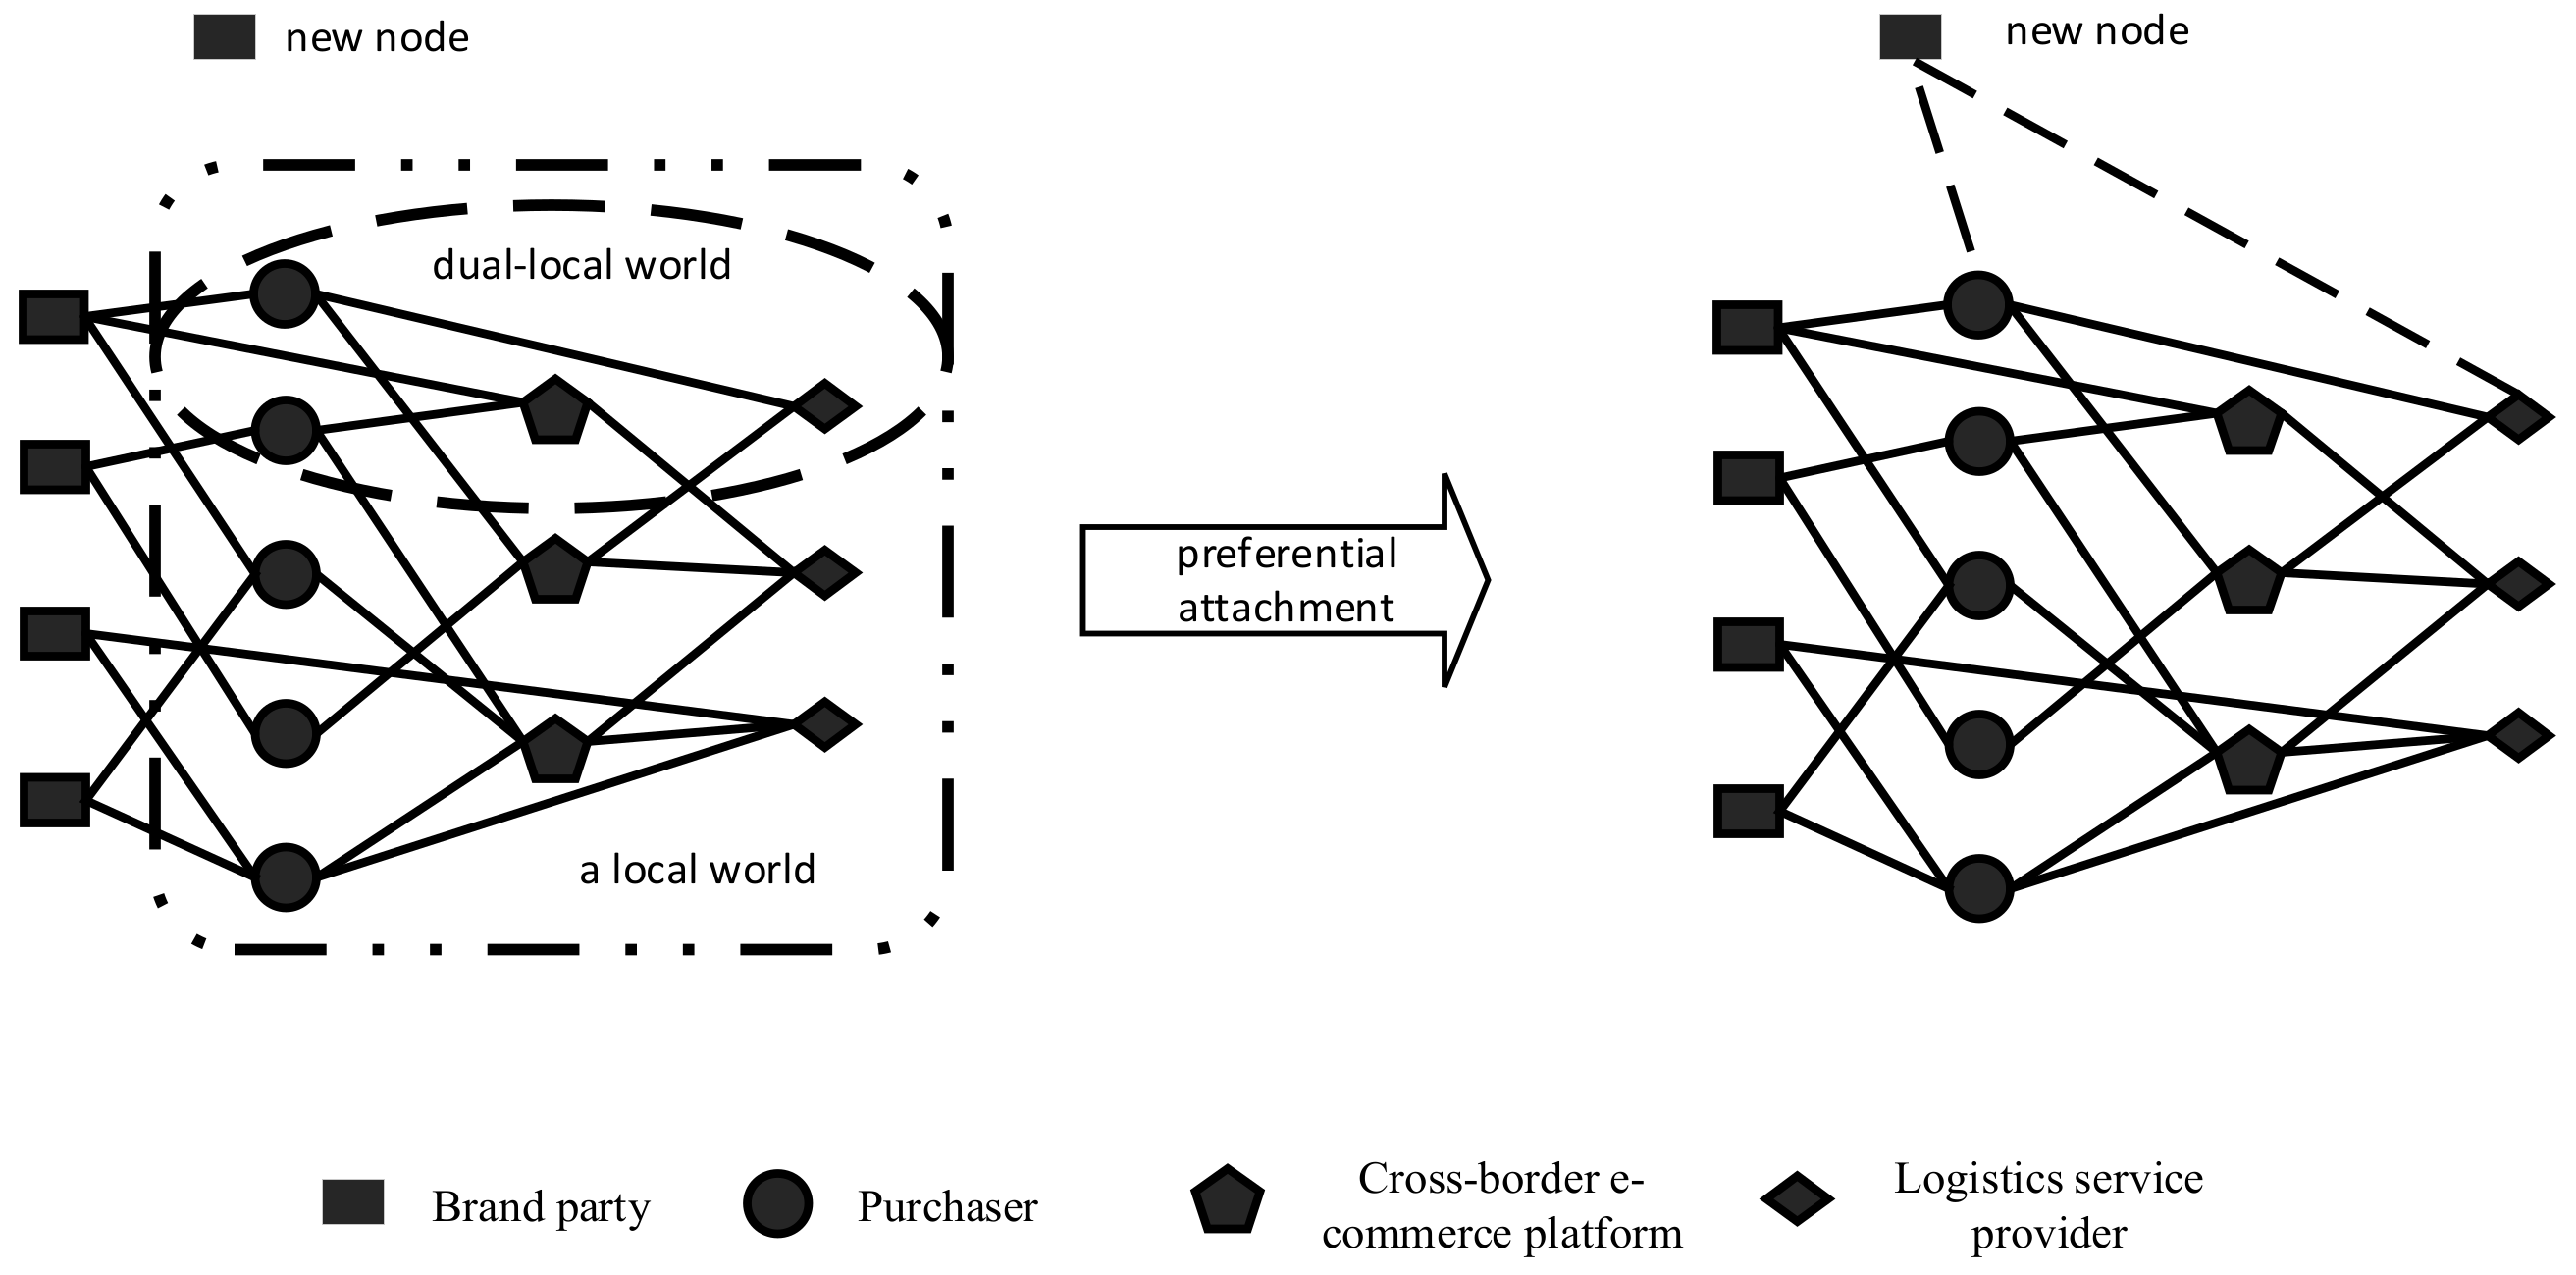
Figure 2.
Variation of network averageness with network size.
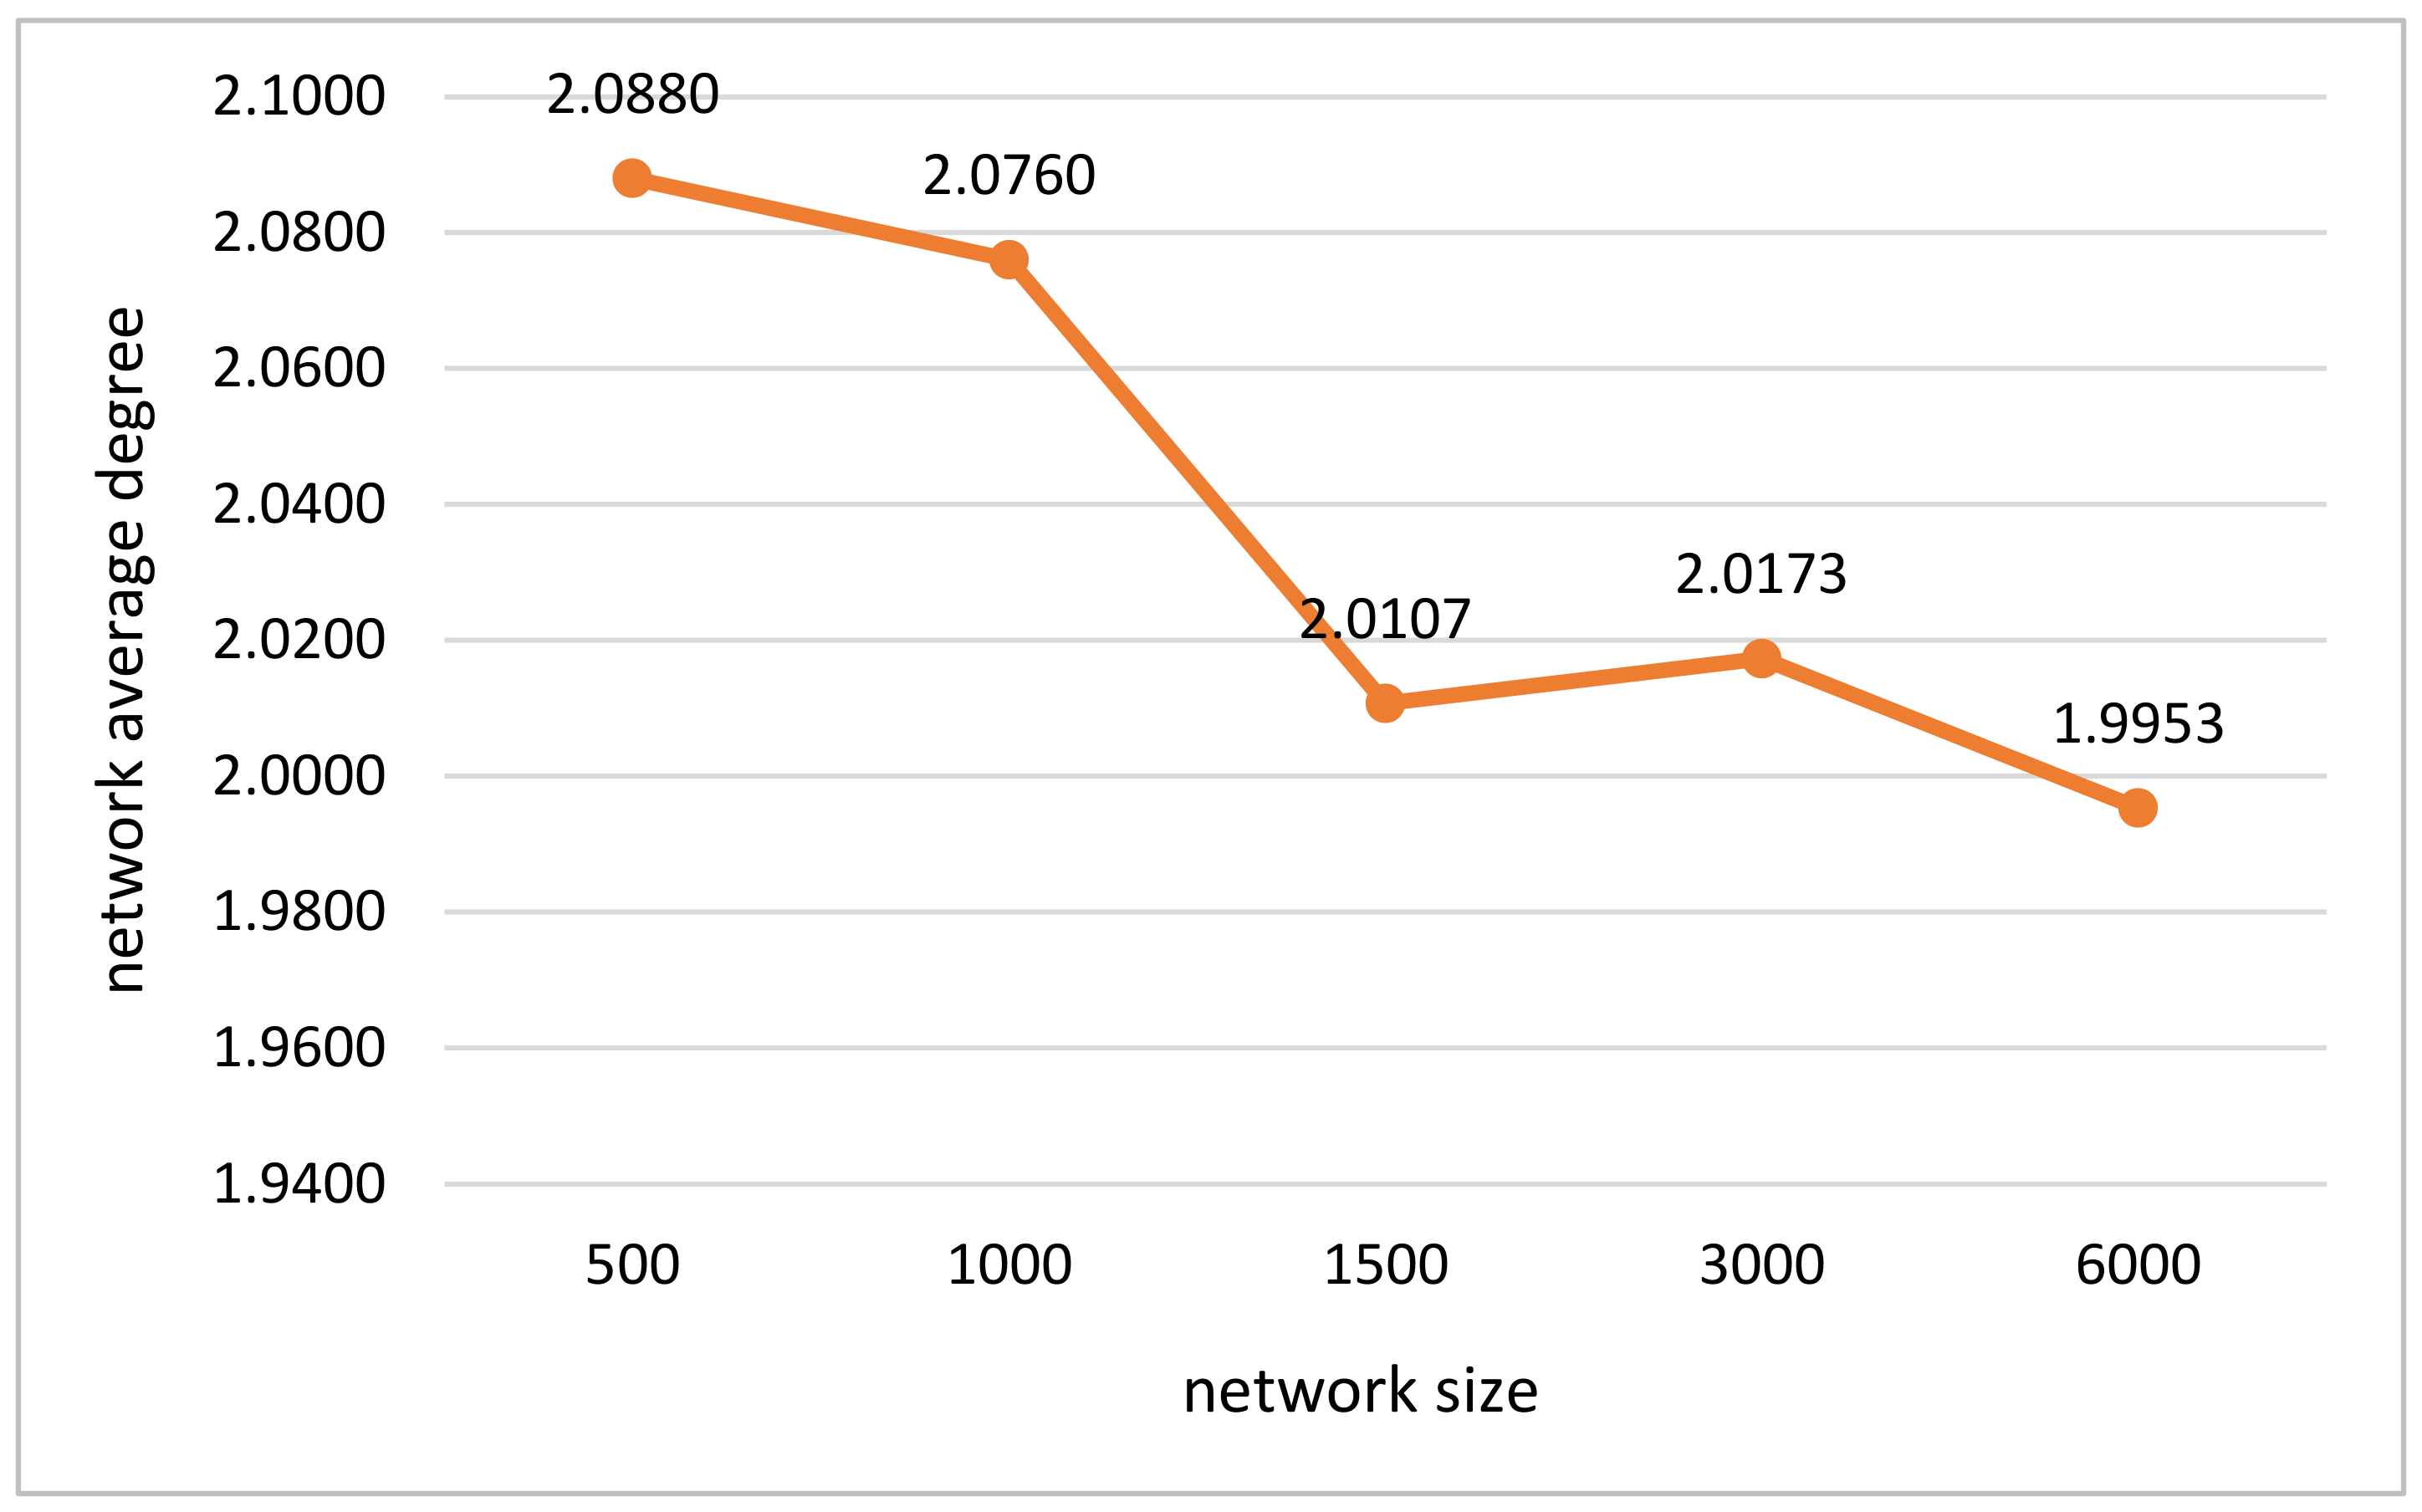
Figure 3.
Power index of degree distribution changes with network size.
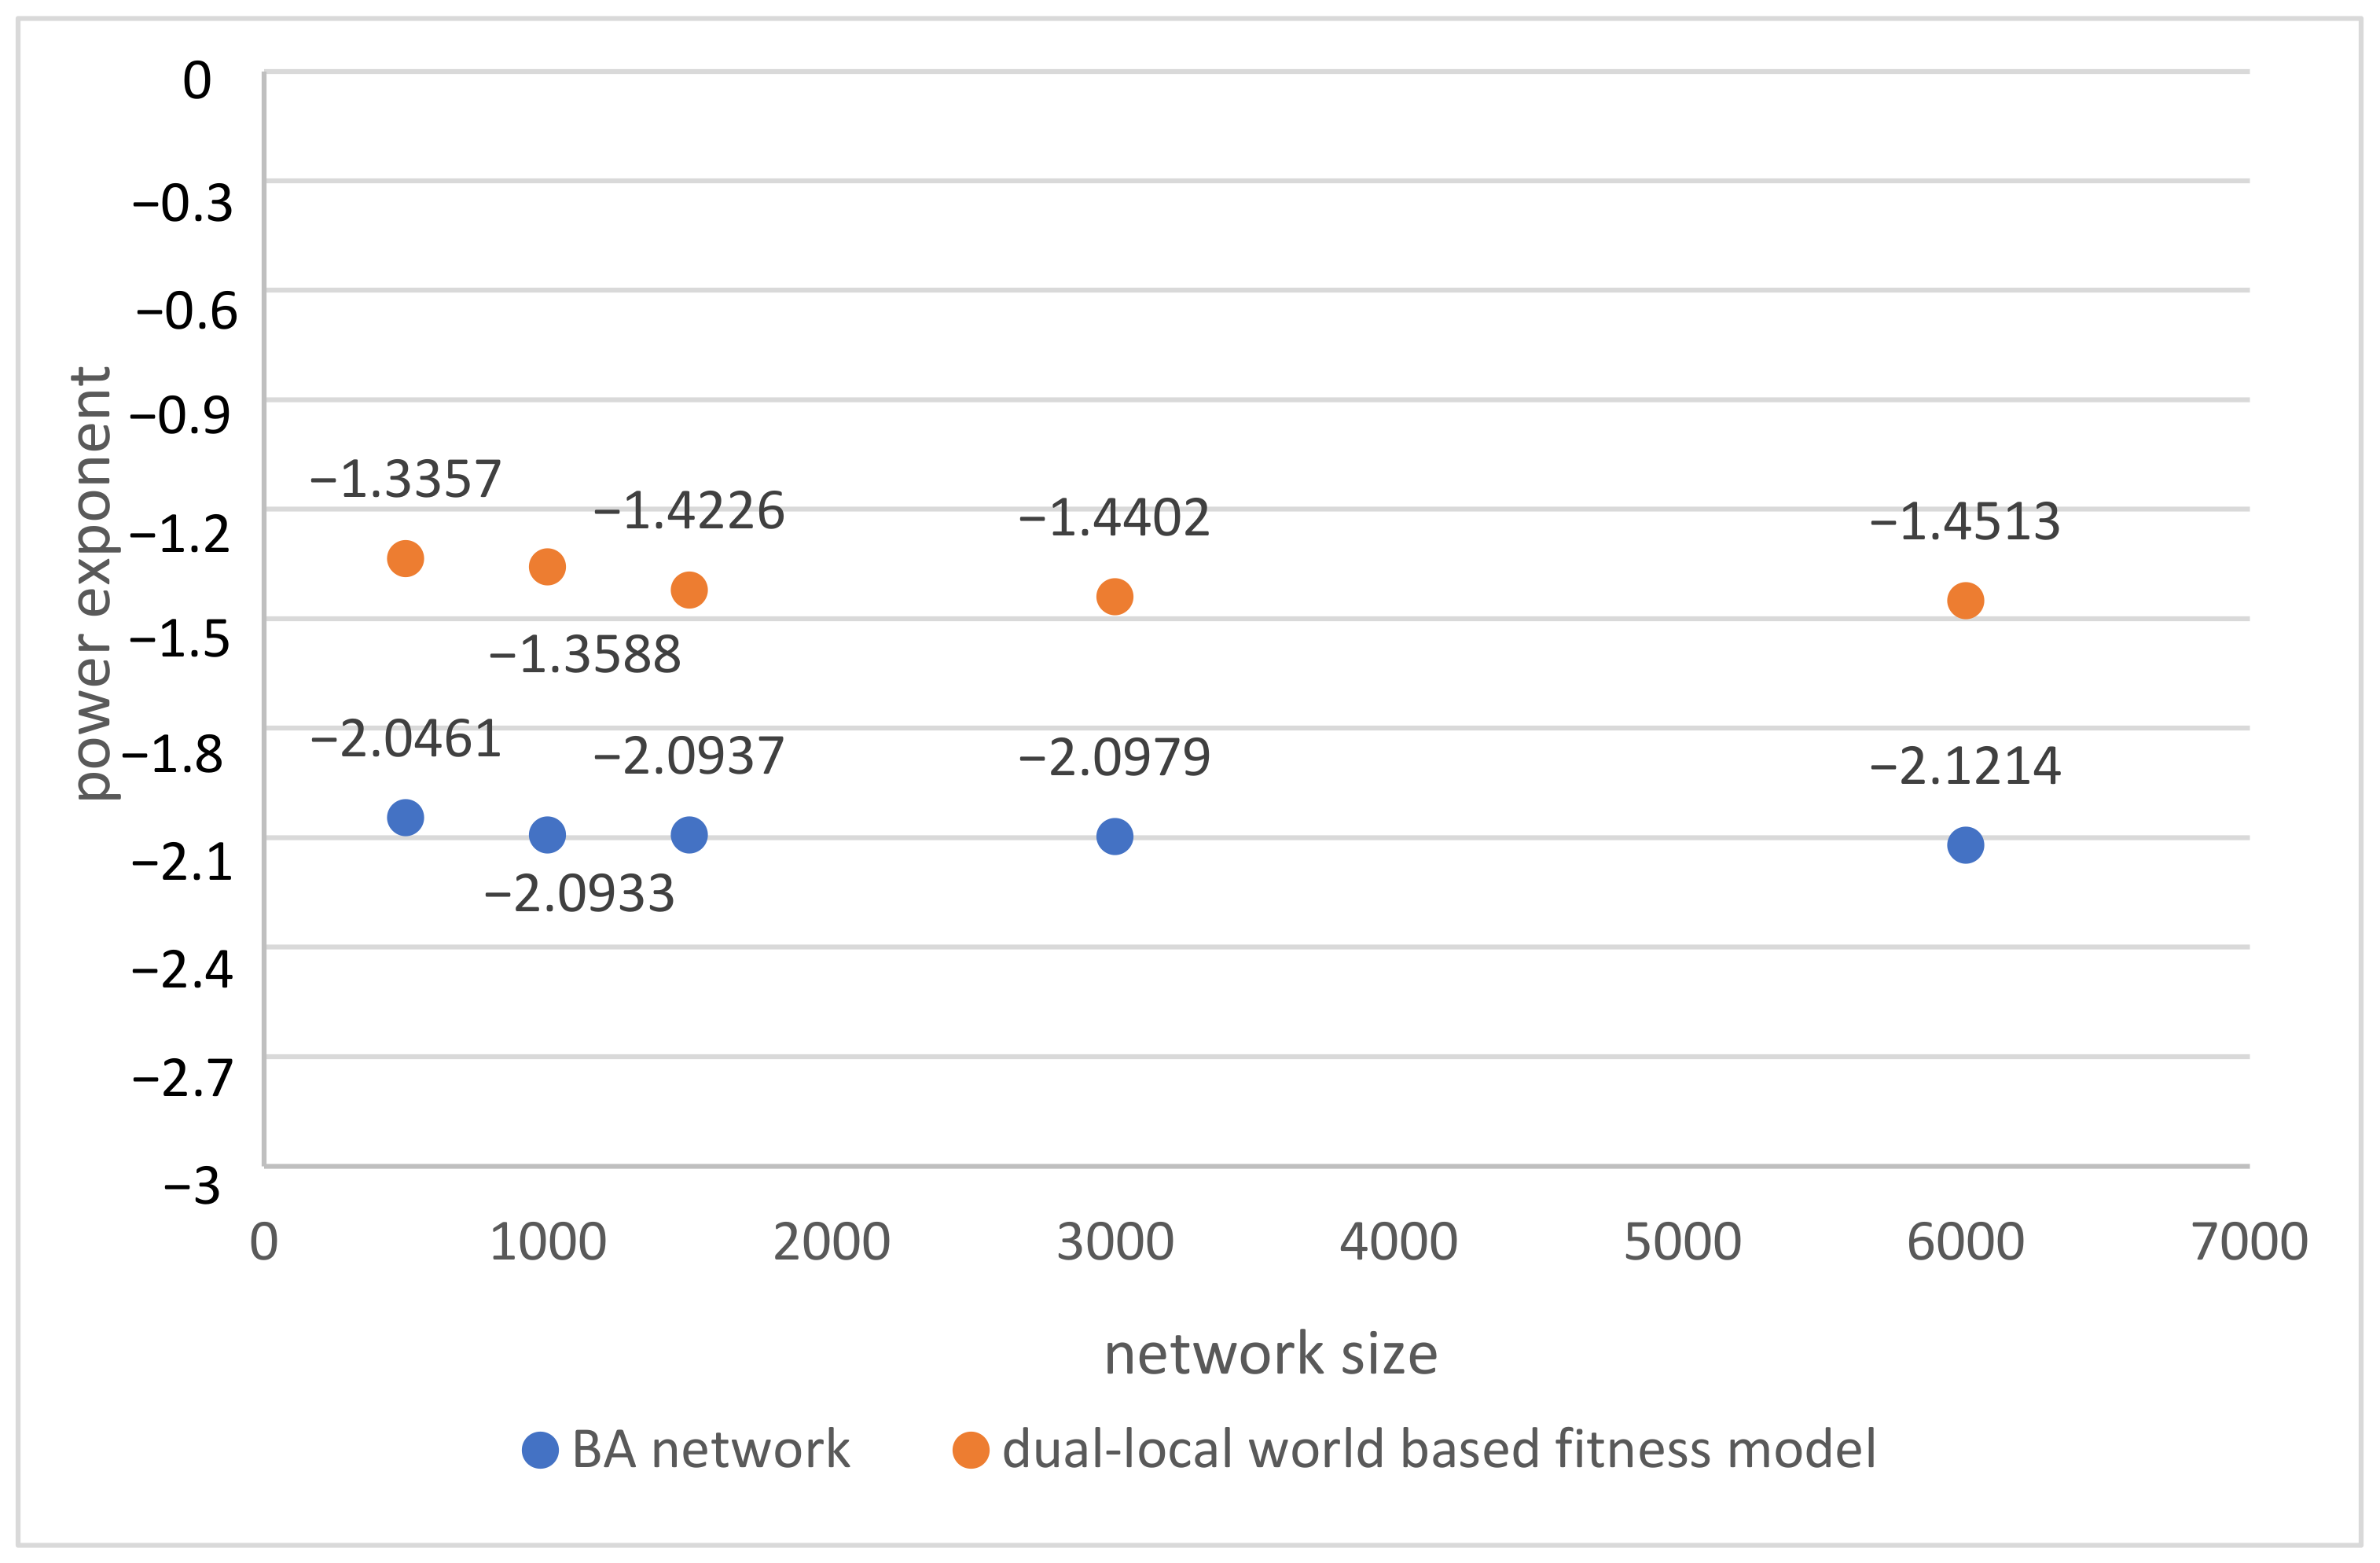
Figure 4.
Variation of average path length with network size.
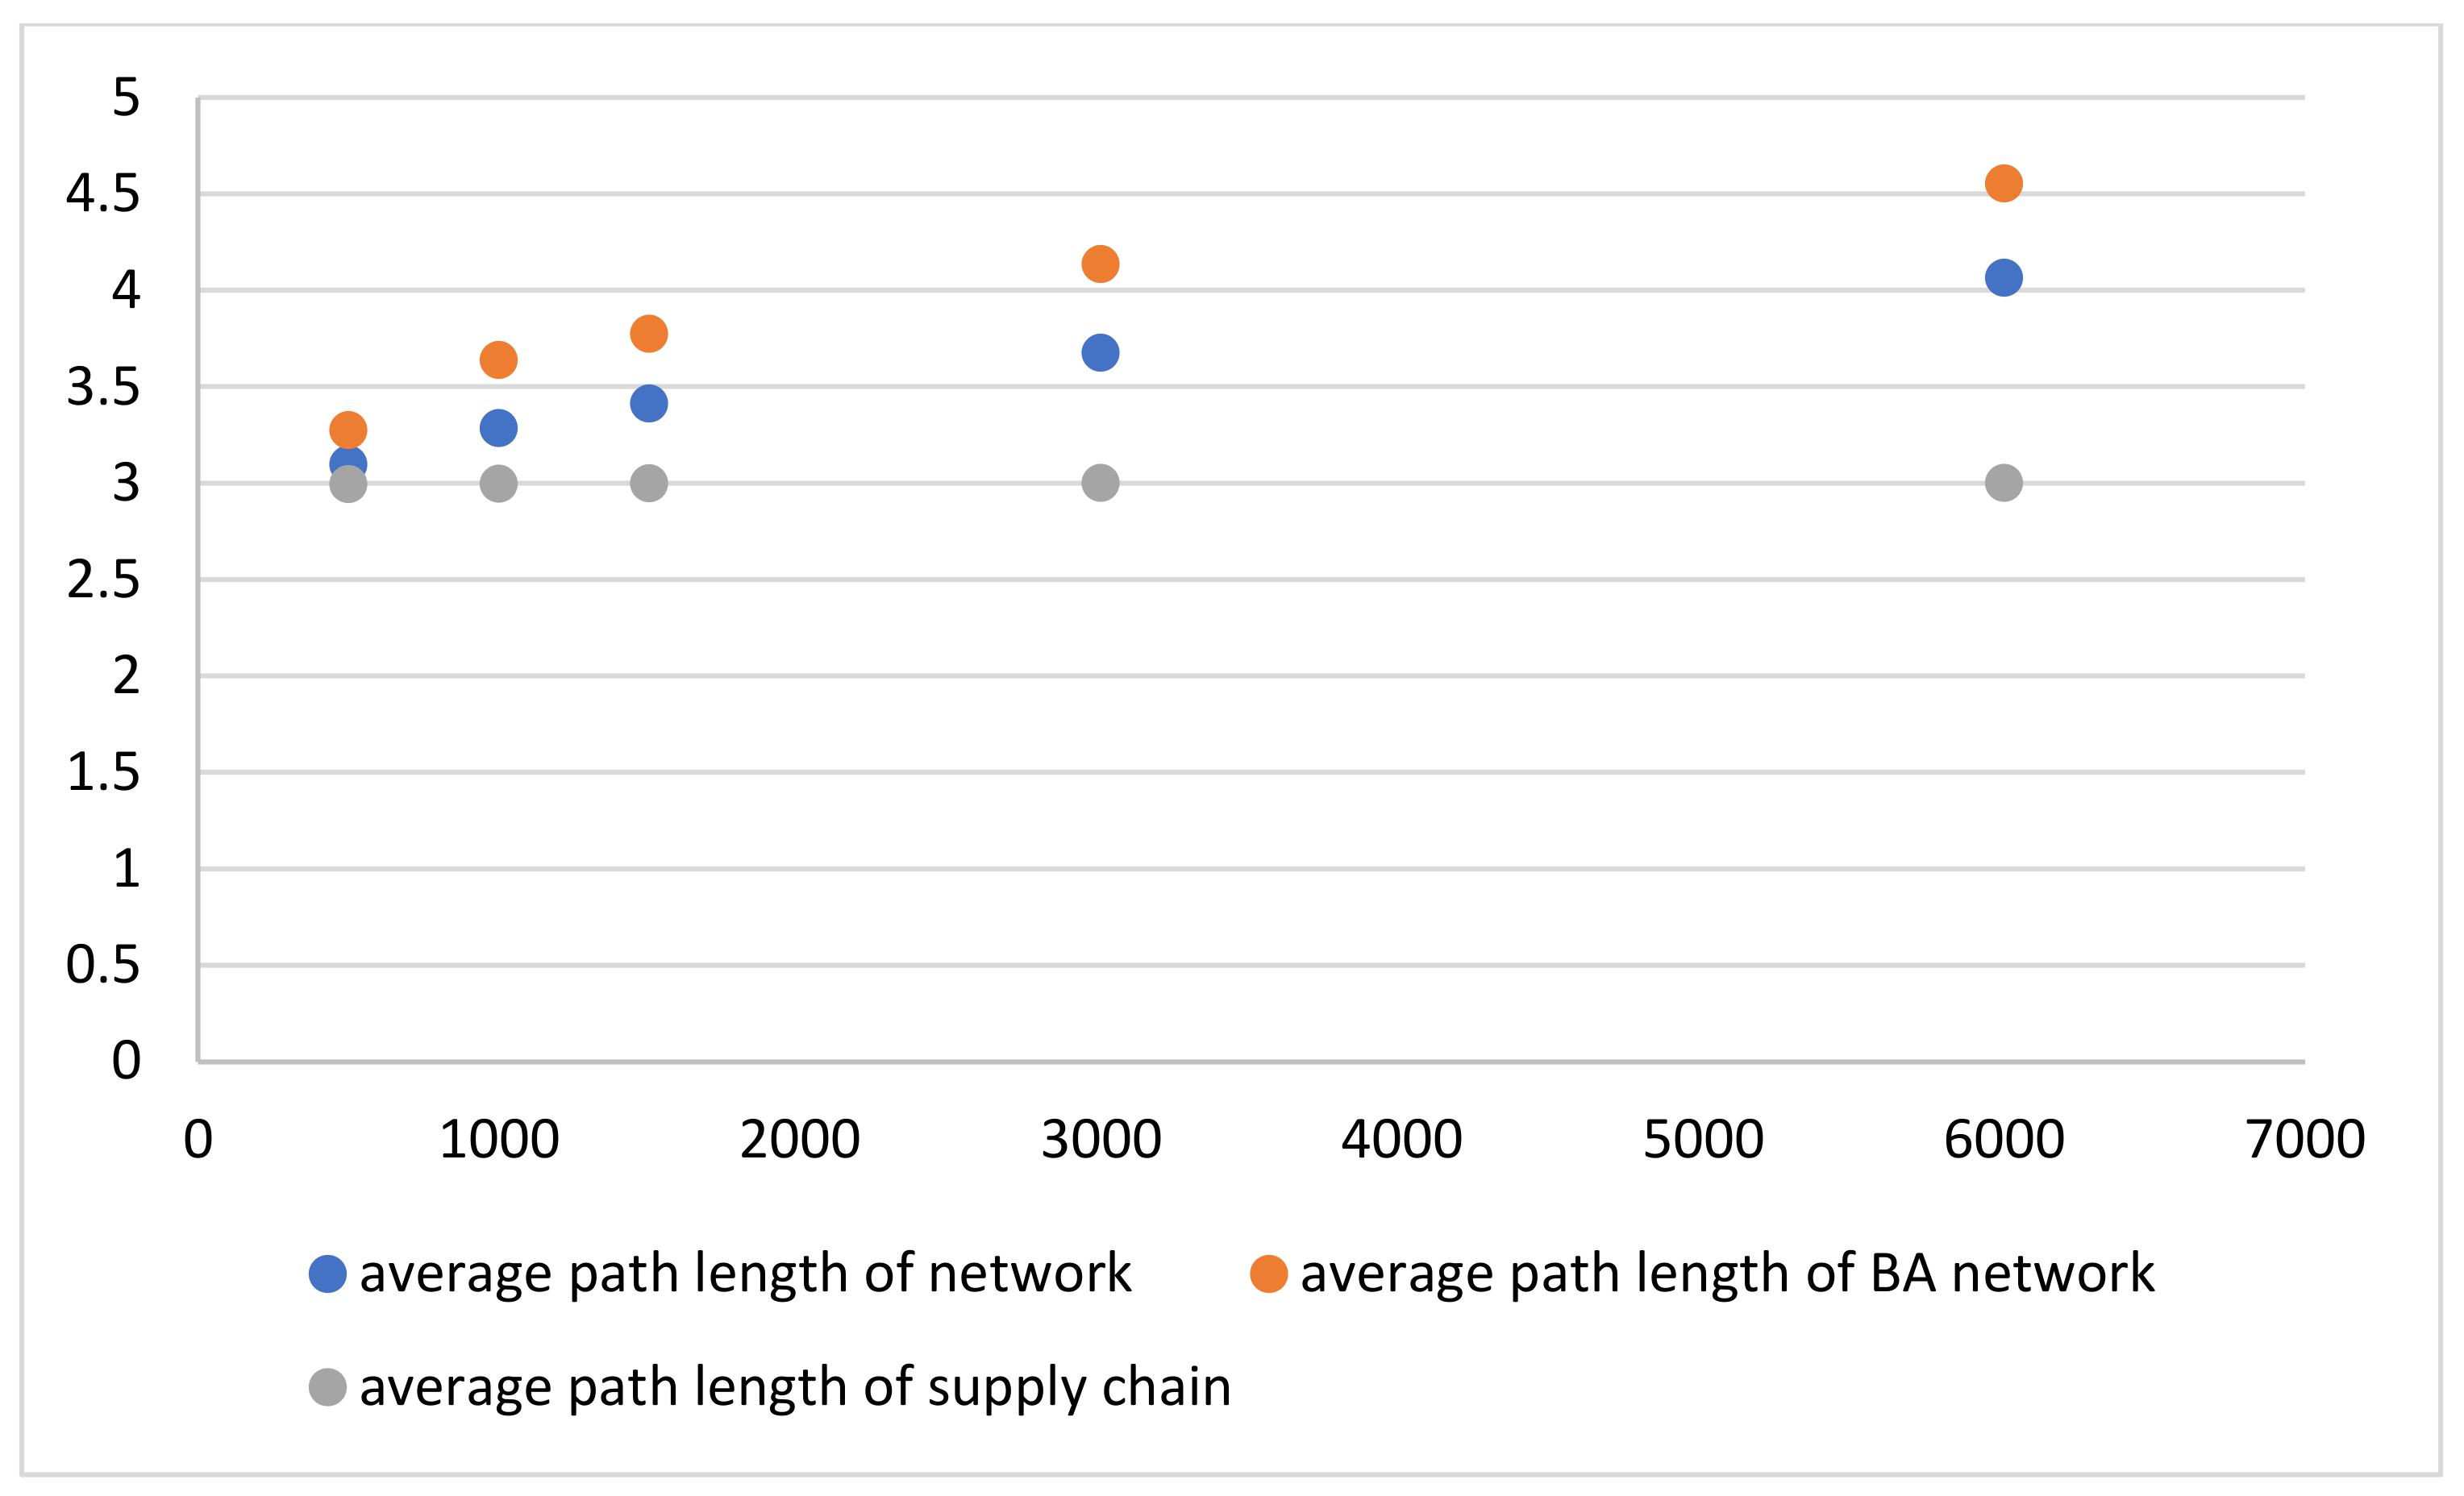
Figure 5.
Risk transmission mechanism.
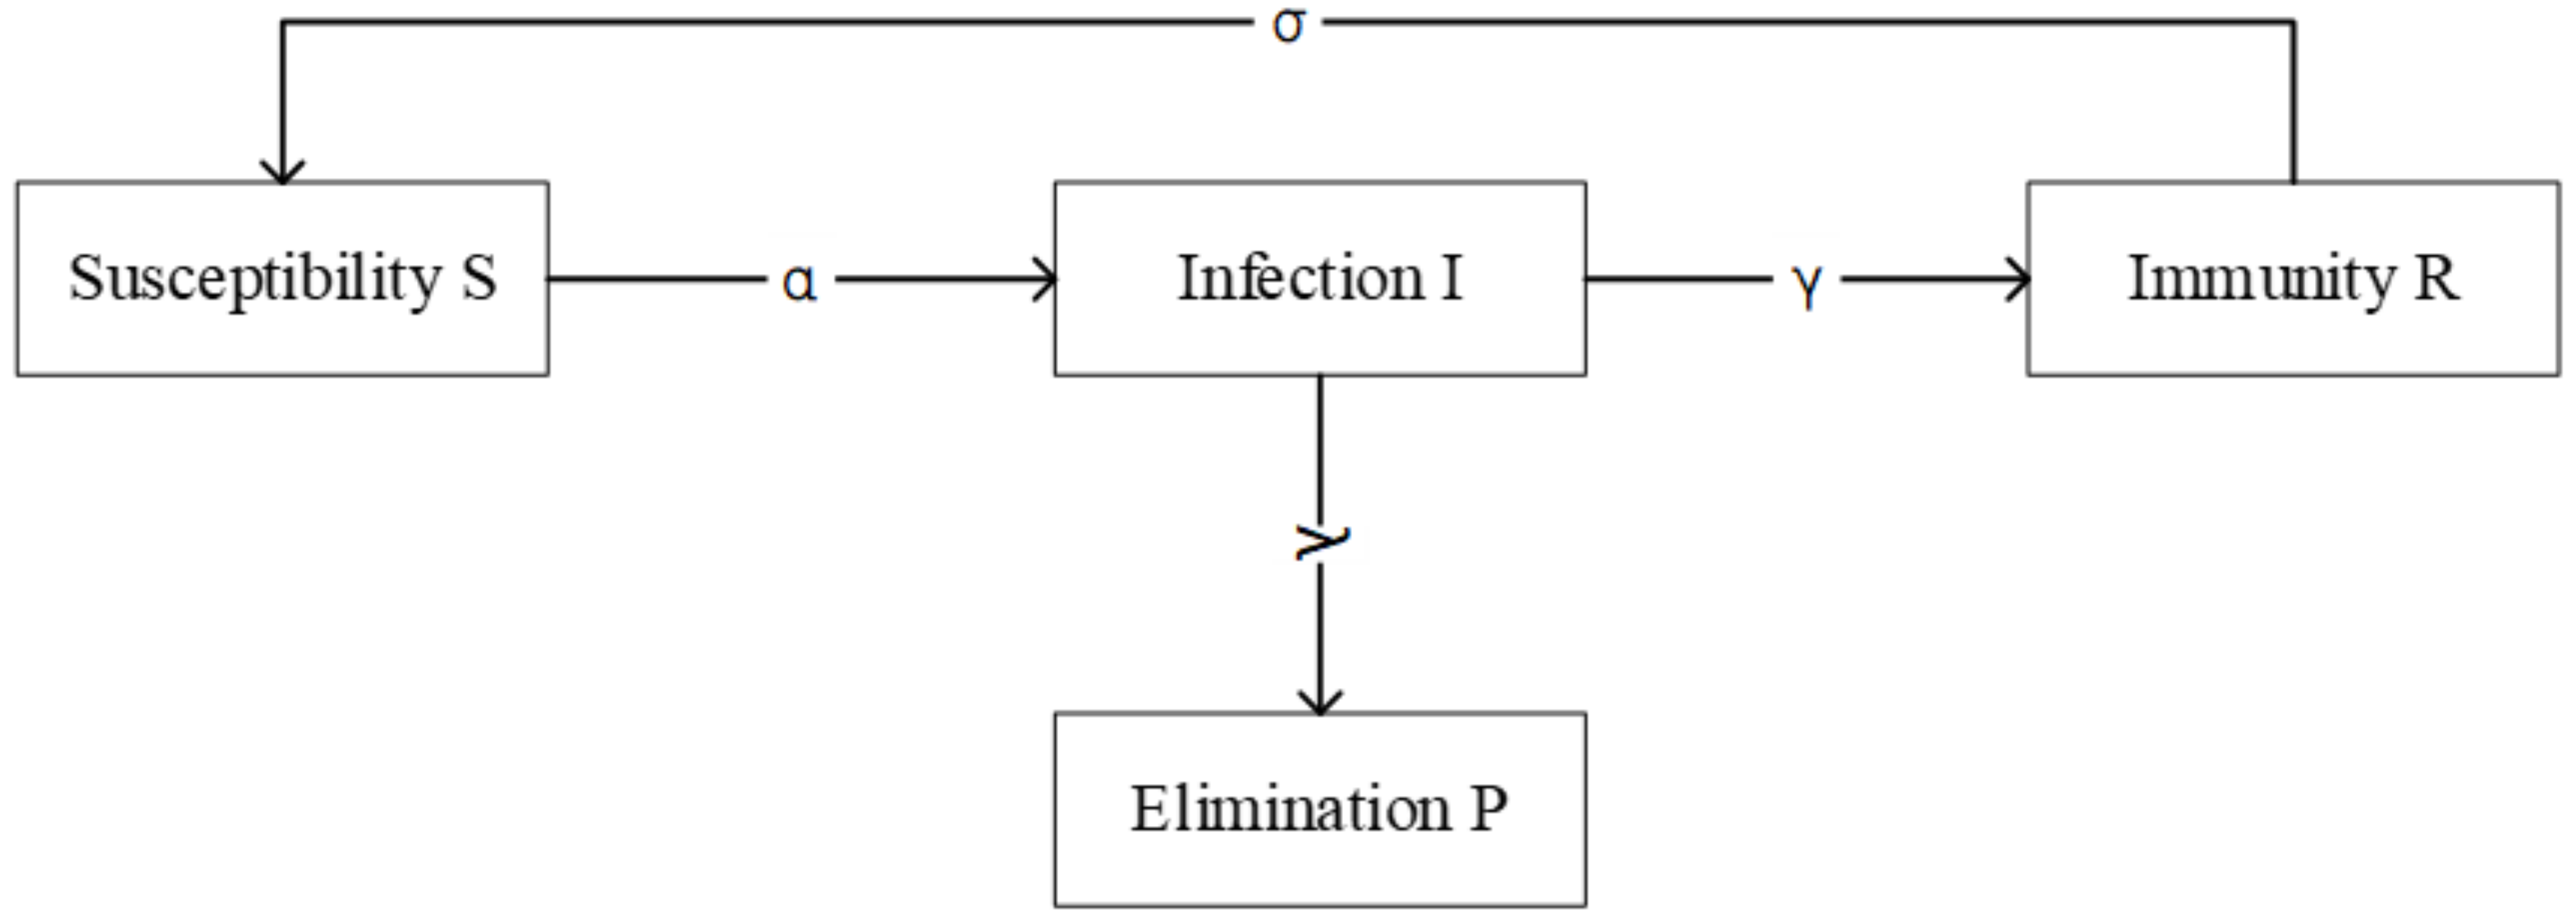
Figure 6.
Influencing factors of model parameters.

Table 1.
Author contribution table.
| Classification | The Study Authors | Main Contents of Research | Main Findings of the Study |
|---|---|---|---|
| The supply chain | Beheshtinia et al. (2021) [4] | Supply chain optimization | An improved genetic algorithm, GA-Topkor, was proposed to solve the supply chain scheduling problem in DMS considering the environment and economy to optimize the supply chain |
| Park [5] | Supply chain performance | Blockchain technology has the potential to improve supply chain sustainability performance | |
| Lin et al. [6] | Supply chain coordination | Developed a procurement strategy and validated its effectiveness in improving coordination of the influenza vaccine supply chain | |
| Liu et al. [7] | Closed-loop supply chain optimization | Optimized the closed-loop supply chain, a dual regulatory system characterized by deposit–refund policy, and minimum purchase rate of used products was introduced | |
| He et al. [8] | Dual-channel closed-loop supply chain | The channel structure and pricing decisions of manufacturers and government subsidy policies for competitive new products and remanufactured products were explored in dual-channel closed-loop supply chain | |
| Green supply chain | Dy et al. [9] | Green, low-carbon and sustainable supply chains | Products with low negative cross price elasticity or high positive cross price elasticity can reduce investment wastage in guaranteed technology by 20% |
| Ullah et al. [10] | Green closed-loop supply chain | Remanufacturing is a relatively cheap strategy for supply chains where set-up and ordering costs are high | |
| Sepehri et al. [11] | Green, low-carbon and sustainable supply chains | Gives the price dependence of perishable goods on demand when carbon cap-and-trade is used | |
| Liu et al. [12] | Green, low-carbon and sustainable supply chains | A location–inventory–path integrated model of perishable products considering carbon emission and product freshness was proposed to significantly improve the efficiency of perishable supply chain management from the perspective of global optimization | |
| Zhang [13] | Green Supply Chain performance | In the case of high green investment cost, government intervention will not necessarily bring higher green improvement, and the government should shift from taxation to subsidies | |
| Liu et al. [14] | Green and sustainable supply chain | Established sustainable supplier standards from the economic, environmental and social aspects; this method takes environmental factors into account to make the supply chain better achieve sustainability | |
| The intersection of supply chain resilience and network science | Li [15] | Supply chain network elasticity | An interruption from a few firms in a supply chain network (SCN) can propagate to neighboring firms, and then eventually to other firms in the SCN |
| Meng et al. [16] | Supply chain network elasticity | A graphical and game theoretic framework was proposed to evaluate elasticity, in which supply chain networks will reach a highly elastic equilibrium after experiencing repeated prisoner’s dilemmas | |
| Li et al. [17] | Supply chain network elasticity | Using the reduced feature list results in the same performance as using the full feature set | |
| Supply chain risk transmission mechanism | Pankaj et al. [18] | Supply chain performance Risk | t test of two samples was used to find the influence of different risks in cross-border e-commerce supply chain on supply chain performance, as well as the influence of one risk relative to another |
| Tie et al. [19] | Supply chain risk dissemination | SIR model was used to simulate the diffusion of network risks, and the robustness of the network under different risks was studied | |
| Zhang [20] | Supply chain risk dissemination | The priority of various attacks can be solved by studying the anti-risk capability parameters | |
| Syed et al. [21] | Main risks of supply chain | A grey-based hybrid decision experiment and evaluation laboratory (DEMATEL) model was proposed to evaluate the relationship between the major risks identified in FSC | |
| Wang [22] | Supply chain network risk | The complex supply chain network model and cascading failure model were combined to observe the dynamic risk propagation process of the supply chain network | |
| Chhimwal et al. [23] | Circular supply chain risk | The opposite side of the circular supply chain can be the source of risk dissemination during the implementation of the circular concept | |
| Gouda [24] | Sustainable Supply chain risk | While sustainability efforts help to reduce supply chain risks, passive risk mitigation strategies combined with sustainable development efforts can reduce supply chain risks | |
| Supply chain risk propagation modeling method | Lei et al. [25] | Improved SIS model | Combined with the complex network model and the optimization method of risk control strategy selection, an improved SIS model was proposed to discuss the supply chain risk propagation |
| Zheng [26] | SIRS risk contagion model | Based on the SIRS risk contagion model, the transmission process of credit risk between enterprises after the stock market burst was described by the contagion process |
Table 2.
A local world.
| The Node Type | A Local World |
|---|---|
| Brand party | Purchaser + cross-border e-commerce platform + logistics service provider |
| Purchaser | Brand side + cross-border e-commerce platform + logistics service provider |
| Cross-border e-commerce platform | Brand side + purchaser + logistics service provider |
| Logistics service provider | Brand side + purchaser + cross-border e-commerce platform |
Table 3.
Changes of average degree of various nodes with network size.
| Network Size | Brand Square Average | Buyer Average Degree | The Average Degree of Cross-Border e-Commerce Platform | The Average Degree of Logistics Service Provider | Network Average |
|---|---|---|---|---|---|
| 500 | 2.0628 | 2.1765 | 2.419 | 1.2353 | 2.0880 |
| 1000 | 1.9370 | 2.0705 | 2.8611 | 1.2105 | 2.0760 |
| 1500 | 1.8760 | 2.2178 | 2.3223 | 1.2031 | 2.0107 |
| 3000 | 1.8824 | 2.2190 | 2.4518 | 1.1107 | 2.0173 |
| 6000 | 1.8986 | 2.1266 | 2.4722 | 1.0448 | 1.9953 |
Table 4.
Scale and its meaning.
| Scale | Definition |
|---|---|
| 1 | The two elements are of equal importance |
| 3 | Compared with the two elements, the former is slightly more important or advantageous than the latter |
| 5 | Compared with the two elements, the former is more important or has advantages than the latter |
| 7 | Compared with the two elements, the former is very important or has advantages over the latter |
| 9 | Compared with the two elements, the former is definitely more important or advantageous than the latter |
| 2, 4, 6, 8 | Is the intermediate value between the above scales |
| The bottom | Contrary to the above implication, |
Table 5.
Random consistency RI table.
| N Order | 3 | 4 | 5 | 6 | 7 | 8 | 9 | 10 | 11 |
|---|---|---|---|---|---|---|---|---|---|
| RI values | 0.52 | 0.89 | 1.12 | 1.26 | 1.36 | 1.41 | 1.46 | 1.49 | 1.52 |
Table 6.
Model-related variables and definitions.
| Variable | Instructions |
|---|---|
| Denotes the node density in a susceptible state in the network at time t | |
| Denotes the density of nodes in the infected state in the network at time t | |
| Represents the node density in the immune state in the network at time t | |
| Denotes the node density in the obsolete state in the network at time t | |
| Represents the risk infection probability, that is, the probability of changing from susceptible state to infected state after contacting the node in the infected state | |
| Is the probability of risk removal, that is, the probability of the infected node removing the risk and entering the satisfactory state through a series of measures | |
| Is the probability of losing immunity, that is, the probability that the node of the immune state neglects to guard against risks and enters the susceptible state again | |
| Is the probability of elimination, that is, the probability that the infected node cannot resist the risk and exits the network |
Table 7.
Index of supply chain risk immunity evaluation.
| Level Indicators | The Secondary Indicators | Level 3 Indicators |
|---|---|---|
| Supply chain risk immunity | Risk resilience | Degree of dependence on a particular partner |
| Perfection of information channels | ||
| Financial soundness | ||
| Risk alarm mechanism | ||
| Risk resilience | Degree of enterprise flexibility | |
| Stability of cooperation with key enterprises | ||
| Risk taking mechanism | ||
| Risk response speed | ||
| Risk management capability | ||
| Risk learning ability | Employee training | |
| Upper level of attention | ||
| Continuous risk monitoring mechanism | ||
| Risk review mechanism |
Table 8.
External risk intensity evaluation indicators.
| Level Indicators | The Secondary Indicators | Level 3 Indicators |
|---|---|---|
| External risk intensity | Environment | Accuracy and timeliness of requirements acquisition |
| Relevant policies and regulations | ||
| Economic situation | ||
| Industry risk | ||
| Force majeure such as natural disasters | ||
| Trading | Risk of cross-border payment | |
| Credit risk | ||
| Logistics | Distribution timeout | |
| Goods are damaged | ||
| Risk of customs clearance |
Table 9.
Comparison matrix of secondary indicators of supply chain immunity.
| Supply Chain Risk Immunity | Risk Learning Ability | Risk Resilience | Risk Resilience |
|---|---|---|---|
| Risk learning ability | 1 | 0.333333333 | 0.2 |
| Risk resilience | 3 | 1 | 0.333333333 |
| Risk resilience | 5 | 3 | 1 |
Table 10.
Level analysis results of secondary indicators of supply chain immunity.
| Item | The Feature Vectors | Weight Value | Maximum Eigenvalue | The CI Value |
|---|---|---|---|---|
| Risk learning ability | 0.405 | 10.473% | 3.039 | 0.019 |
| Risk resilience | 1.000 | 25.828% | ||
| Risk resilience | 2.466 | 63.699% |
Table 11.
Consistency test results.
| Maximum Characteristic Root | The CI Value | RI Values | CR Value | Consistency Test Results |
|---|---|---|---|---|
| 3.039 | 0.019 | 0.520 | 0.037 | through |
Table 12.
Judgment matrix and weight of risk resistance three-level indicators.
| Risk Resilience | Risk Alarm Mechanism | The Perfection of Information Channels | Financial Soundness | The Degree of Dependence on a Particular Partner | Weight Value |
|---|---|---|---|---|---|
| Risk alarm mechanism | 1 | 0.333333333 | 0.333333333 | 0.5 | 10.855% |
| Perfection of information channels | 3 | 1 | 0.333333333 | 0.5 | 18.801% |
| Financial soundness | 3 | 3 | 1 | 1 | 38.725% |
| Degree of dependence on a particular partner | 2 | 2 | 1 | 1 | 31.619% |
Table 13.
Judgment matrix and weight of three-level indicators of risk recovery capability.
| Risk Resilience | Degree of Enterprise Flexibility | Stability of Cooperation with Key Enterprises | Risk Taking Mechanism | Risk Response Speed | Risk Management Capability | Weight Value |
|---|---|---|---|---|---|---|
| Degree of enterprise flexibility | 1 | 1 | 0.5 | 0.5 | 0.333333 | 10.938% |
| Stability of cooperation with key enterprises | 1 | 1 | 0.5 | 0.5 | 0.333333 | 10.938% |
| Risk taking mechanism | 2 | 2 | 1 | 1 | 0.5 | 20.653% |
| Risk response speed | 2 | 2 | 1 | 1 | 0.5 | 20.653% |
| Risk management capability | 3 | 3 | 2 | 2 | 1 | 36.817% |
Table 14.
Risk learning ability three-level indicator judgment matrix and weight.
| Risk Learning Ability | Employee Training | Upper Level of Attention | Continuous Risk Monitoring Mechanism | Risk Review Mechanism | Weight Value |
|---|---|---|---|---|---|
| Employee training | 1 | 1 | 0.333333 | 0.333333 | 12.50% |
| Upper level of attention | 1 | 1 | 0.333333 | 0.333333 | 12.50% |
| Continuous risk monitoring mechanism | 3 | 3 | 1 | 1 | 37.50% |
| Risk review mechanism | 3 | 3 | 1 | 1 | 37.50% |
Table 15.
Overall index weights of supply chain risk immunity.
| The Secondary Indicators | The Weight of the First-Level Indicators | Level 3 Indicators | To the Secondary Index Weight | The Weight of the First-Level Indicators |
|---|---|---|---|---|
| Risk resilience | 63.699% | Risk alarm mechanism | 10.855% | 0.06914526 |
| Perfection of information channels | 18.801% | 0.11976049 | ||
| Financial soundness | 38.725% | 0.24667438 | ||
| Degree of dependence on a particular partner | 31.619% | 0.20140987 | ||
| Risk resilience | 25.828% | Degree of enterprise flexibility | 10.938% | 0.02825067 |
| Stability of cooperation with key enterprises | 10.938% | 0.02825067 | ||
| Risk taking mechanism | 20.653% | 0.05334257 | ||
| Risk response speed | 20.653% | 0.05334257 | ||
| Risk management capability | 36.817% | 0.09509095 | ||
| Risk learning ability | 10.473% | Employee training | 12.500% | 0.01309125 |
| Upper level of attention | 12.500% | 0.01309125 | ||
| Continuous risk monitoring mechanism | 37.500% | 0.03927375 | ||
| Risk review mechanism | 37.500% | 0.03927375 |
Table 16.
Comparison matrix of secondary indicators of external risk intensity.
| External Risk Intensity | The Environment | Trading | Logistics |
|---|---|---|---|
| The environment | 1 | 0.5 | 0.5 |
| trading | 2 | 1 | 1 |
| logistics | 2 | 1 | 1 |
Table 17.
Hierarchical analysis results of secondary indicators of external risk intensity.
| Item | The Feature Vectors | Weight Value | Maximum Eigenvalue | The CI Value |
|---|---|---|---|---|
| The environment | 0.630 | 20.000% | 3.000 | 0.000 |
| trading | 1.260 | 40.000% | ||
| logistics | 1.260 | 40.000% |
Table 18.
Consistency test results.
| Maximum Characteristic Root | The CI Value | RI Values | CR Value | Consistency Test Results |
|---|---|---|---|---|
| 3.000 | 0.000 | 0.520 | 0.000 | through |
Table 19.
Judgment matrix and weight of three-level environmental indicators.
| The Environment | Accuracy and Timeliness of Requirements Acquisition | Relevant Policies and Regulations | The Economic Situation | Industry Risk | Force Majeure Such as Natural Disasters | Weight Value |
|---|---|---|---|---|---|---|
| Accuracy and timeliness of requirements acquisition | 1 | 2 | 0.5 | 2 | 2 | 23.173% |
| Relevant policies and regulations | 0.5 | 1 | 0.5 | 1 | 1 | 13.309% |
| Economic situation | 2 | 2 | 1 | 4 | 4 | 40.346% |
| Industry risk | 0.5 | 1 | 0.25 | 1 | 1 | 11.586% |
| Force majeure such as natural disasters | 0.5 | 1 | 0.25 | 1 | 1 | 11.586% |
Table 20.
Judgment matrix and weight of three-level trading indicators.
| Trading | Risk of Cross-Border Payment | The Credit Risk | Weight Value |
|---|---|---|---|
| Risk of cross-border payment | 1 | 1 | 50.000% |
| The credit risk | 1 | 1 | 50.000% |
Table 21.
Logistics three-level indicator judgment matrix and weight.
| Logistics | Distribution Timeout | Goods Are Damaged | Risk of Customs Clearance | Weight Value |
|---|---|---|---|---|
| Distribution timeout | 1 | 0.333333 | 0.333333 | 14.286% |
| Goods are damaged | 3 | 1 | 1 | 42.857% |
| Risk of customs clearance | 3 | 1 | 1 | 42.857% |
Table 22.
Overall index weight of external risk degree.
| The Secondary Indicators | The Weight of the First-Level Indicators | Level 3 Indicators | To the Secondary Index Weight | The Weight of the First-Level Indicators |
|---|---|---|---|---|
| The environment | 20.000% | Accuracy and timeliness of requirements acquisition | 23.173% | 0.04634600 |
| Relevant policies and regulations | 13.309% | 0.02661800 | ||
| Economic situation | 40.346% | 0.08069200 | ||
| Industry risk | 11.586% | 0.02317200 | ||
| Force majeure such as natural disasters | 11.586% | 0.02317200 | ||
| trading | 40.000% | Risk of cross-border payment | 50.000% | 0.20000000 |
| Credit risk | 50.000% | 0.20000000 | ||
| logistics | 40.000% | Distribution timeout | 14.29% | 0.05714400 |
| Goods are damaged | 42.86% | 0.17142800 | ||
| Risk of customs clearance | 42.86% | 0.17142800 |
Publisher’s Note: MDPI stays neutral with regard to jurisdictional claims in published maps and institutional affiliations. |
© 2022 by the authors. Licensee MDPI, Basel, Switzerland. This article is an open access article distributed under the terms and conditions of the Creative Commons Attribution (CC BY) license (https://creativecommons.org/licenses/by/4.0/).
Share and Cite
MDPI and ACS Style
Zhou, L.; Wang, J.; Li, F.; Xu, Y.; Zhao, J.; Su, J. Risk Aversion of B2C Cross-Border e-Commerce Supply Chain. Sustainability 2022, 14, 8088. https://doi.org/10.3390/su14138088
AMA Style
Zhou L, Wang J, Li F, Xu Y, Zhao J, Su J. Risk Aversion of B2C Cross-Border e-Commerce Supply Chain. Sustainability. 2022; 14(13):8088. https://doi.org/10.3390/su14138088
Chicago/Turabian StyleZhou, Li, Jingjing Wang, Feng Li, Yan Xu, Jie Zhao, and Jiafu Su. 2022. "Risk Aversion of B2C Cross-Border e-Commerce Supply Chain" Sustainability 14, no. 13: 8088. https://doi.org/10.3390/su14138088
Note that from the first issue of 2016, this journal uses article numbers instead of page numbers. See further details here.