Article

Price Sensitivity of Fish Fed with Insect Meal: An Analysis on Italian Consumers

Department of Agriculture, University of Sassari, 07100 Sassari, Italy
*
Author to whom correspondence should be addressed.
Sustainability 2022, 14(11), 6657; https://doi.org/10.3390/su14116657
Submission received: 15 April 2022 / Revised: 18 May 2022 / Accepted: 26 May 2022 / Published: 29 May 2022

Abstract

:
The importance of aquaculture in reducing pressure on wild stocks in the seas and meeting the demand for fish worldwide has increased greatly in recent years. However, sustainability of the sector can be jeopardized by the incessant use of fish meal as the main source of feed. For this reason, replacing, even partially, fish meal with other feeds such as insect meal is essential to make this sector more sustainable. However, this transition requires consumer acceptance of this innovation, which comes through price, one of the most powerful marketing tools affecting the evaluation of product alternatives (e.g., fish fed with traditional feed or insects) and the final purchase decision. The objective of this study is to explore the acceptable price and the limits of price thresholds of fish fed with insect meal using a direct measure of assessing consumers’ willingness to pay. In particular, the study uses the Price Sensitivity Meter (PSM) of Van Westendorp to evaluate the reaction of Italian consumers to the price of European sea bass (Dicentrarchus labrax) hypothetically fed with insect meal. The results showed a wide acceptable price range, an indifferent price point very close to the price of traditionally fed fish, and a high price stress factor. Consumers have shown considerable price sensitivity, which does not allow the additional costs arising from the use of this sustainable alternative feed to be passed on to them. Consumers with great subject knowledge showed major willingness to pay. The contribution of our study lies in providing detailed insights into the possible prices that consumers are willing to pay for sea bass fed with insect meal and thus on the product’s perceived quality, offering several implications for academics, practitioners, and policymakers.

1. Introduction

More than twenty years ago, a paper published in Nature recommended aquaculture as a way to reduce the overexploitation of fisheries [1]. Indeed, in a scenario in which fishing is highly regulated to prevent the collapse of fish stocks, aquaculture has made significant contributions to satisfy the growing world demand for fish products in recent decades. Essentially, aquaculture is the fastest-growing sector of the global food industry. This trend appears unlikely to halt in the next few years; on the one hand, fish consumption is estimated to increase by 28 million tons by 2030, compared to 18 million tons in 2018 (+18%) [2,3,4], while on the other hand, the quantity of fish caught has been substantially stable due to the regulatory restrictions to which fishing is throughout the world.
However, this sector as it stands today poses many concerns. Among the major ones, what must be underlined is the use of fish meal as the key ingredient used in commercial fish feed [5,6,7,8]. While the percentages of fish meal and oil in fish diets have been declining in recent years—due to the growing needs for aquaculture expansion and the almost constant levels of fish meal and oil production, which cannot be increased due to overfishing in the oceans [9]—there has been an increase in the use of marine resources for aquaculture [10,11]. It is estimated that the sector consumes around 70% of the world’s fish meal and fish oil resources each year, increasing their prices and the search for innovative alternative nutritional sources [10]. In short, whether aquaculture wants to grow to meet the increasing demand for fish products, it must necessarily use new feeds to partially replace the fish meal [12].
Previous research focused on alternative protein sources for human and animal nutrition and food waste showed that edible insects could be a valid substitute for proteins of animal origin and a valuable tool for waste treatment [13,14,15]. Further, insects have low environmental impact as a source of food since they need limited arable land and water compared to livestock and have a low ecological cost (low emissions of greenhouse gases and carbon dioxide) [16,17].
The European Commission, recognizing the problems above of environmental and economic sustainability in the aquaculture sector as well as the scientific data relating to the introduction of insect meal in fish nutrition, has enacted the Regulation 893/2017, which allows the use of seven species of insects in fish feed. In effect, insects are a healthy and sustainable feed alternative. The development of this sector may contribute to the reach of several SDGs [18] and have an important role within sustainable circular agriculture [19,20,21]. All these aspects are crucial for Europe, which aims to achieve carbon neutrality by 2050 through sustainable economic growth and accelerate the European transition towards a circular economy model (COM (2020) 98 final).
However, the role of consumers is decisive to move towards a sustainable food system and implement a sustainable aquaculture [22,23] since they, through their choices, can simultaneously support or hinder the success of this innovation in the market. In other words, to switch successfully from fish to insect meal, the consumer’s preferences and their willingness to pay (WTP) for fish fed with insect meal are crucial [24]. It must be said that the increased WTP for sustainable food production in Europe over recent years [25,26] raises the legitimate expectation that sustainability will drive agricultural production changes towards new ways of production. Nevertheless, despite the growing public and academic interest in consumers’ sustainable food behavior, several questions still await an answer on Western consumers’ acceptance of insect-based food and feed. Specifically, often there is a substantial lack of knowledge that affects the consumers’ WTP for fish feed with insects [6].
Besides, although most consumers do not worry about how the fish was fed when buying fish [24], the European aquaculture sector has to be ready for when this information will be easily accessible and available even without consumer research efforts. This aspect assumes particular relevance especially in light of the new “Farm to Fork strategy” [27], which aims at a fair, healthy and environmentally-friendly European food system, also by empowering consumers to make informed, healthy, and sustainable food choices (i.e., with nutrition labeling, mandatory provenance indicators, and the use of digital technologies to improve food chain traceability and inform on environmental footprint). Indeed, in the agri-food sector, innovation in current food characteristics can clash with consumers’ inclination toward traditional alternatives, preventing food innovation acceptance [28].
However, acceptance passes also and especially through the price, which is one of the most powerful marketing tools [29]. The price significantly impacts consumers’ evaluation of product alternatives (i.e., fish fed with traditional or insect feed) and their final buying decision [30,31,32], and pricing policy is an effective way to influence dietary behavior [33].
Against this background, this study aims to investigate the acceptable price and the limits of price thresholds of fish fed with insect meal using a direct measure of assessing consumers’ WTP. An accurate measurement of consumers’ WTP is essential since it offers information on the product’s perceived value, and a poorly-considered introductory price can threaten innovation failures [34,35,36,37]. Specifically, this study uses the Price Sensitivity Meter (PSM) proposed by Van Westendorp (VW) [38] to evaluate Italian consumers’ WTP for European sea bass (Dicentrarchus labrax) hypothetically fed with insect meal. The PSM is considered a very meaningful and accurate exploratory method for estimating the WTP, especially for new product and product innovation [39,40,41,42], and is the most common market technique used to determine consumer price preferences by market research firms [43]. The choice of European sea bass stems from the fact that it is the major species culture in the Mediterranean region [44], and the analysis of consumers’ sensitivity to its price can provide valuable information on consumers’ value perceptions of this food innovation.
This study fits inside the poor literature on studying consumers’ WTP for the alternative feeding systems [6] and its uniqueness lies in indicating the acceptable price range for fish fed with insect meal and the consumers’ price sensitivity measure, as well as how prior knowledge affects the consumers’ WTP for such innovative food. To our best of knowledge, no study has focused specifically on those issues.
This paper makes several contributions to the literature. First, it addresses recent calls for research to increase insect meal in aquaculture production [6]. By focusing on the role of price in consumer choice, this study provides insights into the consumers’ price sensitivity and price–response function for fish fed with insect meal. Second, it responds to research calls for consumer studies in food and nutrition that distinguish between subjective and objective consumer knowledge [45]. This study provides insight on subject knowledge’s role in the buying behavior of the fish fed on insect meal. While some previous studies analyzed the links between knowledge and food choices, very few of them have specifically explored subjective and objective knowledge [46], especially concerning the fish [45,47,48]; to the best of our knowledge, no study has been undertaken in the context of fish fed with insects in a hypothetical purchase scenario, as we do here. This article also provides important food for thought to the fish farmers, retail managers, and policymakers.
The remainder of this paper is structured as follows: Section 2 provides an overview of previous literature related to insect edible consumption and price role in consumer behavior; Section 3 introduces the study’s methodology and data sources; Section 4 displays results; finally, Section 5, presents conclusion and discussion of the results and provides suggestions for future research.

2. Background

2.1. Edible Insects’ Consumption

Scientific literature worldwide has paid particular attention to the issue of eating insect-based foods. Especially in recent years, a significant production of papers has been observed given the growing interest in the topic in Western economies and the greater awareness of promoting models and styles of sustainable consumption [49,50,51,52].
Concerning the European countries, introduction of insects in the diets is typically regarded with disgust and skepticism [53]. However, emphasis on the importance of insects in these realities is increasing in the scientific and institutional debate. A large literature has appeared on consumer acceptance of insects as food in European and Western consumers. At the same time, these studies are mainly collocated into the consumer psychology or cognate disciplines rather than into economics [54].
Hartmann et al. [55] recently reviewed the main reasons that have limited insect and insect-based food consumption, even if this attitude was consolidated many centuries ago (mainly in the Mediterranean basin). According to Bodenheimer [56], insects were progressively abandoned as food in Europe due to the appearance of more accessible sources of food and proteins. Therefore, insects have disappeared from the European diet for several centuries and only recently have they been rediscovered as a delicacy. However, their consumption is far from appreciable both for purely regulatory issues and for the widespread diffidence that Europeans have towards this type of food [57,58].
Diffidence is given by several reasons [54,55,59,60]. Basically, European consumers have low willingness to eat insect-based products because they are considered a source of food contamination and risky for the health. In this regard, since food safety is an intrinsic quality of food and the consumer has the right to consume products safely, the European Union has established a strong and clear regulatory system to ensure the safety of fish and prevent environmental problems [61,62]. Psychological, social, cultural, and demographic issues are at the basis of the perceptions that move European people to prejudice against insect consumption; in particular, a sense of disgust [13,53,54,59,63,64,65,66,67,68].
Some reviews have, even recently, examined the scientific literature on the themes of product characteristics, nutritional and organoleptic properties, and consumer behavior throughout the world [64,69]. Other papers have highlighted the drivers that affect insect food acceptance in Europe [54,70,71].
Table 1 shows the main drivers that positively and negatively are related to acceptance of insect-based food in Europe and the studies in which they have arisen. These are collected on the basis of information reported in recently published reviews with some integration related to more recent papers.
The positive factors found in the literature can be grouped into three categories: familiarity and previous personal experiences, environmentally-friendly orientation, and healthiness. The first has frequently been shown to be an important driver of food choice in general. Concerning the second, consumer awareness of the environmental impact of food production appears to increase consumers’ willingness to accept insects as food. The healthiness drivers believe insects have the potential to become a truly ‘sustainable superfood’, that is “nutrient-packed foods, which are successfully promoted to Western consumers with the promises of health, well-being and beauty” [72].
Negative factors are also enclosed in three categories: disgust, which is a person’s basic reaction to certain potential foods; neophobia, which is understood as the consumer’s rejection of new or unknown or non-traditional things depending on the culture of the individual, and health risk, which is related to the risk of disease and illness.
Referring to House [54], Govolushko [64], and Orsi [71] for more details about these drivers, some economic and social features are reported below.
Readiness to eat insects as an alternative source of protein is very low in most European countries. Imathiu [52] reports that this demographic represents 19% of the total population. On the other hand, a lower portion of consumers is likely to eat insects.
A common finding concerns the effect of gender in accepting insect-based food. Except for de Boer et al. [73] and Hartmann et al. [59], most of the studies reveal that males are more inclined to eat insects see [52,71]. In some cases, the number of males is about twofold that of females (e.g., [53] found a percentage on the sample of 6–7% and 12–13% for males and females, respectively).
However, willingness to eat insects varies among countries and consumer targets. Germans are very reluctant to consume this kind of food. Diffidence, disgust, and neophobia represent the main obstacles for German consumers. In other countries such as Belgium, Austria, Italy, France, and Holland, consumers appear readier to try insect-based food and are less skeptical towards insect-based food, even if controversial findings have arisen [52].
Level of education might not be a driver in affecting consumer behavior in the case of insect consumption [53,59,63], whereas age is a discriminating factor. Indeed, empirical evidence suggests that younger people show a greater inclination than older ones towards eating insects [53,66,74,75].
Also, curiosity plays a role in influencing attitudes towards eating insects, as found by Verbake [53].
Furthermore, a high degree of reluctance has been found in vegetarians and vegans due to the inherent propensity to reduce or eliminate meat consumption [53,54,76].
Finally, an important issue concerns the physical form in which insects are consumed. Basically, European consumers tend to prefer insects as ingredients of a given food. In other terms, acceptance is greater when insects are presented in other forms (e.g., burgers, sandwiches, cookies) than in original form [51,52].
Table 1. Main drivers that affect insect-based consumption in Europe appeared in the scientific literature.
PositiveNegative
Familiarity and Previous Personal ExperiencesDisgust
Caparros Megido et al. [77]Caparros-Megido et al. [51]
Caparros-Megido et al. [51]Costa-Neto and Dunkel [76]
Hartmann and Siegrist [78]Gmuer et al. [79]
Hartmann et al. [59]Hartmann and Siegrist [78]
Lensvelt and Steenbekkers [80]Hartmann et al. [59]
Menozzi et al. [81]Meixner and Mörl von Pfalzen [82]
Piha et al. [83]Stockley et al. [84]
Sogari et al. [85]Tan et al. [86]
Tan et al. [86]Van Huis et al. [87]
Tan et al. [88]Verbeke [53]
Van Thielen et al. [89]
Verbeke [53]Healthy risk
Vernau et al. [90]
Vernau et al. [91]Baker et al. [92]
Costa-Neto and Dunkel [76]
Environmentally-friendly orientationHartmann and Siegrist [78]
Hartmann et al. [59]
Gamborg et al. [93]Meixner and Mörl von Pfalzen [82]
Hartmann and Siegrist [55] Ruby et al. [60]
House [54]
Kostecka et al. [94]Neophobia
Lensvelt and Steenbekkers [80]
Menozzi et al. [81]Borrello et al. [68]
Schiemer et al. [72]Dossey et al. [95]
Tan et al. [86]Hartmann and Siegrist [65]
Verbeke [53]Hartmann and Siegrist [78]
Hartmann et al. [59]
HealthinessImathiu [52]
La Barbera et al. [96]
Cavallo and Materia [97]Monteleone et al. [98]
Gere et al. [99]Piha et al. [83]
Hartmann and Siegrist [55]Roma et al. [13]
Ruby et al. [60]Schlup and Brunner [100]
Schiemer et al. [72]Verbeke [53]
Schlup and Brunner [100]Wilkinson et al. [101]

2.2. Price Impact on Consumers

Price is a sort of rudder, the tool by which a product can move through a consumer’s mind more effectively and, above all, more visible way than the other attributes of the product. According to Meehan et al., “pricing touches everything, and everything touches pricing” [102]. Therefore, it represents one of the strongest marketing tools [29] that significantly impact consumers’ buying behaviors.
At the firm level, the price serves both to stimulate consumer demand and as a variable to determine long-term profitability [103,104], whereas at the consumer level, it acts as a cue for information and a measure of sacrifice. In this respect, the price refers, in a narrow sense, to the amount of money charged to consumers for a product or service, and in a broader sense, to the sum of all the values that they give up in gaining the benefits of having or using a product. In effect, price is considered not just negative, but also positive as it serves as a proxy for product quality for customers [105,106]. Moreover, in the case of embedding new environmental and social responsibility attributes into products that are familiar to consumers, price acts as a stimulus to think about these unusual benefits [107].
Consumers’ reaction to the price of products and services is called “price sensitivity” [108], which for Anderson [109], consists of the extent to which a customer accepts the price increase for a specific product in terms of economic and psychological gains.
Among the factors influencing consumer price sensitivity, a product’s value perception is crucial since it directly affects consumer WTP [37,110]. The WTP has been defined as the price premium or the upper threshold that a current or potential consumer is willing to accept for a product or good [111].
Consumers’ price–quality perceptions are influenced by prior knowledge [112]. Previous authors [113,114] distinguish between “objective knowledge” (i.e., how much an individual actually knows about a product or, in other words, the information stored in memory) and “subjective knowledge” (SK) (i.e., how much an individual thinks he/she knows about a product or product class). The latter has been found to be a stronger motivation of the behaviors linked to the purchase than objective knowledge [115]. The SK reflects consumer confidence, understood as their subjective evaluation of their ability to generate positive experiences on the market [116], and provides a better understanding of consumer decision making [117,118]. It has been found to be linked to greater WTP and pro-environmental behaviors [119].
Understanding consumers’ WTP and prior knowledge effects can enable policymakers and multi-agent stakeholders to take actions that ensure sustainable food production [120].

3. Methodology and Materials

3.1. The Van Westendorp Model

The WTP can be estimated both as a point [121] and an interval [42] with two types of methods: indirect and direct.
Indirect methods, such as conjoint analysis, choice-based conjoint analysis, discrete choice analysis, etc., provide consumers with choices and ask them to choose which option they are most willing to pay for. Although some previous studies see indirect methods as more accurate than direct methods, they are more expensive and complex for respondents. Moreover, the indirect methods commonly used to determine prices for new products, such as the Gabor–Granger model [122] and discrete choice methods, present limitations. In effect, the first requires a clear idea of the range of prices that the company wants to apply to the product [39]; the second, while reflecting the real-world marketplaces with competing products, has to handle many attributes and the model can be calibrated on several assumptions that may not be realistic [123].
Direct methods, such as contingent valuation (used for eliciting market valuation of a non-market good and that involves questioning of predefined price levels), open-ended methods (a stated preference that suffers serious drawbacks in case of very unusual new product concepts), purchase offer/experiments (Becker–DeGroot–Marschak), and the VW PSM model are the most used by commercial pricing studies [36,124] and are considered suitable for practical applications due to their robustness [125,126].
Similar to other price sensitivity techniques, the VW PSM model could have a restricted application due to the possible limited price awareness, and testing new concepts is dubious. Nonetheless, it is widely used in researching consumers’ WTP, especially for new products or services (Lipovetsky 2006). It has a high predictive quality [127] and considers consumer responses toward too-low and -high prices [125], avoiding imposing price points on interviews. Moreover, it is particularly suitable for a product in its early development cycle and for which there is not a clear idea of the price range to get it onto the market. Besides, it is more meaningful and accurate than other methods that give point estimates for the WTP. This is why previous studies suggest using the VW model as an exploratory method to identify an appropriate range [41,42].
Assumptions of the VW model are as follows:
  • There exist reasonable prices that consumers are able to envision;
  • There exists an upper and lower bound to the price that consumers are willing to pay for a product or service;
  • Price is an intrinsic measure of value or utility of product or services.
Data elicited in the VW process consists of the answers to four price questions:
-
At what price would you begin to think the product is too expensive to consider (too expensive)?
-
At what price would you begin to think the product is so inexpensive that you would question the quality and not consider it (too cheap)?
-
At what price would you begin to think the product is getting expensive, but you still might consider it (expensive)?
-
At what price would you think the product is a bargain (a great buy for the money–cheap)?
Among the different approaches to the VW model [40], in this study, the respondents set the price range, allowing them to fully express their price expectations without any suggestion or indication and define a wider price range.
The cumulative frequencies of each price question give rise to four curves and are plotted for analysis. As suggested by Van Westendorp [38], the cumulative frequencies for points “too cheap” and “expensive” are given in the reversed form. The intersections of curves identify four critical price points used to approximate an acceptable price range:
-
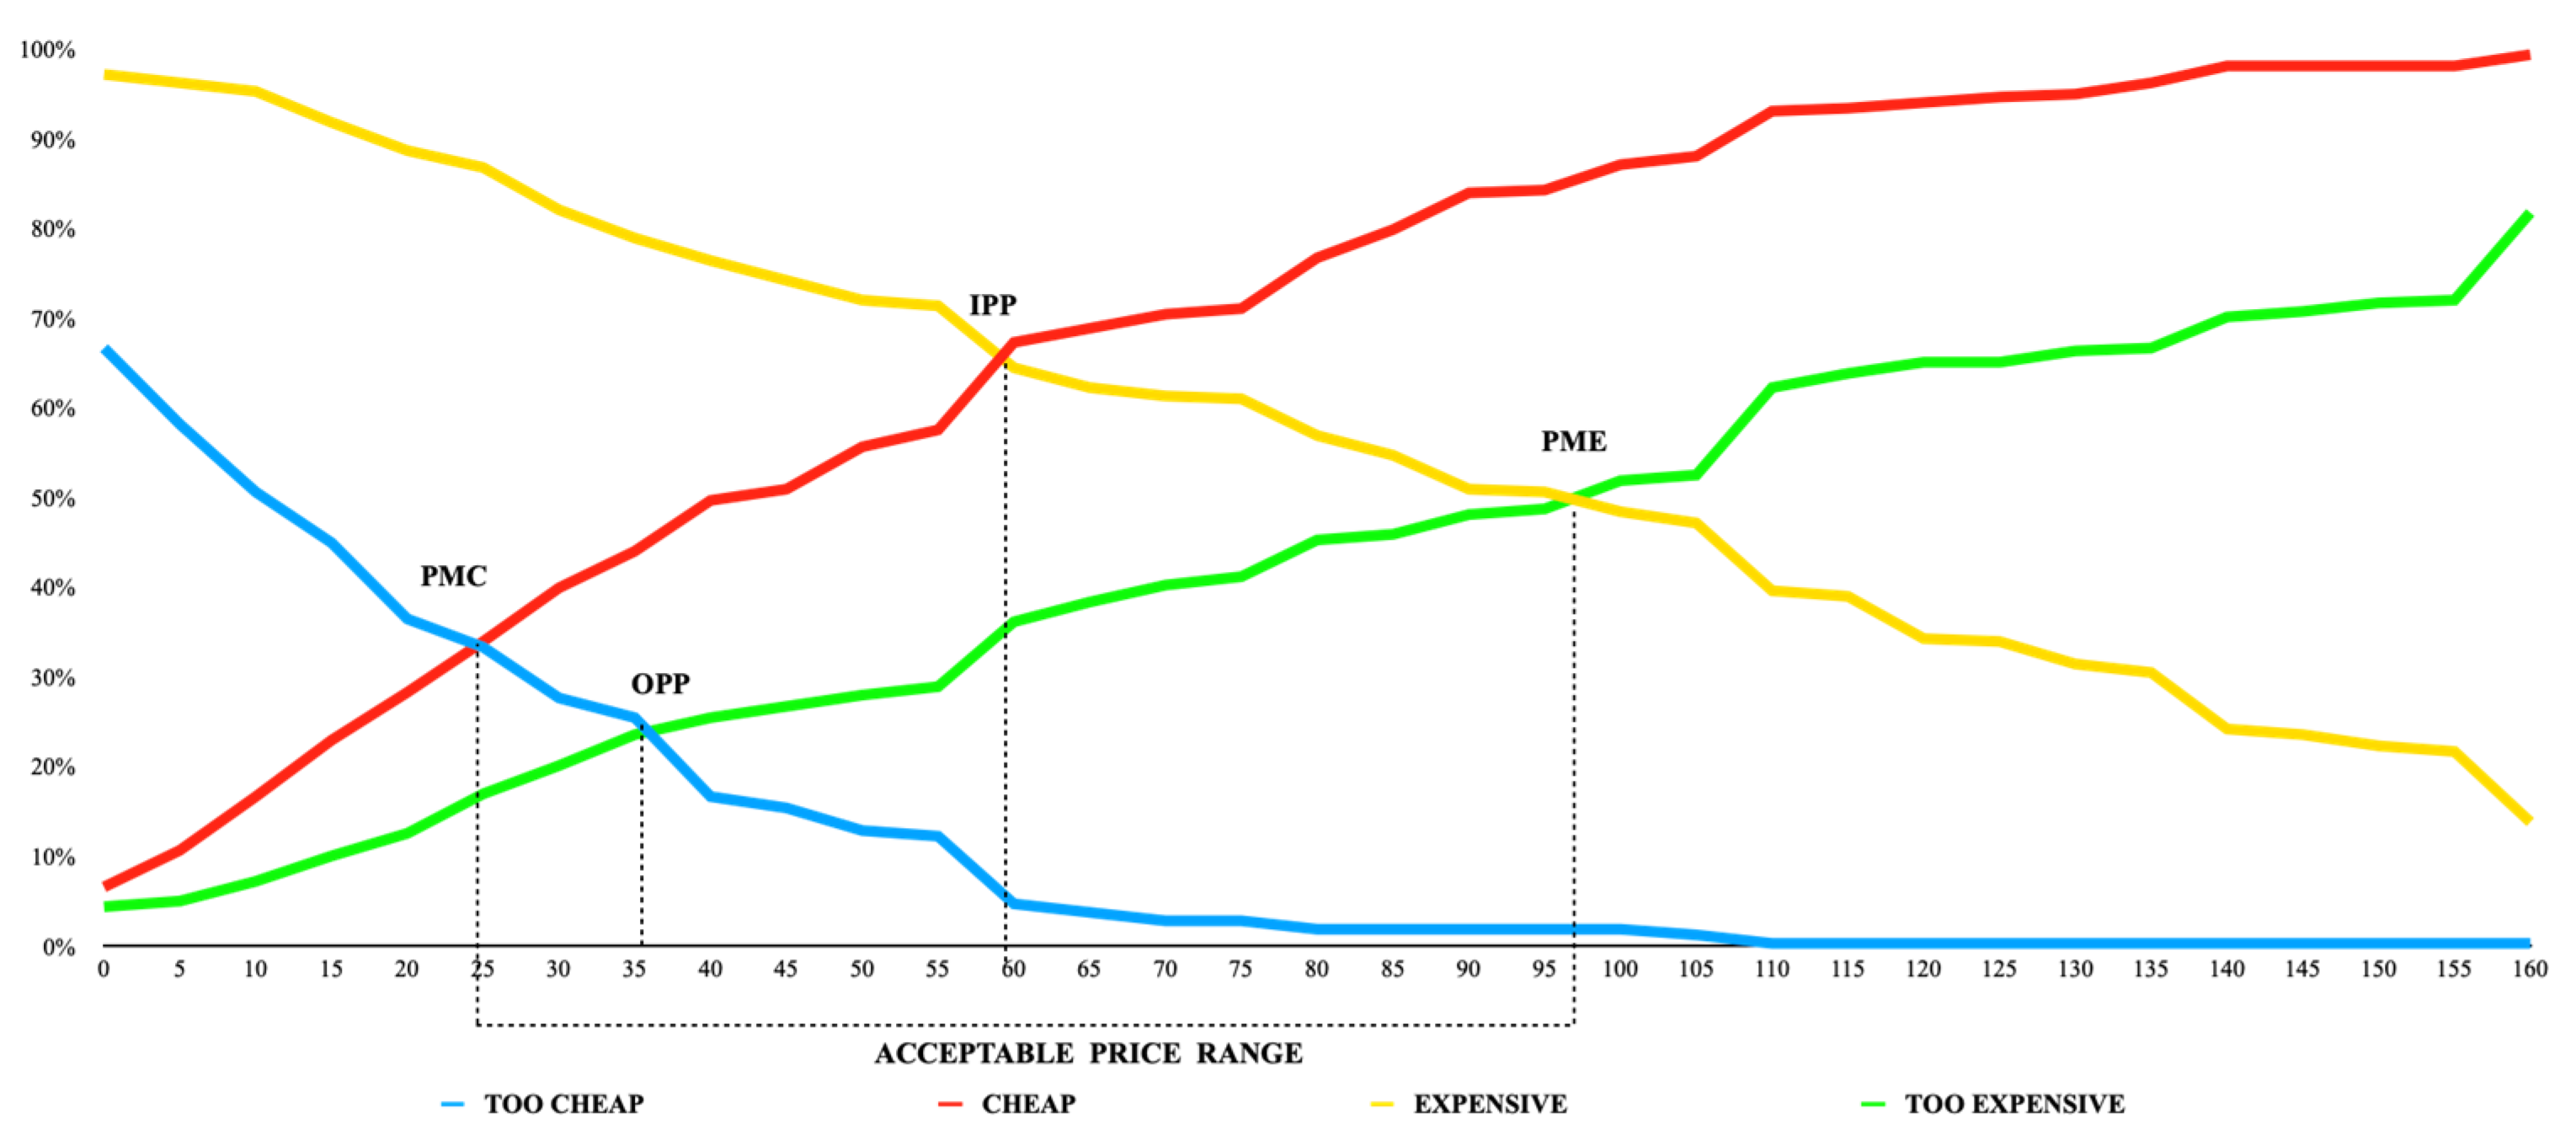
Point of marginal cheapness (PMC), namely the lowest threshold of the acceptable price range. It is the point where more sales would be lost due to the rapidly increasing proportion of consumers that view the product as too cheap and of questionable quality. In the graph, the point resulting from the intersection of the too-cheap and cheap curves (see Figure 1).
-
Point of marginal expensiveness (PME) is the upper threshold of the range of acceptable prices and the point where respondents believe the product is too expensive compared to the value derived from it. In short, it is the inflexion point where the increasing price elasticity of demand is enough to cause demand to fall rapidly and thus can be used as a measure of the willingness to pay limit. Graphically, it is the point of intersection between “expensive” and “too-expensive” curves.
-
Optimal price point (OPP) is the point of intersection between too-expensive and too-cheap curves, where an equal number of respondents describe the price as over the upper or lower limit. It is optimal because there is an equal trade-off in extreme price sensitivities at both ends of the price spectrum. In short, it can be considered the “sweet spot” as it maximizes the number of people who find the price acceptable and minimizes the resistance to price changes.
-
Indifference price point (IPP), or normal price point, where most respondents are indifferent to the price, and the same number of respondents rate the price as “getting expensive” or “a bargain.” It is the (median) “normal” price in the market, represented graphically by the point of intersection of “expensive” and “cheap” lines.
The PMC and PME define the upper and lower threshold limits of the range of acceptable prices, while the price range between PMC and IPP and IPP and PME shows the relatively cheap and relatively expensive range prices, respectively. The distance between IPP and OPP holds the price options considered the “stress price range” (SPR), which indicates the degree of stress of customers from the pricing situation [38]. According to Maes et al. [128], stress is “a state of imbalance within a person, elicited by an actual or perceived disparity between environmental demands and the person’s capacity to cope with these demands” [128].
The stress factor (SF) indicates the relative measure of stress and is mathematically expressed as a percentage:
SF = ( IPP OPP ) ( PME PMC ) × 100
The SF is the price consciousness measure, thus, the consumers’ price sensitivity measure. Stress can appear below or above the IPP. If the IPP is on the right of OPP, a lower level of the latter shows that a portion of customers have a high level of price consciousness and prefer a lower price since they consider the “normal” price already too expensive [129]. Conversely, an OPP between the PME and IPP means the presence of some customers that are willing to accept a price increase. A very small SF indicates that customers are less price-conscious and have a low degree of price sensitivity. Rise in SF indicates a customers’ price awareness increase and a greater degree of price sensitivity. A broad stress price range signals that there is some pressure/stress in price consciousness and that price can be used to segment the market into high and low-price customer clusters [130].
According to Roll et al. [43], a new interpretation of PSM is helpful to provide additional pricing recommendations. The authors suggest that the questions “At what price would you begin to think the product is getting expensive, but you still might consider it?” (expensive curve) reveals the respondent’s WTP. In effect, when the product is starting to get expensive, but the interviewee declares that they still want to buy it, they are actually expressing their maximum willingness to pay. Therefore, using the maximal WTP as elicited via the “expensive” question, it is possible to derive a price response function (PRF) that shows the relationship between alternative prices and the resulting sales quantity. Graphically, it requires the horizontal inversion of the “expensive” curve, resulting in a decreasing PRF.
In effect, the PSM turns its gaze to consumers to give indications to businesses that will only put the product on the market if it is profitable. The PRF provides information on the change of the percentage of customers’ WTP when the price changes. Such information is useful for offers since it gives a measure of the possible variation in revenue (understood as the value of sales) depending on the product’s price. In fact, considering a price in an inelastic point of the PSF, a price decrease should result in a reduction in revenue; vice versa, at a point where the elasticity is positive, a price decrease should lead to an increase in revenue.

3.2. Sampling and Data Collection

This study employed an online survey that was in the field for two months (1 May–30 June 2021). The survey was carried out using a digital questionnaire created with Google Forms and allowed the collection of 320 responses, of which 318 were complete.
The sample is not stratified for inherent characteristics (e.g., social, demographic, economic). This choice derives from the need to interview only people interested in the subject of the investigation, thus minimizing the risk of protest votes. We are aware that this choice may not return a representative sample, but at the same time, the survey is more aimed at fish consumers and/or those genuinely interested in the topic.
It must be underlined that this choice is widely adopted in studies focused on consumer preferences to auto-select the sample according to the real interest in consuming a given good. On the other hand, even by resorting to stratified sampling, the probable exclusion of protest votes still leads to a final sample that may not be fully representative of the reference population.
The questionnaire comprises four parts.
The first concerns a brief explanation of the fish-feeding problems of the aquaculture sector. Specifically, brief information about economic, ecological, social, health, and nutritional benefits was provided. This gives respondents an adequate level of objective knowledge. The information given is as follows:
The increase in the world population, the increased awareness of the significant impact of eating habits on personal health, and the mental and physical health benefits of fish consumption have led to a notable increase in demand for seafood which will reach 28 million tons in 2030. This increase in demand can only be met through fish farming, i.e., aquaculture.
However, the main problem lies in feeding farmed fish, which are still mostly fed with fishmeal today. This entails significant negative impacts not only on the environment but also on the economic and social levels. The unsustainability of this practice has required an urgent rethinking of the protein sources used in fish farming (and beyond).
An alternative has been provided by the European Union, which has recently allowed the breeding of fish with feed derived from some insects.
Recent scientific research has shown that some insects possess numerous properties: the presence of a quantity of proteins, minerals and vitamins very similar to that of fish meal, as well as high in energy, fat and fiber; naturally present in the natural diet of freshwater and marine fish; possibility of local production by small farmers; low environmental impact.
The second grasped the socio-cultural characteristics of the respondents. More specifically, we collected individual information on gender, age, education, and job occupation.
The third aimed to investigate the degree of respondent awareness of the consumption of insects for food purposes. As in Verbeke’s study [53], respondents were given a choice between:
“I have heard of the eating of insects, and I know what it means”;
“I have heard of the eating of insects but actually don’t know what it means”;
“No, I have never heard of the eating of insects”.
The information recorded through this variable gives a proxy of self-reported familiarity with the idea of eating insects. This is very significant because familiarity is a meaningful driver of food choice in general [53,78,131]. Also, since the above selection investigates what a respondent thinks they know about the product, the answer can be used as a proxy of SK.
In the last section, we proposed four questions based on VW prices (expensive, too expensive, cheap, too cheap) for the purchase of a sea bass fed with insect meal. Since the chosen approach allows respondents to express price expectations without any suggestions or indications, no information was provided on the price of conventionally fed fish produced by current Italian fish farming (according to Eumofa [132], it is €9.55).

4. Results

4.1. Sample Profile

The 318 Italian respondents were 51.7% male and 48.3% female; most (42.95%) were aged between 40 and 49 years, respondents of age groups 30–39 and 50–59 were each about 17%, and 8.1% were over 60 years old. As to education level, only 3.4% had no more than lower secondary school, whereas 28.8% of the respondents had an intermediate education level, 38.2% had a university degree, and 29.5% had a postgraduate degree.
The proportion of consumers with a high level of education willing to answer the questionnaire may be indicative of the relevance of Subject Knowledge—probably strongly related to the education—in affecting the willingness to pay for this sort of fish product.
Regarding respondent occupation profiles, most are freelancers (19.1%), 13.2% have a desk job, 12.8% are students, 12.5% are private employees, and 12.2% are university researchers or professors. Most of the interviewees showed that they are familiar with the subject of this study. Indeed, 57.1% of respondents declared to have heard about the possibility of eating insects and to have understood its meaning. Only 10.7% of respondents had never heard of eating insects. The data are reported in Table 2.

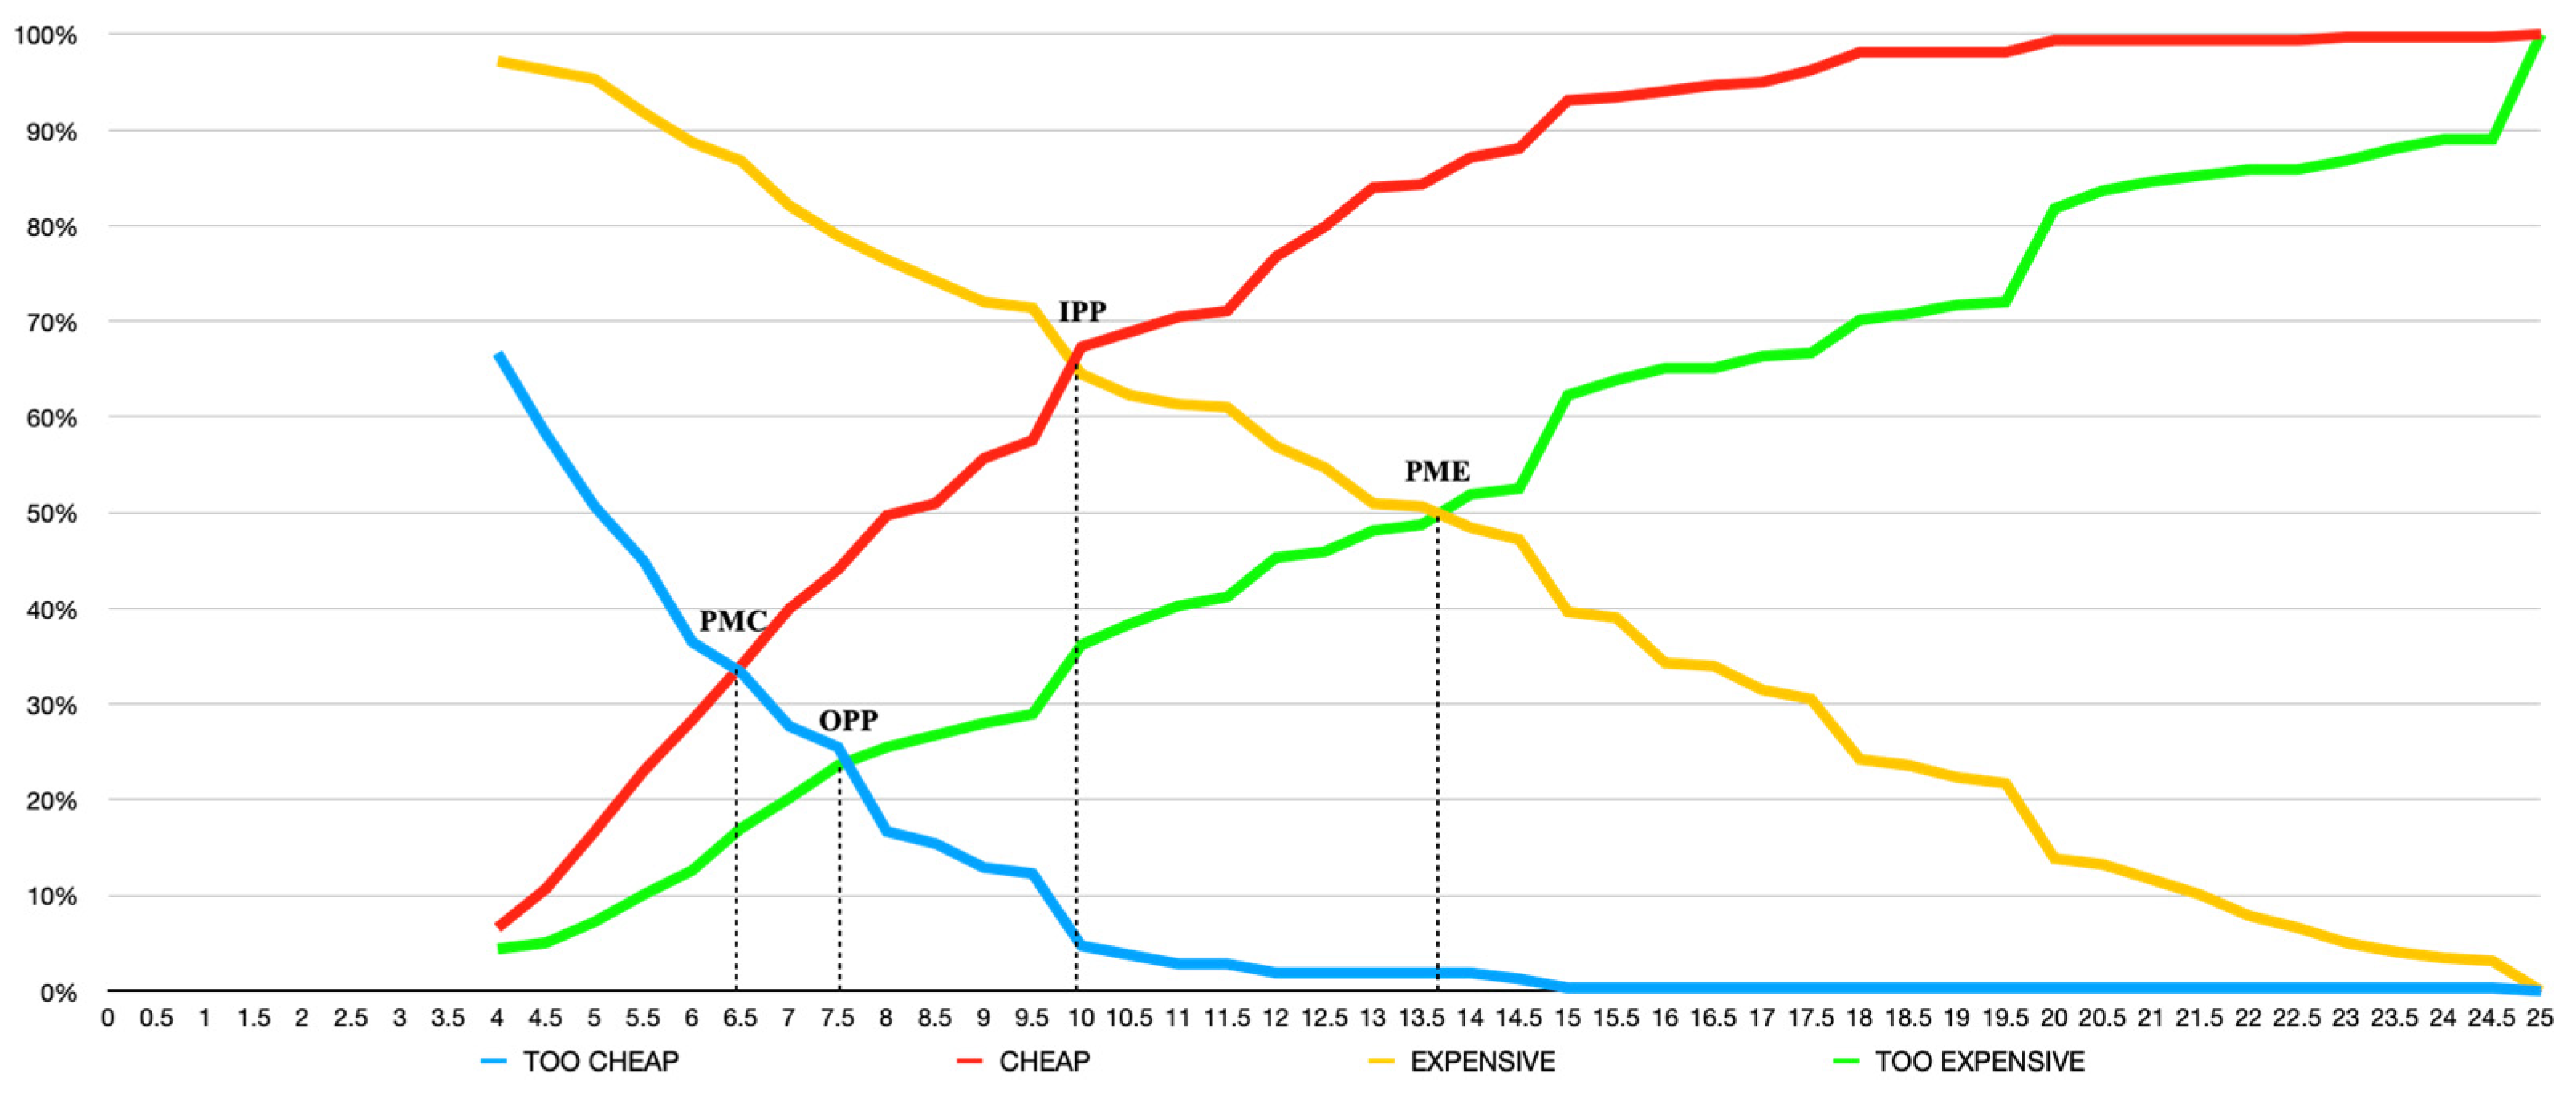
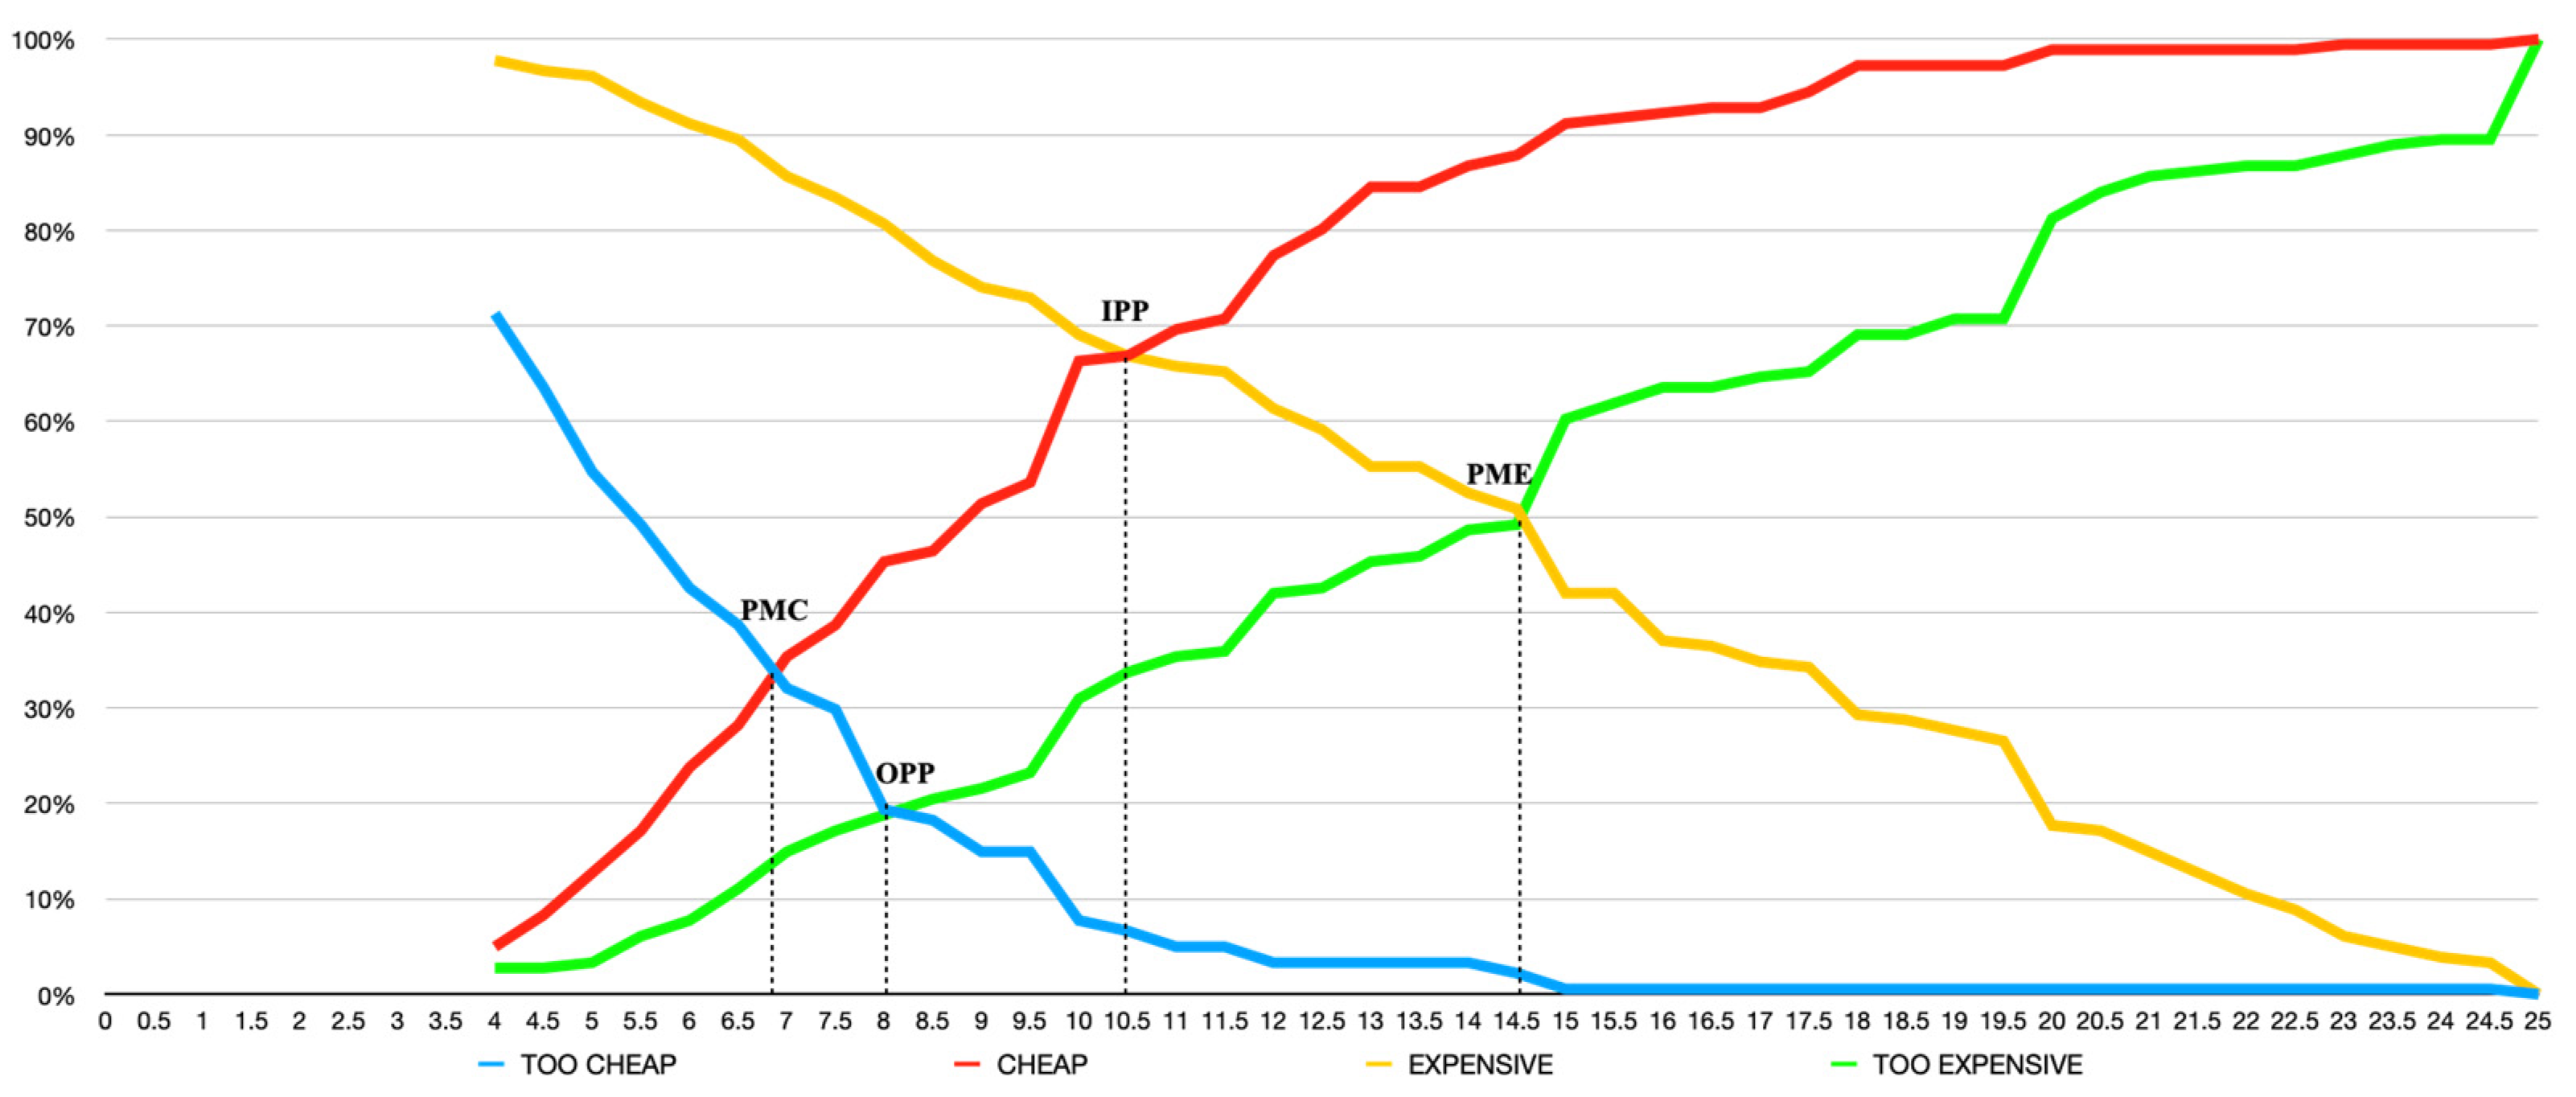
4.2. Acceptable Price Range and Price Thresholds

By comparing pricing thresholds and the range of acceptable prices, useful information over possible price options as perceived by customers was obtained.
The mean value (and standard deviation) of the variables Too cheap, Cheap, Expensive and Too Expensive in € are 6.16 (2.61), 9.26 (4.06), 13.74 (5.83), 14.04 (6.52), respectively. These data show a wide distribution, making it challenging to choose a maximum response price.
Respondents’ data on the four questions asking about price sensitivity were tabulated, and cumulative frequencies were constructed. By plotting the cumulative distributions against the current price on the same chart, price points were interpreted. The data are reported in Figure 2.
Due to the significant effect of product knowledge on consumer behavior, the effect on WTP of different types of knowledge has been analyzed. Since section one of the questionnaire provides information on the use of insects in the aquaculture sector (objective knowledge), WTP differences deriving from SK have been analyzed. The data are reported in Figure 3.
All respondents evaluated the PMC at about 6.5 €, meaning a price lower than that would be viewed as “too cheap”. By contrast, the PME, indicating the upper limit of price acceptance, was 13.5 €. As a result, respondents considered a price range of 6.5–13.5 € as acceptable. The range of possible acceptable prices is greater for consumers who have been shown to have greater SK (6.75—14.5 €). Those consumers indicated as having an upper (PME) and lower (PMC) price threshold higher than other respondents have a higher level of the perceived value inherent in the benefit price ratio of the value. In terms of price thresholds, the price PME profile for consumers with greater SK is more attractive because the price that induces consumers to change their attitudes, purchase intentions, and behaviors is higher. The difference in the PMC is much lower. Table 3 shows the differences found between the total number of respondents and those with high SK.

4.3. Relatively Cheap Price Range and Price Thresholds

The comparison of IPP prices and OPP prices reveals higher price expectations for consumers with greater SK.
If the price is fixed at 10.0 € (or 10.5 € in the case of consumers with high SK), the number of persons who would possibly consider purchasing the product is at a maximum. The relatively high proportion of consumers at IPP for both consumer categories (64% in general and 67% in case of high SK) indicated that they might not react dramatically to price rises or falls [133].
The lines “too cheap” and “too expensive” of “general consumers” intersect at 7.5 €, which describes the OPP. At this point, the cumulative percentage was found to be about 24%, meaning that 76% of respondents consider the price of 7.5 € neither too cheap nor too expensive. At this price level, the resistance against the price of this new product is very low. Having a high SK implies increasing this price point by €0.5.
Since some consumers may perceive the normal price as too much higher than the product’s perceived value or the optimal price, the difference between OPP and IPP is the ground for assessing how consumers perceive the price stress level. In effect, for both consumer categories, the IPP is after the OPP, meaning that a portion of consumers believe the “normal” price (10.00 € and 10.50 €) is already too expensive and may not be willing to pay that price, turning their attention to substitute products in case of price increases from OPP. The proportion of consumers that view European sea bass hypothetically fed with insect meal as expensive increases from OPP (33%) to the IPP (64%) for general consumers and increases from OPP (19%) to the IPP (67%) for consumers with high SK.
Both consumer categories displayed the same positive stress price range (2.50 €) and high values of stress factors (36% and 32%), indicating that all consumers prefer and expect low prices and that the price sensitivity of the customers is high [134]. Consumers with less SK showed a slightly higher stress level, meaning a slight superior price sensitivity, i.e., they would be willing to pay around 36% less than the “normal” market price.

4.4. Price–Response Function

The market response is usually evaluated by measuring how changing the price of a product affects the demand for the product. Figure 4 shows the PRF curves for PSM Expensive. Based on the PRF analysis, price variation determines less than proportionate variations in quantity demanded, except in the last stretch, which is outside the acceptable price range. Both curves tend to be quite elastic and to show a very similar trend, although the demand for sea bass fed with insects among consumers with high knowledge tends to be greater for each price bracket.

5. Discussion and Conclusions

The wide recognition of the need to rethink how humanity can sustainably source food and feed protein, as well as the growing demand of farmed fish, have led political, academic, and commercial interest in Europe and around the world [6,135]. Insects are increasingly recognized as a more-than-valid solution to the sustainability problems that affect the aquaculture sector.
To enable this innovative product to be exchanged on the market (fish fed with insect meal), the role of the consumer is crucial, especially because its purpose is to help foster a sustainable food system [22,23]. Therefore, analyzing the factors determining the demand for more sustainable food is becoming increasingly crucial to achieving sustainable development. In particular, the food needs to be safe, delicious, healthy, and acceptable, but it also has to be affordable for consumers [120].
Based on the intent to push for the inclusion of fish fed with insects in the European market, in consideration of the fact that 62.1% of Italians consumed fish at least a few times per week in 2019 [136], and in recognition of the lack of studies on the WTP of sea bass (the majority species reared in the Mediterranean) and fish fed with insects in general, this study aimed to understand and measure Italian consumers’ opinions towards sustainable attributes in such products via WTP, using the VW model.
This approach allowed for interpretation of consumer responses to find prices that serve as indicators for price sensitivity levels in the market of fish fed with insects. Specifically, this study was able to establish the optimal and indifference price points, as well as the range of acceptable prices and stress range prices.
The IPP, which is an approximation for the perceived “market price” for the product, is 10.00 € for all respondents, slightly higher than the price recorded in 2019 by the Eumofa [132] for conventionally fed fish (9.55 €). Instead, consumers with a high SK are willing to pay nearly 10% more than that price.
However, since the OPP is on the left of IPP, a portion of consumers could believe the “normal” price (10.00 €; 10.50 €) is already too expensive; that is, however, little higher than the price of fish conventionally fed. This suggests that the price differential between insect and fish meals cannot be proposed to consumers who also have a high price sensitivity, as shown in the PRF curve.
Those data offer numerous insights into the willingness of consumers to pay more for fish fed with more sustainable feeds. According to Monroe [137], the higher the perceived quality, the higher the product’s perceived value, and the higher price consumers should be willing to pay. The PSM aims to find an acceptable price as a quality indicator and focus on customer value perceptions, which give consumer information in the form of WTP. Findings showed consumers’ reluctance in paying more for fish fed with insects, which may signal that they may suppose that there is a discrepancy between quality (concerning fish fed with insect) and price applied to the product in the market, not recognizing that it is, in fact, a better-quality product. This could justify the value recorded by the stress factor and the fact that the OPP is on the left of the IPP. Another possible explanation could be that consumers are unaware of the cost of feed and consider fishmeal, being a scarce resource, to be more expensive than insect meal. This could spark a willingness to pay less for fish raised on insect meal. Or again, in a more pessimistic perspective, starting from the main results of studies that focused on consumers’ WTP for sustainable food products, which showed an increased demand and WTP for food products that were perceived as containing attributes associated with some aspect of a sustainable food system [120,138], consumers may not perceive fish fed with insect meal as a sustainable food. In effect, Zander and Feucht [139] found that European consumers are willing to pay an extra 14% for fish with the attribute of “sustainably produced”, although almost half of the sample declared their unwillingness to pay more for sustainable seafood.
Consumers’ perception of being sufficiently aware of what eating an insect meal entails positively affect the PME (+7% than other consumers). This study confirms that SK more strongly motivates purchase-related behaviors than objective knowledge [114] and contrasts with Zander and Feucht [139], who found that higher SK reduced the probability of a medium and high WTP for sustainable seafood, although our findings show a not-very-large level of increase. This can be explained by the fact that habits, past experiences, and cultural factors significantly influence consumer behavior, and as such, also consumers with high SK do not necessarily make sustainable seafood choices [140]. Regardless, the results suggest the importance of SK. Analysis of its level in consumer segments is important “to create promotional appeals with the right amount of informational content” [113]. Moreover, increase in SK—for example, via advertising exposure, interaction with knowledgeable salespeople, or relevant in-store promotions—may influence perceptions of one’s own ability to process information [141] and, ultimately, their WTP for fish fed with insects.
The range of acceptable prices is very wide, with a large difference between upper and lower prices. These results may be related to the innovative character of the analyzed product, as individuals with low product familiarity in terms of market price knowledge, purchase experience, or brand knowledge are less discriminating and show wider acceptable price ranges [142]. Concerning the consumers with high SK, the range of acceptable prices that is greater than 11% more than other consumers is due to the greater shift to the right of the PME (+7%) compared to the change of the PMC (+3%). These data are reflected in the SF, slightly less in individuals with high SK, and in the high price sensitivity.
This study provides several implications for farmers, retail managers, policymakers and academics.
The higher price of insect feed than fish feed cannot be passed on to consumers as they showed high price sensitivity. Therefore, to push insect feed in the aquaculture sector, policymaker must act to decrease its cost for fish farms.
This study offers an understanding of price sensitivity for a new product by identifying the sources of influence for price sensitivity and showing minimal WTP towards premium prices for a different fish feed. This also offers important food for thought to retail managers, whose pricing strategies may rely on consumers’ price sensitivity levels.
Italian large retailers are the main buyers of sea bass, and larger farms may have fewer problems with the use of insect meal if its cost made the fish competitive [12]. As such, agreements between these two operators in the supply chain that aim to increase the production and sale of these innovative products, combined with an adequate campaign of advertising (that emphasizes the advantages of new feed) and price, could leverage people who want “to be among the first to try something”: innovators and early adopters. The latter, according to Rogers [143], show greater sensitivity towards the innovative content of products, advertising, and emotional aspects, and advance the development of the dissemination process.
Because SK positively affected consumer WTP for fish fed with insects, policy developers and fish farmers should contemplate this result. For example, information and promotion campaigns should be targeted at stimulating consumers’ confidence regarding their knowledge of sustainable factors of insect meal and that it poses no health risk for humans. Future research may investigate the means to increase consumers’ SK levels on fish fed with insects. According to previous research that observed SK to be a stronger driver for environmentally-friendly food choices, efforts should be made “not only to provide information for the target consumers, but also to raise general awareness to make shoppers feel that they are informed and equipped to make a better choice for the environment” [144].
One can not underestimate the significance of the result that about 43% of interviewees do not know what it means to or have never heard of eating insects. According to Popoff et al. [145], due to the minimal knowledge about feeds and their environmental impact, most people do not have strong opinions about the subject, so their purchase decisions are based on other factors. A greater awareness and acceptance of insect-based feeds would come as a result of more information. As suggested by previous studies focusing on other types of productions [146,147], when consumers receive information on the environmental, safety, nutritional, and taste aspects of insect-based feeds as protein substitutes and their awareness increases, so does acceptance and willingness to buy products fed with insects, which is also due to the potential differentiation of these products, which influence their purchase preferences. In order to further strengthen such product differentiation, policymakers may ponder the use of mandatory labeling due to its role in consumer choice [148]. The label provides information on product attributes and has been proved to increase the purchase probability of sustainable fish products for these attributes by strengthening consumers’ preferences [149,150]. In such vein, an insect-fed certification could signal high animal welfare standards [151] and attract consumers whose consumption of fish fed with insects is affected by health risk concerns. Increased demand for insect-fed fish could result in a decrease in the price of insect meal, which in turn can push the aquaculture sector to further rely on this innovative feed.
The paper contributes to the literature in several ways. First, as far as we know, this is the first study focused on the price range that is acceptable for fish fed with insect meal. Second, by providing insights into the price-sensitivity and price-response function of consumers for fish fed with insect meal, the paper responds to recent calls for increased insect meal production in aquaculture [6]. Third, to our best knowledge, no previous study analyzed the role of subjective and objective knowledge in the context of fish fed with insects. This study addresses the research calls for consumer studies in food and nutrition that distinguish between subjective and objective consumer knowledge [45], and advances the line of research, still little explored, on the link between both types of knowledge and food choices, especially concerning fish [45,46,47,48].
This study analyzed consumer WTP for fish fed with insects without considering other elements that affect consumers’ price sensitivity, e.g., country of origin, product and storage form, place of purchase, or production method (i.e., conventional, organic, and ASC certified) [24]. Those fish attributes identified as “Credence attributes for sustainable fish products” by Maesano et al. [152], can offer further insight into consumers’ purchasing choices with respect to the price variable. Previous research found consumers give more importance to local production than organic production [153], and a number of studies found that consumers value eco-labeled fish products and are willing to pay a premium for them [152,154,155,156].
Future research may investigate which other factors are operable for widening the range of acceptable pricing and reducing the stress factor. Future research could also repeat the same analysis by verifying possible differences in curves intersections if the alternative feed was of vegetable or poultry origin. Another limitation, like almost all consumer WTP studies, concerns the so-called attitude–behavior gap, which is the discrepancy between stated and revealed or real WTP [157,158,159]. Finally, the respondents in this study were more educated, with implications for our findings, that limit the study’s application to the Italian population at large. It would be interesting to extend the questionnaires to other countries. Despite these limitations, this study’s implications remain important and should be acknowledged.

Author Contributions

Conceptualization, B.A., R.F., F.A.M. and P.P.; methodology, B.A. and F.A.M.; formal analysis, B.A. and F.A.M.; investigation, B.A. and F.A.M.; writing—original draft preparation, B.A. and F.A.M.; writing—review and editing, B.A., R.F., F.A.M. and P.P.; supervision, F.A.M. and P.P.; project administration, F.A.M. and P.P.; funding acquisition, F.A.M. and P.P. All authors have read and agreed to the published version of the manuscript.

Funding

This research was funded by Finanziamento straordinario una tantum per la ricerca 2019, Fondo di Ateneo di Sassari grant number FAR2019PULINAP.

Institutional Review Board Statement

Ethical review and approval were waived for this study as no sensitive data were collected. In addition, all data were collected anonymously.

Informed Consent Statement

Informed consent was obtained from all participants involved in the study.

Data Availability Statement

Not applicable.

Conflicts of Interest

The authors declare no conflict of interest.

Abbreviations

IPPIndifference price point
OPPOptimal price point
PMCPoint of marginal cheapness
PMEPoint of marginal expensiveness
PMSPrice Sensitivity Meter
PRFPrice Response Function
RAPRange of acceptable price
RRCPRange of relatively cheap price
RREPRange of relatively expensive price
RSPRange of stress price
SFStress Factor
SKSubjective Knowledge
SPRStress Price Range
VWVan Westendorp
WTPWillingness To Pay

References

  1. Naylor, R.L.; Goldburg, R.J.; Primavera, J.H.; Kautsky, N.; Beveridge, M.C.M.; Clay, J.; Folke, C.; Lubchenco, J.; Mooney, H.; Troell, M. Effect of aquaculture on world fish supplies. Nature 2000, 405, 1017–1024. [Google Scholar] [CrossRef] [PubMed] [Green Version]
  2. FAO. The State of World Fisheries and Aquaculture 2020; FAO: Rome, Italy, 2020; ISBN 978-92-5-132692-3. [Google Scholar]
  3. Hei, A. Mental Health Benefits of Fish Consumption. Clin. Schizophr. Relat. Psychoses 2020, 15, 5. [Google Scholar]
  4. Magalhães, R.; Sánchez-López, A.; Leal, R.S.; Martínez-Llorens, S.; Oliva-Teles, A.; Peres, H. Black soldier fly (Hermetia illucens) pre-pupae meal as a fish meal replacement in diets for European seabass (Dicentrarchus labrax). Aquaculture 2017, 476, 79–85. [Google Scholar] [CrossRef]
  5. Arru, B.; Furesi, R.; Gasco, L.; Madau, F.; Pulina, P. The Introduction of Insect Meal into Fish Diet: The First Economic Analysis on European Sea Bass Farming. Sustainability 2019, 11, 1697. [Google Scholar] [CrossRef] [Green Version]
  6. Llagostera, P.F.; Kallas, Z.; Reig, L.; de Gea, D.A. The use of insect meal as a sustainable feeding alternative in aquaculture: Current situation, Spanish consumers’ perceptions and willingness to pay. J. Clean. Prod. 2019, 229, 10–21. [Google Scholar] [CrossRef]
  7. Musyoka, S.N.; Liti, D.M.; Ogello, E.; Waidbacher, H. Utilization of the earthworm, Eisenia fetida (Savigny, 1826) as an alternative protein source in fish feeds processing: A review. Aquac. Res. 2019, 50, 2301–2315. [Google Scholar] [CrossRef] [Green Version]
  8. Oliva-Teles, A.; Enes, P.; Peres, H. Replacing Fishmeal and Fish Oil in Industrial Aquafeeds for Carnivorous Fish. In Feed and Feeding Practices in Aquaculture; Woodhead Publishing Series in Food Science, Technology and Nutrition; Woodhead Publishing: Cambridge, UK, 2015; pp. 203–233. ISBN 978-0-08-100506-4. [Google Scholar]
  9. Food And Agriculture Organization (FAO). The State of World Fisheries and Aquaculture: 2018—Meeting the Sustainable Development Goals; FAO: Rome, Italy, 2018; ISBN 978-92-5-130562-1. [Google Scholar]
  10. Gasco, L.; Gai, F.; Maricchiolo, G.; Genovese, L.; Ragonese, S.; Bottari, T.; Caruso, G. Fishmeal Alternative Protein Sources for Aquaculture Feeds. In Feeds for the Aquaculture Sector; Springer: Berlin/Heidelberg, Germany, 2018; pp. 1–28. ISBN 978-3-319-77941-6. [Google Scholar]
  11. Salin, K.R.; Arun, V.; Nair, C.M.; Tidwell, J.H. Sustainable Aquafeed. In Sustainable Aquaculture; Applied Environmental Science and Engineering for a Sustainable Future; Springer: Cham, Switzerland, 2018; pp. 123–151. ISBN 978-3-319-73256-5. [Google Scholar]
  12. Mulazzani, L.; Madau, F.A.; Pulina, P.; Malorgio, G. Acceptance of insect meal in aquaculture feeding: A stakeholder analysis for the Italian supply chains of trout and seabass. J. World Aquac. Soc. 2021, 52, 378–394. [Google Scholar] [CrossRef]
  13. Roma, R.; Palmisano, G.O.; De Boni, A. Insects as Novel Food: A Consumer Attitude Analysis through the Dominance-Based Rough Set Approach. Foods 2020, 9, 387. [Google Scholar] [CrossRef] [Green Version]
  14. Borrello, M.; Lombardi, A.; Pascucci, S.; Cembalo, L. The Seven Challenges for Transitioning into a Bio-based Circular Economy in the Agri-food Sector. Recent Patents Food, Nutr. Agric. 2016, 8, 39–47. [Google Scholar] [CrossRef]
  15. van Zanten, H.H.; Mollenhorst, H.; Oonincx, D.; Bikker, P.; Meerburg, B.; De Boer, I. From environmental nuisance to environmental opportunity: Housefly larvae convert waste to livestock feed. J. Clean. Prod. 2015, 102, 362–369. [Google Scholar] [CrossRef]
  16. Henry, M.; Gasco, L.; Piccolo, G.; Fountoulaki, E. Review on the use of insects in the diet of farmed fish: Past and future. Anim. Feed Sci. Technol. 2015, 203, 1–22. [Google Scholar] [CrossRef]
  17. Oonincx, D.G.A.B.; de Boer, I.J.M. Environmental Impact of the Production of Mealworms as a Protein Source for Humans—A Life Cycle Assessment. PLoS ONE 2012, 7, e51145. [Google Scholar] [CrossRef] [PubMed] [Green Version]
  18. Moruzzo, R.; Mancini, S.; Guidi, A. Edible Insects and Sustainable Development Goals. Insects 2021, 12, 557. [Google Scholar] [CrossRef] [PubMed]
  19. Derler, H.; Lienhard, A.; Berner, S.; Grasser, M.; Posch, A.; Rehorska, R. Use Them for What They Are Good at: Mealworms in Circular Food Systems. Insects 2021, 12, 40. [Google Scholar] [CrossRef]
  20. Madau, F.A.; Arru, B.; Furesi, R.; Pulina, P. Insect Farming for Feed and Food Production from a Circular Business Model Perspective. Sustainability 2020, 12, 5418. [Google Scholar] [CrossRef]
  21. Ojha, S.; Bußler, S.; Schlüter, O.K. Food waste valorisation and circular economy concepts in insect production and processing. Waste Manag. 2020, 118, 600–609. [Google Scholar] [CrossRef] [PubMed]
  22. Azzurra, A.; Massimiliano, A.; Angela, M. Measuring sustainable food consumption: A case study on organic food. Sustain. Prod. Consum. 2019, 17, 95–107. [Google Scholar] [CrossRef]
  23. Yi, S. Determinants of Consumers’ Purchasing Behavior for Certified Aquaculture Products in South Korea. Sustainability 2019, 11, 3840. [Google Scholar] [CrossRef] [Green Version]
  24. Ankamah-Yeboah, I.; Jacobsen, J.B.; Olsen, S. Innovating out of the fishmeal trap: The Role of Insect-Based Fish Feed in Consumers’ Preferences for Fish Attributes. Br. Food J. 2018, 120, 2395–2410. [Google Scholar] [CrossRef] [Green Version]
  25. De-Magistris, T.; Gracia, A. Consumers’ willingness-to-pay for sustainable food products: The case of organically and locally grown almonds in Spain. J. Clean. Prod. 2016, 118, 97–104. [Google Scholar] [CrossRef]
  26. Vecchio, R.; Annunziata, A. Willingness-to-pay for sustainability-labelled chocolate: An experimental auction approach. J. Clean. Prod. 2015, 86, 335–342. [Google Scholar] [CrossRef]
  27. European Commission. Farm to Fork Strategy for a Fair, Healthy and Environmentally-Friendly Food System. 2020. Available online: https://ec.europa.eu/food/system/files/2020-05/f2f_action-plan_2020_strategy-info_en.pdf (accessed on 1 May 2022).
  28. Nazzaro, C.; Lerro, M.; Stanco, M.; Marotta, G. Do consumers like food product innovation? An analysis of willingness to pay for innovative food attributes. Br. Food J. 2019, 121, 1413–1427. [Google Scholar] [CrossRef]
  29. Ceylana, H.H.; Koseb, B.; Aydin, M. Value based Pricing: A Research on Service Sector Using Van Westendorp Price Sensitivity Scale. Procedia Soc. Behav. Sci. 2014, 148, 1–6. [Google Scholar] [CrossRef] [Green Version]
  30. de Medeiros, J.F.; Ribeiro, J.L.D.; Cortimiglia, M.N. Influence of perceived value on purchasing decisions of green products in Brazil. J. Clean. Prod. 2016, 110, 158–169. [Google Scholar] [CrossRef]
  31. Li, Y.; Lu, Y.; Zhang, X.; Liu, L.; Wang, M.; Jiang, X. Propensity of green consumption behaviors in representative cities in China. J. Clean. Prod. 2016, 133, 1328–1336. [Google Scholar] [CrossRef]
  32. Moser, A.K. Consumers’ purchasing decisions regarding environmentally friendly products: An empirical analysis of German consumers. J. Retail. Consum. Serv. 2016, 31, 389–397. [Google Scholar] [CrossRef]
  33. Steenhuis, I.H.; Waterlander, W.E.; de Mul, A. Consumer food choices: The role of price and pricing strategies. Public Health Nutr. 2011, 14, 2220–2226. [Google Scholar] [CrossRef] [Green Version]
  34. Ingenbleek, P.T.M.; Frambach, R.T.; Verhallen, T.M.M. Best Practices for New Product Pricing: Impact on Market Performance and Price Level under Different Conditions. J. Prod. Innov. Manag. 2013, 30, 560–573. [Google Scholar] [CrossRef]
  35. Steiner, M.; Eggert, A.; Ulaga, W.; Backhaus, K. Do customized service packages impede value capture in industrial markets? J. Acad. Mark. Sci. 2016, 44, 151–165. [Google Scholar] [CrossRef]
  36. Steiner, M.; Hendus, J. How Consumers’ Willingness to Pay Is Measured in Practice: An Empirical Analysis of Common Approaches’ Relevance. SSRN 2012, 1–7. [Google Scholar] [CrossRef]
  37. Winer, R.S. Pricing; Marketing Science Institute: Cambridge, UK, 2005; ISBN 978-0-9657114-6-3. [Google Scholar]
  38. Van Westendorp, P.H. NSS Price Sensitivity Meter (PSM)–A New Approach to Study Consumer Perception of Prices. In Proceedings of the 29th ESOMAR Congress, Venice, Italy, 5–9 September 1976; pp. 139–167. [Google Scholar]
  39. Chhabra, S. Determining the Optimal Price Point: Using Van Westendorp’s Price Sensitivity Meter. In Managing in Recovering Markets. Springer Proceedings in Business and Economics; Springer: New Delhi, India, 2015; pp. 257–270. [Google Scholar] [CrossRef]
  40. Lipovetsky, S. Van Westendorp Price Sensitivity in Statistical Modeling. Int. J. Oper. Quant. Manag. 2006, 12, 1–16. [Google Scholar]
  41. Lyon, D.W. The Price Is Right (or Is It?). Mark. Res. 2002, 14, 8–13. [Google Scholar]
  42. Wang, T.; Venkatesh, R.; Chatterjee, R. Reservation Price as a Range: An Incentive-Compatible Measurement Approach. J. Mark. Res. 2007, 44, 200–213. [Google Scholar] [CrossRef] [Green Version]
  43. Roll, O.; Achterberg, L.-H.; Herbert, K.-G. Innovative Approaches to Analyzing the Price Sensitivity Meter: Results of an International Comparative Study. In Combi 2010 Conference Proceedings; Edita Prima Oy: Helsinki, Finland, 2010; pp. 181–193. ISBN 978-951-799-213-8. [Google Scholar]
  44. FEAP European Aquaculture Production Report 2014–2019. 2020. Available online: http://feap.info/wp-content/uploads/2020/12/20201218_feap-production-report-2020.pdf (accessed on 28 April 2022).
  45. Pieniak, Z.; Verbeke, W.; Scholderer, J. Health-related beliefs and consumer knowledge as determinants of fish consumption. J. Hum. Nutr. Diet. Off. J. Br. Diet. Assoc. 2010, 23, 480–488. [Google Scholar] [CrossRef]
  46. Demartini, E.; Vecchiato, D.; Marescotti, M.E.; Gibbert, M.; Viganò, R.; Giacomelli, S.; Gaviglio, A. The more you know: The equivocal effects of prior knowledge on preferences for hunted vs. farmed wild boar meat. Int. J. Gastron. Food Sci. 2021, 24, 100325. [Google Scholar] [CrossRef]
  47. Zhang, M.; Liu, G.-L. The effects of consumer’s subjective and objective knowledge on perceptions and attitude towards genetically modified foods: Objective knowledge as a determinant. Int. J. Food Sci. Technol. 2015, 50, 1198–1205. [Google Scholar] [CrossRef]
  48. Altintzoglou, T.; Heide, M. Fish Quality and Consumers: How Do Consumers’ Knowledge about and Involvement in Fish Quality Define Factors That Influence Fish Buying Behavior? J. Aquat. Food Prod. Technol. 2016, 25, 885–894. [Google Scholar] [CrossRef]
  49. Zucchella, A.; Previtali, P. Circular business models for sustainable development: A “waste is food” restorative ecosystem. Bus. Strat. Environ. 2019, 28, 274–285. [Google Scholar] [CrossRef]
  50. Zielińska, E.; Zieliński, D.; Karaś, M.; Jakubczyk, A. Exploration of consumer acceptance of insects as food in Poland. J. Insects Food Feed 2020, 6, 383–392. [Google Scholar] [CrossRef]
  51. Megido, R.C.; Gierts, C.; Blecker, C.; Brostaux, Y.; Haubruge, É.; Alabi, T.; Francis, F. Consumer acceptance of insect-based alternative meat products in Western countries. Food Qual. Prefer. 2016, 52, 237–243. [Google Scholar] [CrossRef]
  52. Imathiu, S. Benefits and food safety concerns associated with consumption of edible insects. NFS J. 2019, 18, 1–11. [Google Scholar] [CrossRef]
  53. Verbeke, W. Profiling consumers who are ready to adopt insects as a meat substitute in a Western society. Food Qual. Prefer. 2015, 39, 147–155. [Google Scholar] [CrossRef]
  54. House, J. Consumer acceptance of insect-based foods in the Netherlands: Academic and commercial implications. Appetite 2016, 107, 47–58. [Google Scholar] [CrossRef] [PubMed] [Green Version]
  55. Hartmann, C.; Siegrist, M. Development and validation of the Food Disgust Scale. Food Qual. Preference 2018, 63, 38–50. [Google Scholar] [CrossRef]
  56. Bodenheimer, F.S. Insects as Human Food: A Chapter of the Ecology of Man; Dr W Junk Publisher: The Huage, The Netherlands, 1951. [Google Scholar]
  57. Looy, H.; Dunkel, F.V.; Wood, J.R. How then shall we eat? Insect-eating attitudes and sustainable foodways. Agric. Hum. Values 2014, 31, 131–141. [Google Scholar] [CrossRef]
  58. Ramos-Elorduy, J. Anthropo-entomophagy: Cultures, evolution and sustainability. Entomol. Res. 2009, 39, 271–288. [Google Scholar] [CrossRef]
  59. Hartmann, C.; Shi, J.; Giusto, A.; Siegrist, M. The psychology of eating insects: A cross-cultural comparison between Germany and China. Food Qual. Prefer. 2015, 44, 148–156. [Google Scholar] [CrossRef]
  60. Ruby, M.B.; Rozin, P.; Chan, C. Determinants of willingness to eat insects in the USA and India. J. Insects Food Feed 2015, 1, 215–225. [Google Scholar] [CrossRef]
  61. Bondoc, I. The Veterinary Sanitary Control of Fish and Fisheries Products. In Control of Products and Food of Animal Origin (Controlul Produselor Și Alimentelor de Origine Animală—Original Title); Ion Ionescu de la Brad, Iași Publishing: Iași, Romania, 2014; Volume I, pp. 264–346. ISBN 978-973-147-139-6. [Google Scholar]
  62. Bondoc, I.; Șindilar, E.V. Veterinary Sanitary Control of Food Quality and Hygiene (Controlul Sanitar Veterinar al Calității Și Salubrității Alimentelor—Original Title); Ion Ionescu de la Brad, Iaşi Publishing: Iași, Romania, 2002; Volume I, pp. 151–166. ISBN 973-8014-64-6. [Google Scholar]
  63. Caparros Megido, R.; Sablon, L.; Geuens, M.; Brostaux, Y.; Alabi, T.; Blecker, C.; Drugmand, D.; Haubruge, É.; Francis, F. Edible Insects Acceptance by Belgian Consumers: Promising Attitude for Entomophagy Development. J. Sens. Stud. 2014, 29, 14–20. [Google Scholar] [CrossRef]
  64. Govorushko, S. Global status of insects as food and feed source: A review. Trends Food Sci. Technol. 2019, 91, 436–445. [Google Scholar] [CrossRef]
  65. Hartmann, C.; Siegrist, M. Consumer perception and behaviour regarding sustainable protein consumption: A systematic review. Trends Food Sci. Technol. 2017, 61, 11–25. [Google Scholar] [CrossRef]
  66. Tan, H.S.G. Eating Insects: Consumer Acceptance of a Culturally Inappropriate Food; Wageningen University: Wageningen, The Netherlands, 2017. [Google Scholar] [CrossRef]
  67. Tani, Y.; Hashimoto, S.; Ochiai, M. What makes rural, traditional, cultures more sustainable? Implications from conservation efforts in mountainous rural communities of Japan. Landsc. Res. 2016, 41, 892–905. [Google Scholar] [CrossRef]
  68. Borrello, M.; Caracciolo, F.; Lombardi, A.; Pascucci, S.; Cembalo, L. Consumers’ Perspective on Circular Economy Strategy for Reducing Food Waste. Sustainability 2017, 9, 141. [Google Scholar] [CrossRef] [Green Version]
  69. Gasco, L.; Biancarosa, I.; Liland, N.S. From waste to feed: A review of recent knowledge on insects as producers of protein and fat for animal feeds. Curr. Opin. Green Sustain. Chem. 2020, 23, 67–79. [Google Scholar] [CrossRef]
  70. Verbeke, W.; Spranghers, T.; De Clercq, P.; De Smet, S.; Sas, B.; Eeckhout, M. Insects in animal feed: Acceptance and its determinants among farmers, agriculture sector stakeholders and citizens. Anim. Feed Sci. Technol. 2015, 204, 72–87. [Google Scholar] [CrossRef]
  71. Orsi, L.; Voege, L.L.; Stranieri, S. Eating edible insects as sustainable food? Exploring the determinants of consumer acceptance in Germany. Food Res. Int. 2019, 125, 108573. [Google Scholar] [CrossRef]
  72. Schiemer, C.; Halloran, A.; Jespersen, K.; Kaukua, P. Marketing Insects: Superfood or Solution-Food? In Edible Insects in Sustainable Food Systems; Springer: Cham, Switzerland, 2018; pp. 213–236. ISBN 978-3-319-74011-9. [Google Scholar]
  73. de Boer, J.; Schösler, H.; Boersema, J.J. Motivational differences in food orientation and the choice of snacks made from lentils, locusts, seaweed or “hybrid” meat. Food Qual. Prefer. 2013, 28, 32–35. [Google Scholar] [CrossRef]
  74. Tan, H.S.G.; House, J. Consumer Acceptance of Insects as Food: Integrating Psychological and Socio-cultural Perspectives. In Edible Insects in Sustainable Food Systems; Springer International Publishing: Cham, Switzerland, 2018; pp. 375–386. [Google Scholar] [CrossRef]
  75. Tan, H.S.G.; Tibboel, C.J.; Stieger, M. Why do unusual novel foods like insects lack sensory appeal? Investigating the underlying sensory perceptions. Food Qual. Preference 2017, 60, 48–58. [Google Scholar] [CrossRef]
  76. Costa-Neto, E.M.; Dunkel, F. Insects as Food: History, Culture, and Modern Use around the World. In Insects as Sustainable Food Ingredients—Production, Processing and Food Applications; Elsevier: Amsterdam, The Netherlands, 2016; pp. 29–60. ISBN 978-0-12-802856-8. [Google Scholar]
  77. Caparros Megido, R.; Haubruge, É.; Francis, F. Insects, the next European Foodie Craze? In Edible Insects in Sustainable Food Systems; Springer: Cham, Switzerland, 2018; pp. 353–361. ISBN 978-3-319-74011-9. [Google Scholar]
  78. Hartmann, C.; Siegrist, M. Becoming an insectivore: Results of an experiment. Food Qual. Prefer. 2016, 51, 118–122. [Google Scholar] [CrossRef]
  79. Gmuer, A.; Guth, J.N.; Hartmann, C.; Siegrist, M. Effects of the degree of processing of insect ingredients in snacks on expected emotional experiences and willingness to eat. Food Qual. Prefer. 2016, 54, 117–127. [Google Scholar] [CrossRef]
  80. Lensvelt, E.; Steenbekkers, L.P.A. Exploring Consumer Acceptance of Entomophagy: A Survey and Experiment in Australia and the Netherlands. Ecol. Food Nutr. 2014, 53, 543–561. [Google Scholar] [CrossRef] [PubMed]
  81. Menozzi, D.; Sogari, G.; Veneziani, M.; Simoni, E.; Mora, C. Eating novel foods: An application of the Theory of Planned Behaviour to predict the consumption of an insect-based product. Food Qual. Preference 2017, 59, 27–34. [Google Scholar] [CrossRef]
  82. Meixner, O.; von Pfalzen, L.M. Die Akzeptanz von Insekten in Der Ernährung: Eine Studie Zur Vermarktung von Insekten Als Lebensmittel Aus Konsumentensicht; Springer: Heidelberg/Berlin, Germany, 2018; ISBN 3-658-21336-1. [Google Scholar]
  83. Piha, S.; Pohjanheimo, T.; Lähteenmäki-Uutela, A.; Křečková, Z.; Otterbring, T. The effects of consumer knowledge on the willingness to buy insect food: An exploratory cross-regional study in Northern and Central Europe. Food Qual. Prefer. 2018, 70, 1–10. [Google Scholar] [CrossRef]
  84. Shockley, M.; Dossey, A.T. Insects for Human Consumption. In Mass Production of Beneficial Organisms: Invertebrates and Entomopathogens; Academic Press: London, UK, 2013; pp. 617–652. ISBN 0-12-391415-9. [Google Scholar]
  85. Sogari, G.; Menozzi, D.; Mora, C. Exploring young foodies’ knowledge and attitude regarding entomophagy: A qualitative study in Italy. Int. J. Gastron. Food Sci. 2017, 7, 16–19. [Google Scholar] [CrossRef]
  86. Tan, H.S.G.; Fischer, A.R.; Tinchan, P.; Stieger, M.; Steenbekkers, L.; van Trijp, H.C. Insects as food: Exploring cultural exposure and individual experience as determinants of acceptance. Food Qual. Prefer. 2015, 42, 78–89. [Google Scholar] [CrossRef]
  87. Van Huis, A.; Van Itterbeeck, J.; Klunder, H.; Mertens, E.; Halloran, A.; Muir, G.; Vantomme, P. Edible Insects: Future Prospects for Food and Feed Security; Food and Agriculture Organization of the United Nations (FAO): Rome, Italy, 2013; ISBN 92-5-107596-4. [Google Scholar]
  88. Tan, H.S.G.; Fischer, A.R.; van Trijp, H.C.; Stieger, M. Tasty but nasty? Exploring the role of sensory-liking and food appropriateness in the willingness to eat unusual novel foods like insects. Food Qual. Prefer. 2016, 48, 293–302. [Google Scholar] [CrossRef]
  89. Van Thielen, L.; Vermuyten, S.; Storms, B.; Rumpold, B.; Van Campenhout, L. Consumer acceptance of foods containing edible insects in Belgium two years after their introduction to the market. J. Insects Food Feed 2019, 5, 35–44. [Google Scholar] [CrossRef]
  90. Verneau, F.; Caracciolo, F.; Coppola, A.; Lombardi, P. Consumer fears and familiarity of processed food. The value of information provided by the FTNS. Appetite 2014, 73, 140–146. [Google Scholar] [CrossRef]
  91. Verneau, F.; La Barbera, F.; Kolle, S.; Amato, M.; Del Giudice, T.; Grunert, K. The effect of communication and implicit associations on consuming insects: An experiment in Denmark and Italy. Appetite 2016, 106, 30–36. [Google Scholar] [CrossRef]
  92. Baker, M.A.; Shin, J.T.; Kim, Y.W. Customer Acceptance, Barriers, and Preferences in the US. In Edible Insects in Sustainable Food Systems; Springer: Cham, Switzerland, 2018; pp. 387–399. ISBN 978-3-319-74011-9. [Google Scholar]
  93. Gamborg, C.; Röcklinsberg, H.; Gjerris, M. Sustainable Proteins? Values Related to Insects in Food Systems. In Edible Insects in Sustainable Food Systems; Springer: Cham, Switzerland, 2018; pp. 199–211. [Google Scholar] [CrossRef]
  94. Kostecka, J.; Konieczna, K.; Cunha, L. Evaluation of insect-based food acceptance by representatives of polish consumers in the context of natural resources processing retardation. J. Ecol. Eng. 2017, 18, 166–174. [Google Scholar] [CrossRef] [Green Version]
  95. Dossey, A.T.; Tatum, J.T.; McGill, W.L. Modern Insect-Based Food Industry: Current Status, Insect Processing Technology, and Recommendations Moving Forward. In Insects as Sustainable Food Ingredients; Dossey, A.T., Morales-Ramos, J.A., Rojas, M.G., Eds.; Academic Press: San Diego, CA, USA, 2016; pp. 113–152. ISBN 978-0-12-802856-8. [Google Scholar]
  96. La Barbera, F.; Verneau, F.; Amato, M.; Grunert, K. Understanding Westerners’ disgust for the eating of insects: The role of food neophobia and implicit associations. Food Qual. Prefer. 2018, 64, 120–125. [Google Scholar] [CrossRef]
  97. Cavallo, C.; Materia, V.C. Insects or Not Insects? Dilemmas or Attraction for Young Generations: A Case in Italy. Int. J. Food Syst. Dyn. 2018, 9, 226–239. [Google Scholar] [CrossRef]
  98. Monteleone, E.; Spinelli, S.; Dinnella, C.; Endrizzi, I.; Laureati, M.; Pagliarini, E.; Sinesio, F.; Gasperi, F.; Torri, L.; Aprea, E.; et al. Exploring influences on food choice in a large population sample: The Italian Taste project. Food Qual. Preference 2017, 59, 123–140. [Google Scholar] [CrossRef]
  99. Gere, A.; Székely, G.; Kovács, S.; Kókai, Z.; Sipos, L. Readiness to adopt insects in Hungary: A case study. Food Qual. Prefer. 2017, 59, 81–86. [Google Scholar] [CrossRef]
  100. Schlup, Y.; Brunner, T. Prospects for insects as food in Switzerland: A tobit regression. Food Qual. Prefer. 2018, 64, 37–46. [Google Scholar] [CrossRef]
  101. Wilkinson, K.; Muhlhausler, B.; Motley, C.; Crump, A.; Bray, H.; Ankeny, R. Australian Consumers’ Awareness and Acceptance of Insects as Food. Insects 2018, 9, 44. [Google Scholar] [CrossRef] [Green Version]
  102. Meehan, J.; Simonetto, M.; Montan, L.; Goodin, C. Pricing and Profitability Management: A Practical Guide for Business Leaders; John Wiley & Sons: Hoboken, NJ, USA, 2011; ISBN 978-0-470-82705-5. [Google Scholar]
  103. Lambin, J.-J.; Ostillio, M.C. Marketing; McGraw-Hill Education: Milan, Spain, 1991; ISBN 88-386-0626-9. [Google Scholar]
  104. Shoemaker, S.; Lewis, R.C.; Yesawich, P.C.; Chambers, R.E. Marketing Leadership in Hospitality and Tourism: Strategies and Tactics for Competitive Advantage; Pearson Prentice Hall: Upper Saddle River, NJ, USA, 2007; ISBN 0-13-118240-4. [Google Scholar]
  105. Lichtenstein, D.R.; Ridgway, N.M.; Netemeyer, R.G. Price Perceptions and Consumer Shopping Behavior: A Field Study. J. Mark. Res. 1993, 30, 234–245. [Google Scholar] [CrossRef]
  106. Zeithaml, V.A.; Bitner, M.J.; Gremler, D.D. Services Marketing: Integrating Customer Focus across the Firm; McGraw-Hill Education: London, UK, 2018; ISBN 0-07-811210-9. [Google Scholar]
  107. Wathieu, L.; Bertini, M. Price as a Stimulus to Think: The Case for Willful Overpricing. Mark. Sci. 2007, 26, 118–129. [Google Scholar] [CrossRef] [Green Version]
  108. Monroe, K.B. Buyers’ Subjective Perceptions of Price. J. Mark. Res. 1973, 10, 70–80. [Google Scholar] [CrossRef]
  109. Anderson, E.W. Customer satisfaction and price tolerance. Mark. Lett. 1996, 7, 265–274. [Google Scholar] [CrossRef] [Green Version]
  110. East, R.; Singh, J.; Wright, M.; Vanhuele, M. Consumer Behaviour: Applications in Marketing; SAGE: London, UK, 2016; ISBN 978-1-4739-1935-8. [Google Scholar]
  111. Tully, S.M.; Winer, R.S. The Role of the Beneficiary in Willingness to Pay for Socially Responsible Products: A Meta-analysis. J. Retail. 2014, 90, 255–274. [Google Scholar] [CrossRef]
  112. Rao, A.R.; Monroe, K.B. The Moderating Effect of Prior Knowledge on Cue Utilization in Product Evaluations. J. Consum. Res. 1988, 15, 253–264. [Google Scholar] [CrossRef]
  113. Flynn, L.R.; Goldsmith, R.E. A Short, Reliable Measure of Subjective Knowledge. J. Bus. Res. 1999, 46, 57–66. [Google Scholar] [CrossRef]
  114. Selnes, F. Subjective and Objective Measures of Product Knowledge Contrasted. ACR N. Am. Adv. 1986, 13, 67–71. [Google Scholar]
  115. Park, C.W.; Mothersbaugh, D.L.; Feick, L. Consumer Knowledge Assessment. J. Consum. Res. 1994, 21, 71–82. [Google Scholar] [CrossRef]
  116. Barber, N.; Dodd, T.; Ghiselli, R. Capturing the Younger Wine Consumer. J. Wine Res. 2008, 19, 123–141. [Google Scholar] [CrossRef]
  117. Dodd, T.H.; Laverie, D.A.; Wilcox, J.F.; Duhan, D.F. Differential Effects of Experience, Subjective Knowledge, and Objective Knowledge on Sources of Information used in Consumer Wine Purchasing. J. Hosp. Tour. Res. 2005, 29, 3–19. [Google Scholar] [CrossRef]
  118. Raju, P.; Lonial, S.C.; Mangold, W.G. Differential Effects of Subjective Knowledge, Objective Knowledge, and Usage Experience on Decision Making: An Exploratory Investigation. J. Consum. Psychol. 1995, 4, 153–180. [Google Scholar] [CrossRef]
  119. Han, T.-I. Objective knowledge, subjective knowledge, and prior experience of organic cotton apparel. Fash. Text. 2019, 6, 4. [Google Scholar] [CrossRef] [Green Version]
  120. Li, S.; Kallas, Z. Meta-analysis of consumers’ willingness to pay for sustainable food products. Appetite 2021, 163, 105239. [Google Scholar] [CrossRef]
  121. Miller, K.M.; Hofstetter, R.; Krohmer, H.; Zhang, Z.J. How Should Consumers’ Willingness to Pay be Measured? An Empirical Comparison of State-of-the-Art Approaches. J. Mark. Res. 2011, 48, 172–184. [Google Scholar] [CrossRef]
  122. Gabor, A.; Granger, C.W.J. Pricing, Principles and Practices; Heinemann Educational Publishers: Portsmouth, NH, USA, 1977; ISBN 0-435-84365-6. [Google Scholar]
  123. Train, K.E. Discrete Choice Methods with Simulation; Cambridge University Press: Cambridge, UK, 2009; ISBN 1-139-48037-5. [Google Scholar]
  124. Hofstetter, R.; Miller, K.M.; Krohmer, H.; Zhang, Z.J. A de-biased direct question approach to measuring consumers’ willingness to pay. Int. J. Res. Mark. 2020, 38, 70–84. [Google Scholar] [CrossRef]
  125. Lipovetsky, S.; Magnan, S.; Zanetti-Polzi, A. Pricing Models in Marketing Research. Intell. Inf. Manag. 2011, 3, 167–174. [Google Scholar] [CrossRef] [Green Version]
  126. Sattler, H.; Nitschke, T. Ein empirischer Vergleich von Instrumenten zur Erhebung von Zahlungsbereitschaften. Schmalenbachs Z. Für Betr. Forsch. 2003, 55, 364–381. [Google Scholar] [CrossRef]
  127. Kloss, D.; Kunter, M. The van westendorp price-sensitivity meter as a direct measure of willingness-to-pay. Eur. J. Manag. 2016, 16, 45–54. [Google Scholar] [CrossRef]
  128. Maes, S.; Vingerhoets, A.; Van Heck, G. The study of stress and disease: Some developments and requirements. Soc. Sci. Med. 1987, 25, 567–578. [Google Scholar] [CrossRef]
  129. Gellynck, X.; Viaene, J. Market-orientated Positioning of On-farm Processed Foods as a Condition for Successful Farm Diversification. J. Agric. Econ. 2002, 53, 531–548. [Google Scholar] [CrossRef]
  130. Harmon, R.; Raffo, D.; Faulk, S. Incorporating price sensitivity measurement into the software engineering process. In Proceedings of the PICMET’03: Portland International Conference on Management of Engineering and Technology Technology Management for Reshaping the World, Portland, OR, USA, 20–24 July 2003. [Google Scholar] [CrossRef]
  131. Naranjo-Guevara, N.; Fanter, M.; Conconi, A.M.; Floto-Stammen, S. Consumer acceptance among Dutch and German students of insects in feed and food. Food Sci. Nutr. 2021, 9, 414–428. [Google Scholar] [CrossRef]
  132. Eumofa. The Eu Fish Market—2020 Edition; Eumofa: Luxembourg, 2020; ISBN 978-92-76-15377-1. [Google Scholar]
  133. Harmon, R.R.; Unni, R.; Anderson, T.R. Price Sensitivity Measurement and New Product Pricing: A Cognitive Response Approach. In Proceedings of the PICMET’07-2007 Portland International Conference on Management of Engineering & Technology, Portland, OR, USA, 5–9 August 2007; pp. 1961–1967. [Google Scholar] [CrossRef]
  134. Çolak, O.; Koşan, L. Price Sensitivity Measurement: A Yield Management Approach. Istanb. Bus. Res. 2021, 50, 47–76. [Google Scholar] [CrossRef]
  135. Bazoche, P.; Poret, S. Acceptability of insects in animal feed: A survey of French consumers. J. Consum. Behav. 2020, 20, 251–270. [Google Scholar] [CrossRef]
  136. ISTAT Aspects of Daily Life—People. Available online: http://dati.istat.it/Index.aspx?QueryId=16813 (accessed on 10 January 2022).
  137. Monroe, K.B. The Influence of Price on Product Perceptions and Product Choice. Adv. Consum. Res. 1982, 9, 206–209. [Google Scholar]
  138. White, R.R.; Brady, M. Can consumers’ willingness to pay incentivize adoption of environmental impact reducing technologies in meat animal production? Food Policy 2014, 49, 41–49. [Google Scholar] [CrossRef]
  139. Zander, K.; Feucht, Y. Consumers’ Willingness to Pay for Sustainable Seafood Made in Europe. J. Int. Food Agribus. Mark. 2018, 30, 251–275. [Google Scholar] [CrossRef] [Green Version]
  140. Almeida, C.; Altintzoglou, T.; Cabral, H.; Vaz, S.G. Does seafood knowledge relate to more sustainable consumption? Br. Food J. 2015, 117, 894–914. [Google Scholar] [CrossRef]
  141. Donoghue, S.; Wilken-Jonker, I.; Steffens, F.E.; Kirsten, J.F. South African consumers’ willingness to pay a premium for Karoo Lamb: The influence of subjective and objective knowledge, label information and demographics. J. Retail. Consum. Serv. 2021, 63, 102664. [Google Scholar] [CrossRef]
  142. Kosenko, R.; Rahtz, D. Buyer Market Price Knowledge Influence on Acceptable Price Range and Price Limits. ACR N. Am. Adv. 1988, 15, 328–333. [Google Scholar] [CrossRef]
  143. Rogers, E.M. Diffusion of Innovations; The Free Press: New York, NY, USA, 1983. [Google Scholar]
  144. Peschel, A.; Grebitus, C.; Steiner, B.; Veeman, M. How does consumer knowledge affect environmentally sustainable choices? Evidence from a cross-country latent class analysis of food labels. Appetite 2016, 106, 78–91. [Google Scholar] [CrossRef] [Green Version]
  145. Popoff, M.; MacLeod, M.; Leschen, W. Attitudes towards the use of insect-derived materials in Scottish salmon feeds. J. Insects Food Feed 2017, 3, 131–138. [Google Scholar] [CrossRef] [Green Version]
  146. Sogari, G.; Menozzi, D.; Mora, C.; Gariglio, M.; Gasco, L.; Schiavone, A. How information affects consumers’ purchase intention and willingness to pay for poultry farmed with insect-based meal and live insects. J. Insects Food Feed 2022, 8, 197–206. [Google Scholar] [CrossRef]
  147. Menozzi, D.; Sogari, G.; Mora, C.; Gariglio, M.; Gasco, L.; Schiavone, A. Insects as Feed for Farmed Poultry: Are Italian Consumers Ready to Embrace This Innovation? Insects 2021, 12, 435. [Google Scholar] [CrossRef]
  148. Altmann, B.A.; Risius, A.; Anders, S. Feeds of the Future: A Choice Experiment of Chicken Breast Produced with Micro-Algae or Insect Meal. In Proceedings of the 59th Annual Conference of the German Society of Economic and Social Sciences in Agriculture, Braunschweig, Germany, 25–27 September 2019; pp. 1–12. [Google Scholar] [CrossRef]
  149. Bronnmann, J.; Hoffmann, J. Consumer preferences for farmed and ecolabeled turbot: A North German perspective. Aquac. Econ. Manag. 2018, 22, 342–361. [Google Scholar] [CrossRef]
  150. Bronnmann, J.; Asche, F. Sustainable Seafood From Aquaculture and Wild Fisheries: Insights From a Discrete Choice Experiment in Germany. Ecol. Econ. 2017, 142, 113–119. [Google Scholar] [CrossRef]
  151. Spartano, S.; Grasso, S. Consumers’ Perspectives on Eggs from Insect-Fed Hens: A UK Focus Group Study. Foods 2021, 10, 420. [Google Scholar] [CrossRef] [PubMed]
  152. Maesano, G.; Di Vita, G.; Chinnici, G.; Pappalardo, G.; D’Amico, M. The Role of Credence Attributes in Consumer Choices of Sustainable Fish Products: A Review. Sustainability 2020, 12, 10008. [Google Scholar] [CrossRef]
  153. Costanigro, M.; McCluskey, J.J.; Goemans, C. The Economics of Nested Names: Name Specificity, Reputations, and Price Premia. Am. J. Agric. Econ. 2010, 92, 1339–1350. [Google Scholar] [CrossRef] [Green Version]
  154. Mauracher, C.; Tempesta, T.; Vecchiato, D. Consumer preferences regarding the introduction of new organic products. The case of the Mediterranean sea bass (Dicentrarchus labrax) in Italy. Appetite 2013, 63, 84–91. [Google Scholar] [CrossRef]
  155. Asche, F.; Larsen, T.A.; Smith, M.; Sogn-Grundvåg, G.; Young, J.A. Pricing of eco-labels with retailer heterogeneity. Food Policy 2015, 53, 82–93. [Google Scholar] [CrossRef]
  156. Roheim, C.A.; Asche, F.; Santos, J.I. The Elusive Price Premium for Ecolabelled Products: Evidence from Seafood in the UK Market. J. Agric. Econ. 2011, 62, 655–668. [Google Scholar] [CrossRef]
  157. Cicia, G.; Furno, M.; Del Giudice, T. Do Consumers’ Values and Attitudes Affect Food Retailer Choice? Evidence from a National Survey on Farmers’ Market in Germany. Agric. Food Econ. 2021, 9, 3. [Google Scholar] [CrossRef]
  158. Kokthi, E.; Canco, I.; Topulli, E. Whose Salad Is Organic? An Attribute Segmentation Perspective-Evidence from Albania. Econ. Agro-Aliment. Food Econ. 2021, 23, 1–26. [Google Scholar] [CrossRef]
  159. Marangon, F.; Troiano, S.; Carzedda, M.; Nassivera, F. Consumers’ Acceptance of Genome Edited Food and the Role of Information. Ital. Rev. Agric. Econ. 2021, 76, 5–21. [Google Scholar] [CrossRef]
Figure 1. Van Westendorp Price Model. Source: Van Westendorp [38].
Sustainability 14 06657 g001
Figure 2. Van Westendorp Price Sensitivity: points of intersections.
Sustainability 14 06657 g002
Figure 3. Van Westendorp Price Sensitivity: points of intersections—consumers with familiarity.
Sustainability 14 06657 g003
Figure 4. Price–response function curves for PSM Expensive.
Sustainability 14 06657 g004
Table 2. Demographic profile of the sample.
Total n = 318%
Gender
 Male16551.7
 Female15347.9
Age
 18–294514.1
 30–395617.5
 40–4913642.6
 50–595517.2
 ≥60268.1
Education
 Lower middle school113.4
 High school9128.5
 University12238.2
 Post University9429.5
Occupation
 Freelance6119.1
 Desk Job4213.2
 Student4112.8
 Private employee4012.5
 Researcher/University Professor3912.2
 Non-university Teacher309.4
 Government job206.3
 Pensioner134.1
 Entrepreneur113.4
 Unemployed103.1
 Artisan61.9
 Househusband/housewife30.9
 Not answered20.6
 Cleric10.3
Subject knowledge
 I have heard of the eating of insects, and I know what it means18156.7
 I have heard of the eating of insects but actually don’t know what it means10332.3
 No, I have never heard of the eating of insects3410.7
Table 3. Price points for total respondents and with high SK ones (€).
Price Points and RangesTotal RespondentsHigh SK Respondents
Point of marginal cheapness (PMC)6.506.75
Point of marginal expensiveness (PME)13.514.50
Optimal price point (OPP)7.508.00
Indifference price point (IPP)10.0010.5
Range of acceptable price (RAP)6.007.75
Range of relatively cheap price (RRCP)3.503.75
Range of relatively expensive price (RREP)3.504.00
Range of stress price (RSP)2.502.50
Stress factor (SF)0.360.32
Publisher’s Note: MDPI stays neutral with regard to jurisdictional claims in published maps and institutional affiliations.

