Abstract
Mobility as a service (MaaS) integrates various transportation modalities and connects these modalities to enable users to travel from departure points to destination points. The objectives of this study were to analyze the factors influencing the intention to use MaaS and determine a direction for the implementation of this service. Hence, this study utilized an ordered probit model and marginal effect analysis. Specifically, a survey was conducted based on citizens living in Gyeonggi-do, South Korea, to prepare logical MaaS operation measures customized in this province. Subsequently, variables related to MaaS were classified, and statistical analysis was performed based on these variables. The need for integrated transportation service, intention to use shared mobility, gender, household income, and region are found to have significant effects. Moreover, demographic groups with high levels of intention to use MaaS were identified. Finally, the intention to use MaaS was found to be mainly affected by whether public transportation was the primary means of transportation or whether the subjects spent a comparatively long time commuting. It is expected that these findings will serve as the basis for MaaS implementation in the future and will also be used as fundamental data for transportation service planning.
1. Introduction
Vehicle ownership has recently increased associated negative impacts, causing considerable energy consumption, insufficient parking space, and a rise in the cost of vehicle ownership [1]. To solve these problems, countries have developed alternative measures for increasing the convenience of transport service users and providing them with shorter travel times [2]. Accordingly, the concept of mobility as a service (MaaS), which provides an integrated platform for various means of transportation, has recently received great attention as a main method of solving existing traffic issues [3]. This service provides an integrated platform for various means of transportation, including cars, buses, subways, and bicycles, and suggests an appropriate customized solution for individual users by connecting the means of transportation these users need to travel from their departure points to destination points [4]. As it covers not only common means of transportation (e.g., general vehicles and vehicles for public transportation), but also next-generation mobility (e.g., self-driving cars, shared transportation vehicles, and personal mobility devices), this approach can satisfy the needs of different users [5]. MaaS was provided as a commercial service in Helsinki, Finland, in 2016 for the first time in the world. Sweden has also conducted a pilot project for implementing MaaS [6]. Moreover, Germany, and the United Kingdom have developed mobile package services connected with public transportation, such as trains, buses, shared transport vehicles, and taxies. In South Korea, several cities and provinces, such as Seoul [5], Busan [7], and Gyeonggi-do [2], have adopted plans for implementing customized MaaS since Go PyeongChang Service, the first MaaS implemented in South Korea, was provided in Pyeongchang, South Korea, during the 2018 Pyeongchang Winter Olympics [4]. Moreover, multiple studies have verified the validity of MaaS from the perspectives of demand and supply, predicting an increase in the scale of the MaaS market due to commercialization [8].
The use of MaaS has rapidly increased worldwide since its introduction. However, this service is provided at an initial stage and applied as a limited service for pilot projects in certain regions instead of universal service. In addition, the number of regions selected for MaaS implementation is low compared to the supply level of this early-stage service [9]. Public transportation infrastructure tends to be proportional to the population in a target region [10]. The level of public transportation infrastructure in cities of other countries where pilot projects on MaaS are being executed is comparatively low due to limitations related to the population in these cities [6]. There is a possibility that countries with low-level infrastructure are likely to be relatively vague in the direction desired by potential users in the planning stages. Therefore, a desirable direction may not be derived because the intention of potential users may not be sufficiently reflected. However, South Korea has developed public transportation infrastructure to a substantial level. Hence, the country was deemed an appropriate region for analyzing complex factors affecting the intentions of users to utilize MaaS to effectively provide MaaS. In particular, Gyeonggi-do has numerous satellite cities connected with Seoul, the Korean capital, in which more than 13 million people reside. As this province also shows a high level of population mobility to the capital and nearby cities, it has symbolic significance as a heavy commuting area [11]. Accordingly, South Korea has research significance as various factors affecting MaaS implementation can be analyzed because Korea has an established transportation infrastructure.
Full-scale MaaS implementation requires the consideration of different factors, such as user characteristics (e.g., gender, age, and household income), accessibility to existing public transportation services, and level of knowledge of MaaS. Thus, we analyzed factors affecting the intention of users to utilize MaaS based on a statistical model and determined an ideal direction for supplying this service. To this end, we conducted an online survey based on the citizens living in Gyeonggi-do, South Korea. Subsequently, the survey data were analyzed by using an ordered probit model, which is effective for assessing data, including ordinal dependent variables, to identify factors affecting the intentions of users to utilize MaaS. The survey data obtained based on citizens living in Gyeonggi-do can be employed to provide region-specific service. Based on the analysis results, we reviewed the factors that must be considered to implement future MaaS and identified a direction for supplying this service in the future.
The objectives and intended contributions of this study can be summarized in three points:
- We analyze potential users’ intentions using survey data collected from Gyeonggi Province, South Korea, where a substantial level of public transportation infrastructure has been established.
- We quantitatively identify factors influencing intention to use MaaS based on their statistical significance.
- We suggest the future direction of MaaS offering in consideration of the intentions of potential users.
The structure of the remainder of this manuscript is as follows: Section 2 reviews existing MaaS operation cases and relevant literature to identify the distinct significance of this study. Section 3 explains the characteristics of the target research region and the survey data and presents a fundamental sample analysis. Section 4 describes an intention analysis method by using research methodologies, such as an ordered probit model and a 5-point Likert scale. Section 5 presents the research results for factors affecting the use of MaaS. Finally, Section 6 summarizes the conclusions of this study and its implications according to directions for supplying MaaS in the future.
2. Related Works
2.1. MaaS Operation Case
In 2014, the concept of MaaS was first introduced as a mobility distribution model that is provided by a service supplier to satisfy the primary needs of customers for transportation using a single interface. Since the MaaS model was designed based on this concept, numerous countries worldwide have operated pilot MaaS driving services [12]. Research on MaaS has been actively conducted in Europe. Helsinki, Finland, first adopted MaaS in 2016 and utilized a system called Whim used for integrated reservation and payment. This system emphasized connections with trams, which constituted an environmentally friendly means of transportation [13,14], whereas shared transportation based on bicycles and cars were not included in the initial stage of the system implementation [13]. A system called UbiGo, which covers more varied means of transportation than Whim, is used in Gothenburg, Sweden. When users make payments for this system on a monthly or yearly basis, they can utilize various means of transportation provided by this system [15]. Qixxit, a system implemented in Germany, suggests different paths and enables users to select their preferred paths. Moovel, a system used in Germany, as well as in Boston and Portland in the United States, conveniently helps users in comprehensive transportation search, reservation, and payment [16]. Most cases of MaaS operation have occurred in Europe [14,16], although pilot MaaS programs have also been implemented in certain regions of the U.S., Singapore, and Canada. In South Korea, research on MaaS establishment has been conducted in a few regions, including Gyeonggi-do, since this service was applied in Pyeongchang in 2018 [2]. Gyeonggi-do has established main strategies on smart mobility service based on widespread public transportation infrastructure. This province is also planning to apply MaaS and demand–response service throughout its entire area [6]. Prior to full-scale MaaS implementation, the intentions of users to employ this service should be analyzed to develop a market environment that attracts potential customers. The result of examining existing cases of MaaS operation indicates that this service should be customized according to regions in which it will be implemented to achieve successful implementation and sustainable operation. Furthermore, various factors affecting the use of MaaS should be identified to prepare appropriate services associated with the existing means of transportation.
2.2. MaaS Research
MaaS has been gradually commercialized since it was first introduced. Accordingly, numerous studies have been conducted with the objective of implementing this service successfully. Recent studies on MaaS have focused on theoretical research on this service [14,17,18,19]. In terms of next-generation mobility, researchers have intensively examined pricing [20,21], cost reduction [22], competition between means of transportation [23], barriers in adopting MaaS [24,25], and an analysis of factors affecting the use of MaaS [26]. Ho et al. [26] first analyzed the potential intentions of users to employ mobility. They estimated a model by analyzing the needs of customers considering socio-economic conditions and traffic demands, although it was limited in focusing on a certain shared transportation mode. As explained above, the factors affecting the use of MaaS have rarely been studied. However, as the availability of MaaS has increased recently, researchers [27,28,29] have investigated the importance of analyzing MaaS from the perspective and psychological factors of users and have developed discussions on potential MaaS users. As such, the range of research on MaaS has expanded constantly. Previous scholars derived significant analysis results for a theoretical MaaS approach, mobility in terms of cost, and a relationship among modes of transportation. Although a few scholars have examined the intentions of users to employ MaaS, the needs of customers directly using this service were not sufficiently investigated. As MaaS has been implemented for only a short time in the world, the numbers of people who have directly experienced this service and pilot service regions are low. Hence, it is required to conduct research on MaaS by considering users whose number is expected to increase in the future. Accordingly, factors affecting the intentions of potential MaaS users to employ this service should be analyzed to reduce the existing research gap and to derive a direction for practical implementation of the MaaS system. Thus, we analyzed latent factors affecting the intentions of MaaS users to employ this service by utilizing survey data obtained based on general citizens who may directly use it in the future, and we presented a direction for its implementation in the future. We identified factors that should be considered to satisfy the needs of users based on the analysis results. The findings of this study will be utilized as fundamental data for transportation service planning in the future.
3. Data Description
3.1. Study Site
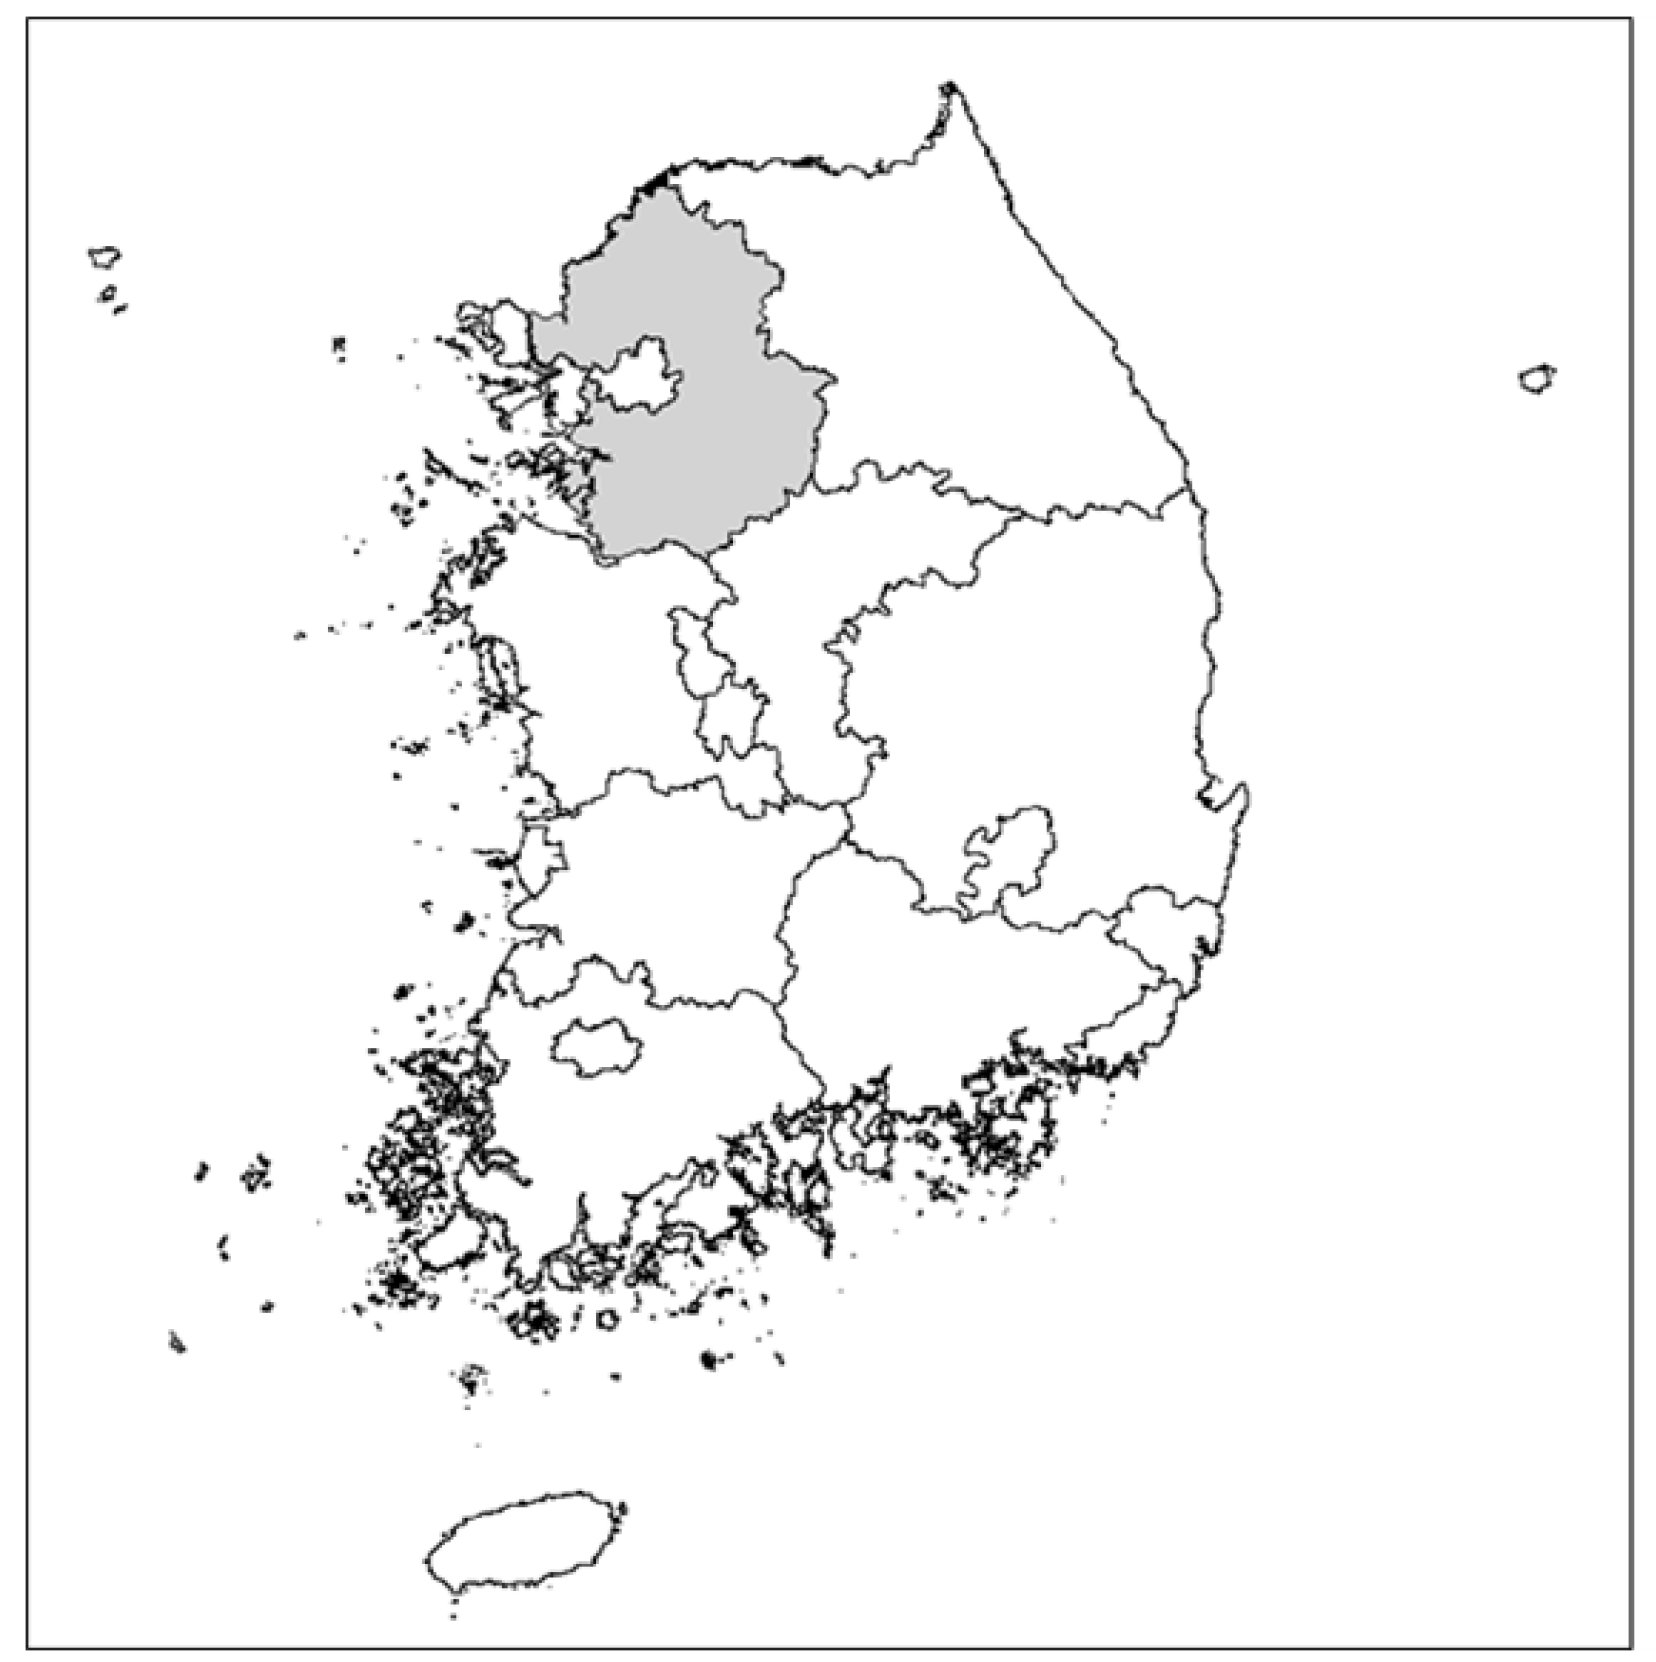
Gyeonggi-do is a province located in the northwest region of South Korea. It consists of 31 local governments and has a total area of 10,171 km2, accounting for approximately 10% of the entire area of South Korea. Its land area is the fifth largest area in South Korea. Its total population was more than 13.40 million people as at 2020, accounting for more than 25% of the entire population in South Korea. The population in Gyeonggi-do was 8.98 million in 2000 and rapidly increased to 11.38 million in 2010 and 13.40 million in 2020. As of October, 2021, the population in Gyeonggi-do was the highest compared to those of other cities and provinces in South Korea. Gyeonggi-do has widely developed transportation infrastructure to cover its large population and has recognized a need to implement means of transportation in relatively neglected regions to achieve balanced regional development. This province geographically surrounds Seoul, the capital of South Korea, serving as a satellite city (i.e., a heavy commuting city that can perform the functions of a major city due to its proximity to this city). Many people prefer living in Gyeonggi-do because it has the highest accessibility to Seoul; provides convenient conditions in terms of housing, industries, and transportation; and the land price in Seoul is high. Figure 1 provides a map of Gyeonggi-do and shows its location in South Korea.
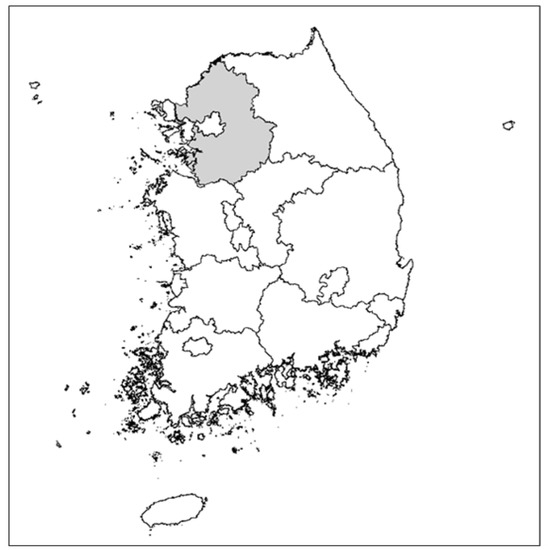
Figure 1.
Location and map of Gyeonggi Province.
3.2. Survey Overview and Questionnaire Design
We conducted an online survey using structured questionnaires to investigate the perceptions of citizens toward MaaS introduction and operation. Adults (aged 19 to 64 years) who lived in Gyeonggi-do were selected as the survey targets. The samples were randomly selected as the survey targets. The survey was conducted from 12 February 2020 to 26 February 2020. This province is characterized by dense traffic zones with satellite cities connected to Seoul, the capital of South Korea [11]. It also has more than 10 million people, so many people commute to Seoul from nearby cities. One thousand samples were collected in the survey, and the responses were reviewed to exclude samples that included missing values or insufficient response consistency. As a result, 781 samples were utilized for the final analysis [30,31]. We provided a concept of the MaaS before participating in the survey. The survey questionnaire consisted of three parts. The first part included questions related to the demographic characteristics of respondents, such as gender, age, household income, and living area. The second part included questions about the intentions of the subjects to use MaaS. Since intentions cannot be clearly observed or measured, a Likert scale was utilized [32]. The third part included questions related to various factors affecting MaaS. Table 1 summarizes the questions included in the questionnaire and their scales.

Table 1.
Summary of questionnaire.
3.3. Sample Characteristics
We conducted a sample characteristics analysis to confirm the intention of potential MaaS users and to determine whether the composition of respondents reflects the socio-demographic characteristics of South Korea. The sample characteristics provide an intuitive response distribution. Intention to use MaaS, utilized as a dependent variable in this study, was measured based on a 5-point Likert scale (ranging from 1 (not at all) to 5 (very likely)). The survey results showed that 48.9% of the subjects were willing to use MaaS. The average score for the intention to use MaaS based on the 5-point Likert scale was calculated to be 3.42. This result indicates that the intention of subjects to use MaaS was at the normal to high level. The explanatory variables related to the intention to use MaaS reflected 11 properties, including (1) variables related to user perceptions of MaaS (e.g., the state of awareness of MaaS, need for MaaS, intention to use connected means of transportation, and intention to use shared mobility); (2) demographic characteristic variables (e.g., gender, age, household income, and living area); and (3) variables related to means of transportation and travel characteristics (e.g., the main means of transportation, amount of time required for commuting, and amount of time required for waiting in stations or at stops). Intuitive descriptions of the variables related to means of transportation and travel characteristics are as follows: The main means of transportation is the means of transportation that is mainly used for commuting. The amount of time required for commuting refers to how much time is spent commuting to and from the workplace. The amount of time required for waiting in stations or at stops is the amount of time spent for a person to reach the closest stop from his or her place of residence on foot. Table 2 lists the characteristics of the samples obtained based on the survey. The results of analyzing the respondent characteristics show that the respondents sufficiently reflected the travel characteristics of commuters in South Korea [11]. Male and female respondents accounted for 58.0% and 42.0% of the 781 participants in the survey, respectively. In other words, the ratio of male respondents was higher than that of female respondents. The average age of the respondents was about 39 years, and people in their 40s accounted for the highest proportion of the respondents (23.6%). Further, 43.8% of the respondents indicated that they used cars as their main means of transportation. In addition, 35.9% of the respondents spent less than 30 min commuting, 29.6% spent longer than 60 min commuting, and 34.6% spent 30–60 min commuting. Thus, the rate of respondents who spent less than 30 min commuting was higher than those of respondents who spent longer than 60 min or 30–60 min commuting.
Table 2.
Variables included in the models.
Regarding perception toward MaaS, only 19.6% of the respondents mentioned that they had heard of MaaS in the past. The respondents were informed about the characteristics of MaaS and were asked to answer questions regarding the necessity of this service in the survey process. Approximately 69.9% of the respondents recognized the necessity of MaaS. The reasons identified for the necessity of MaaS were as follows: 36.9% of the respondents demanded this service to reduce costs, 25.1% to save travel time, and 23.4% to improve transportation safety. Among the subjects who indicated that they did not find MaaS necessary, 33.3% of them responded that they did not need it because they were satisfied with the current service, 27.3% of them reported that they constantly used their own cars at the point at which the survey was conducted, and 15.0% of them indicated that they were concerned about disclosure of their personal information. In addition, data related to the intention to use connected means of transportation with MaaS and shared mobility were obtained. It was found that 59.3% of respondents were willing to use connected means of transportation, and that 53.0% of respondents were willing to use shared mobility.
4. Methodology
4.1. Ordered Probit Model
In this study, we classified the level of intention to use MaaS by utilizing a 5-point Likert scale that included five standards (i.e., very low, low, neutral, high, and very high) and analyzed influential factors for the intention to use. When dependent variables follow an ordinal type representing ranks, an ordered probit or logit model can be employed to analyze the proposed model. The state of application of the ordered probit or logit model is determined according to an assumption of the probability distribution of an error term (). The ordered probit model assumes that an error term has a normal distribution, whereas the logit model assumes that an error term has a logistic distribution [33]. It was previously reported that the analysis results derived from both models did not differ significantly despite the different assumptions of these models regarding the error term distribution [34,35]. Thus, we conducted empirical analysis based on an ordered probit model, which was used to identify influential factors related to the intentions of consumers to use services or products and their satisfaction with the services or products. Equation (1) shows the ordered probit model:
Here, is a latent dependent variable that cannot be directly observed. is a matrix of vectors of independent variables related to the th respondent. provides a standard for selecting , a categorized variable that can be observed. Equations (2)–(6) shows the relationship between and .
Here, are unknown parameters indicating thresholds. These parameters are estimated based on an estimated coefficient () of each explanatory variable. and can be used to calculate the choice probability related to the intention to use MaaS. Equations (7)–(11) shows the choice probabilities according to alternatives ranging from 1 (not intending to use MaaS at all) to 5 (strongly intending to use MaaS) in order. Here, is a function with a cumulative standard normal distribution:
A likelihood ratio can be used to calculate the goodness of fit of the ordered probit model. Equation (12) shows this calculation process:
Here, the likelihood ratio () is expressed as the log likelihood value () derived when the entire explanatory variables are included or the log likelihood value () derived when any information is included. The likelihood ratio, which is also mentioned as a coefficient of determination, has a value ranging between 0 and 1. The closer the value is to 1, the higher the goodness of fit of the model.
4.2. Marginal Effect Estimation
The marginal effect was analyzed to examine the changes in the dependent variables affected by each explanatory variable. It is important to interpret parameters directly based on an estimation model. The positive (+) or negative (−) coefficient values derived in Section 4.1 can provide only simple information regarding increases or decreases in the intention to use MaaS caused by the explanatory variables. To solve this problem, Kolasinski and Siegel [36] suggested a method of calculating the marginal effects of the dependent variables according to level probabilities of each independent variable. The marginal effect analysis was conducted to identify changes in the dependent variables according to changes in the properties of the independent variables. The expected value is represented as . Here, is the expected value for a dependent variable. is calculated based on a change from to and is used to estimate the occurrence probability (%). The estimated occurrence probability (%) is expressed as . STATA, a statistical program, was utilized for model analysis.
5. Results
In this study, we analyzed the factors influencing the intention to use MaaS by employing survey data. Based on this, we classified variables related to the intentions of users to utilize MaaS based on a 5-point Likert scale and established a model based on the variables classified and an ordered probit method. The result of analyzing the factors influencing the intention to use MaaS showed that 7 variables among 11 independent variables had statistically significant effects (p-value < 0.1) on the intention to use MaaS; need for integrated transportation service (), intention to use shared mobility (), gender (), main means of transportation (), amount of time required for commuting (; 0.058), household income (), and region of residence (). On the other hand, four variables, including awareness of MaaS (), intention to use connected means of transportation (), amount of time required for waiting in stations or at stops (), and age (), did not have statistically significant effects (p-value 0.1) on the intention to use MaaS, especially as the response to the need for MaaS tended to think about the future of MaaS positively, as inferred from the highest coefficient values. Table 3 shows the values of the variables influencing the intention to use MaaS estimated by the ordered probit model. Moreover, we analyzed the marginal effects of the independent variables to examine the effects of the coefficient values on each variable based on an estimation model quantitatively.
Table 3.
Results of ordered probit models for intention to use MaaS.
Table 4 shows the results of analyzing the marginal effects of each independent variable, which was done to examine the effects of the practical explanatory variables on the change in the probability of a person using MaaS. That is, it indicates a comparative scale for different levels based on a reference case. For example, we analyzed the intentions of citizens to use MaaS according to gender by utilizing the results estimated by the probit model, which are presented in Table 3. The analysis results reveal that men have a higher level of intention to use MaaS than women. We also examined the intentions of citizens to use MaaS according to gender by utilizing the analysis results for the marginal effect in Table 4. The analysis results demonstrate that the probability of men selecting a high level of intention to use MaaS is higher by 2.7% than that of women, and that the probability of men for selecting a significantly high level of intention to use MaaS is higher by 1.6% than that of women. On the other hand, the probabilities of men for selecting normal, low, and significant low levels of intention to use MaaS are lower by 2.3%, 1.6%, and 0.4% than those of women, respectively.
Table 4.
Marginal effects of estimated model.
We classified independent variables according to three items as follows: (1) four variables related to recognition characteristics (i.e., awareness of MaaS, need for MaaS, intention to use connected means of transportation, and intention to use shared means of transportation), (2) four variables related to demographic characteristics (gender, household incomes, age, and regions of residence), and (3) three variables related to means of transportation and travel characteristics (main means of transportation, amount of time required for commuting, and amount of time required for waiting in stations or at stops). Subsequently, we analyzed the values derived based on these variables.
The results of inspecting the variables related to MaaS recognition verified that those who found MaaS necessary showed statistically higher levels of intention to use MaaS than those who found MaaS unnecessary. This result implies that measures for informing potential MaaS users about the advantages of this service, such as cost reduction and time savings, should be promoted to increase awareness of the need for MaaS. Moreover, the individuals who intended to use shared mobility showed higher levels of intention to use MaaS than those who did not. This finding was obtained due to the fact that MaaS provides options to utilize all transportation modes to reach destination points from departure points. This characteristic led to a comparatively high probability of shared mobility modes being provided to enable people to reach traffic nodes or the last mile before reaching their destination points. On the contrary, recognition of MaaS and the intention to use connected means of transportation did not have statistically significant effects on the intention to use MaaS.
The results of examining the significant effects of the demographic characteristics on the intention to use MaaS are as follows. Firstly, men showed a higher level of intention to use integrated transport service than women. Moreover, the group with a high household income level (over 5 million won) was compared with the groups with lower household income levels (less than 3 million won and 3–5 million won) to analyze the intention to use integrated transportation service. This is consistent with the findings of previous studies that the group with low household income was more likely to use MaaS than the group with relatively high household income [24,37]. The comparison results indicated that the groups with low household income levels showed higher levels of intention to use integrated transportation services than the group with a high household income level. This result was obtained because the groups with a low household income level could be more sensitive to the economic cost discounts actualized from the use of MaaS. In contrast, there was a statistically insignificant difference in the intention to use integrated transportation service according to age. Regarding the variables related to means of transportation and travel characteristics, those who used their own cars as their main means of transportation showed a lower level of intention to use MaaS than those who used other means of transportation, such as buses and subways.
The people using public transportation are more likely to use MaaS services, which is consistent with the finding that the inconvenience of public transport can cause a change in transportation mode [37,38,39]. This result was obtained because those who drove their own cars did not frequently use other means of transportation such as public transportation or shared mobility. Consequently, those who drove their own cars showed a low level of intention to use MaaS [24,37]. In addition, the people who had relatively short commute times to and from their workplaces (shorter than 30 min and 30–60 min) exhibited a lower level of intention to use MaaS than those who had longer commute times. Compared with the findings of Efthymiou et al. [40], this result was affected by the phenomenon that respondents who spend longer commuting can obtain greater time-related benefits by utilizing MaaS than those who do not. On the other hand, the travel time from the departure point to a stop or a station for public transportation did not exert statistically significant effects on the intention to use MaaS.
The implications of the aforementioned results can be summarized as follows: Firstly, the group of people who felt the need for MaaS had the most positive influence on the use intention. Thus, it is necessary to understand the group in detail prior to the introduction of MaaS. Secondly, decision-makers can focus on groups of respondents who are more willing to use MaaS by considering groups of people with demographic characteristics that significantly affect the intentions of those respondents to use MaaS. Decision-makers can also increase the use rate of this service by providing it in regions that have high numbers of potential users by priority or by preparing active promotion measures based on groups that show a low level of intention to use it. Third, people are more likely to become potential MaaS users if they find it difficult to use cars or the existing public transportation due to lengthy commute times. It is considered that these people could get more benefit by alleviating the accessibility-related inconveniences. Thus, it is recommended to prioritize MaaS implementation in regions with high use rates of the existing public transportation or with insufficient public transportation service supplied.
6. Conclusions
6.1. Summary and Implications
It is essential to analyze the intentions of potential users to utilize MaaS to introduce and operate this service successfully. In this study, we conducted an online survey related to MaaS and analyzed the factors affecting the intentions of users to use this service based on the responses of potential users. Based on this, we classified the level of intention to use MaaS according to a 5-point Likert scale and established a model by applying an ordered probit model and performing marginal effect analysis. The study results can be summarized as follows: In terms of factors reflecting recognition characteristics, the need for MaaS and intention to use shared mobility had significant effects. On the other hand, the recognition of MaaS and intention to use connected means of transportation did not have significant effects. In terms of factors reflecting demographic characteristics, gender, household income, and region had significant effects. However, age did not have a significant effect. Regarding factors related to means of transportation and travel characteristics, the main means of transportation and amount of time required for commuting, but not the amount of time required for a person to reach the closest stop from his or her residence on foot, had significant effects. Regarding recognition characteristics, the respondents who found MaaS necessary showed statistically higher levels of intention to use this service than those who found it unnecessary. Moreover, those who intended to use shared mobility showed higher levels of intention to use MaaS than those who did not intend to use shared mobility. These results were obtained because the existing perceptions of potential users can affect their intentions to use MaaS. In other words, it was determined that those who recognize the necessity of MaaS or have positive perceptions of shared mobility are more likely to use this service. It can also be found in the marginal effect analysis, which shows the comparative scale for different levels based on reference cases. In the results of the marginal effect analysis, the probability that respondents who were aware of the need for the MaaS would select a high level of intention to use MaaS is higher by 51.5% and that the probability of selecting significantly high level of intention to use MaaS is higher by 6.9% than not applicable respondents. In addition, the probability that respondents who had a positive perception of shared mobility would select high level and significantly high level of intention to use MaaS are higher by 11.7% and 5.0% than not applicable respondents, respectively. A positive perception can increase the expectations of people regarding new services and reduce obstacles for them to use it. Thus, it is necessary to develop measures to increase awareness of the need for MaaS prior to implementing this service. The results of analyzing both the intentions of users and their use of existing means of transportation can be considered to suggest a more effective implementation method. Only approximately 19.6% of the subjects responded that they had heard of MaaS before participating in the survey. However, after they were informed about MaaS and asked about the necessity of this service, approximately 69.9% of the respondents agreed on its necessity. Moreover, the survey results showed that over half of all respondents were willing to use this service. Based on this survey result, it was determined that a social environment should be established to inform potential customers about the effects of MaaS (e.g., cost reduction, travel time saving, and traffic safety improvement) prior to implementing this service. In addition, we identified demographic groups with high levels of intention to use MaaS. By considering this analysis result, policy-makers can focus on specific groups that may be more willing to use this service. It was also verified that men were more inclined to use integrated transportation service than women, and that groups with low household incomes were more willing to use integrated transportation service. Moreover, people showed higher levels of intention to use this service when they lived in cities where few people have difficulty using various means of transportation. Thus, decision-makers can increase the use rate of this service by providing it in regions that have high numbers of potential users by prioritizing or preparing active promotion measures based on groups that show low levels of intention to use it. Another significant finding of this study is as follows: It was verified that use of public transportation was the most crucial factor for affecting the intention to use MaaS. People showed higher levels of intention to use this service when they utilized public transportation and spent a long time commuting to and from their workplaces by using public transportation. Therefore, it was determined that citizens will be more likely to use MaaS if implementation of this service is prioritized in areas in which citizens feel uncomfortable because of insufficient public transportation infrastructure or long intervals between transportation modalities.
Before implementing MaaS, more effective policies can be developed considering factors that affect the use of this service by citizens. This study is significant in that we collected the opinions of potential MaaS users based on their demands in a bottom-up process to facilitate evidence-based policy making related to this service, which currently remains at the theoretical level. Further, we analyzed factors affecting the intentions of potential customers to use MaaS and presented a direction for practical implementation of this service to supply it successfully. As few studies on potential MaaS users have been conducted, it is expected that the findings of this study regarding these users will serve as the basis for implementing this service in the future. It is also anticipated that the analysis results of this study will be used as data for MaaS planning.
6.2. Limitations and Future Research
This study is representative research that suggests future MaaS policy-making strategies based on an ordered probit model. However, in terms of policy establishment for future mobility implementation, this study has several limitations, which can be considered as future research directions and are as follows: First, this study was focused on analyzing the intentions of potential users to utilize MaaS at the point at which this service was not stably established and operated in the target region. The intention to use this service can be analyzed only to a limited extent when the respondents do not have direct experience using this service. Thus, it is required to analyze the intentions of potential users to employ MaaS in areas in which this service is already supplied in a long-term context to provide this service more effectively. Second, a certain region in South Korea was considered in this study. Therefore, the study results cannot be applied to predict conditions throughout South Korea. Third, we conducted a survey immediately before South Korea encountered risks caused by the coronavirus 2019 (COVID-19) pandemic, which spread all over the world. Thus, the demand of potential users for MaaS should be re-analyzed according to the current new normal era. Finally, further research should be performed to cover not only means of public transportation but also various modalities, including personal mobility devices, self-driving vehicles, and electric mobility vehicles. In addition, the willingness of potential users to pay for MaaS should be analyzed in future research, as it is necessary for establishment of this service.
Author Contributions
Conceptualization, E.K., Y.K., J.K. and H.K.; Methodology, E.K., Y.K., W.S., J.K. and H.K.; Survey design, W.S. and H.K.; Writing—original draft preparation, E.K., Y.K. and H.K.; Writing—review and editing, E.K., Y.K., W.S., J.K. and H.K.; Formal analysis and validation, E.K. and Y.K.; Visualization, E.K. and Y.K.; Supervision, H.K.; Project administration, H.K.; Funding acquisition, W.S and H.K. All authors have read and agreed to the published version of the manuscript.
Funding
This work was supported by the National Research Foundation of Korea (NRF) grant funded by the Korean government (MSIT) (no. 2020R1C1C1003296).
Institutional Review Board Statement
Not applicable.
Informed Consent Statement
Not applicable.
Data Availability Statement
The data used to support the findings of this study are not publicly available according to the data security policy of Gyeonggi Province.
Acknowledgments
We are grateful to the anonymous referees for evaluating the suitability of our proposed methodology.
Conflicts of Interest
The authors declare no conflict of interest.
References
- Millard-Ball, A.; Murray, G.; Ter Schure, J.; Fox, C.; Burkhardt, J. Car-sharing: Where and how it succeeds. In Transit Cooperative Research Program (TCRP) Report 108; Transportation Research Board: Washington, DC, USA, 2005. [Google Scholar]
- GRI Research. Smart Mobility: Establishment of Mobility Ecosystem; Advanced Institute of Convergence Technology: Suwon, Korea, 2020. [Google Scholar]
- Goodall, W.; Fishman, T.D.; Bornstein, J.; Bontrhon, B. The rise of mobility as a service: Reshaping how urbanites get around. Deloitte Rev. 2017, 20, 111–130. [Google Scholar]
- Kwon, Y.; Kim, H.; Lim, G.; Kim, J.; Son, W. A Research on Forecasting Change and Service Direction for the Future Mobility System. J. Korea Inst. Intell. Transp. Syst. 2020, 19, 100–115. [Google Scholar] [CrossRef]
- Yoon, H.; Yoo, H.; Hong, S.; Ki, H.; Park, S. Introduction of MaaS (Mobility as a Service) Seoul; The Seoul Institute: Seoul, Korea, 2018.
- Yoon, H.; Ki, H. Introduction of MaaS (Mobility as a Service) Seoul; The Seoul Institute: Seoul, Korea, 2019.
- Busan Development Institute. Shared Transportation Activation Plan in Busan; Busan Development Institute: Busan, Korea, 2019. [Google Scholar]
- Maria, K. Feasibility Study for “Mobility as a Service” Concept in London; UCL Energy Institute: London, UK, 2015. [Google Scholar]
- Smith, G.; Sochor, J.; Karlsson, I.M. Mobility as a service: Development scenarios and implications for public transport. Res. Transp. Econ. 2018, 69, 592–599. [Google Scholar] [CrossRef]
- Jeong, S.; Yoon, H. QAP structural characterization of public transportation networks based on QAP correlation. J. Inf. Technol. Manag. 2019, 26, 95–102. [Google Scholar]
- Ko, E.; Kim, H.; Lee, J. Survey data analysis on intention to use shared mobility services. J. Adv. Transp. 2021, 2021, 5585542. [Google Scholar] [CrossRef]
- Hietanen, S. “Mobility as a service”—The new transport model? ITS Transp. Manag. Supp. Eurotransp. 2014, 12, 2–4. [Google Scholar]
- Whim. Available online: https://whimapp.com/ (accessed on 21 October 2021).
- Storme, T.; De Vos, J.; De Paepe, L.; Witlox, F. Limitations to the car-substitution effect of MaaS. Findings from a Belgian pilot Ssudy. Transp. Res. A 2020, 131, 196–205. [Google Scholar]
- Li, Y.; Voege, T. Mobility as a service (MaaS): Challenges of implementation and policy required. J. Transp. Technol. 2017, 7, 95–106. [Google Scholar] [CrossRef] [Green Version]
- Kamargianni, M.; Li, W.; Matyas, M.; Schäfer, A. A critical review of new mobility services for urban transport. Transp. Res. Proc. 2016, 14, 3294–3303. [Google Scholar] [CrossRef] [Green Version]
- Streeting, M.; Edgar, E. Mobility as a Service: The Next Transport Disruption; LEK Consulting: Boston, MA, USA, 2017. [Google Scholar]
- Jittrapirom, P.; Caiati, V.; Feneri, A.M.; Ebrahimigharehbaghi, S.; Alonso-González, M.J.; Narayan, J. Mobility as a service: A critical review of definitions. Urban Plan. 2017, 2, 13–25. [Google Scholar] [CrossRef] [Green Version]
- Vij, A.; Sampson, S.; Swait, J.; Lambides, M.; Hine, L. Mobility as a Service in Australia. Customer Insights and Opportunities; ITS Australia: Port Melbourne, Australia, 2018. [Google Scholar]
- Liu, Y.; Li, Y. Pricing scheme design of ridesharing program in morning commute problem. Transp. Res. C 2017, 79, 156–177. [Google Scholar] [CrossRef]
- Sayarshad, H.R.; Gao, H.O. A scalable non-myopic dynamic dial-a-ride and pricing problem for competitive on-demand mobility systems. Transp. Res. C 2018, 91, 192–208. [Google Scholar] [CrossRef]
- Stiglic, M.; Agatz, N.; Savelsbergh, M.; Gradisar, M. The benefits of meeting points in ride-sharing systems. Transp. Res. B 2015, 82, 36–53. [Google Scholar] [CrossRef] [Green Version]
- Pandey, V.; Monteil, J.; Gambella, C.; Simonetto, A. On the needs for MaaS platforms to handle competition in ridesharing mobility. Transp. Res. C 2019, 108, 269–288. [Google Scholar] [CrossRef] [Green Version]
- Alonso-Gonzalez, M.J.; Hoogendoorn-Lanser, S.; van Oort, N.; Cats, O.; Hoogendoorn, S. Drivers and barriers in adopting Mobility as a Service (MaaS)—A latent class cluster analysis of attitudes. Transp. Res. A 2020, 132, 378–401. [Google Scholar] [CrossRef]
- Karlsson, I.C.M.; Mukhtar-Landgren, D.; Smith, G.; Koglin, T.; Kronsell, A.; Lund, E.; Sarasini, S.; Sochor, J. Development and implementation of Mobility-as-a-Service: A qualitative study of barriers and enabling factors. Transp. Res. A 2020, 131, 283–295. [Google Scholar] [CrossRef]
- Ho, C.Q.; Hensher, D.A.; Mulley, C. Public preferences for mobility as a service: Insights from stated preference surveys. Transp. Res. A 2020, 131, 70–90. [Google Scholar] [CrossRef]
- Lyons, G.; Hammond, P.; Mackay, K. The importance of user perspective in the evolution of MaaS. Transp. Res. A 2019, 121, 22–36. [Google Scholar] [CrossRef]
- Simsekoglu, Ö.; Klöckner, C.A. The role of psychological and socio-demographical factors for electric bike use in Norway. Int. J. Sustain. Transp. 2019, 13, 315–323. [Google Scholar] [CrossRef]
- Matyas, M.; Kamargianni, M. The potential of mobility as a service bundles as a mobility management tool. Transportation 2018, 46, 1951–1968. [Google Scholar] [CrossRef] [Green Version]
- Dillman, D.; Smyth, J.D.; Christian, M. Internet, Mail and Mixed-Mode Surveys: The Tailored Design Method, 4th ed.; John Wiley & Sons, Inc.: Hoboken, NJ, USA, 2014. [Google Scholar]
- Kwon, Y.; Son, S.; Jang, K. Evaluation of incentive policies for electric vehicles: An experimental study on Jeju Island. Transp. Res. A 2018, 116, 404–412. [Google Scholar] [CrossRef]
- Likert, R.A. Technique for the measurement of attitudes. Archiv Für Psychologie 1932, 55, 140. [Google Scholar]
- Kwon, Y.; Byun, J.; Park, S. Exploring the determinants of bus drivers job satisfaction: Evidence from South Korea. Res. Transp. Bus. Manag. 2019, 33, 100436. [Google Scholar] [CrossRef]
- Quddus, M.A.; Noland, R.B.; Chin, H.C. An analysis of motorcycle injury and vehicle damage severity using ordered probit models. J. Saf. Res. 2002, 33, 445–462. [Google Scholar] [CrossRef]
- Hill, R.C.; Griffiths, W.E.; Lim, G.C. Principles of Econometrics; John Wiley & Sons: New York, NY, USA, 2018. [Google Scholar]
- Kolasinski, A.; Siegel, S. On the Economic Meaning of Interaction Term Coefficients in Non-Linear Binary Response Regression Models; Texas A&M University and University of Washington: Seattle, WA, USA, 2010; Unpublished Working Paper. [Google Scholar]
- Lopez-Carreiroa, I.; Monzona, A.; Lois, D.; Lopez-Lambasa, M.E. Are travellers willing to adopt MaaS? Exploring attitudinal and personality factors in the case of Madrid, Spain. Travel Behav. Soc. 2021, 25, 246–261. [Google Scholar] [CrossRef]
- Al-Ayyash, Z.; Abou-Zeid, M.; Kaysi, I. Modelling the demand for a shared-ride taxi service: An application to an organization-based context. Transp. Policy 2016, 48, 169–182. [Google Scholar] [CrossRef]
- Fioreze, T.; Gruijter, M.; Geurs, K. On the likelihood of using Mobility-as-a-Service: A case study on innovative mobility services among residents in the Netherlands. Transp. Policy 2019, 7, 790–801. [Google Scholar] [CrossRef]
- Efthymiou, D.; Antoniou, C.; Waddell, P. Factors affecting the adoption of vehicle sharing systems by young drivers. Transp. Res. C 2013, 29, 64–73. [Google Scholar] [CrossRef]
Publisher’s Note: MDPI stays neutral with regard to jurisdictional claims in published maps and institutional affiliations. |
© 2021 by the authors. Licensee MDPI, Basel, Switzerland. This article is an open access article distributed under the terms and conditions of the Creative Commons Attribution (CC BY) license (https://creativecommons.org/licenses/by/4.0/).