
A Predictive Approach to Optimize a HHO Generator Coupled with Solar PV as a Standalone System

 ,
,  , , , , and
Abstract
:1. Introduction
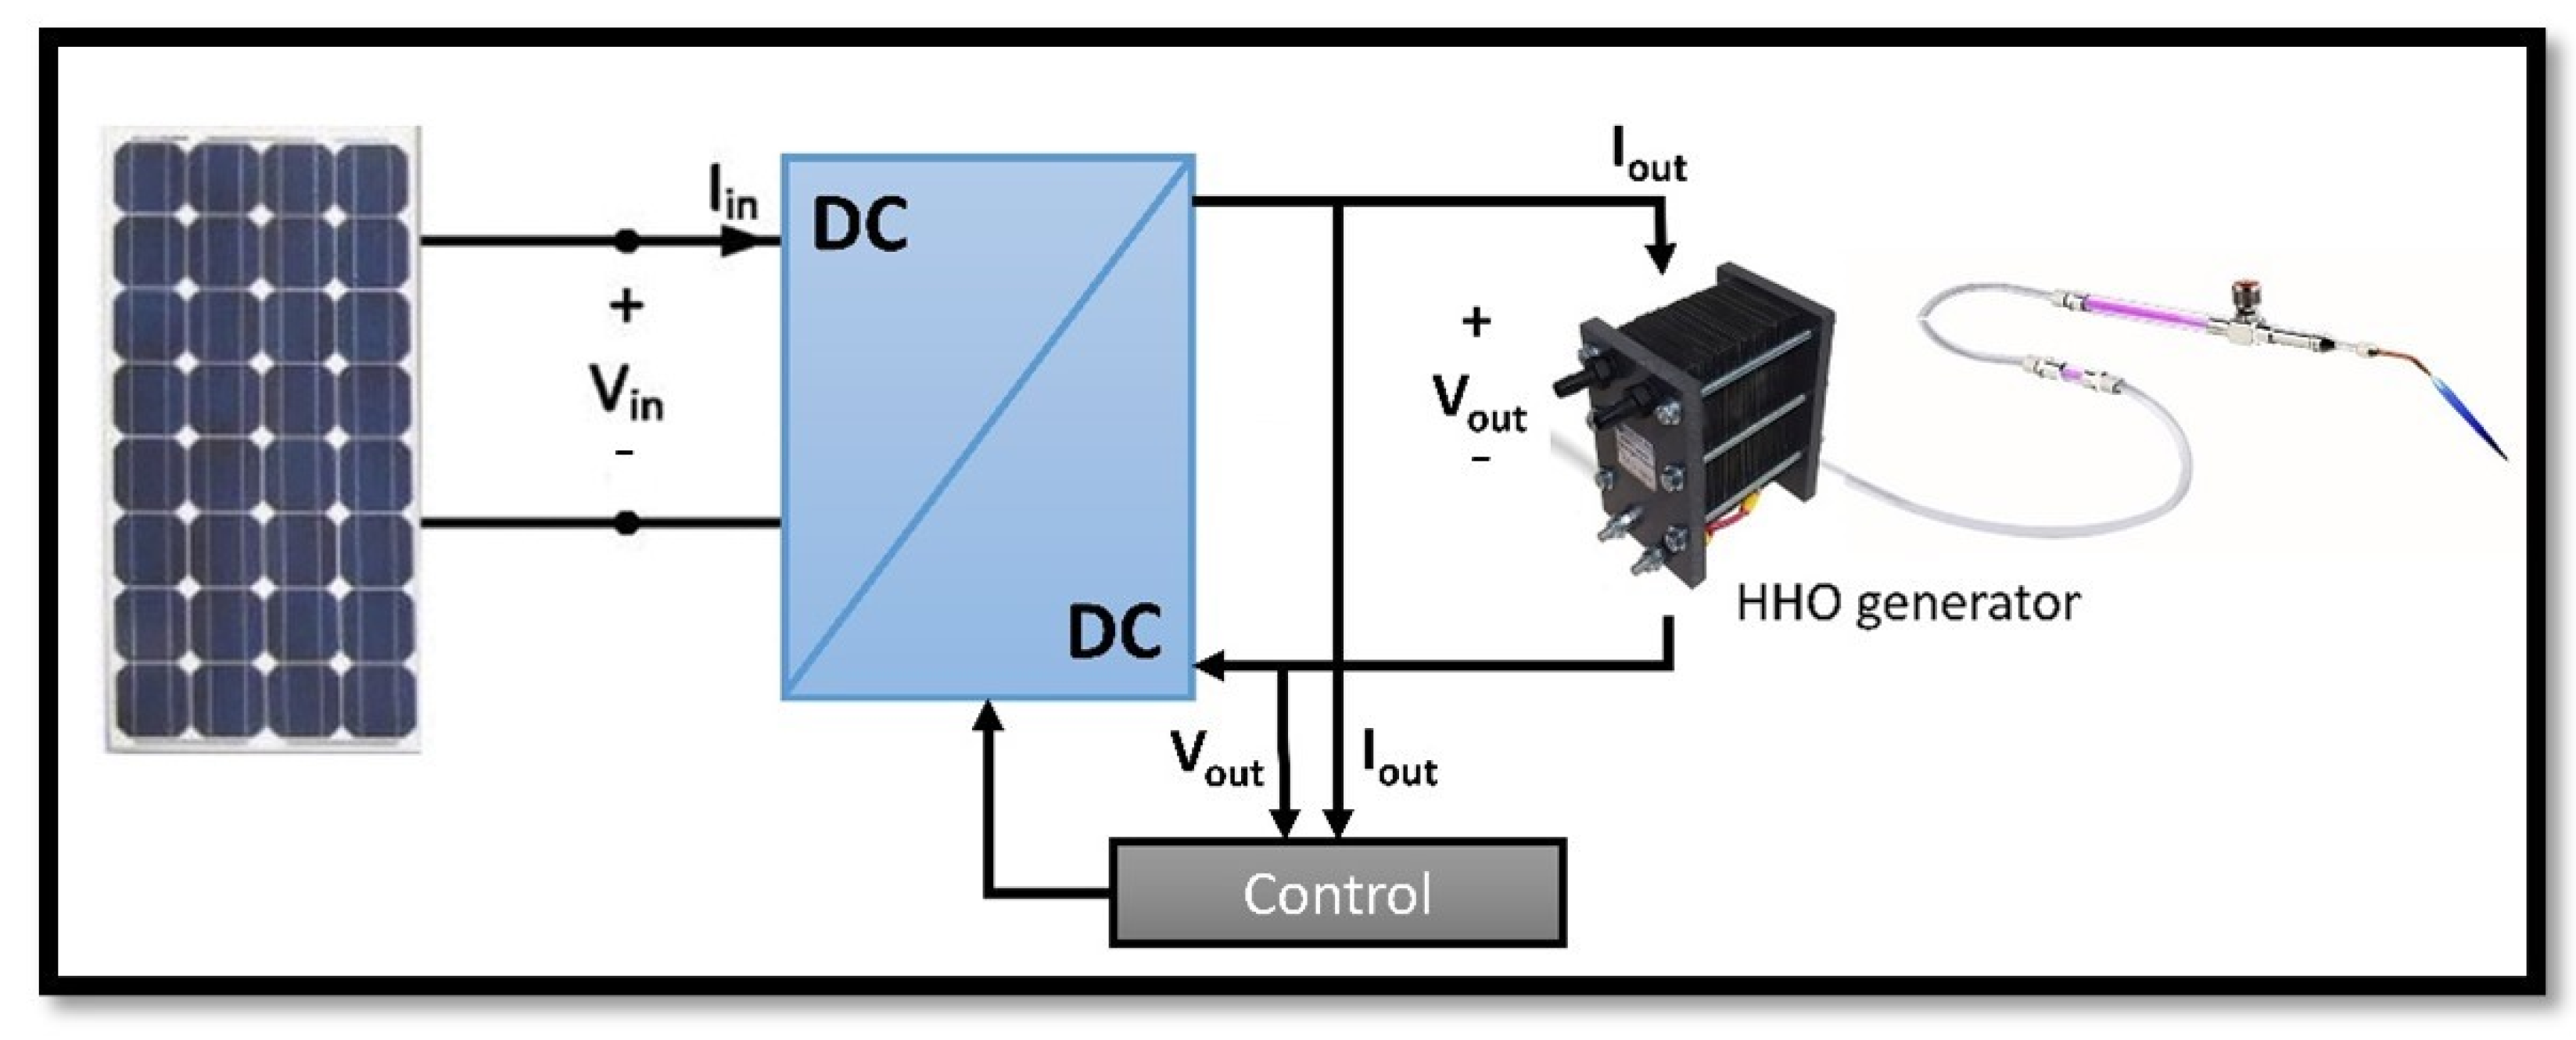
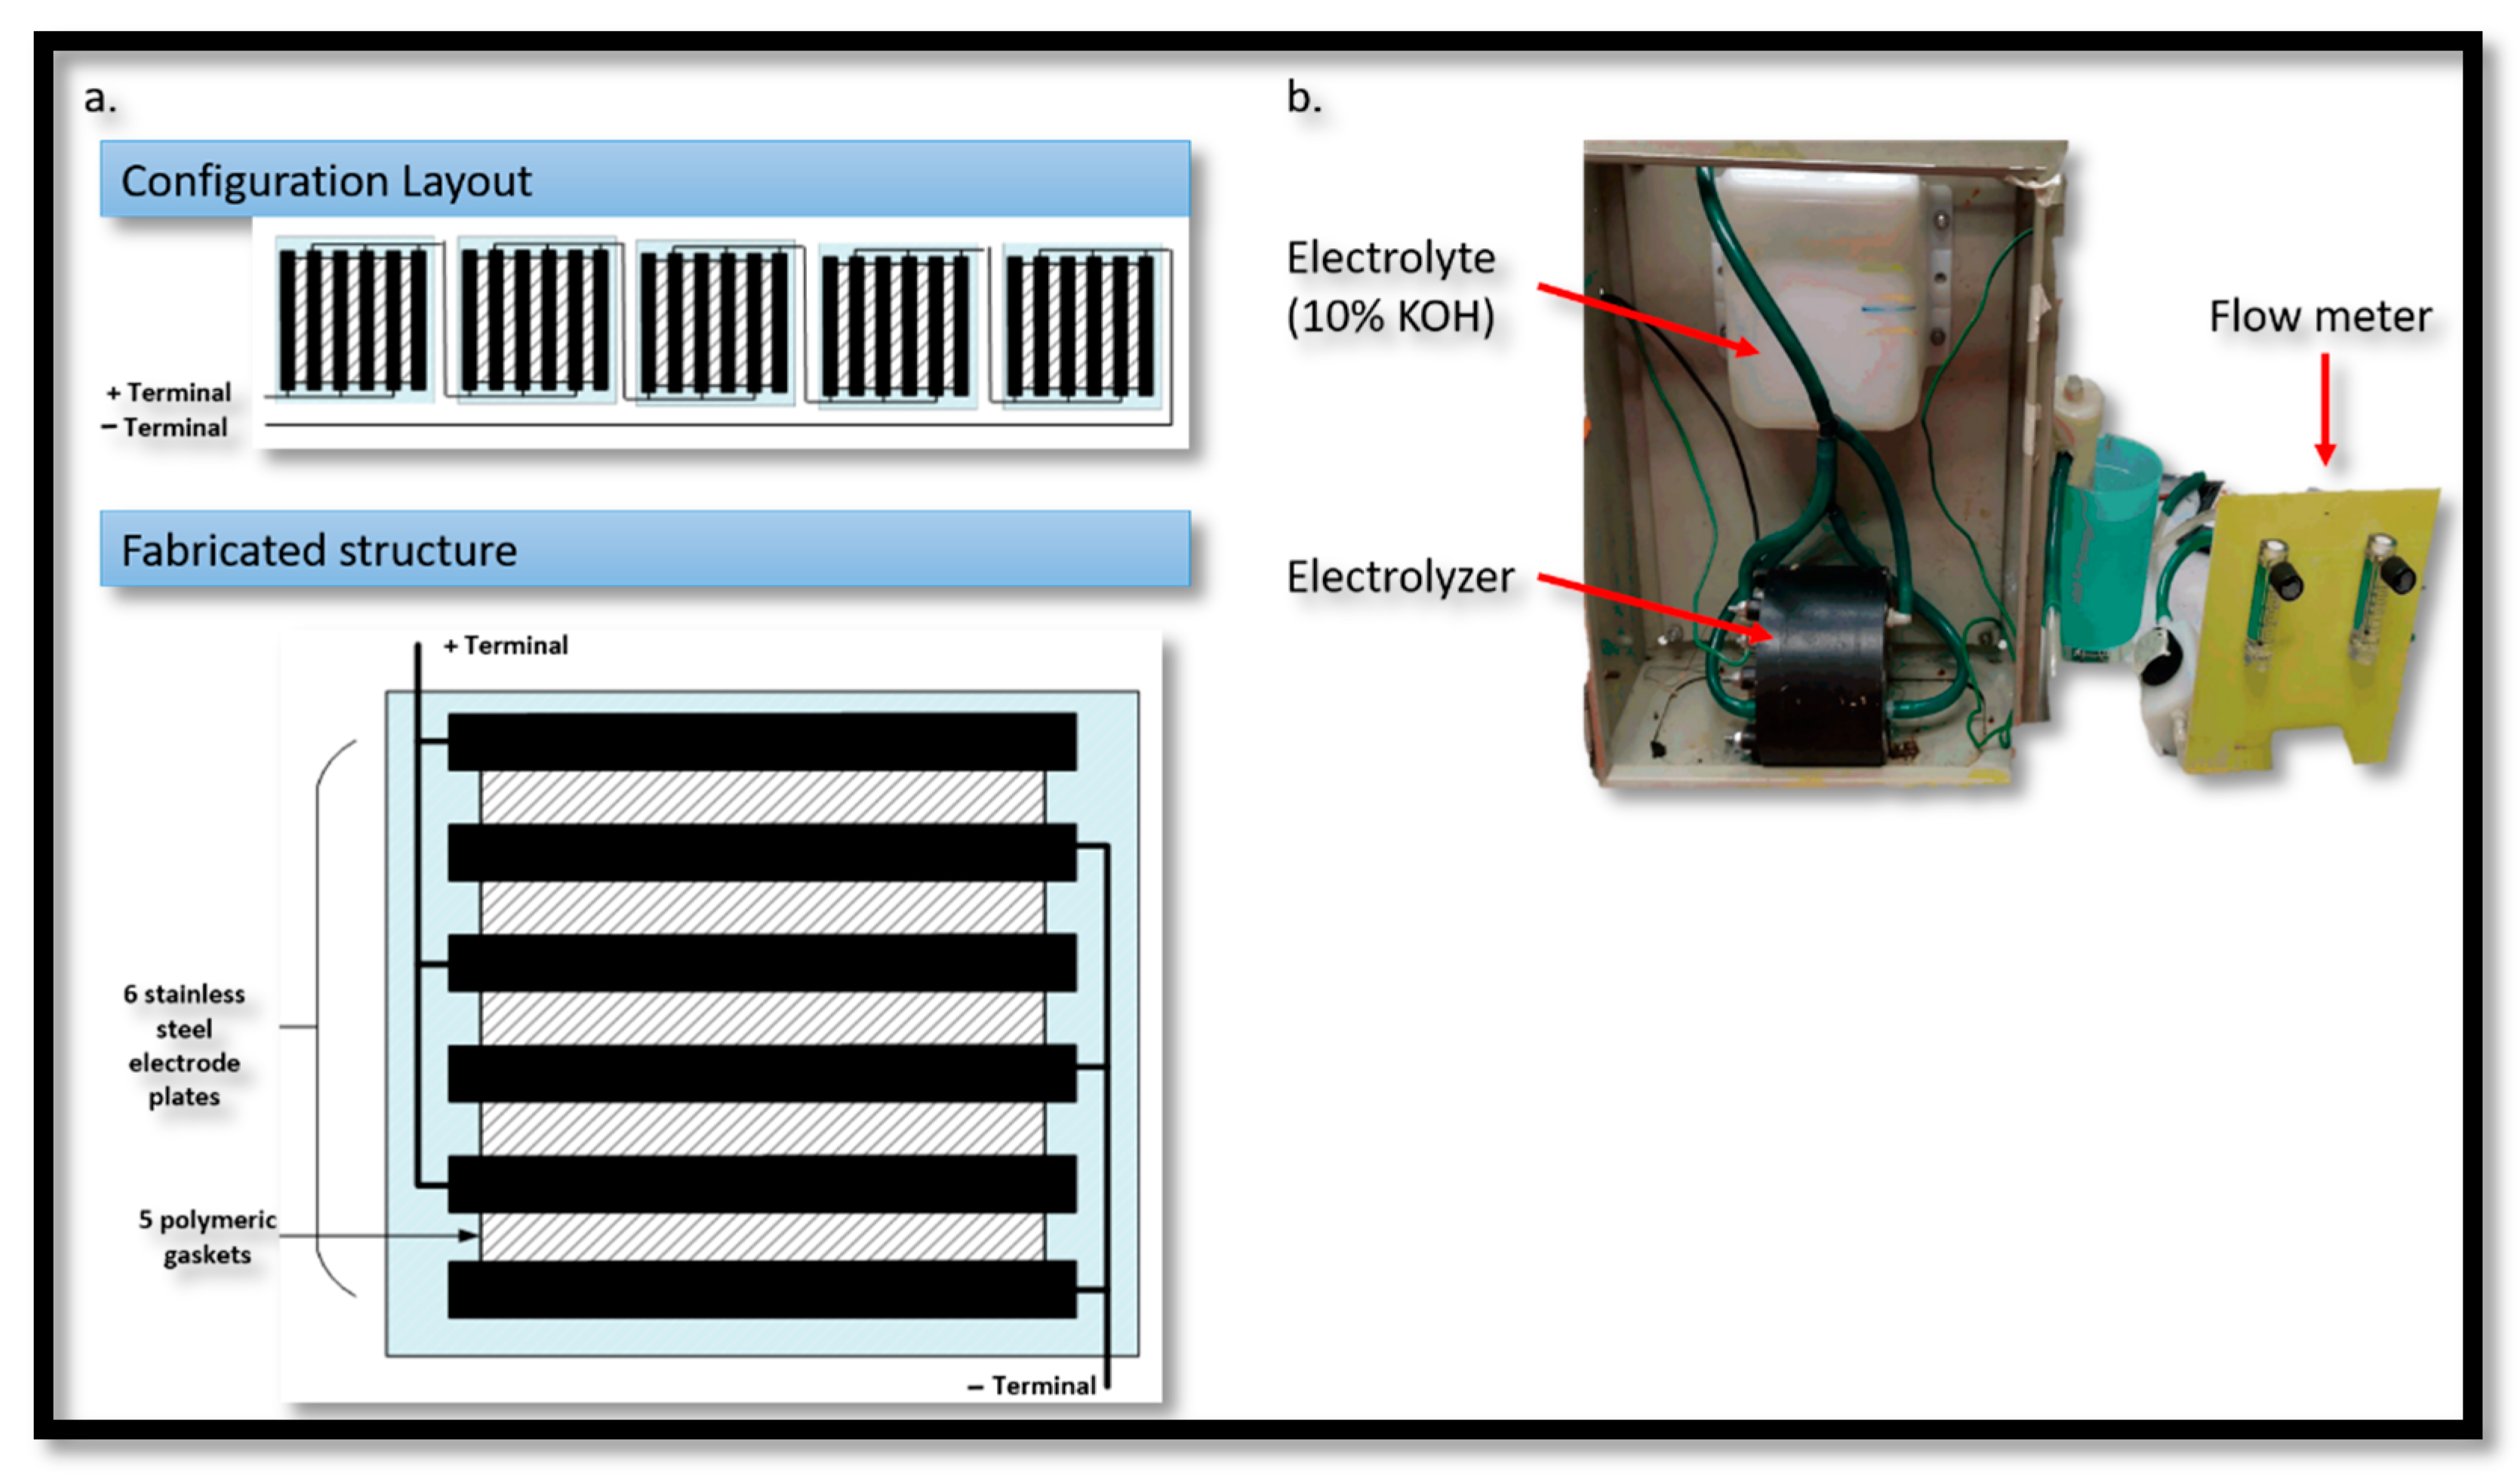
2. Design & Technique
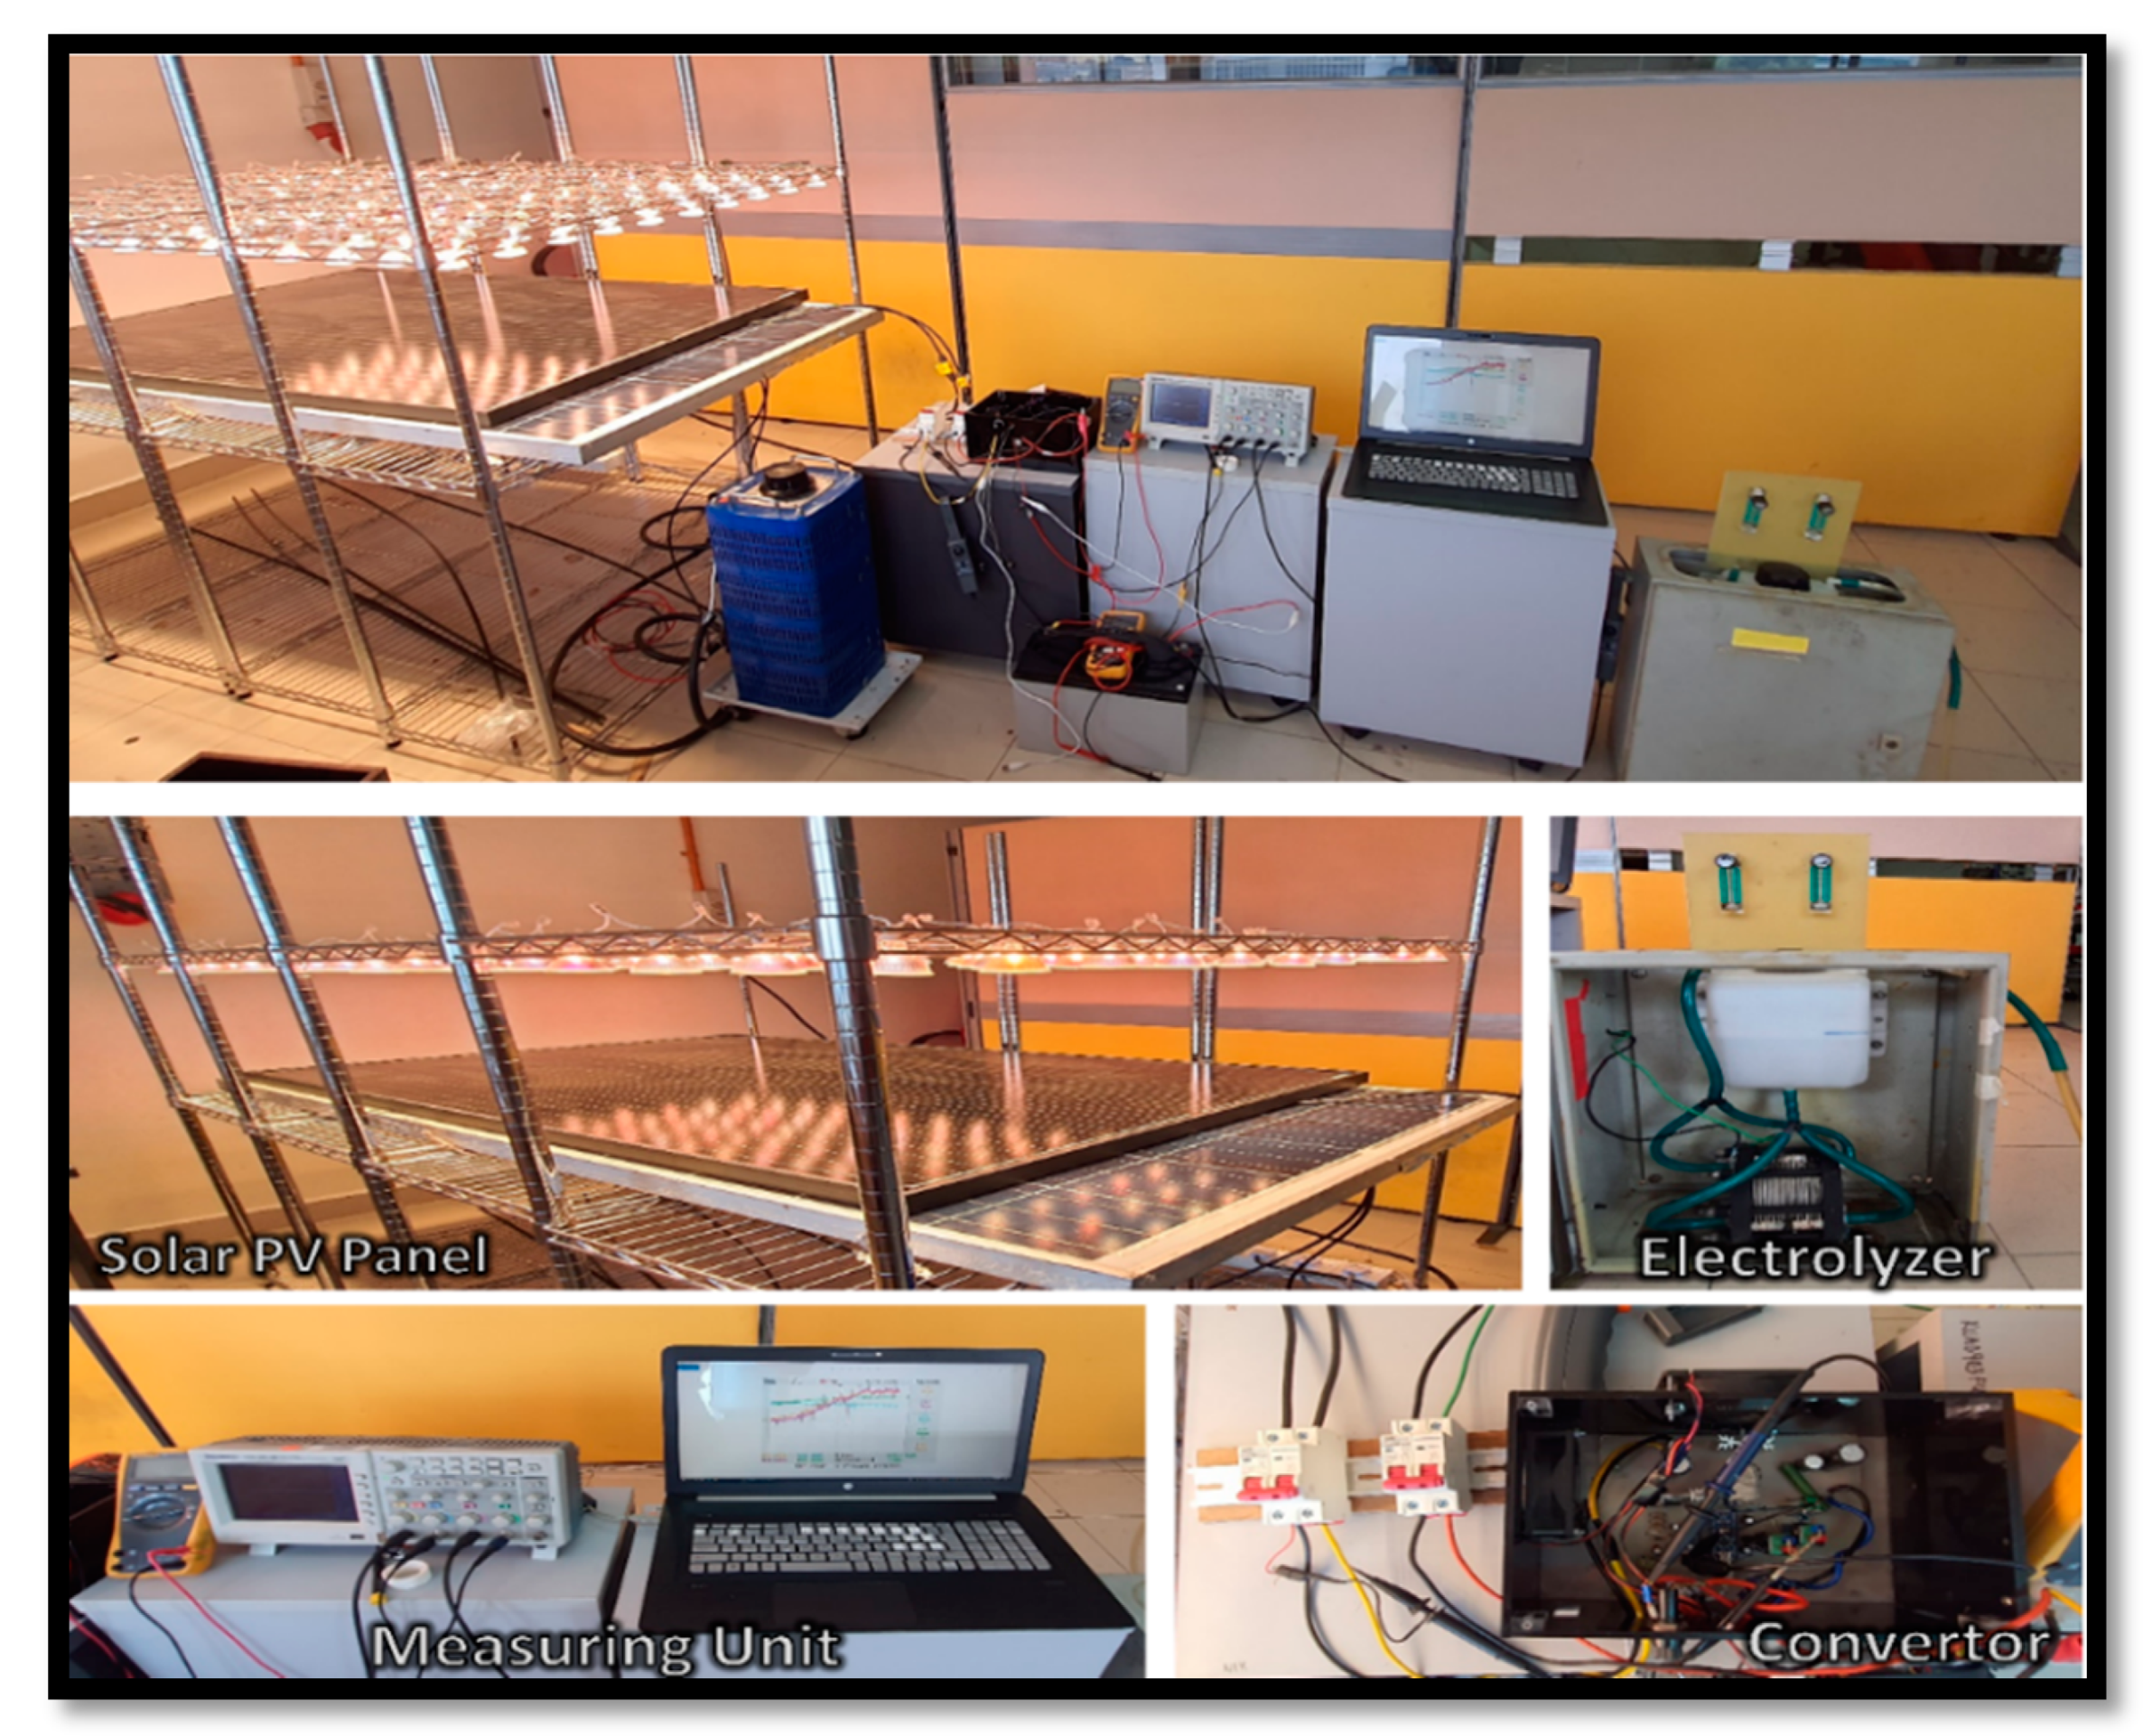
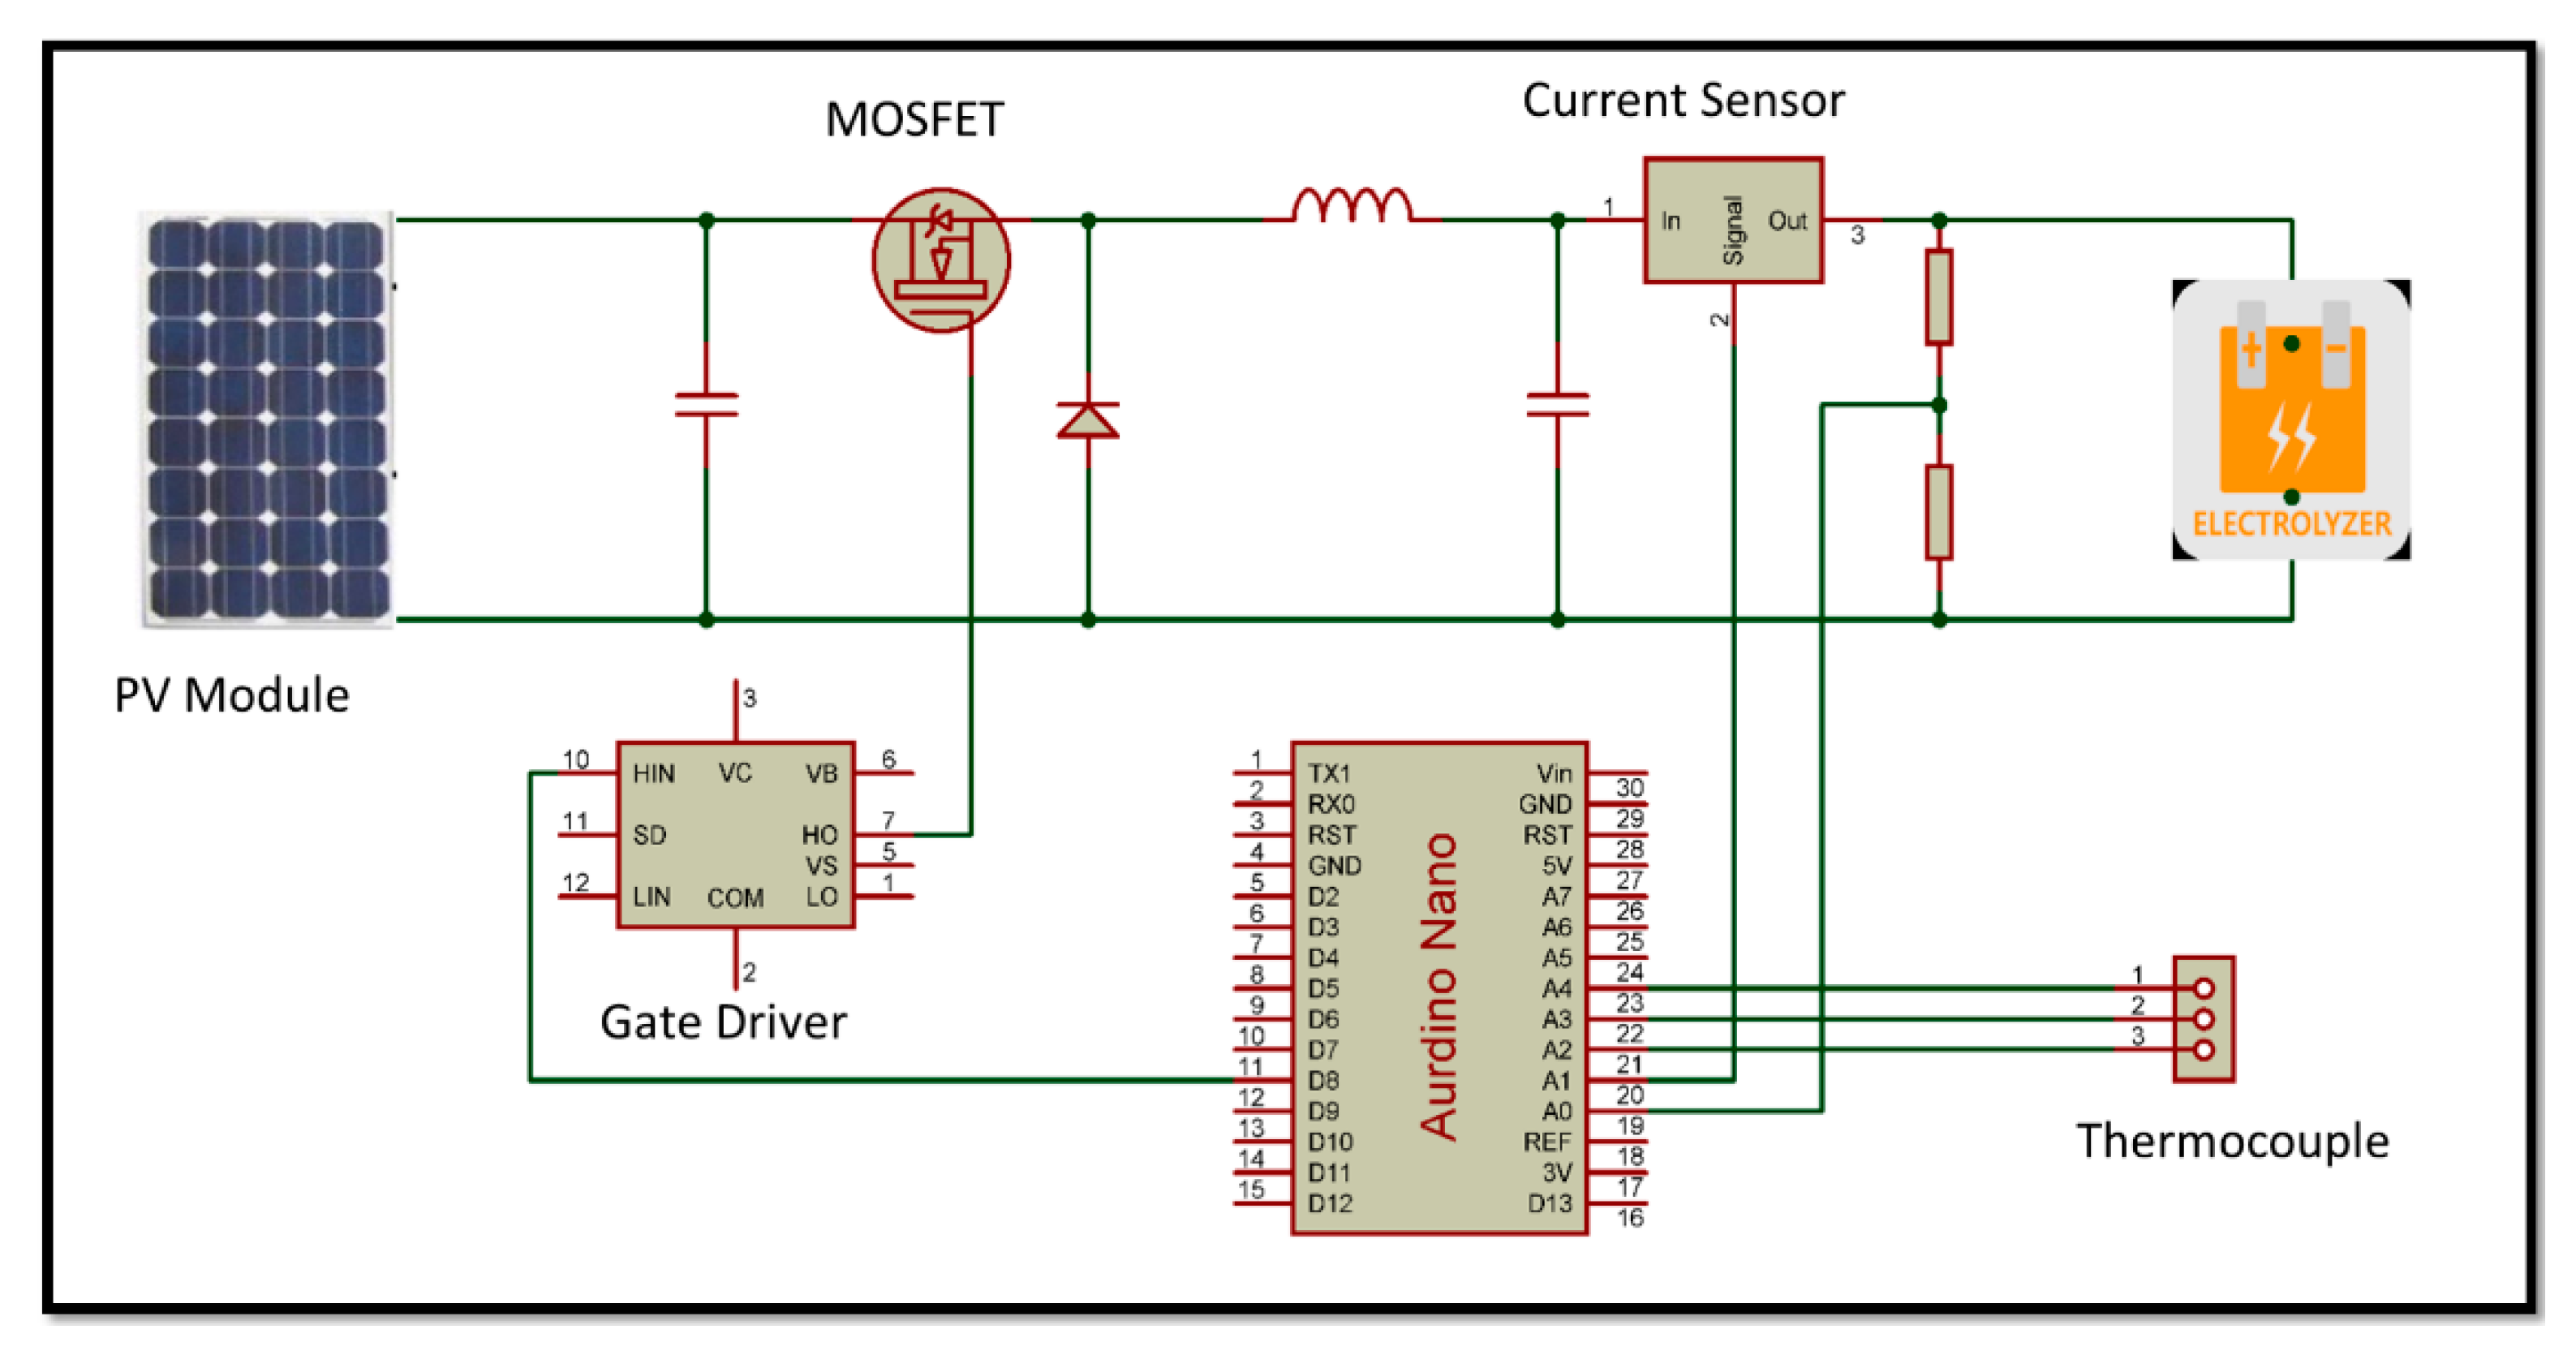
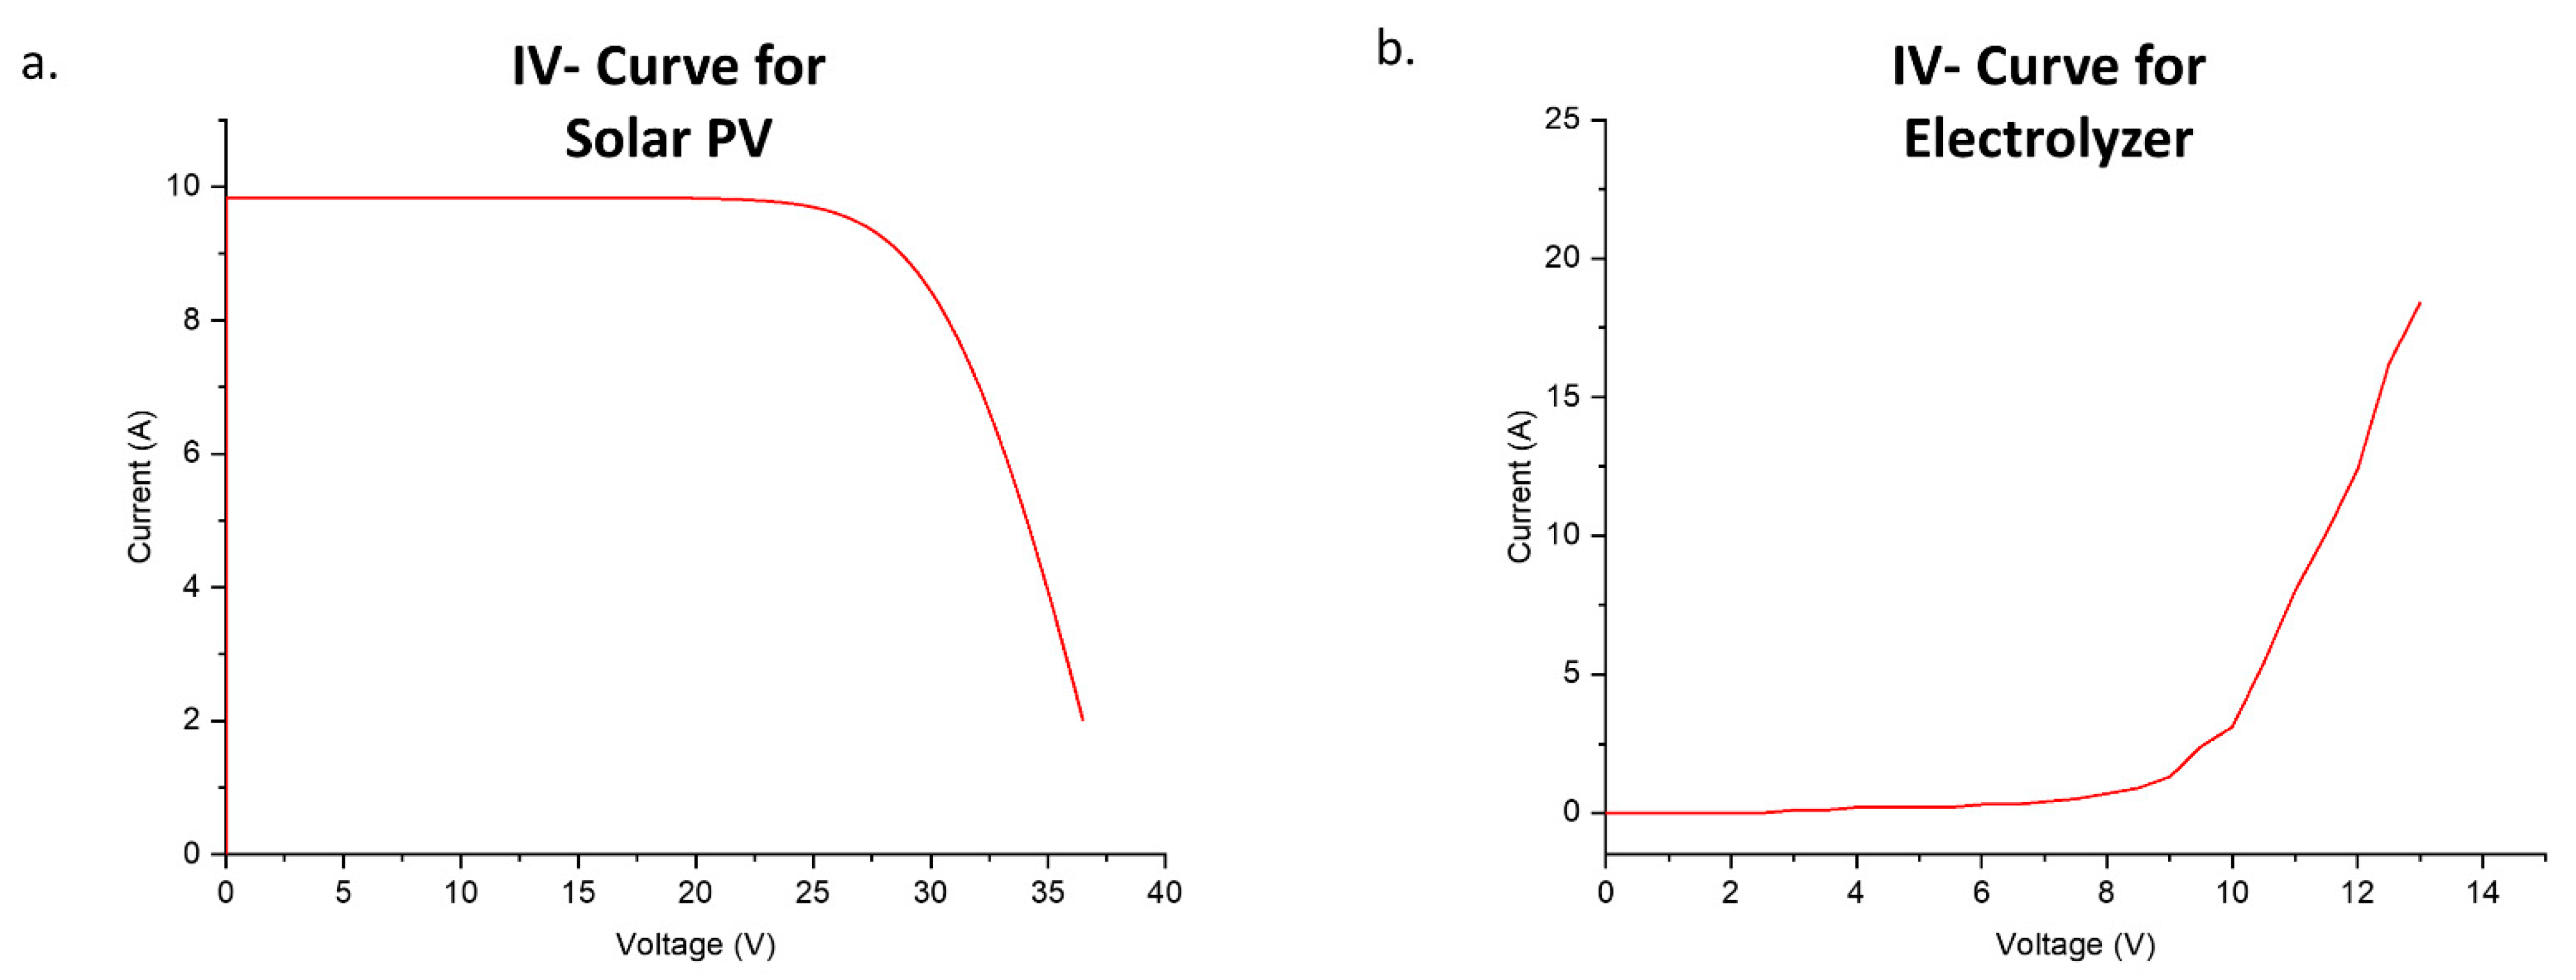
2.1. Experimental Setup
2.1.1. Indoor Setup
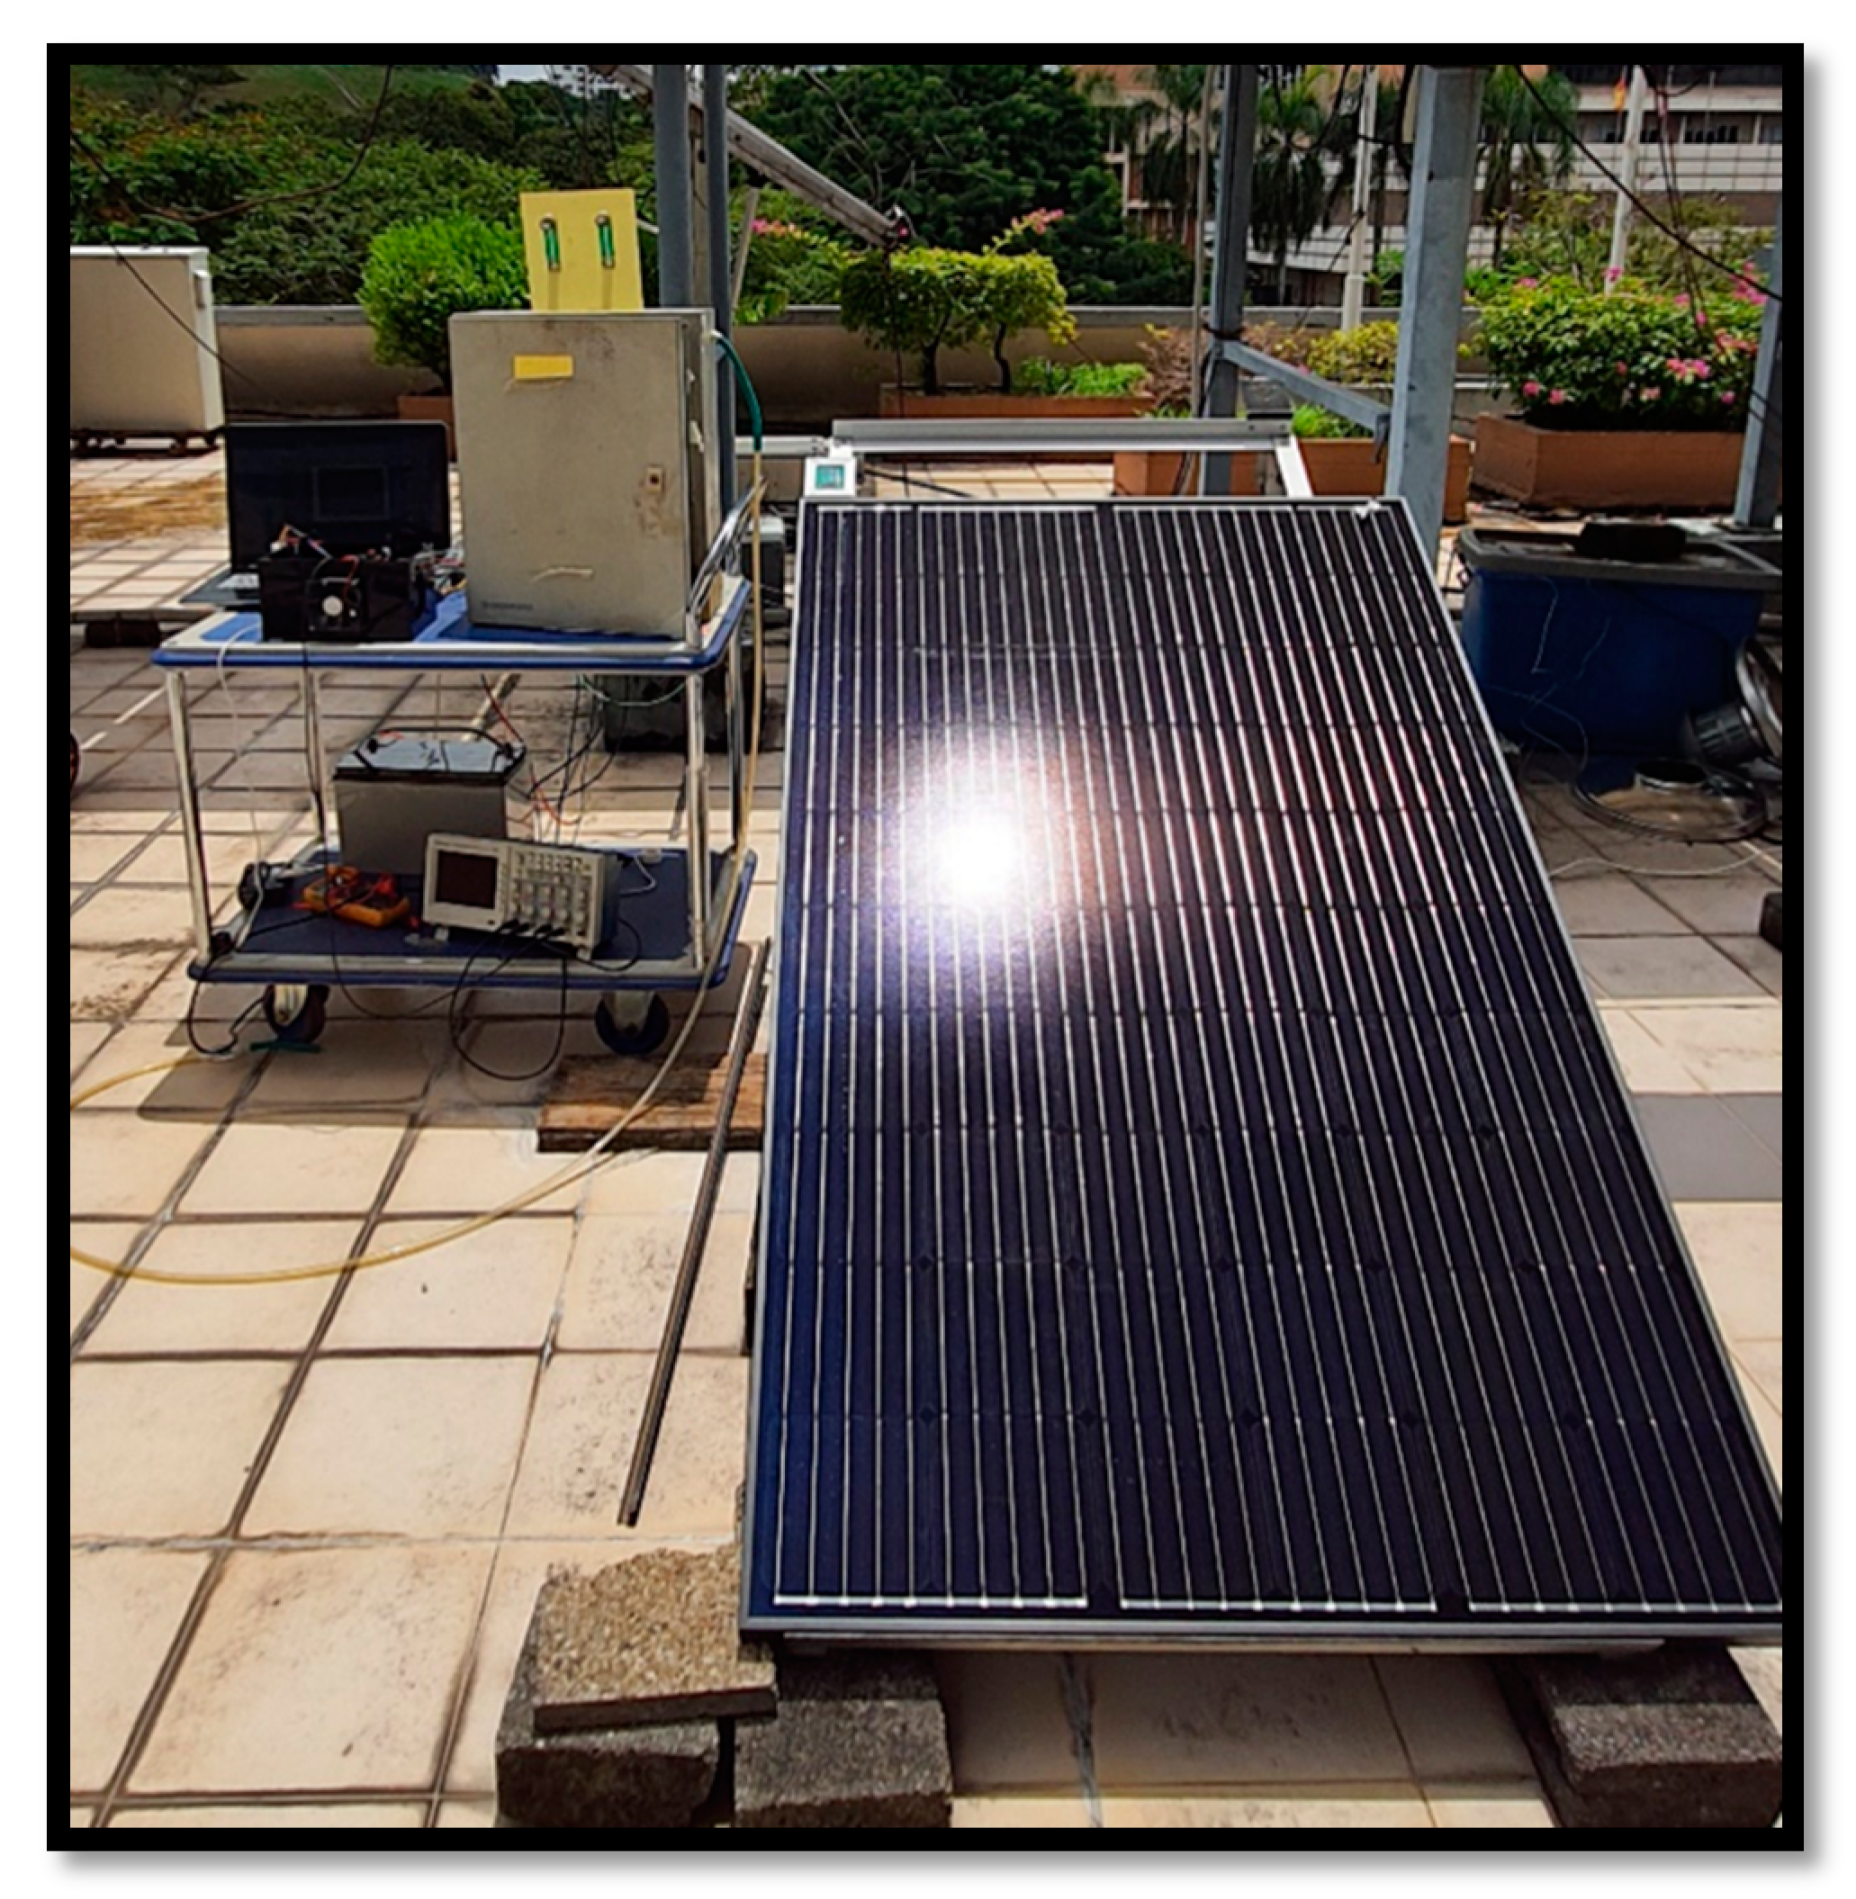
2.1.2. Outdoor Setup
2.2. Buck-Convertor Design
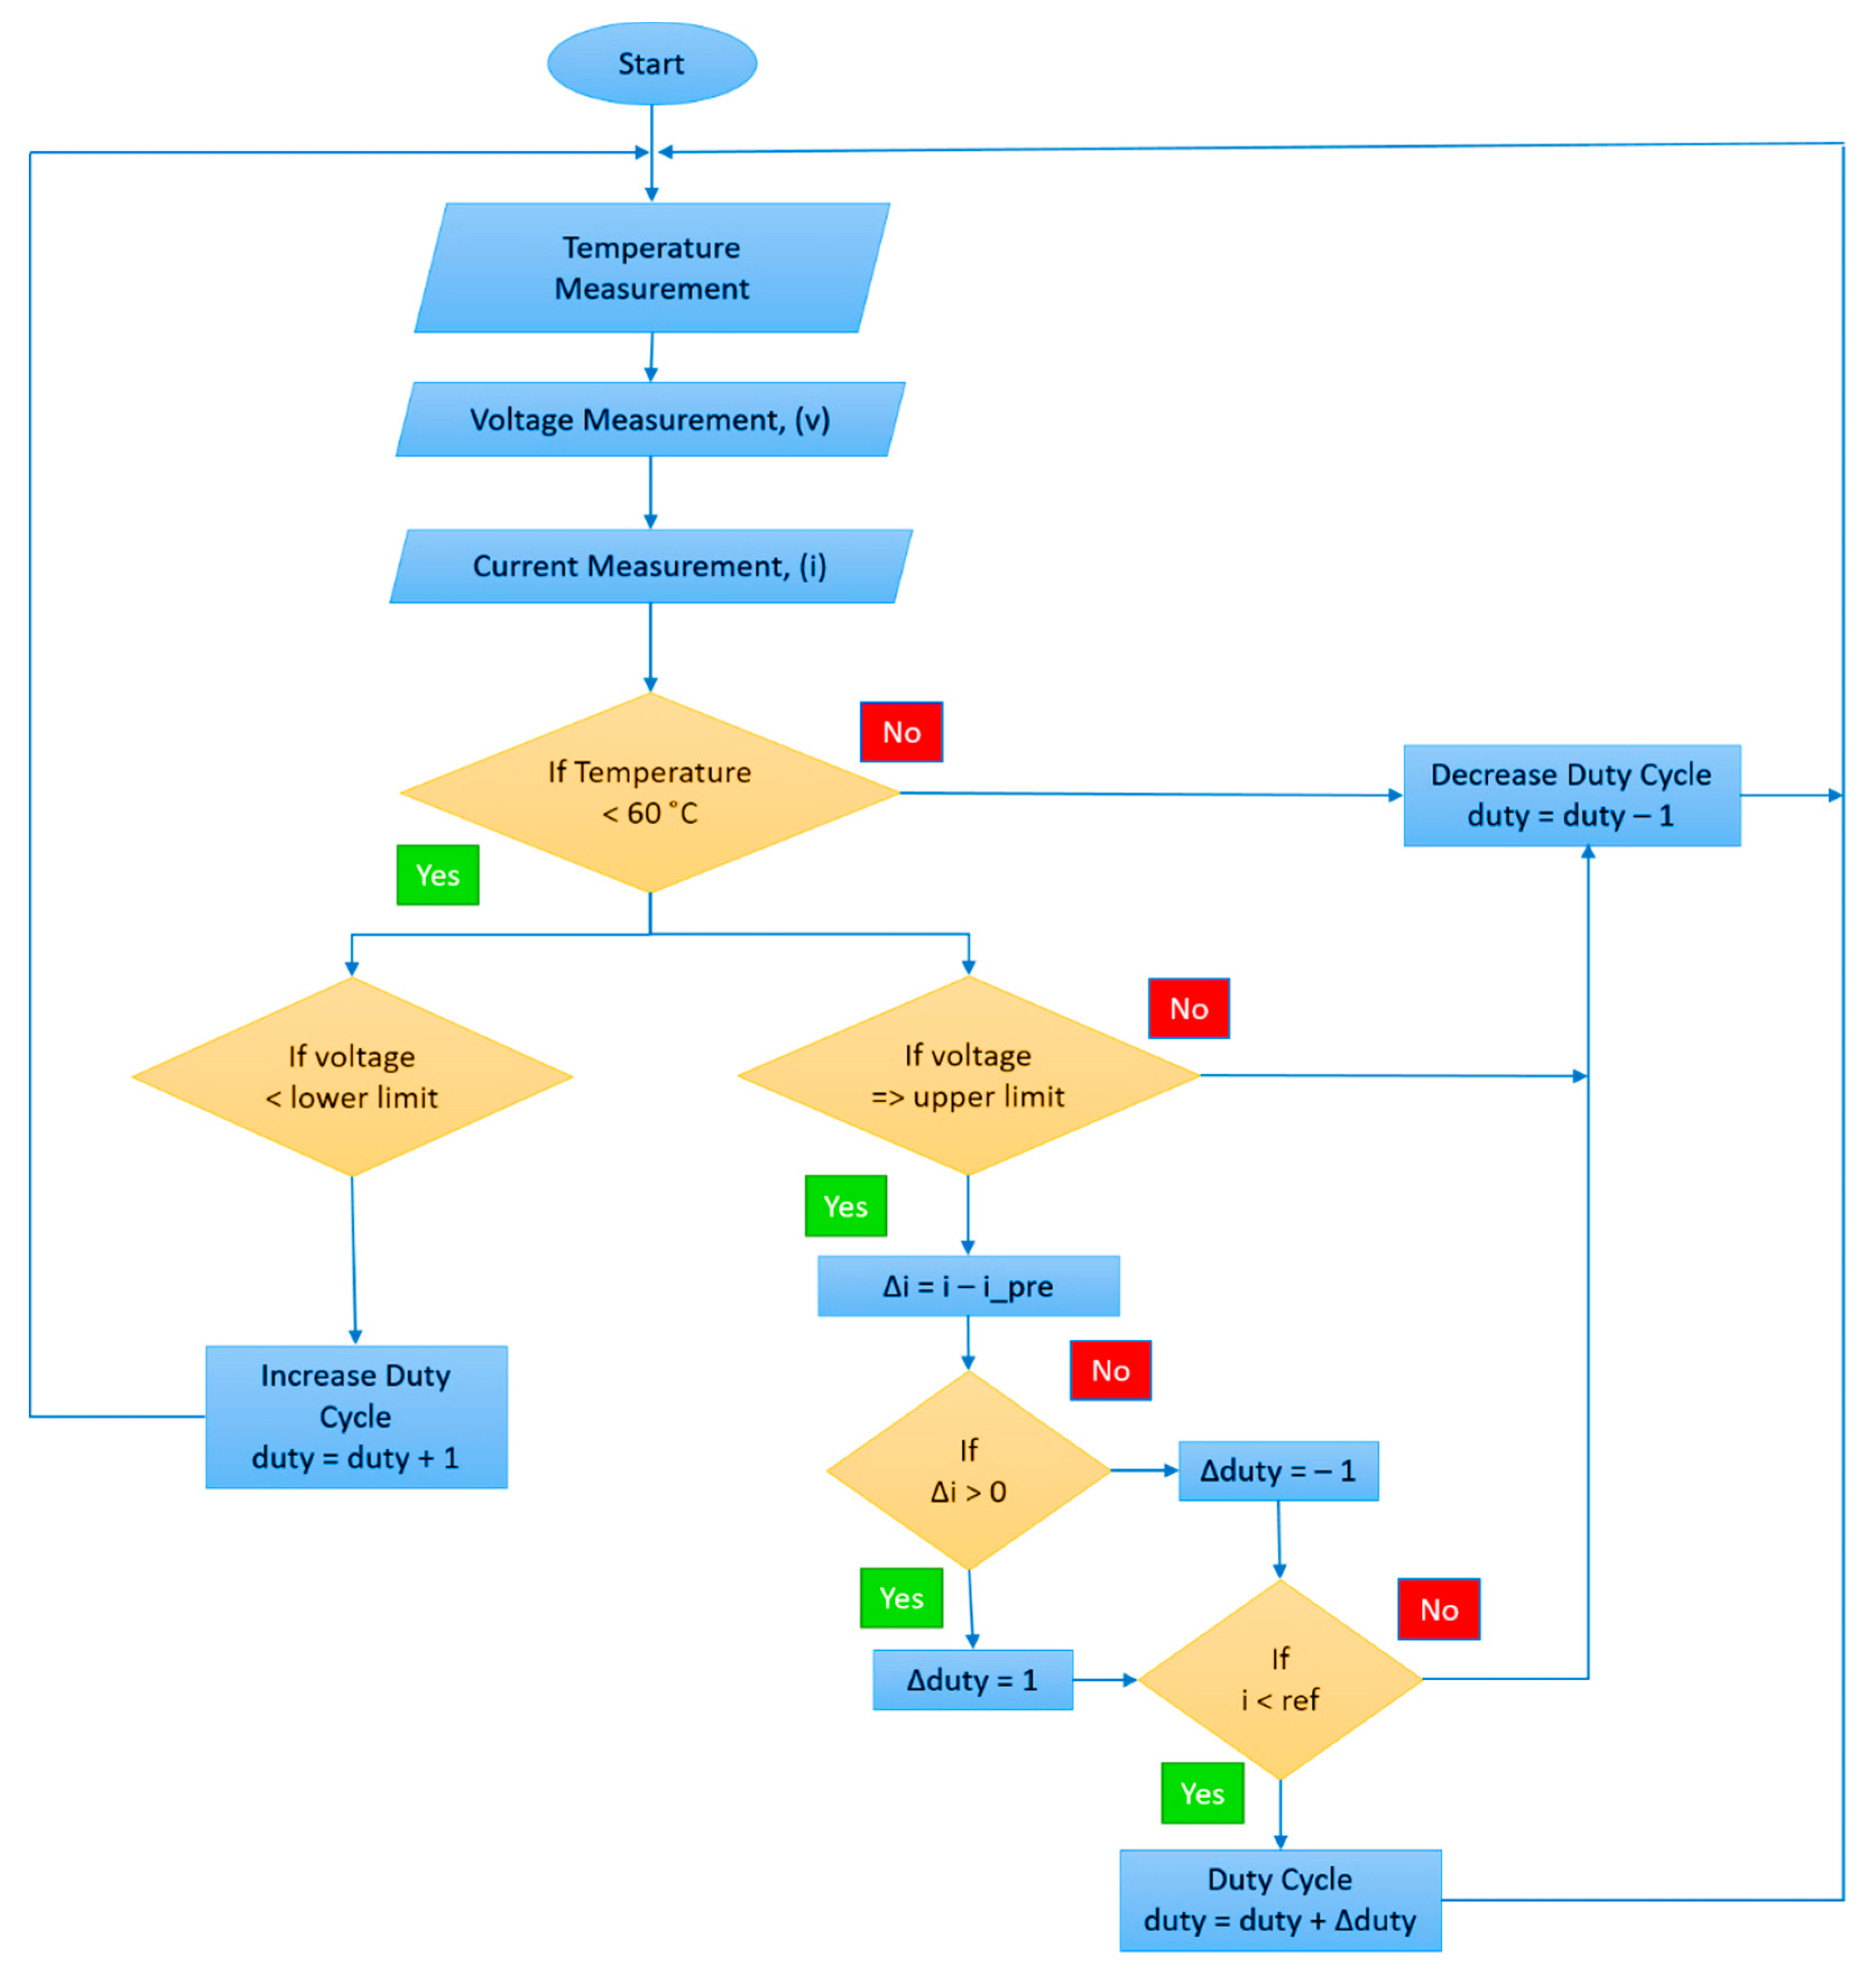
2.3. Control Strategy
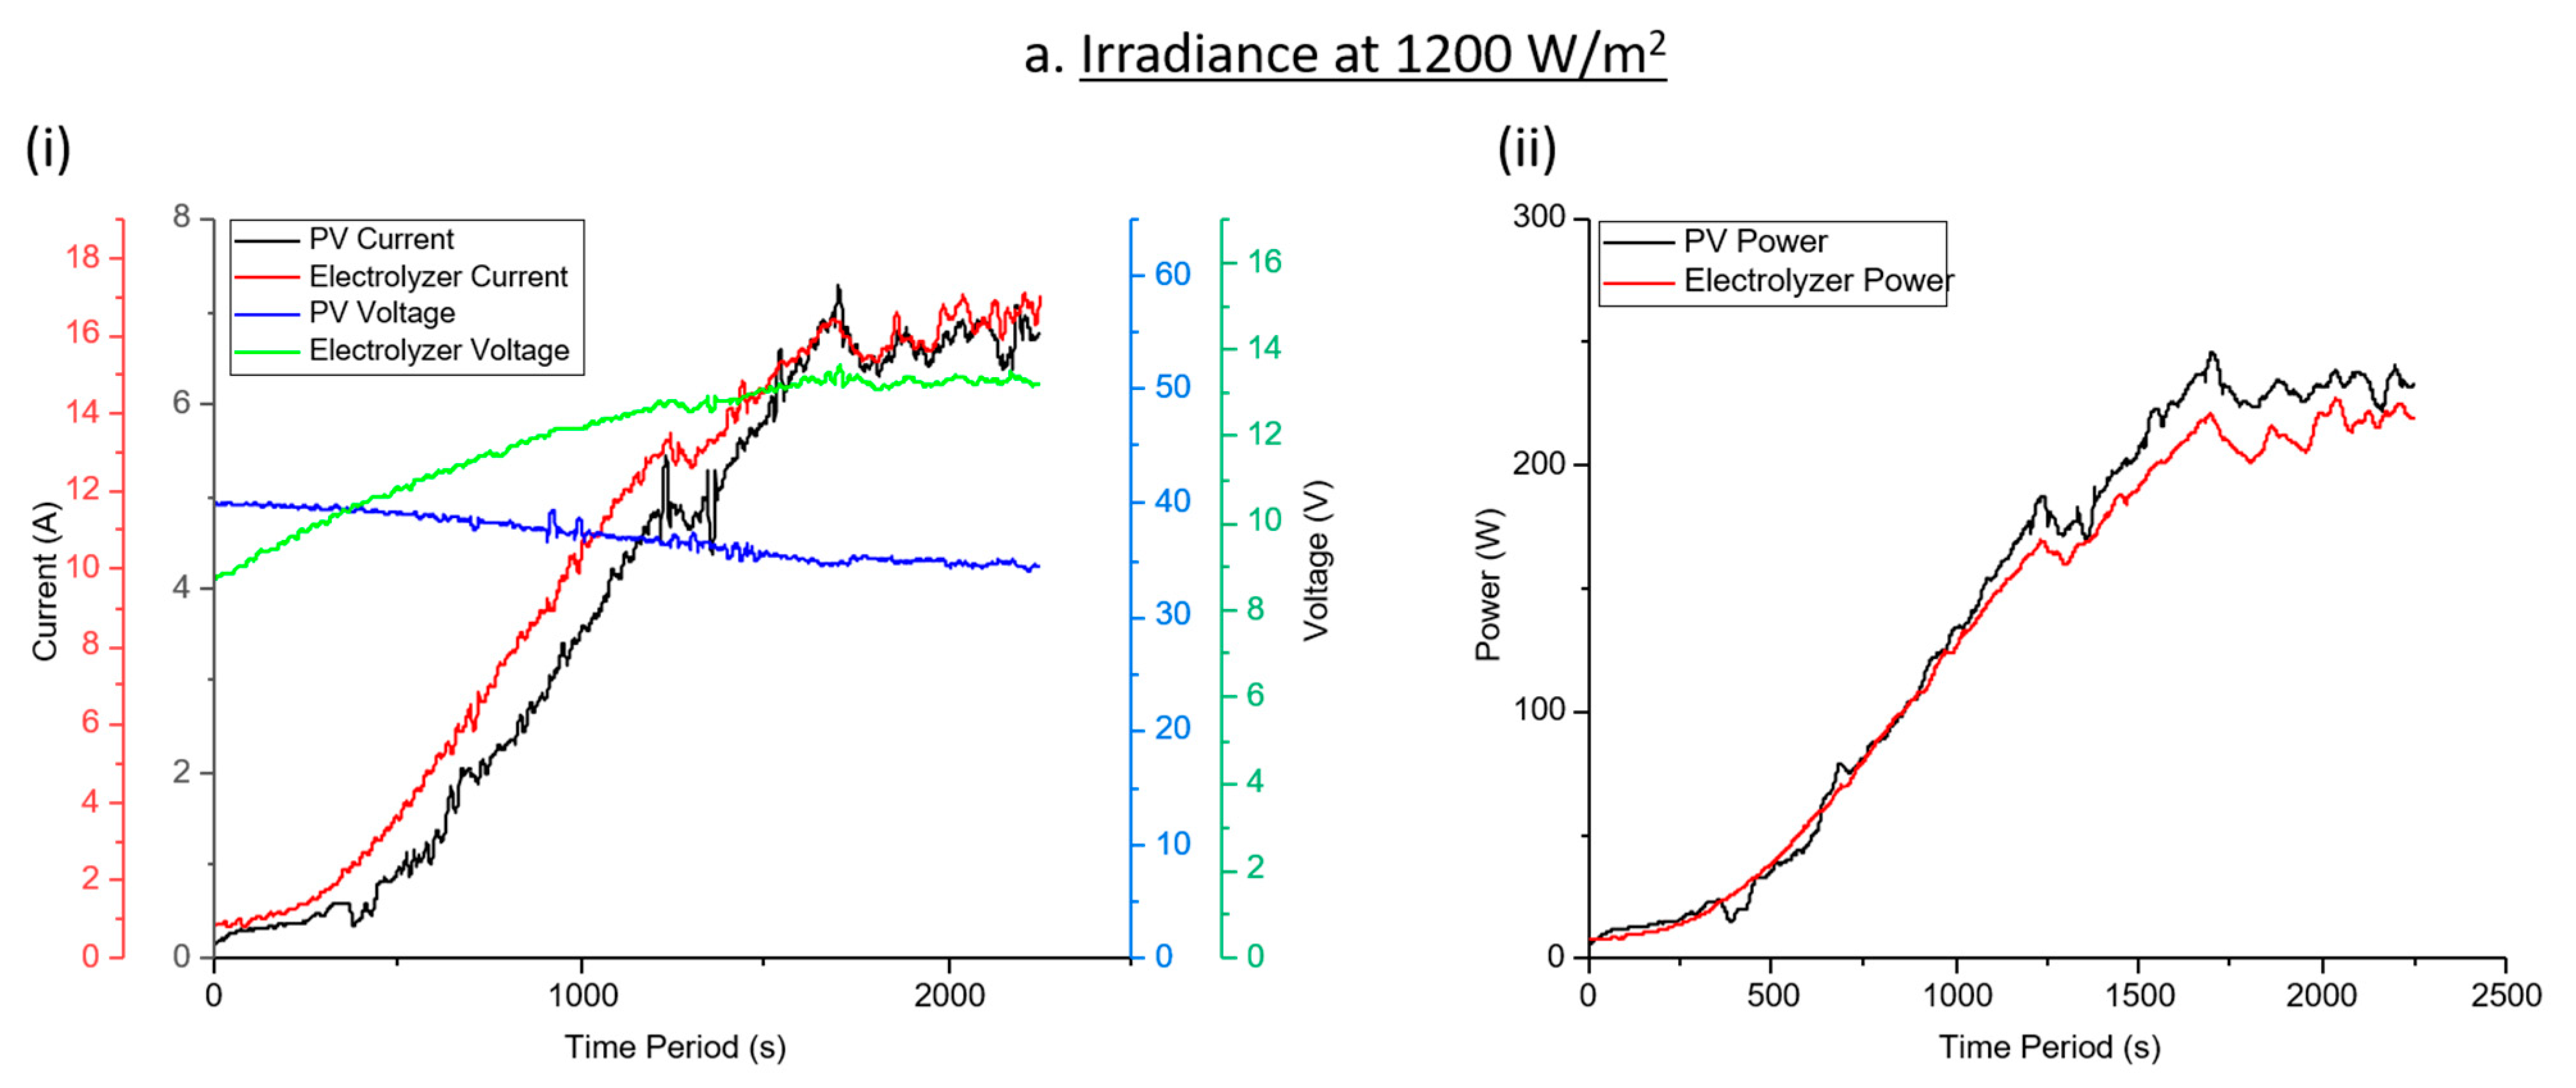
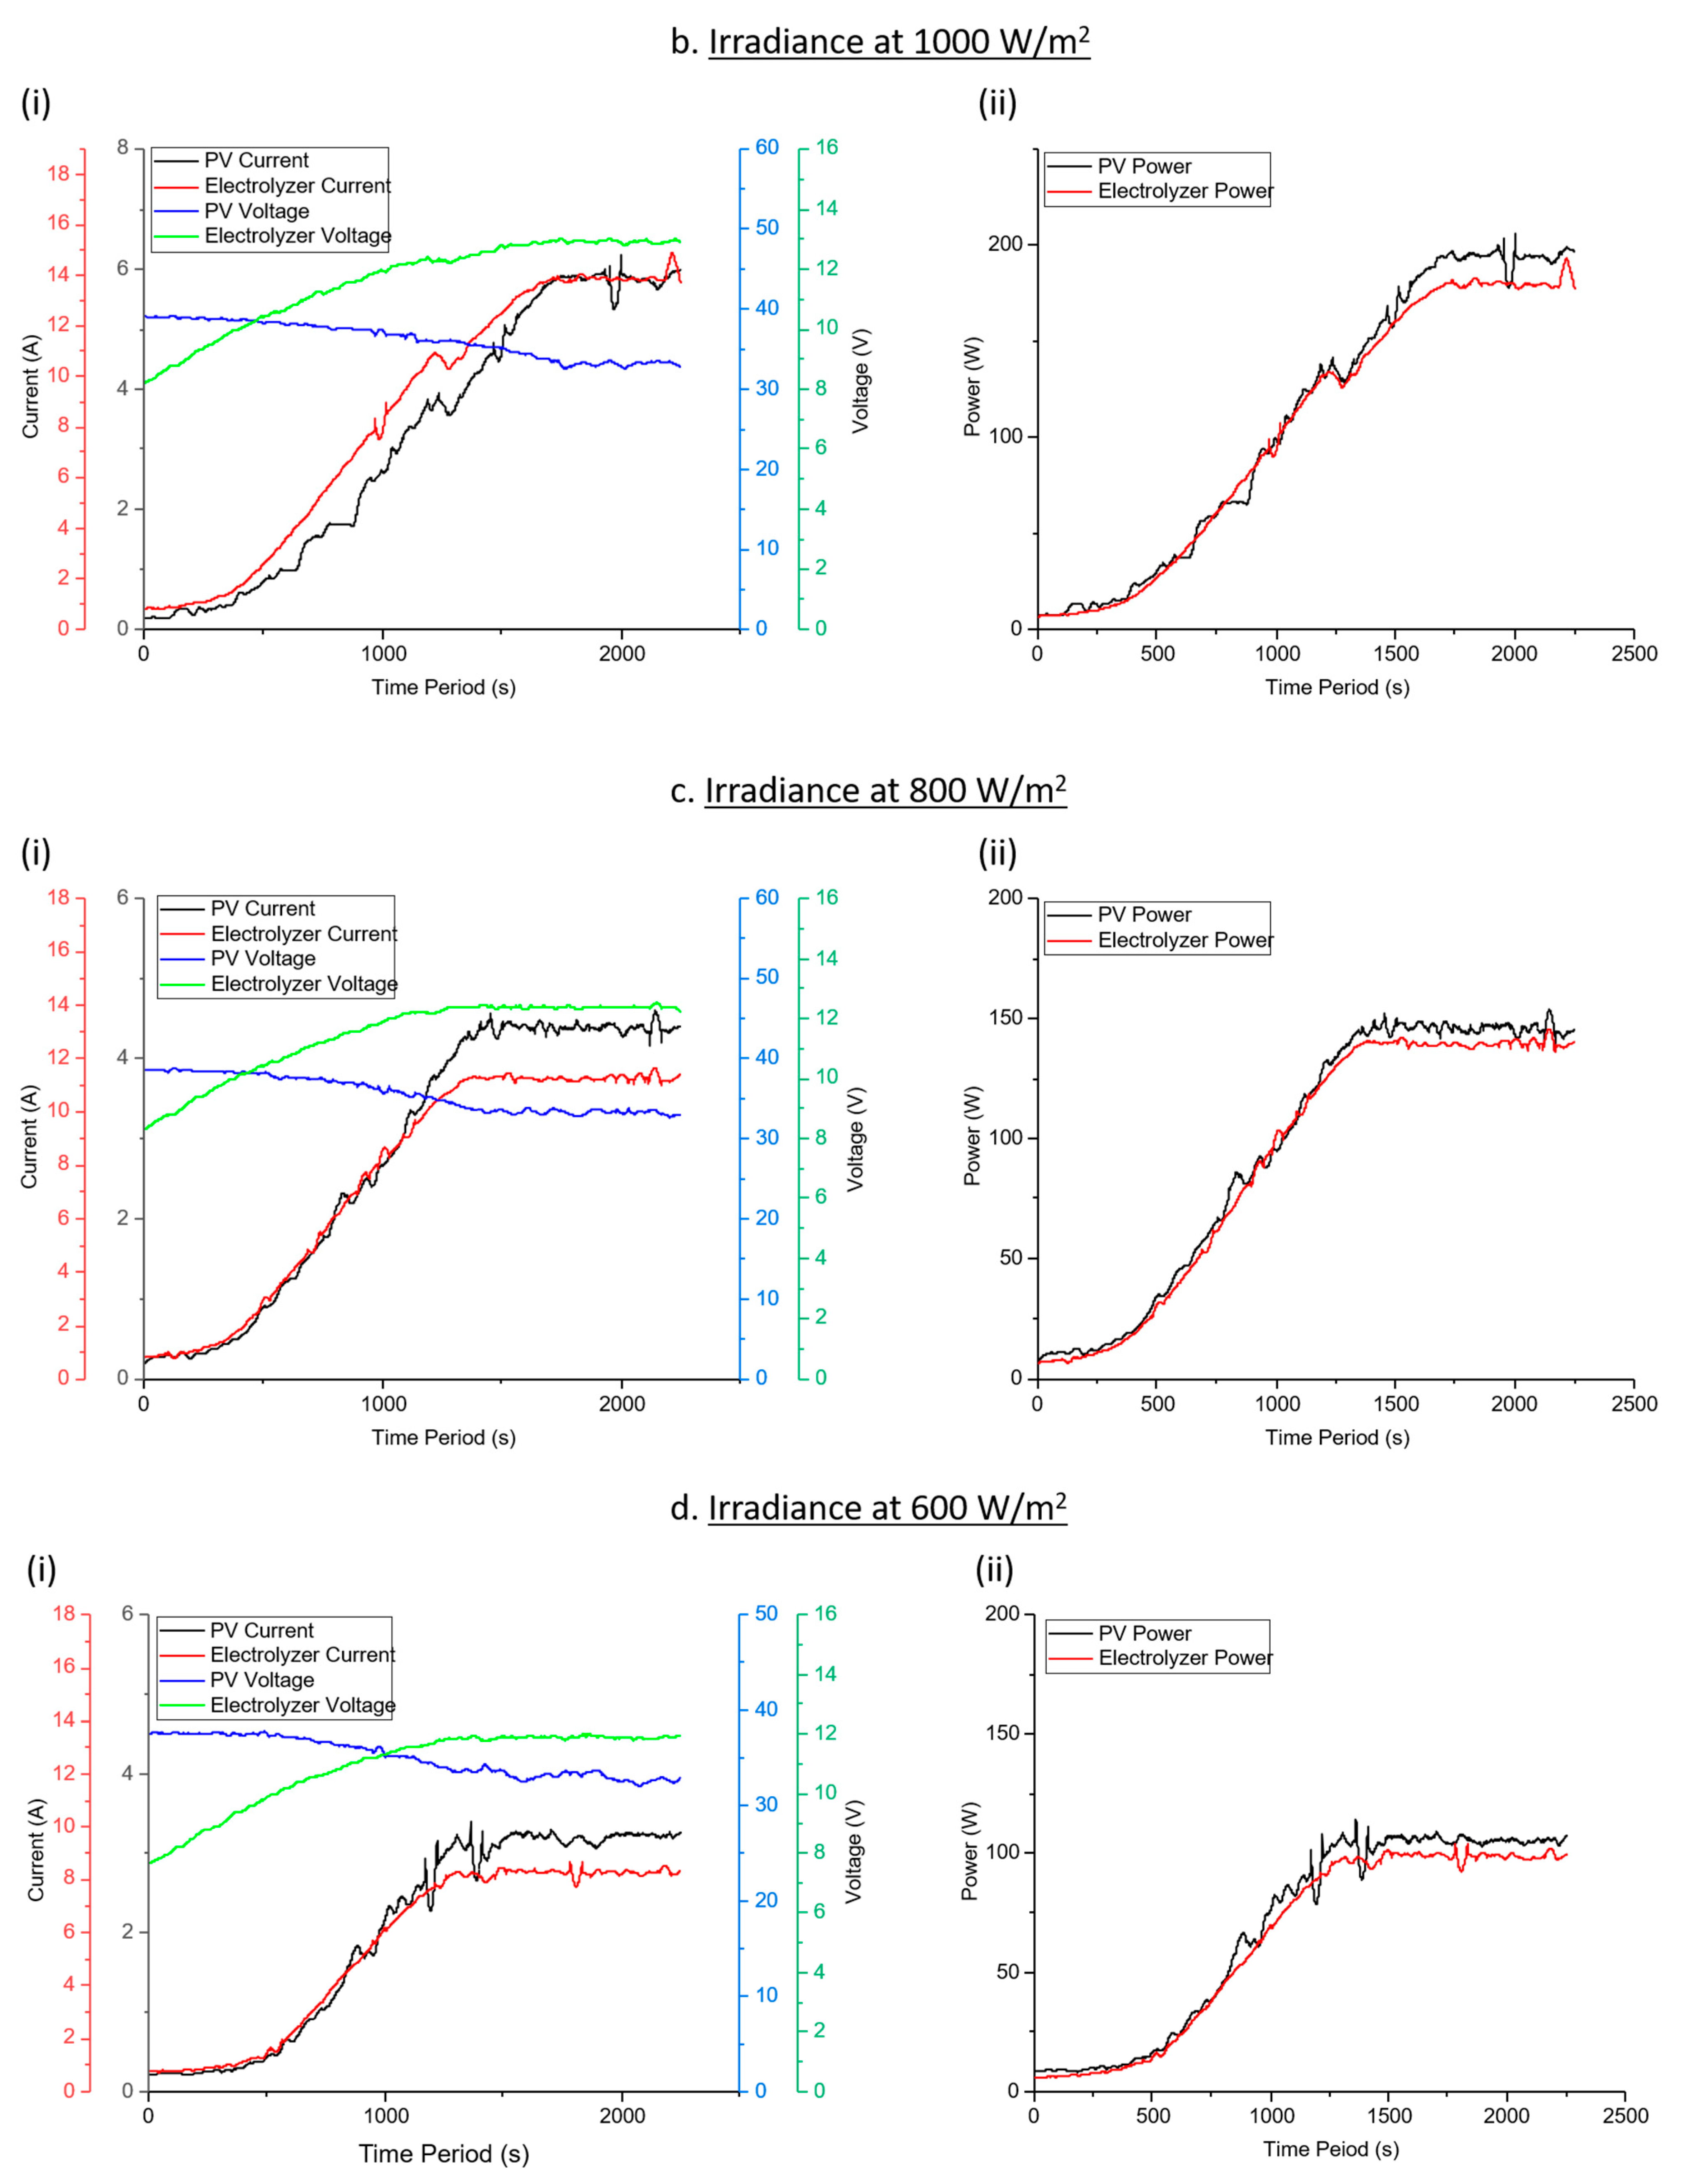
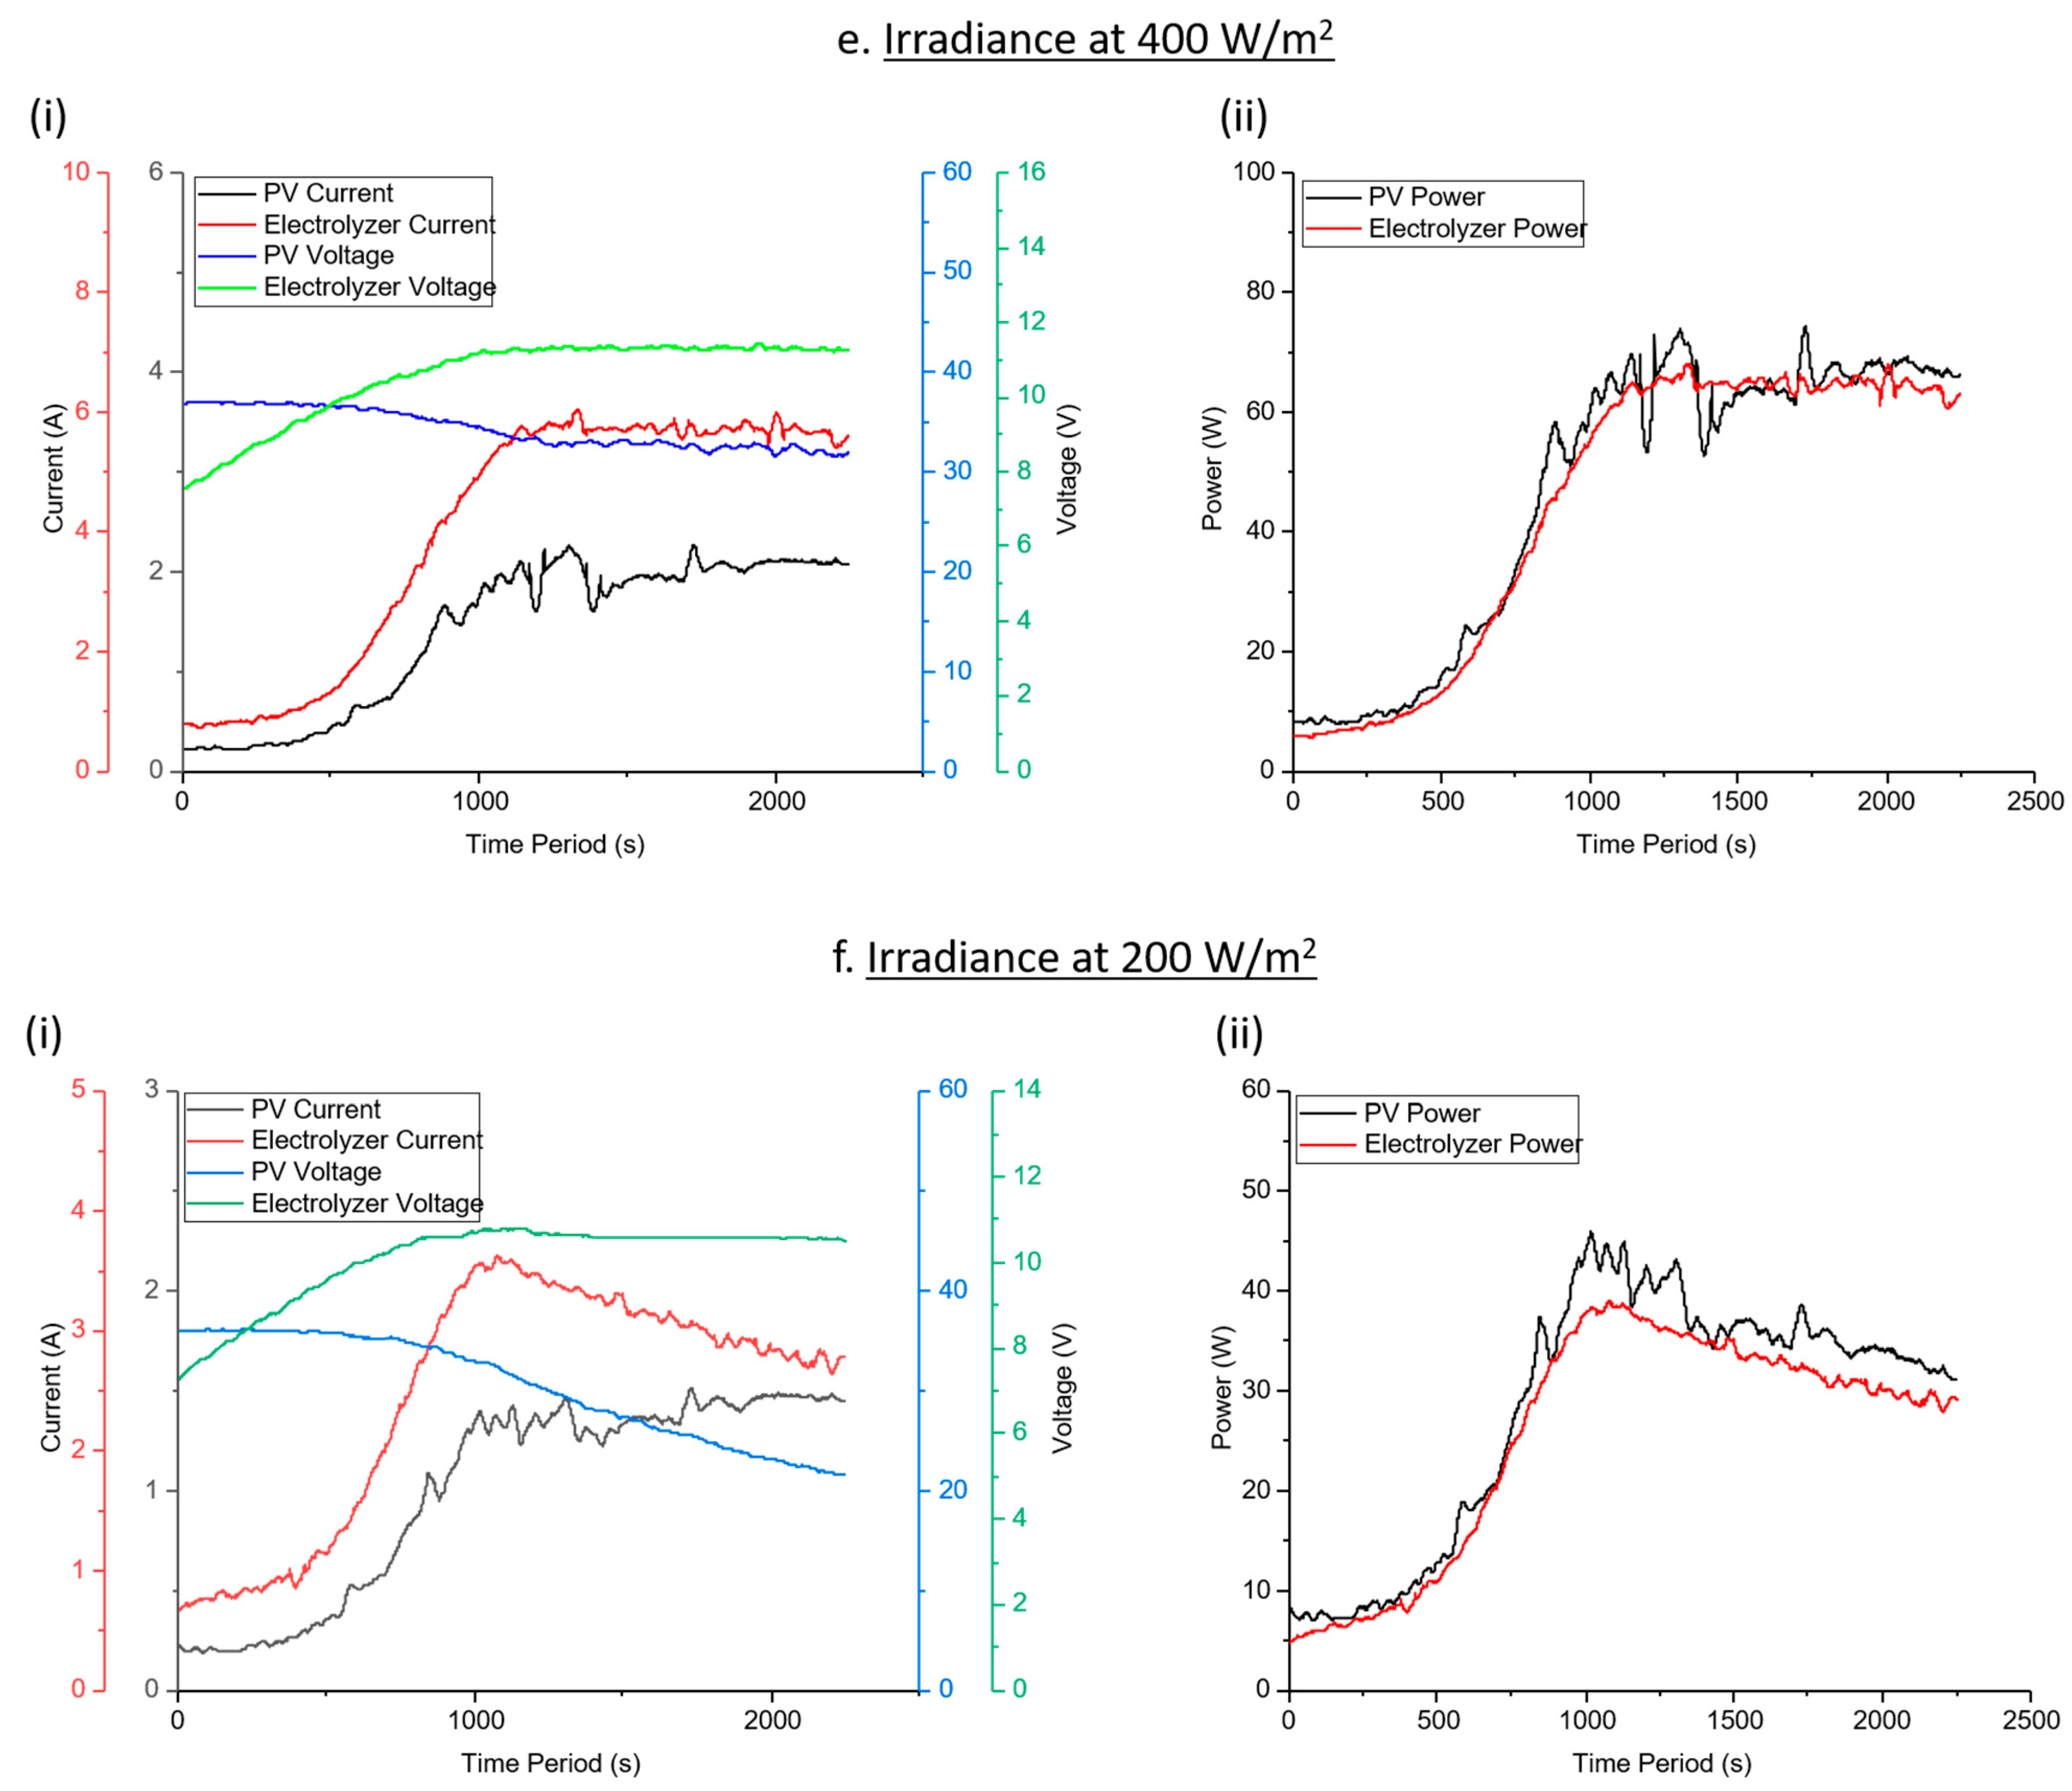
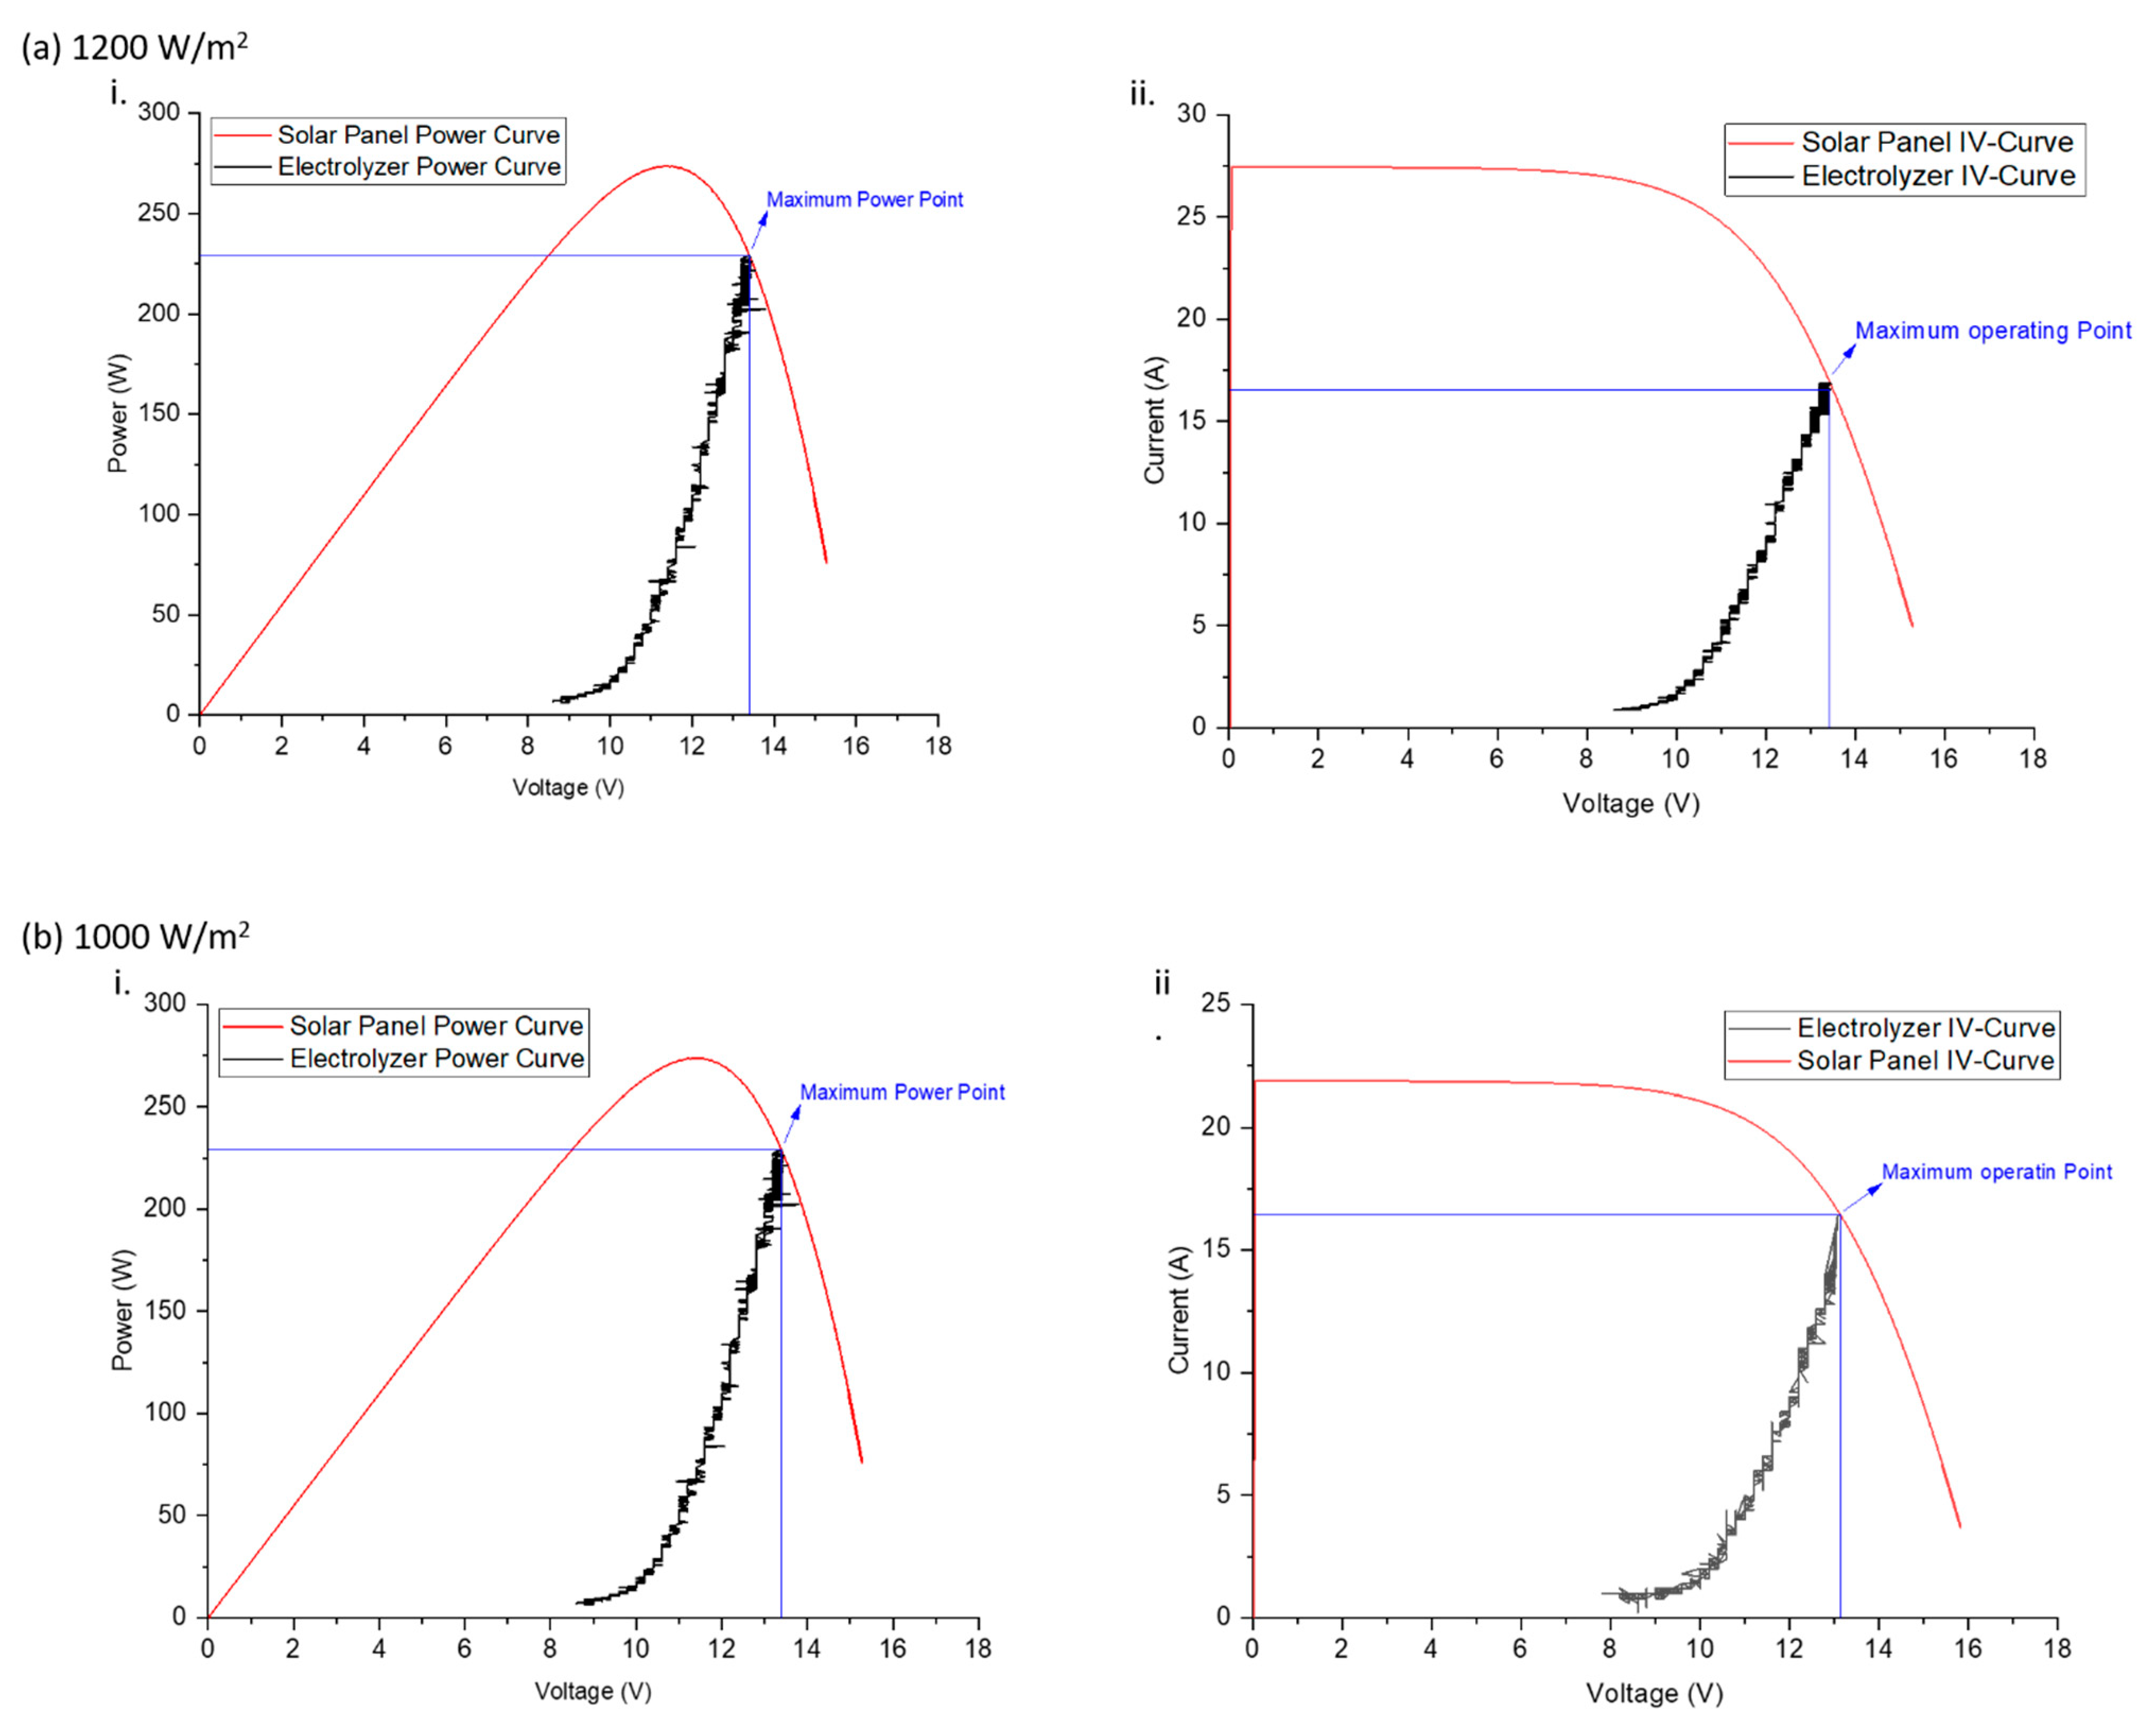
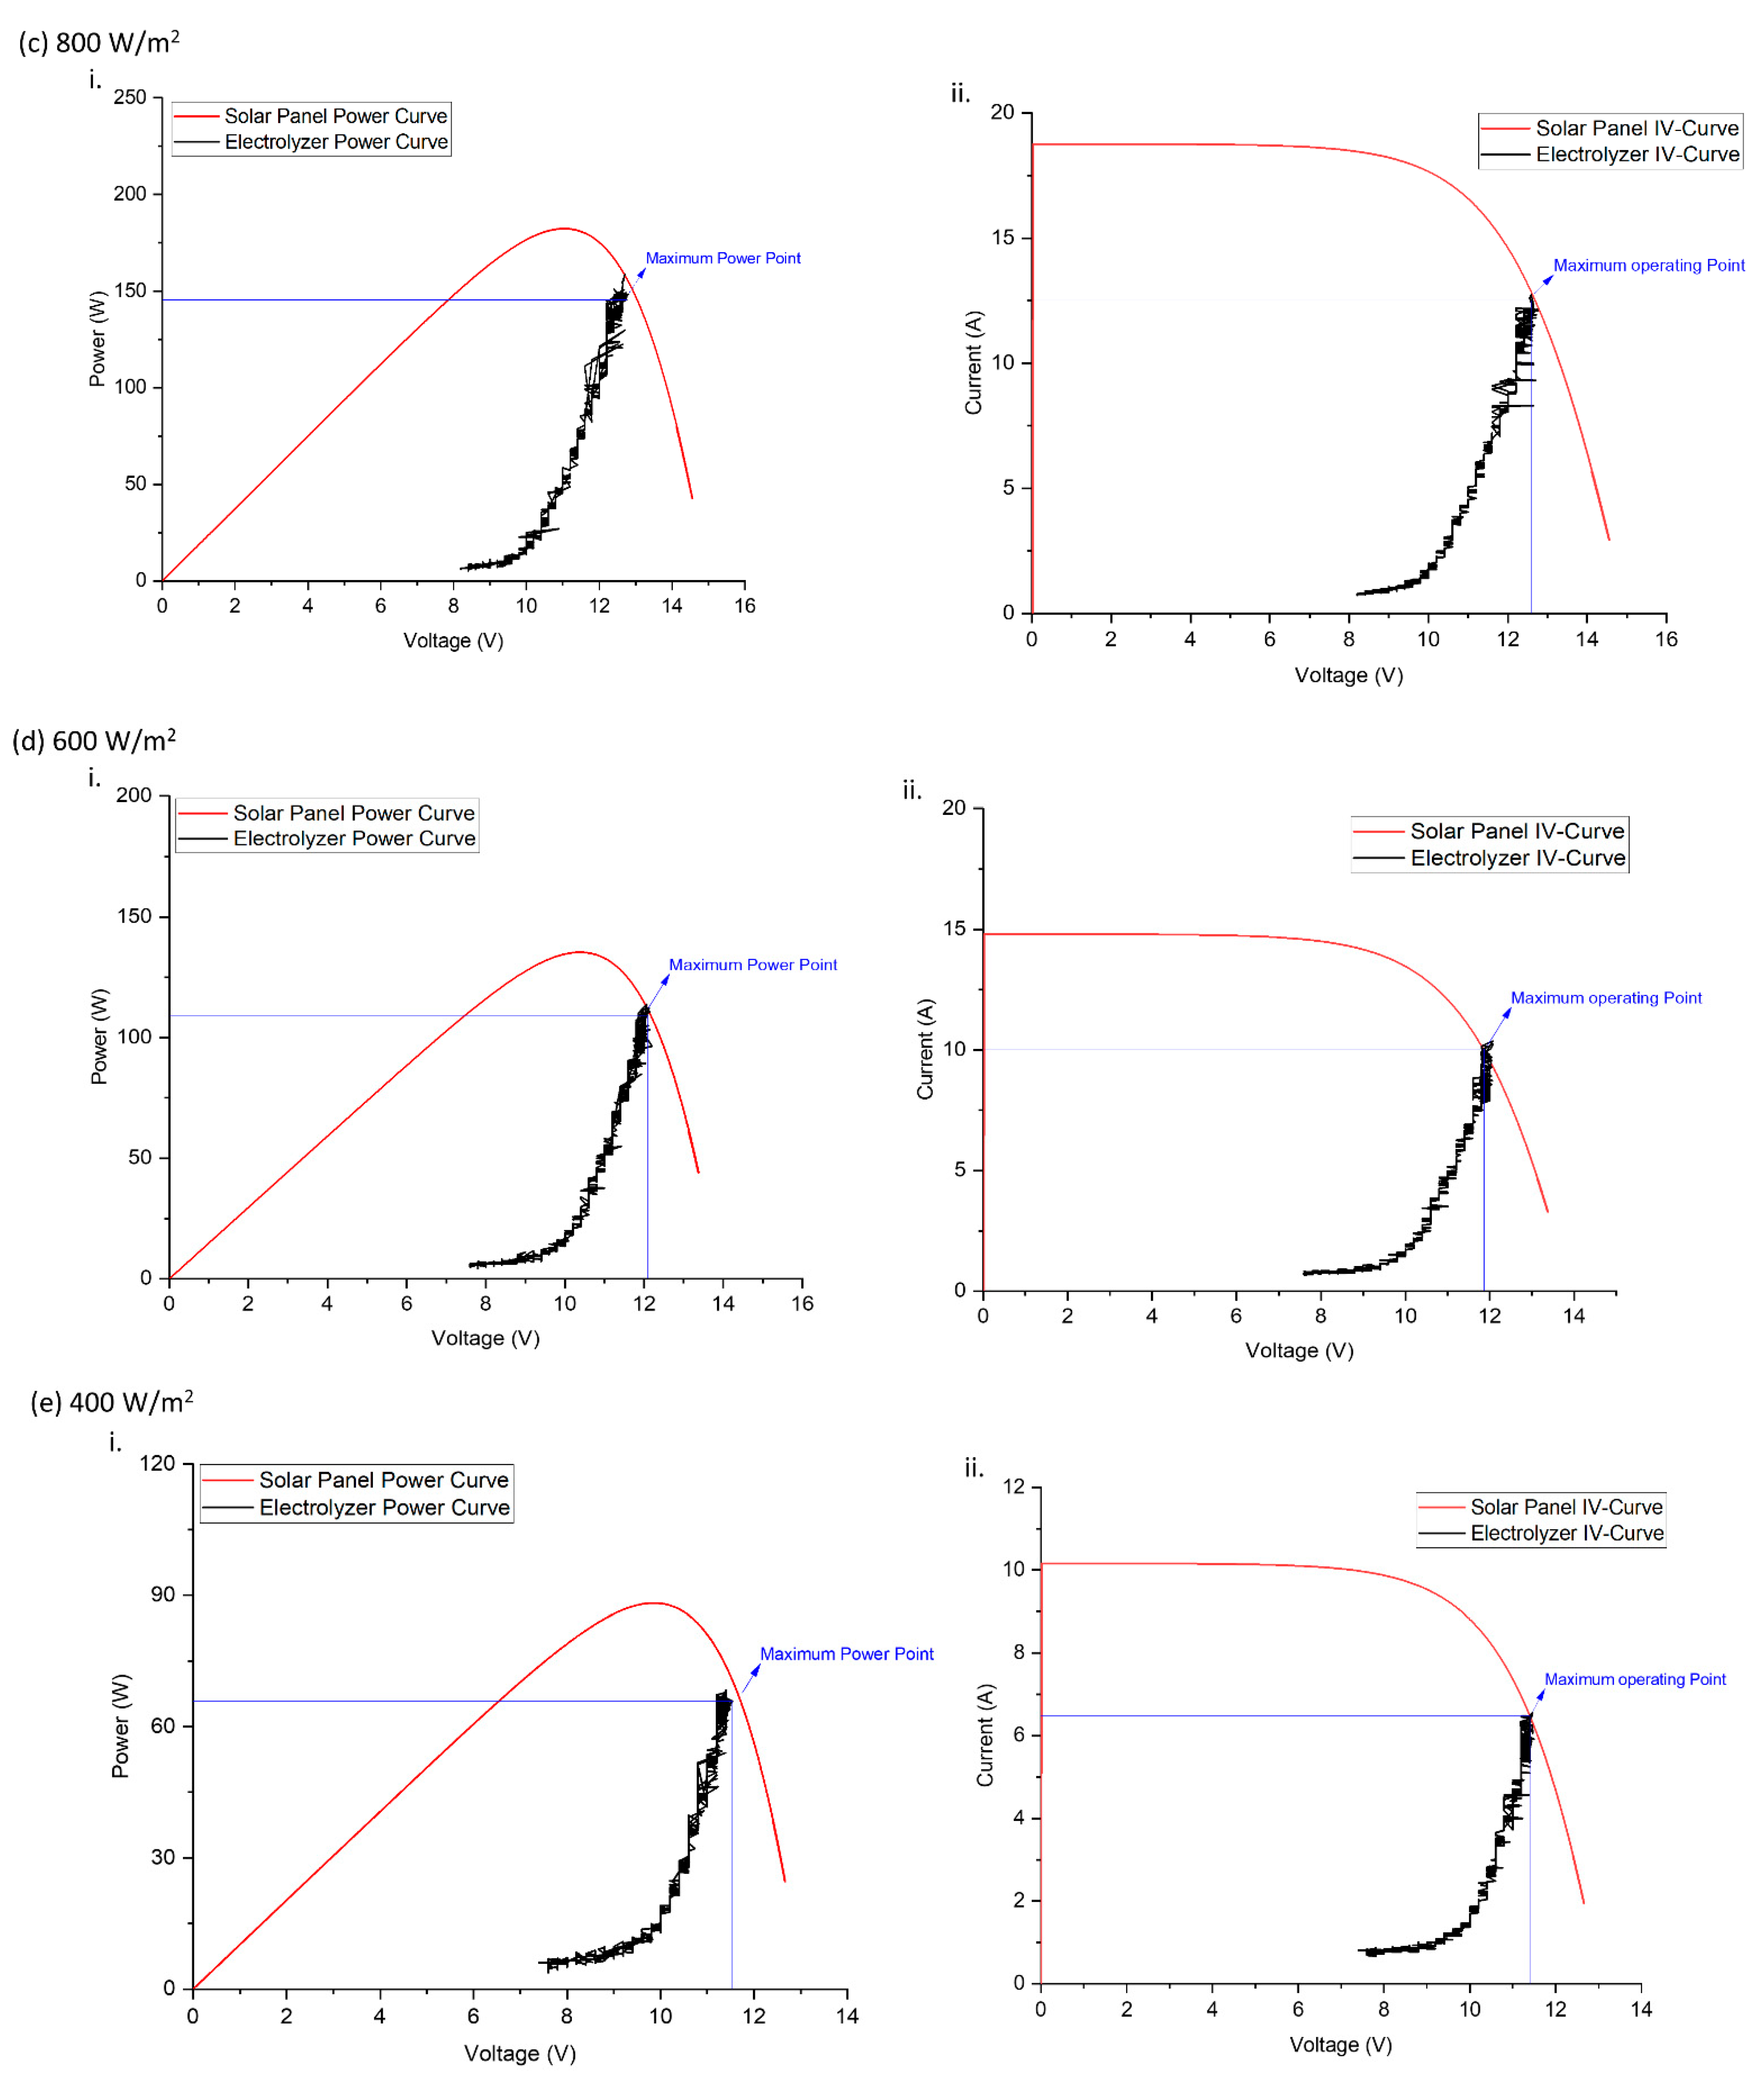
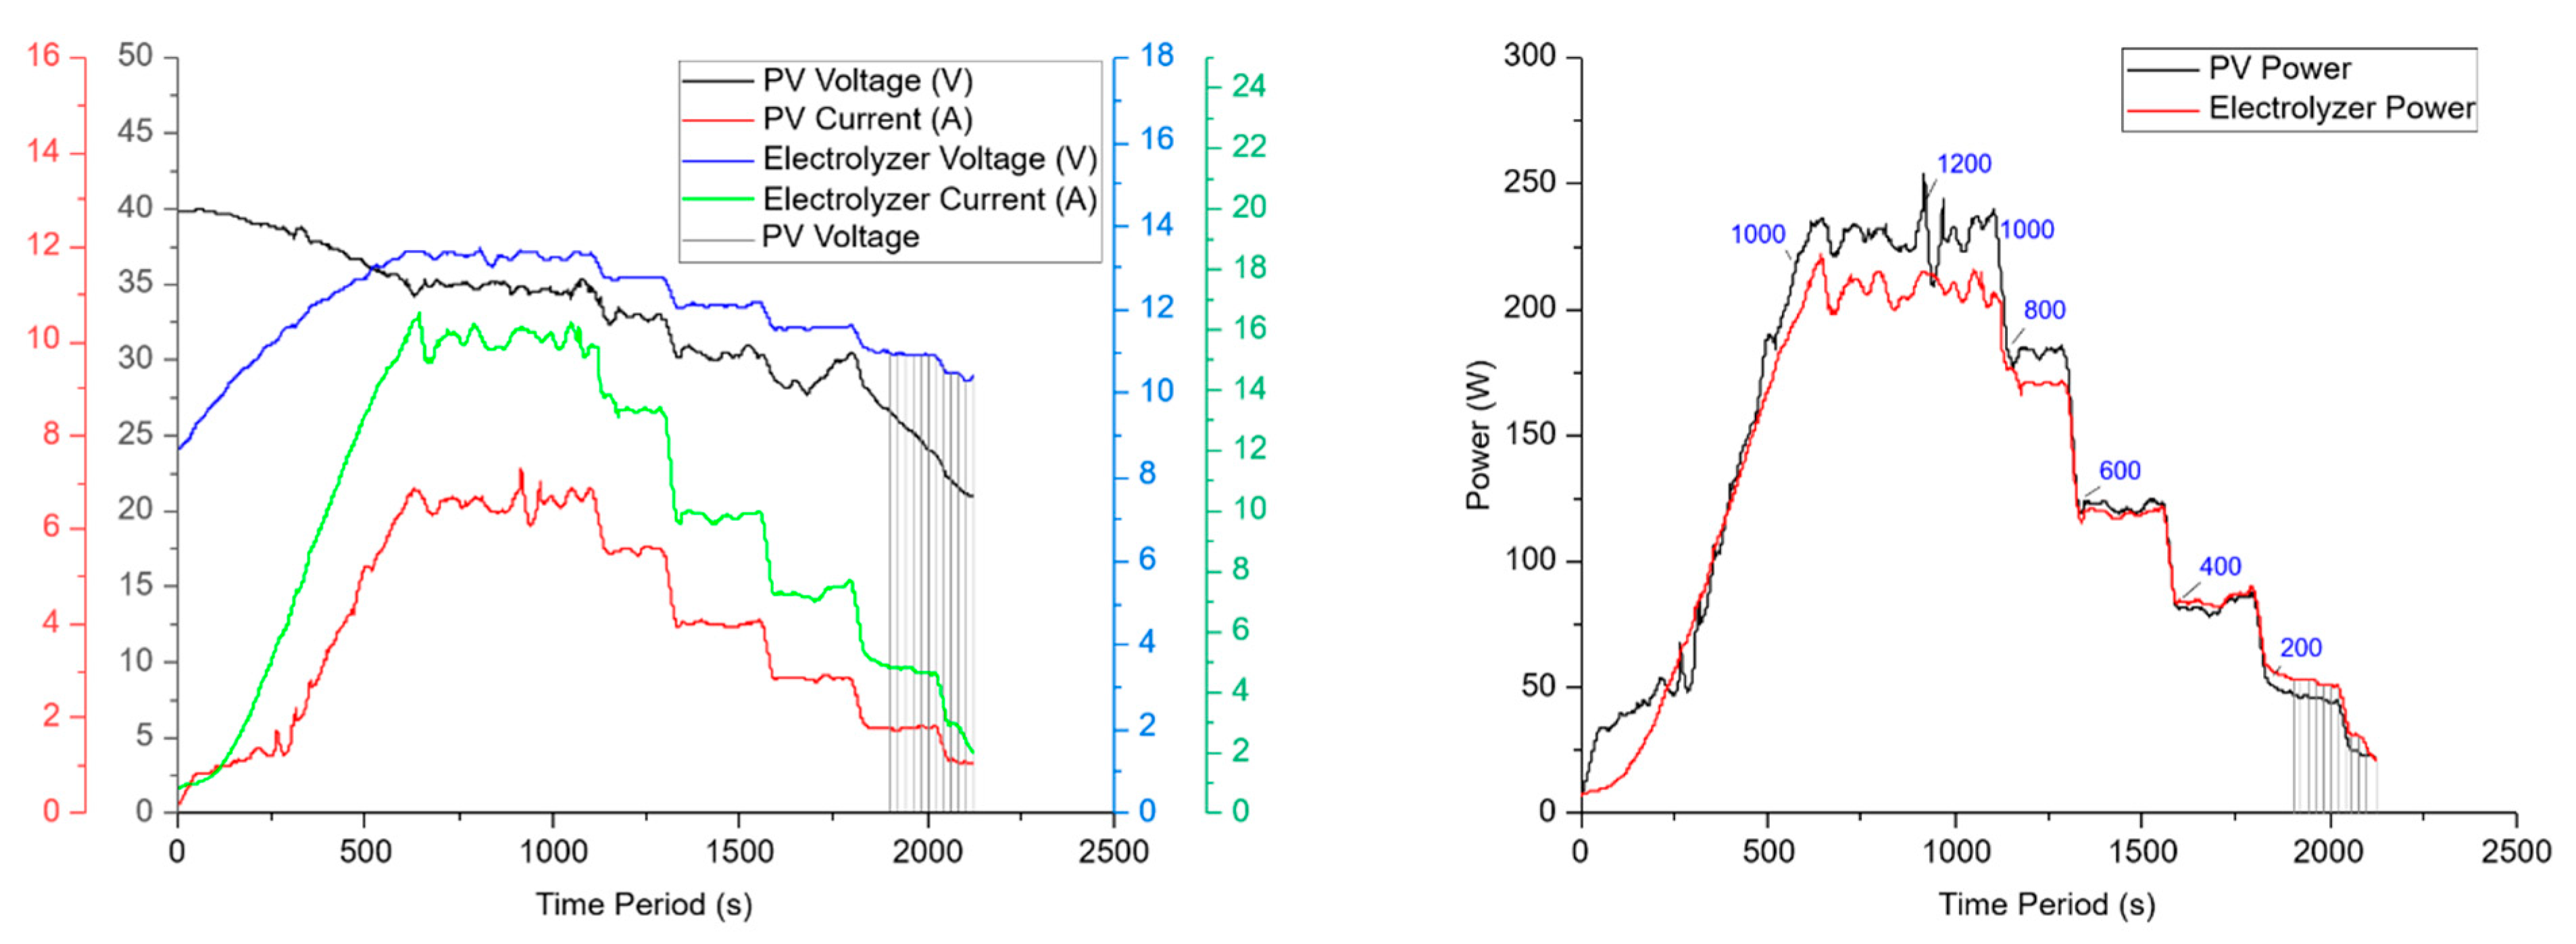
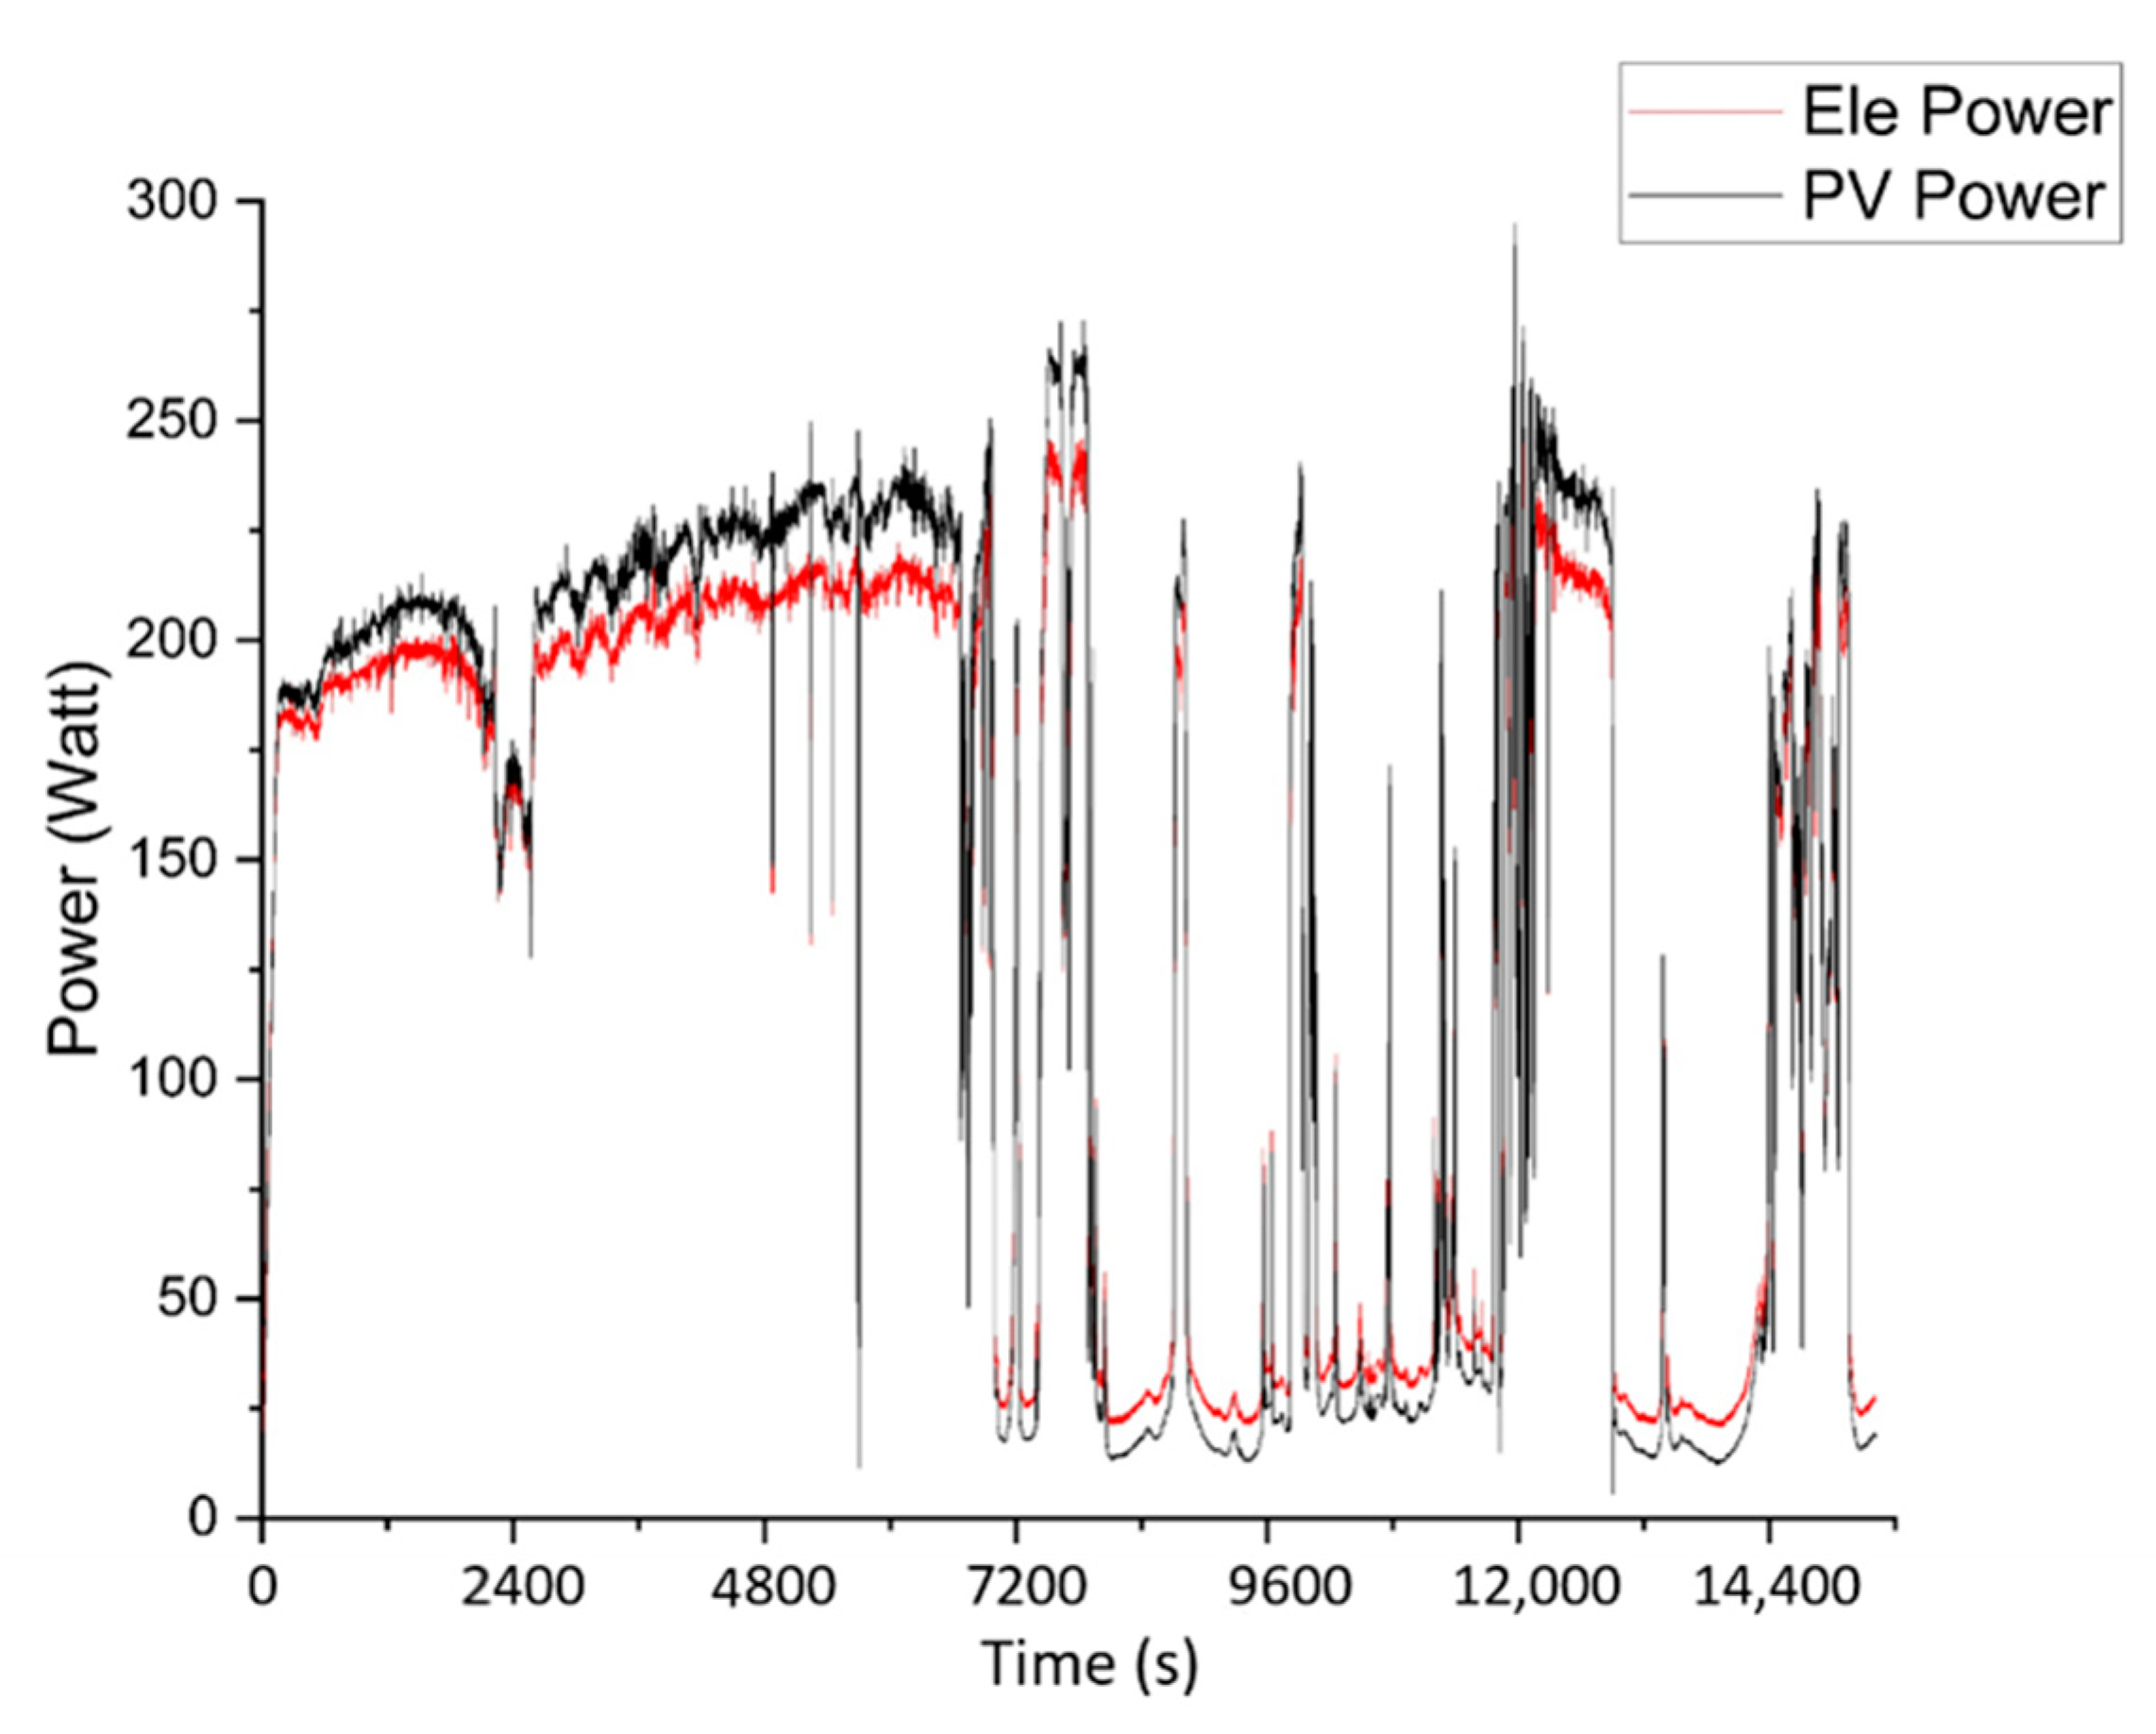
3. Results
4. Conclusions
Author Contributions
Funding
Data Availability Statement
Acknowledgments
Conflicts of Interest
References
- Manieniyan, V.; Thambidurai, M.; Selvakumar, R. Study on energy crisis and the future of fossil fuels. Proc. SHEE 2009, 10, 2234–3689. [Google Scholar]
- Fayaz, H.; Ahmad, M.S.; Pandey, A.; Abd Rahim, N.; Tyagi, V. A Novel nanodiamond/Zinc nanocomposite as potential counter electrode for flexible dye sensitized solar cell. Sol. Energy 2020, 197, 1–5. [Google Scholar] [CrossRef]
- Höök, M.; Tang, X. Depletion of fossil fuels and anthropogenic climate change—A review. Energy Policy 2013, 52, 797–809. [Google Scholar] [CrossRef] [Green Version]
- Watany, M. Variability in vehicle’exhaust emissions and fuel consumption in urban driving pattern. Am. J. Veh. Des. 2015, 3, 31–38. [Google Scholar]
- Butt, O.M.; Ahmad, M.S.; Che, H.S.; Abd Rahim, N. Design of a small scale fluidized-bed incinerator for MSW with ability to utilize HHO as auxiliary fuel. IOP Conf. Ser. Mater. Sci. Eng. 2021, 1127, 012040. [Google Scholar] [CrossRef]
- Butt, O.M.; Ahmad, M.S.; Che, H.S.; Rahim, N.A. Usage of on-demand oxyhydrogen gas as clean/renewable fuel for combustion applications: A review. Int. J. Green Energy 2021, 18, 1–25. [Google Scholar] [CrossRef]
- Uludamar, E.; Tosun, E.; Tüccar, G.; Yıldızhan, Ş.; Çalık, A.; Yıldırım, S.; Serin, H.; Özcanlı, M. Evaluation of vibration characteristics of a hydroxyl (HHO) gas generator installed diesel engine fuelled with different diesel–biodiesel blends. Int. J. Hydrogen Energy 2017, 42, 23352–23360. [Google Scholar] [CrossRef]
- Ozcanli, M.; Akar, M.A.; Calik, A.; Serin, H. Using HHO (Hydroxy) and hydrogen enriched castor oil biodiesel in compression ignition engine. Int. J. Hydrogen Energy 2017, 42, 23366–23372. [Google Scholar] [CrossRef]
- Park, K.-H.; Kim, J.-Y.; Kim, C.-J.; Lee, E.-J.; Son, K.; Park, S.-H. The effect of hho gas on the performance of industrial diesel engine using biodiesel blended fuel. J. Korean Soc. Mar. Eng. 2011, 35, 1022–1027. [Google Scholar] [CrossRef]
- Thangaraj, S.; Govindan, N. Evaluating combustion, performance and emission characteristics of diesel engine using karanja oil methyl ester biodiesel blends enriched with HHO gas. Int. J. Hydrogen Energy 2018, 43, 6443–6455. [Google Scholar] [CrossRef]
- Krishna, V.M. Emissions control and performance evaluation of spark ignition engine with oxy-hydrogen blending. Int. J. Heat Technol. 2018, 36, 118–124. [Google Scholar] [CrossRef]
- Sharma, D.; Pathak, D.K.; Chhikara, K. Performance analysis of a four stroke multi-cylinder spark ignition engine powered by a hydroxy gas booster. J. Aeronaut. Automot. Eng. 2015, 2, 11–15. [Google Scholar]
- Bhardwaj, S.; Verma, A.S.; Sharma, S.K. Effect of Brown gas on the performance of a four stroke gasoline engine. Int. J. Emerg. Technol. Adv. Eng. 2014, 4, 300–307. [Google Scholar]
- Klein, D.J. Thermal Spray Coating Processes Using HHO Gas Generated from an Electrolyzer Generator. U.S. Patent US20080038478A1, 7 May 2008. [Google Scholar]
- Şahin, M.E.; Okumuş, H.İ.; Aydemir, M.T. Implementation of an electrolysis system with DC/DC synchronous buck converter. Int. J. Hydrogen Energy 2014, 39, 6802–6812. [Google Scholar] [CrossRef]
- Sudarmanta, B.; Darsopuspito, S.; Sungkono, D. Application of dry cell HHO gas generator with pulse width modulation on sinjai spark ignition engine performance. Int. J. Res. Eng. Technol. 2016, 5, 105–112. [Google Scholar]
- El Kady, M.; Farrag, A.E.F.; Gad, M.; El Soly, A.; Hashish, H.A. Parametric study and experimental investigation of hydroxy (HHO) production using dry cell. Fuel 2020, 282, 118825. [Google Scholar] [CrossRef]
- Jegha, A.; Subathra, M.; Kumar, N.M.; Ghosh, A. Optimally Tuned Interleaved Luo Converter for PV Array Fed BLDC Motor Driven Centrifugal Pumps Using Whale Optimization Algorithm—A Resilient Solution for Powering Agricultural Loads. Electronics 2020, 9, 1445. [Google Scholar] [CrossRef]
- Ba, A.; Aroudam, E.; Chighali, O.E.; Hamdoun, O.; Mohamed, M.L. Performance optimization of the PV pumping system. Procedia Manuf. 2018, 22, 788–795. [Google Scholar] [CrossRef]
- Niaz, H.; Lakouraj, M.M.; Liu, J. Techno-economic feasibility evaluation of a standalone solar-powered alkaline water electrolyzer considering the influence of battery energy storage system: A Korean case study. Korean J. Chem. Eng. 2021, 38, 1–14. [Google Scholar] [CrossRef]
- Arat, H.T.; Baltacioglu, M.K.; Özcanli, M.; Aydin, K. Effect of using Hydroxy–CNG fuel mixtures in a non-modified diesel engine by substitution of diesel fuel. Int. J. Hydrogen Energy 2016, 41, 8354–8363. [Google Scholar] [CrossRef]
- Baltacioglu, M.K.; Arat, H.T.; Özcanli, M.; Aydin, K. Experimental comparison of pure hydrogen and HHO (hydroxy) enriched biodiesel (B10) fuel in a commercial diesel engine. Int. J. Hydrogen Energy 2016, 41, 8347–8353. [Google Scholar] [CrossRef]
- Kumar, S.S.; Kumar, K.S. Optimization and Control of Fuel by Producing Brown Gas by HHO Generating Device Controlled by VHDL and Implementing In FPGA. Int. J. Mech. Eng. Robot. Res. 2015, 4, 154. [Google Scholar]
- Kumar, K.P.; Arora, N.S.; Mahesh, M. Development of constant current power system for hho cell operations to reduce fuel consumption. In Proceedings of the 2016 IEEE International Power Electronics and Motion Control Conference (PEMC), Varna, Bulgaria, 25–28 September 2016; pp. 273–279. [Google Scholar]
- Worawat, S.-N.; AURASOPON, A. Application of microcontroller for controlling HHO dry cell in small trucks. Mahasarakham Int. J. Eng. Technol. 2015, 1, 10–13. [Google Scholar]
- Butt, O.M.; Aslam, A.N.; Muazzam, H. DESIGN OF AN AC VOLTAGE STABILIZER BY USING INSULATED GATE BIPOLAR TRANSISTORS. J. Fac. Eng. Technol. 2015, 22, 45–50. [Google Scholar]
- Butt, O.; Ahmed, M. Alternating Current Voltage Stabilizer by Using Pulse Width Modulation. Int. J. Sci. Eng. Res. 2014, 5, 928–931. Available online: https://www.ijser.org/paper/Alternating-Current-Voltage-Stabilizer-by-Using-Pulse-Width-Modulation.html (accessed on 31 September 2021).
- Sriramagiri, G.M.; Luc, W.; Jiao, F.; Ayers, K.; Dobson, K.D.; Hegedus, S.S. Computation and assessment of solar electrolyzer field performance: Comparing coupling strategies. Sustain. Energy Fuels 2019, 3, 422–430. [Google Scholar] [CrossRef]
- Tabanjat, A.; Becherif, M.; Emziane, M.; Hissel, D.; Ramadan, H.; Mahmah, B. Fuzzy logic-based water heating control methodology for the efficiency enhancement of hybrid PV–PEM electrolyser systems. Int. J. Hydrogen Energy 2015, 40, 2149–2161. [Google Scholar] [CrossRef]
- Özgirgin, E.; Devrim, Y.; Albostan, A. Modeling and simulation of a hybrid photovoltaic (PV) module-electrolyzer-PEM fuel cell system for micro-cogeneration applications. Int. J. Hydrogen Energy 2015, 40, 15336–15342. [Google Scholar] [CrossRef]
- Becherif, M.; Ramadan, H.; Cabaret, K.; Picard, F.; Simoncini, N.; Béthoux, O. Hydrogen energy storage: New techno-economic emergence solution analysis. Energy Procedia 2015, 74, 371–380. [Google Scholar] [CrossRef]
- Blinov, A.; Andrijanovits, A. New DC/DC converter for electrolyser interfacing with stand-alone renewable energy system. Electr. Control Commun. Eng. 2012, 1, 24–29. [Google Scholar] [CrossRef]
- Guilbert, D.; Collura, S.M.; Scipioni, A. DC/DC converter topologies for electrolyzers: State-of-the-art and remaining key issues. Int. J. Hydrogen Energy 2017, 42, 23966–23985. [Google Scholar] [CrossRef]
- Guilbert, D.; N’Diaye, A.; Luberda, P.; Djerdir, A. Fuel cell lifespan optimization by developing a power switch fault-tolerant control in a floating interleaved boost converter. Fuel Cells 2017, 17, 196–209. [Google Scholar] [CrossRef]
- Garland, N.L. US Department of Energy Fuel Cell Technologies Program. In Proceedings of the 18th World Hydrogen Energy Conference 2010–WHEC 2010 Proceedings Speeches and Plenary Talks, Essen, Germany, 16–20 May 2010. [Google Scholar]
- Kolli, A.; Gaillard, A.; De Bernardinis, A.; Bethoux, O.; Hissel, D.; Khatir, Z. A review on DC/DC converter architectures for power fuel cell applications. Energy Convers. Manag. 2015, 105, 716–730. [Google Scholar] [CrossRef]
- Subramani, V.; Basile, A.; Veziroglu, T.N. Compendium of Hydrogen Energy: Hydrogen Production and Purification; Woodhead Publishing: Sawston, UK, 2015. [Google Scholar]

| Parameter | Value |
|---|---|
| Maximum Power | 300 W |
| Voltage at Pmax | 33 V |
| Current at Pmax | 9.1 A |
| Short-circuit current Isc | 9.8 A |
| Open-circuit voltage Voc | 38.7 V |
| Parameter | Value |
|---|---|
| Voltage | 10.8–13.2 Volts |
| Current | 15 Amps |
| Optimum temperature | 60 °C |
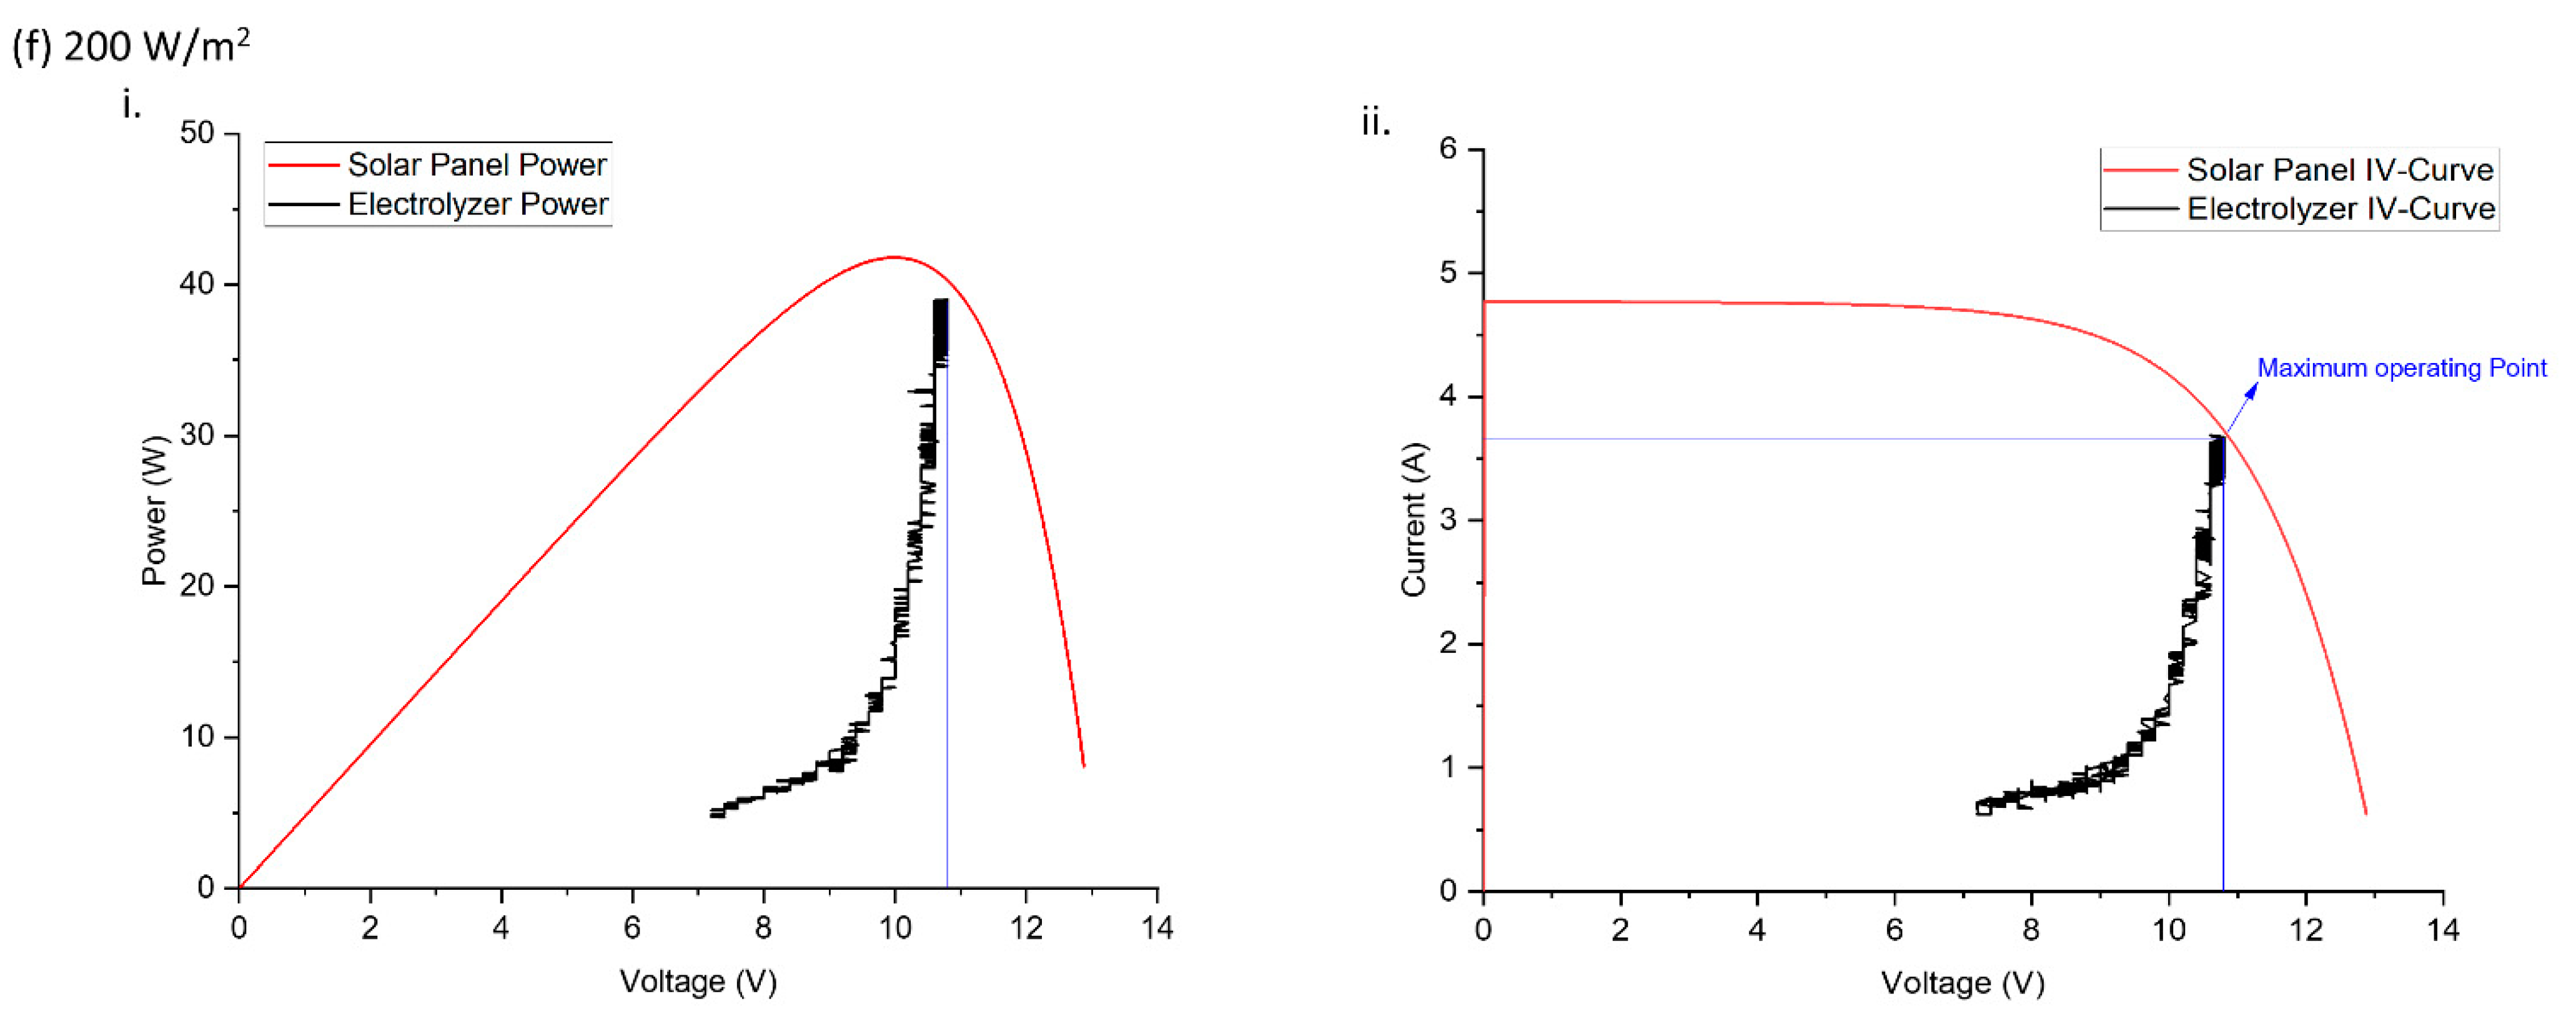
| Irradiance (W/m2) | PV Power (W) | Electrolyzer Power (W) | Efficiency of Convertor (ƞc) | HHO Production (LPM) | STH Efficiency (ƞSTH) |
|---|---|---|---|---|---|
| 1200 | 235.5 | 222 | 94.4% | 0.885 | 12.60% |
| 1000 | 195.5 | 185.6 | 94.9% | 0.800 | 11.47% |
| 800 | 146.1 | 140.6 | 96.2% | 0.620 | 10.88% |
| 600 | 105.7 | 101.2 | 95.7% | 0.440 | 10.59% |
| 400 | 67.57 | 64.23 | 95.0% | 0.300 | 10.10% |
| 200 | 32.88 | 29.37 | 89.3% | 0.000 | 00.00% |
Publisher’s Note: MDPI stays neutral with regard to jurisdictional claims in published maps and institutional affiliations. |
© 2021 by the authors. Licensee MDPI, Basel, Switzerland. This article is an open access article distributed under the terms and conditions of the Creative Commons Attribution (CC BY) license (https://creativecommons.org/licenses/by/4.0/).
Share and Cite
Butt, O.M.; Saeed, T.; Elahi, H.; Masud, U.; Ghafoor, U.; Che, H.S.; Rahim, N.A.; Ahmad, M.S. A Predictive Approach to Optimize a HHO Generator Coupled with Solar PV as a Standalone System. Sustainability 2021, 13, 12110. https://doi.org/10.3390/su132112110
Butt OM, Saeed T, Elahi H, Masud U, Ghafoor U, Che HS, Rahim NA, Ahmad MS. A Predictive Approach to Optimize a HHO Generator Coupled with Solar PV as a Standalone System. Sustainability. 2021; 13(21):12110. https://doi.org/10.3390/su132112110
Chicago/Turabian StyleButt, Osama Majeed, Tareq Saeed, Hassan Elahi, Usman Masud, Usman Ghafoor, Hang Seng Che, Nasrudin Abd Rahim, and Muhammad Shakeel Ahmad. 2021. "A Predictive Approach to Optimize a HHO Generator Coupled with Solar PV as a Standalone System" Sustainability 13, no. 21: 12110. https://doi.org/10.3390/su132112110