Article

Electric Vehicle and Renewable Energy Sources: Motor Fusion in the Energy Transition from a Multi-Indicator Perspective

by
Isabel C. Gil-García
1,†,
Mª Socorro García-Cascales
2,†,
Habib Dagher
3,† and
Angel Molina-García
4,*,†
1
Faculty of Engineering, Distance University of Madrid (UDIMA), c/ Coruña, km 38.500 28400, Collado Villalba, 28029 Madrid, Spain
2
Department of Electronics, Technology of Computers and Projects, Universidad Politécnica de Cartagena, 30202 Cartagena, Spain
3
Advanced Structures and Composites Center, University of Maine, Flagstaff Rd, Orono, ME 04469, USA
4
Department of Automatics, Electrical Engineering and Electronic Technology, Universidad Politécnica de Cartagena, 30202 Cartagena, Spain
*
Author to whom correspondence should be addressed.
These authors contributed equally to this work.
Sustainability 2021, 13(6), 3430; https://doi.org/10.3390/su13063430
Submission received: 10 February 2021 / Revised: 14 March 2021 / Accepted: 17 March 2021 / Published: 19 March 2021

Abstract

:
Energy transition requires actions from different sectors and levels, mainly focused on achieving a low-carbon and high-renewable integration society. Among the different sectors, the transport sector is responsible for more than 20% of global greenhouse gas emissions, mostly emitted in cities. Therefore, initiatives and analysis focused on electric vehicles integration powered by renewables is currently a desirable solution to mitigate climate change and promote energy transition. Under this framework, this paper proposes a multi-indicator analysis for the estimation of CO 2 emissions combining renewable integration targets, reduction emission targets and realistic renewable resource potentials. Four scenarios are identified and analyzed: (i) current situation with conventional vehicles, (ii) replacement of such conventional by electric vehicles without renewable integration, (iii) and (iv) integration of renewables to fulfill emission reduction targets for 2030 and 2050 respectively. The analysis is evaluated in the state of Maine (United States). From the results, a minimum renewable penetration of 39% and 82%, respectively, is needed to fulfill the emission reduction targets for 2030 and 2050 by considering 100% conventional vehicle replacement. Different combinations of available renewable resources can reduce emissions by more than 35%.

1. Introduction

Renewable Energy Sources (RES) and energy efficiency strategies are the core elements of the energy transition [1]. A systemic transition towards more efficient energy scenarios implies a strategically designed actions involving all policy levels—from local to global [2]. A variety of challenges are thus identified, mainly due to the relevant population increase, limitation of fossil fuel reserves, lack of energy security, and both economic and urbanization growth [3]. As an effort to reduce the impact of global warming, the world leaders have pledged the commitments to drastically reduce greenhouse emissions [4]. Nevertheless, the increase in the population worldwide evolves exponentially and migration to urban areas increased by 53% from 1998 to 2018 [5]. According to the United Nations [6], the world population will reach 9700 million in 2050, of which 68% will live in urban areas. Subsequently, world energy consumption will rise nearly 50% between 2018 and 2050 [7].
Cities have become critical icons to facilitate climate action, energy transition, and sustainability [8,9]. The significant concentration of population and the corresponding economic activity increasing commonly address major demand and dependence on transport services and supplies [10]. Two negative factors for energy transition can be then clearly identified from the transport sector: higher use of fossil fuels and increased pollution. Actually, the transport sector is responsible for more than 20% of global greenhouse gas emission [11]. This sector accounts for 26% of the total US greenhouse emissions and 23.20% of EU-28. The shares of pollutants range from 13.14% to 57.41%, and the transport sector is the main emitter for NO x [12]. Therefore, it is one of the major challenges in reducing global greenhouse gas emissions [13]. Different solutions and proposals can be found in the specific literature to make or advise on decisions in the transport sector [14,15]. Moreover, in recent proposals, the transport sector has been a part of models of 100% renewable energy systems, such as the European Union [16] and the region of South East Europe [17]. However, only 3.3% of the energy consumption of the transport sector currently has a renewable origin (3% from Biofuels and 0.3% from renewable electricity). Moreover, this sector accounts for the lowest percentage of participation in renewables [18]. Therefore, in this context, an important way of mitigating climate change is the replacement of the current transport fleet with Electric Vehicles (EV) [19]. The electrification of this sector will address a greater demand for energy integrated with renewables. According to Reference [20], common research topics within the transport area include electric vehicles and the sustainable road transportation.
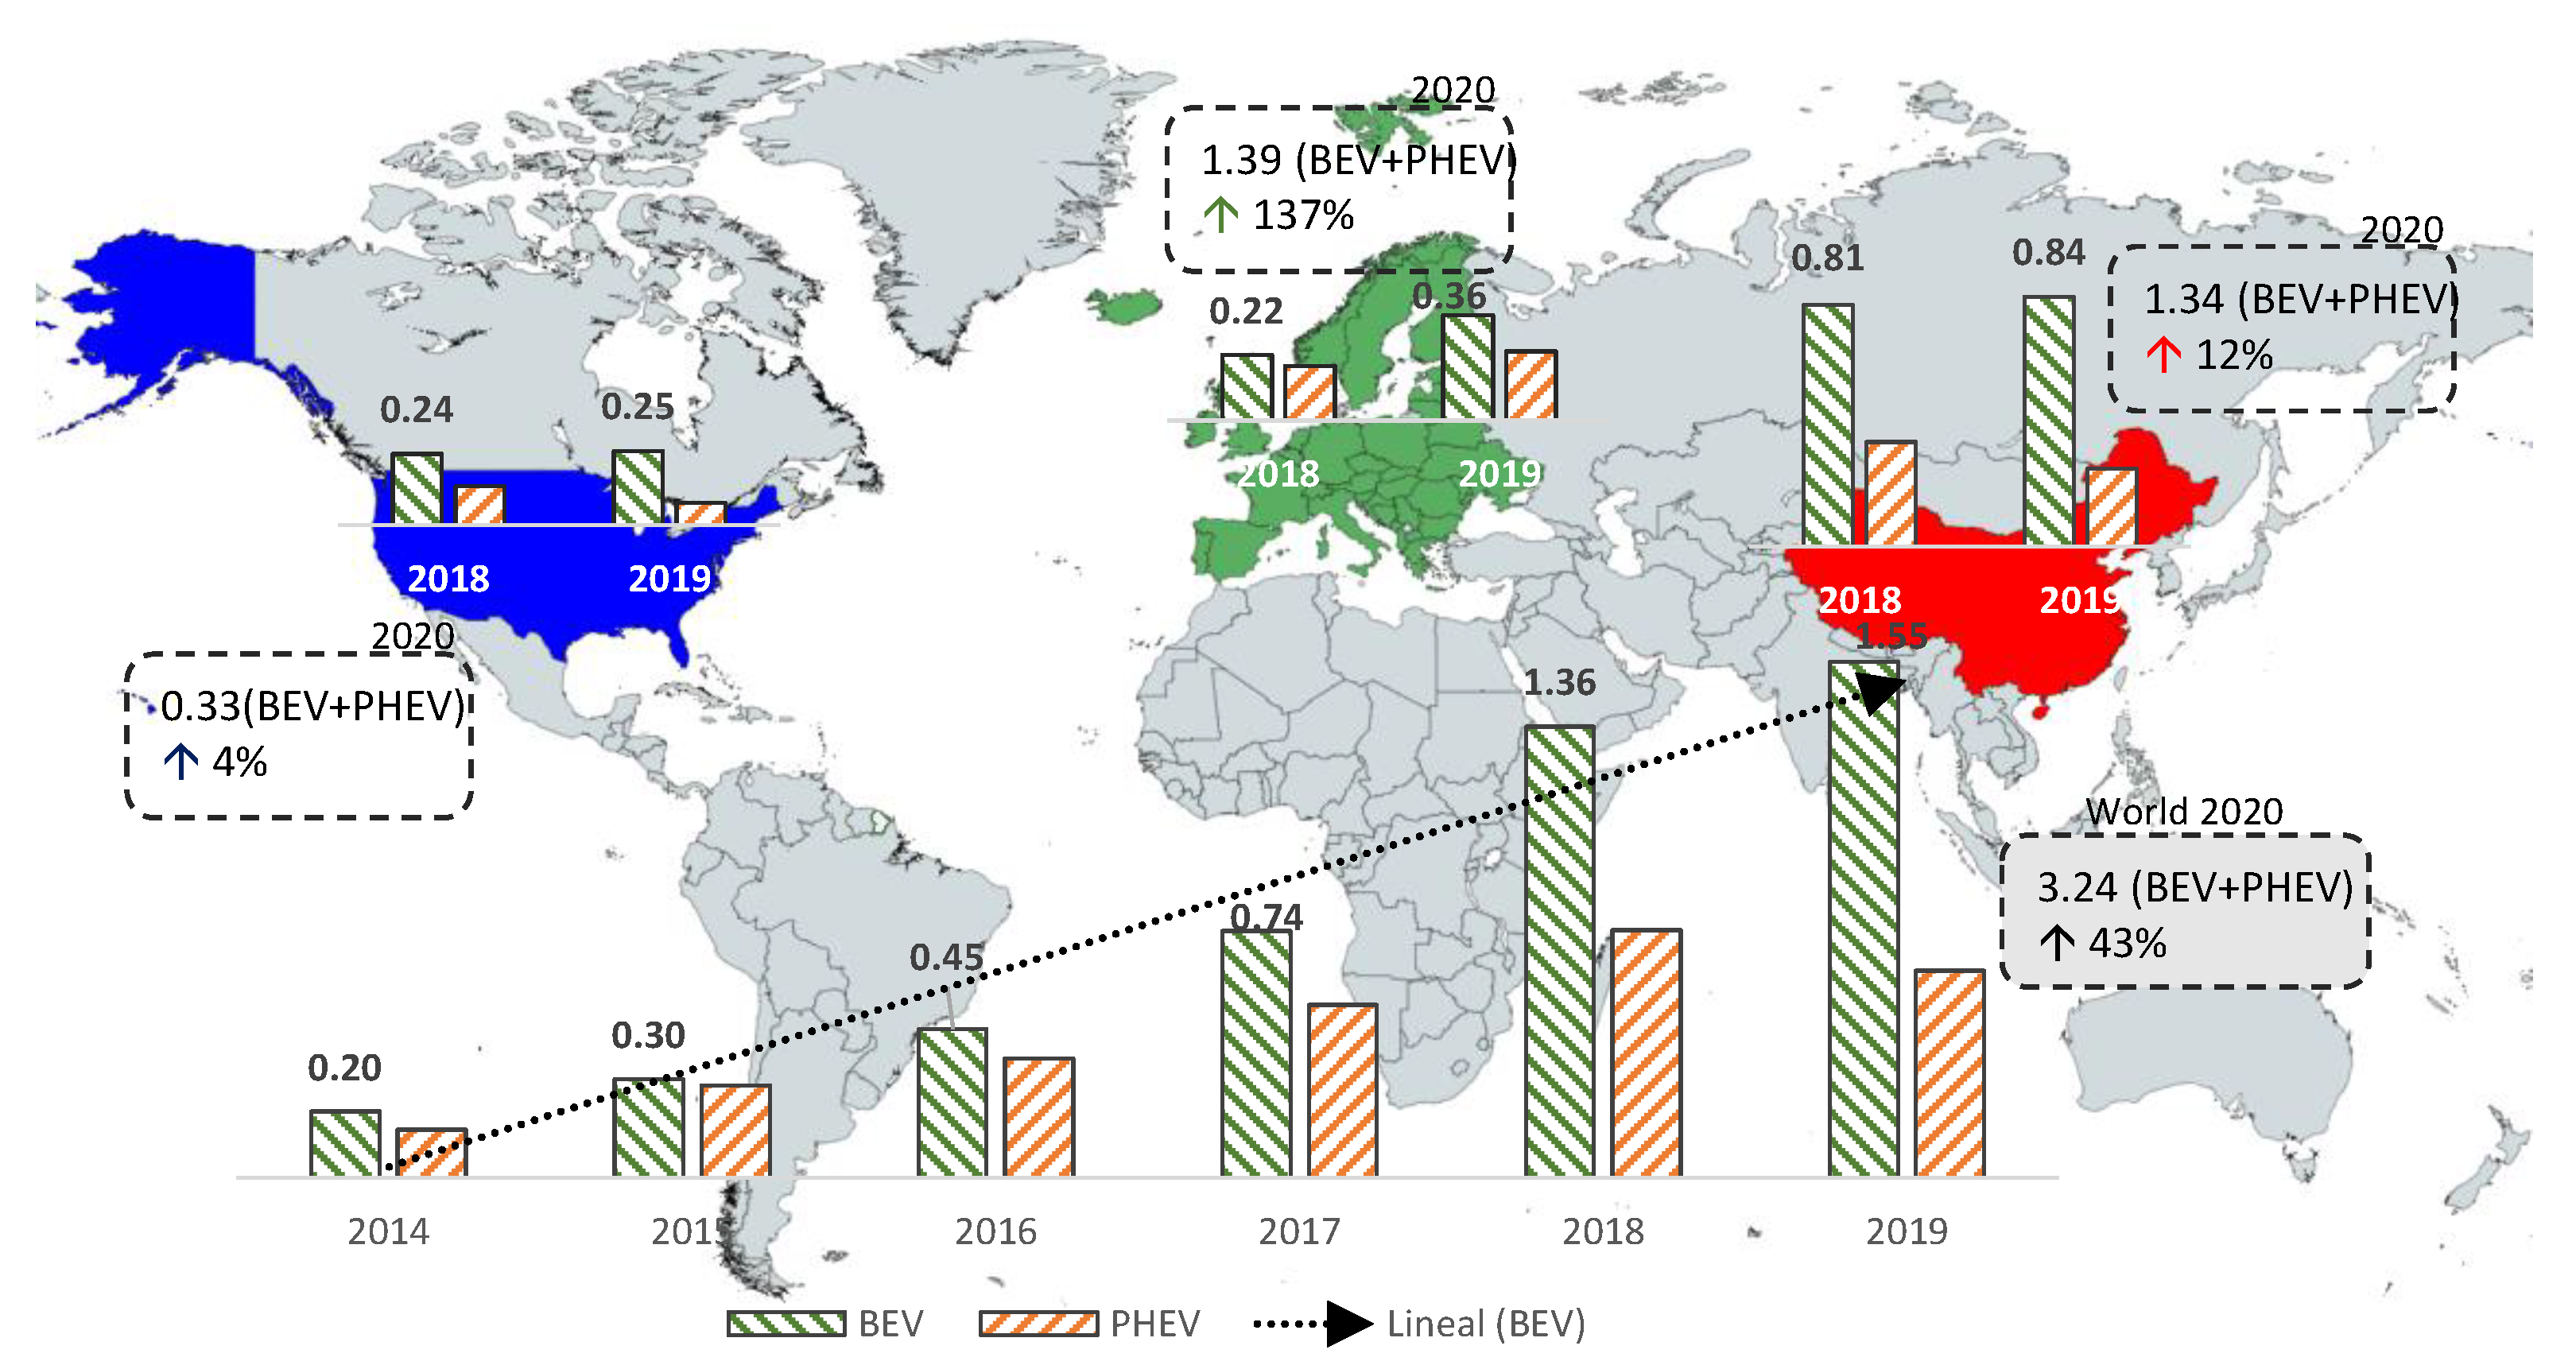
From 2014 to 2019, the sales of Plug-in Hybrid Electric Vehicle (PHEV) vehicles were increased 334%; and Battery-Electric Vehicles (BEV) sales 682%. In 2019, approximately 2.17 million EVs were sold globally, 832,101 EV more than 2018. In 2019, the European EV registrations were close to 550,000 units, in comparison to 300,000 units in 2018, accounting for an increase from to 3.5% of total car registrations [21]. Today, the global fleet of EVs accounts to 7.2 million of cars. China leads the EV sales market: 1.11 millon EV in 2019—0.84 BEV and 0.26 PHEV, almost duplicate the sales of 2017 with more than 50% of world sales, a decrease of 5% compared to 2018. The United States is the second country in terms of sales, 0.33 millon EV in 2019—0.25 BEV and 0.08 PHEV, with a growth of 52% in comparison to 2017, a decrease of 11% compared to 2018. Preliminary sales data in 2020 are surprising, despite the current health emergency caused by COVID-19, PHEV + BEV sales increased 43% compared to 2019 with 3.24 million units. For the first time, Europe leads the ranking with nearly 1.4 million EVs displacing China. One hundred and thirty-seven percent is the increase in growth in Europe compared to 12% in China, and the United States with a 4% increase remains in third position; see Figure 1.
In terms of EV models, and by considering the top-ten best-selling EVs in the world in 2019, there are eight BEVs accounting for 34.2% of the total, and two PHEV (4.65%). The ranking of the worldwide best-selling models is headed by the ‘Tesla Model 3’ (BEV) with a total world sales of 13.83% in 2019—300,080 units sold. Its technical characteristics give different power options [24], ranging between 192 kW and 334 kW with an autonomy between 355 km and 500 km, and an average consumption around 16.09 KWh/100 km [24]. The ‘BAIC EC-Series’ (BEV) is the second model, with 111,050 units sold representing 5.11% of the total global sales, mainly focused on the Chinese market. In third position, the ‘Nissan Leaf’ model with 69,870 units sold and 3.22% of the total amount. In this case, its main market is focused on Europe. In the preliminary data for 2020, the ‘TESLA Model 3’ remains leading the ranking, its sales triple the Chinese model in second position, a curious aspect is the disappearance of the PHEVs among the top 10, ratifying the upward trend of the BEVs. The top 10 begins to separate from the rest of the world, 70% of total sales are outside the ranking, compared to 61% in 2019. Figure 2 summarizes the EV sale ranking.
With regard to the replacement of conventional vehicles by EV, Reference [26] studied a comprehensive review of the replacement of conventional vehicles by EV and concludes that the battery electric vehicle (BEV) is considered a true zero-emission vehicle due to the lack of tailpipe emissions compared to other types of EV, but the savings in greenhouse gas (GHG) emissions from the EV is debatable when the energy required to charge the EV comes from traditional sources of fossil fuels, it also alludes to the technical, economic, and logistical barriers that stop the expansion. Szinai et al. [27] estimate the integration of EV in the state of California, United States, by 2025. This analysis ensures that the fusion EV and renewables will help to decarbonize both transport and electricity sector simultaneously. Li et al. [28] carried out a study of electric mobility in the Asia Southeast, involving the fleet of residential passengers, buses and trucks. This evaluation includes availability, applicability, acceptability, and affordability indicators, giving a final energy consumption and a major energy security. Raugei et al. [29] affirm that the EV integration can reduce significantly the UK’s dependence on conventional primary energy sources. The analyzed key–metric is the demand for non-renewable energy, that could be reduced around 34% by EV in comparison to conventional vehicles. The mitigation of emissions, studied by Brice et al. [30] in the state of Texas (United States), demonstrates the substantial reduction of greenhouse gases to be achieved by renewable integration into mix generation power systems. Vehicles powered by coal, natural gas, and renewables are compared to EVs, highlighting that EVs reduce significantly emissions and increase energy security.
Considering previous contributions aiming to decarbonize the residential transport sector, this work proposes an analysis of the ICE vehicles replacement by EV in the residential sector establishing the minimum penetration limits of renewables to fulfill the emission reduction objectives. The design and selection of potential EV scenarios is based on both economic and technological barriers of the sector. 
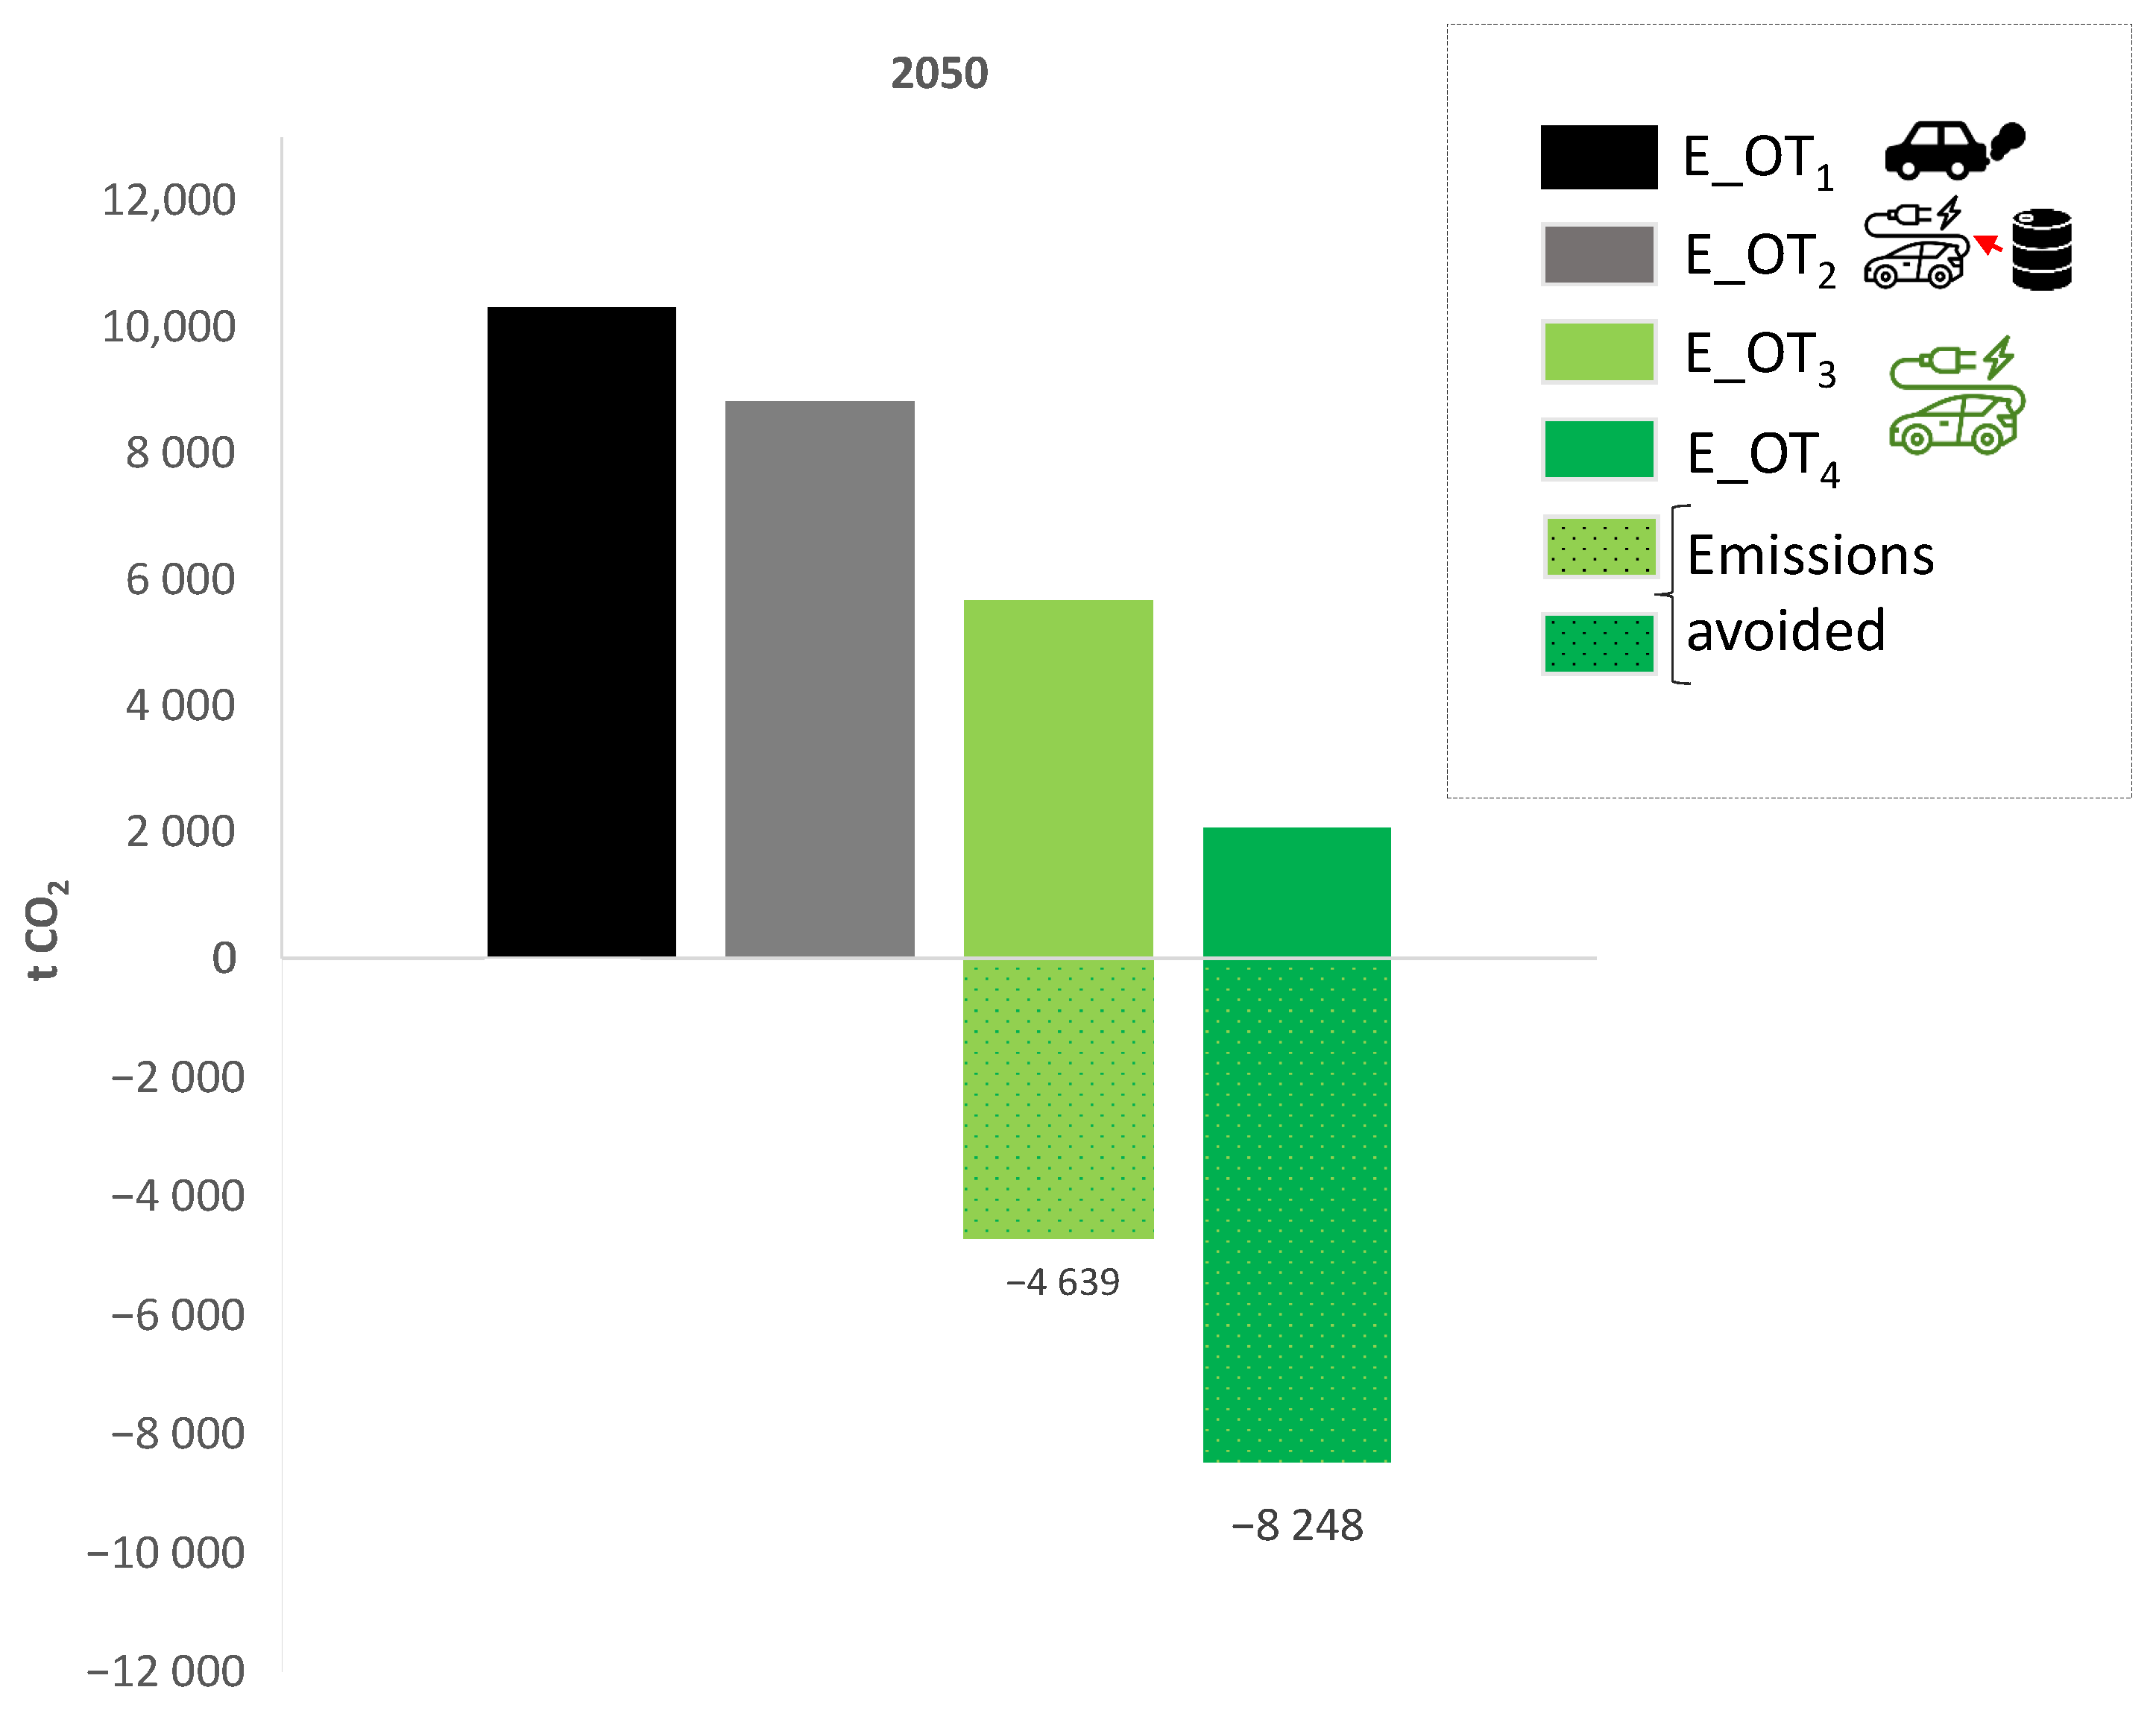
Table 1 summarizes recent contributions related to the electrification of the transport sector and the targets/indicators considered in those works. This table also compares such indicators to the proposed multi-indicator analysis. A case study focused on the state of Maine (United States) is also included in the paper by considering 2030 and 2050 roadmaps. From the results, a maximum of 18% non-renewable power generation will be allowed in 2050 to reach the emission reduction targets by considering 100% conventional vehicle replacement. The main contributions of this study are thus:
  • The definition of a methodology by combining simultaneously three main indicators: (i) the Emission Reduction Objectives (ERT); (ii) the potential renewable energy source in the area (PoRES); and (iii) the Penetration Renewable Energy Goals (PERST).
  • The feasibility and suitability of the proposal to provide evaluation and strategy guidance in real situations is carried out by the authors with the state of Maine (USA) case study.
  • The EV substitution scenarios are merged with the EV efficiency indicators and the renewable/energy policies in a multi-target framework.
The rest of the paper is divided into the following sections: Section 2 exposes the proposed analysis of EV integration from a multi-indicator perspective; Section 3 evaluates the model in the state of Maine (United States); results are discussed in Section 4 in terms of emission reduction, quantitative variability according to the objectives, and contributions from renewable sources; finally, conclusions are given in Section 5.

2. Materials and Methods

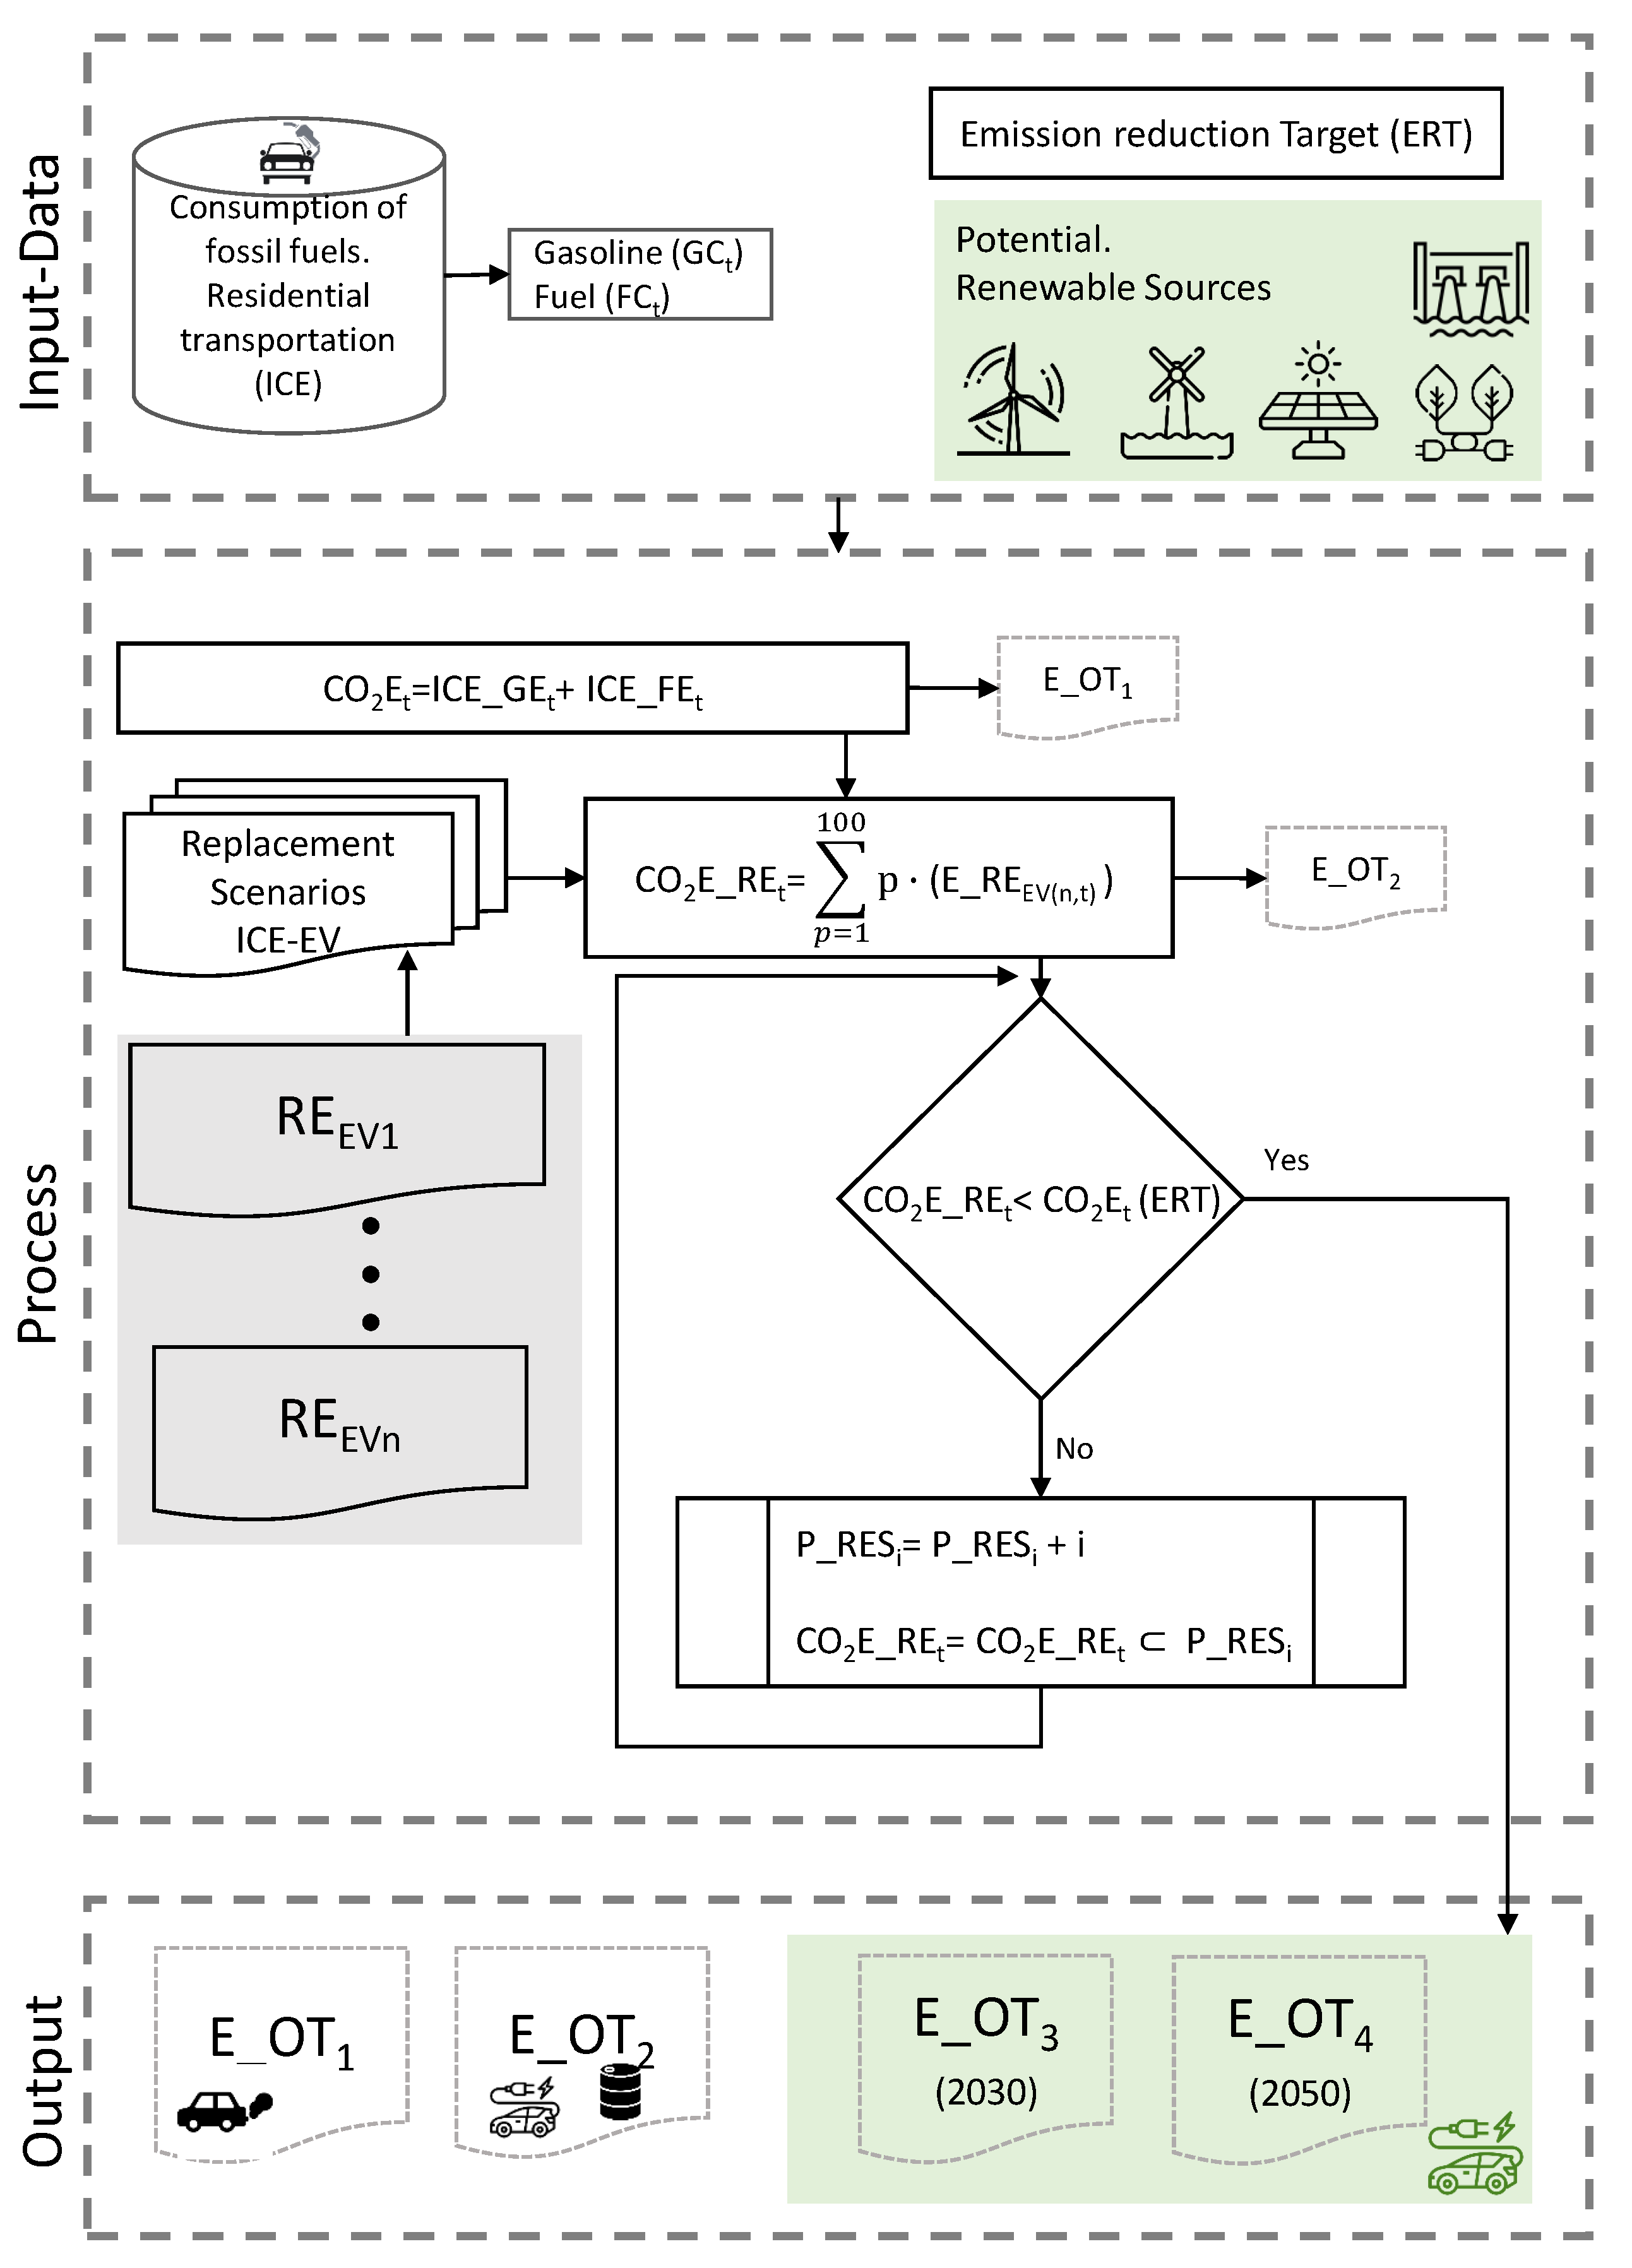
An evaluation based on multi-indicators to analyze the impact of ICE replacement by EV in the energy transition is proposed and assessed, defining different replacement scenarios and renewable integration shares. The methodology is summarized in Figure 3.
The initial stage is focused on gathering all data required as inputs of the analysis: (i) the fossil fuel energy consumption in the residential transport sector, whether of ICE gasoline ( G C t ) or fuel ( F C t ) vehicles for the base year of study ( t ) ; (ii) the Emission Reduction Targets (ERT) of the study area for 2030 and 2050; and (iii) the potential of the different renewable energy sources available in the study area.
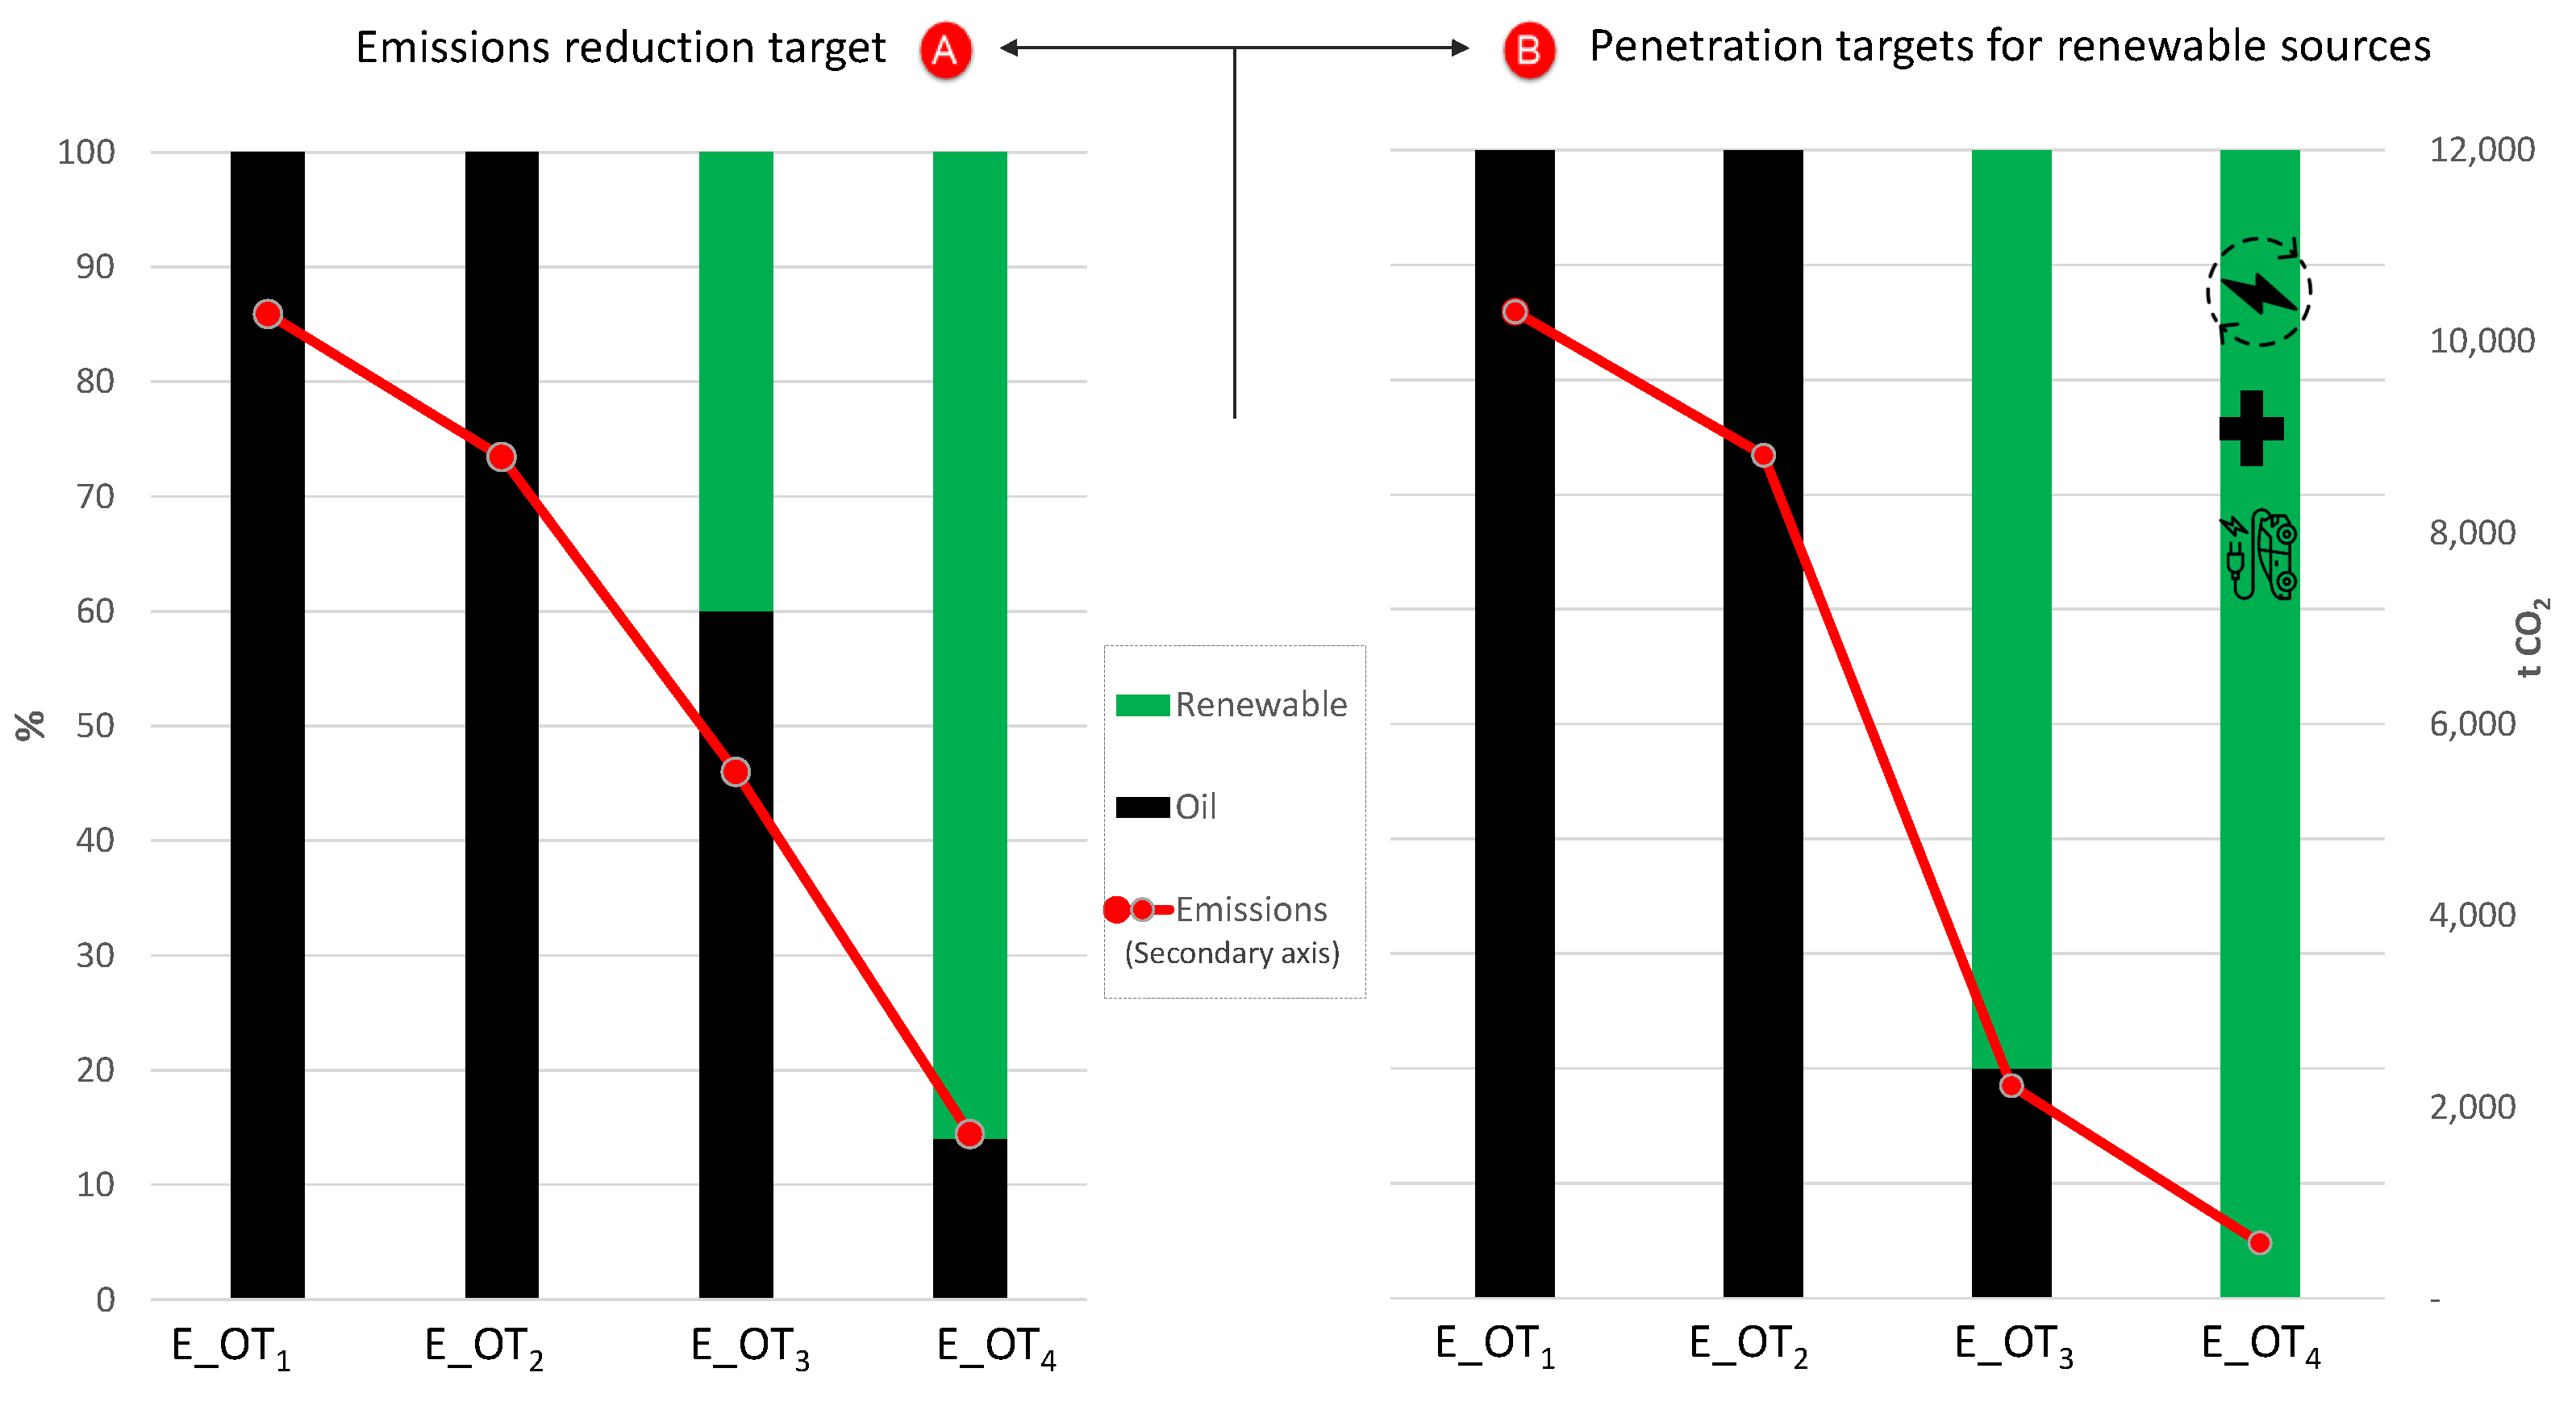
From the initial data, four possible scenarios are defined according to the corresponding emission reductions to be fulfilled in 2030 and 2050. Table 2 describes such scenarios by considering the ICE replacement, as well as the RES integration into generation power system, accordingly. Firstly, the emissions ( C O 2 E t ) in the base year t are estimated. Therefore, the global ICE emissions corresponding to vehicles powered by both gasoline ( I C E _ G E t ) and fuel ( I C E _ F E t ) are:
C O 2 E t = I C E _ G E t + I C E _ F E t .
These emissions include the complete life cycle of the vehicle according to the energy flow in the Well–to–Wheel (WtW) process [47]. This process can be divided into two estimations: (i) the Well-to-Tank (WtT) focused on determining the emissions in the extraction, transportation and processing processes of fuel; and (ii) the Tank-to-Wheel (TtW) aimed to determine the total emissions in the driving process [48]. Subsequently, gasoline or fuel ICE vehicle emissions are determined according to:
I C E _ G E t = G C t · C E G _ W t W ,
I C E _ F E t = F C t · C E F _ W t W ,
and extrapolated to 2050 by following the scenario E_OT 1 .
The E_OT 2 scenario —ICE vehicle substituted by EV without RES integration, see Table 2—, is designed with different EV penetration levels. Each study area can required different EV characteristics, depending on the specific conditions and facilities of such areas, which affect the behaviors and preferences of the users in terms of:
  • Power: What acceleration can the engine deliver? What speed can you keep?
  • Autonomy: How long can the vehicle travel without refueling? The energy density of gasoline and diesel is higher than batteries, providing greater ranges.
  • Fueling time: How much time is needed to recharge? The extended recharge time of the EV is longer than the refueling minutes of conventional vehicles.
  • Efficiency: How far can a vehicle travel to give a unit of fuel energy, measured in kilometers per liter for conventional vehicles?
The emissions are then calculated as follows,
C O 2 E _ R E t = j = 1 n p j · ( E _ R E E V ( n , t ) ) ,
where p is the penetration percentage of the EV replacement scenarios, n is the number of scenarios, and ( E _ R E E V ) are the emissions of each scenario according to
E _ R E E V ( n , t ) = k m t · E l C n · E F o i l ,
where k m t are kilometers traveled for a base year t (km); E l C n is the EV consumption for the n-scenario (kWh/100 km); and E F o i l is the emission factor of the power generation units based on oil (kg CO 2 /kWh). Results from expression (5) are then extrapolated to 2050 for the E_OT 2 scenario estimation.
An iterative process compares the ( C O 2 E _ R E t ) emissions of the E_OT 2 scenario to the emission reduction targets ( C O 2 E t ( E R T ) ) . The renewable integration into the power generation mix ( P _ R E S ) is increased to fulfill such emission targets: C O 2 E _ R E t < C O 2 E t ( E R T ) . The emissions by considering the Renewable Energy Source (RES) participation ( C O 2 E _ R E t P _ R E S i ) is then expressed as,
C O 2 E _ R E t P _ R E S i = L n R · j = 1 n p j · ( E _ R E E V ( n , t ) o i l ) + P _ R E S i · j = 1 n p j · ( E _ R E E V ( n , t ) R E S ) .
The methodology determines the maximum non-renewable power generation allowed to fulfill the emission reduction targets ( L n R ) . The corresponding participation of renewable energy sources ( P _ R E S ) are also considered in both E_OT 3 and E_OT 4 scenarios for 2030 and 2050.
E _ R E E V ( n , t ) = k m t · E l C n · E F R E S ,
where k m t is the distance traveled for base year (km), E l C n is the EV consumption for the n-scenario (kWh/100 km), and E F R E S is the power system emission factor generated with renewable energy source ( k g C O 2 / k W h ).
Finally, Table 3 summarizes the output indicators for the different scenarios. These indicators can be subsequently used for further analysis.

3. Case Study. Renewable Energy Source Potential

The selected study area is the state of Maine (United States). It belongs to the New England region, located in the northeast region of the country; see Figure 4A. The total energy consumption of this state was 328 Trillion–Btu in 2018. The sector with the highest energy consumption was the transportation sector, 32.5%—106.7 Trillion Btu, followed by the industrial, residential, and commercial sectors, with 28.1%, 24.9%, and 14.5%, respectively, of the total energy demand [49]; see Figure 4B. Consumption by sources shows the high use of oil, 174.9 Trillion Btu—53.3% of the total; see Figure 4C.
In line with other countries, the United States of America has also promoted different initiatives to reduce greenhouse emissions and fossil fuel dependency. Indeed, most of state governments have adopted different policies mainly focused on reducing the carbon intensity and diversifying the mix of generation sources with a greater percentage of renewable energy sources [51]. Indeed, policies established by the state of Maine are currently focused on the decarbonization of the economy, integration and promotion of renewable energies, and challenges of energy transition. In 2019, the Renewables Portfolio Standard (RPS) targets were recently updated with the statewide target of 100% renewable by 2050 [52]. The proposed methodology is thus assessed under this specific energy and policy scenario.
Energy consumption data of the transportation sector for the state of Maine can be found in [50], being the State Energy Data System (SEDS) dependent on the U.S. Energy Information Administration (U.S. EIA). Table 4 gives the disaggregated data in British thermal units (Btu). Gasoline is the most used fuel in the state of Maine, accounting for 68.13%, followed by Distillate Fuel Oil—mainly used in buses, railroad locomotives, trucks, etc. Private transportation is dominated by internal combustion vehicles powered by gasoline. In 2018, gasoline consumption was 75,509 Billion Btu, being equivalent to 22,130 converted into electric units according to
G a s o l i n e g a l · 137 , 381 B t u 1 g a l · 1 k W h 3 , 412 B t u · 1 G W h 10 6 k W h .
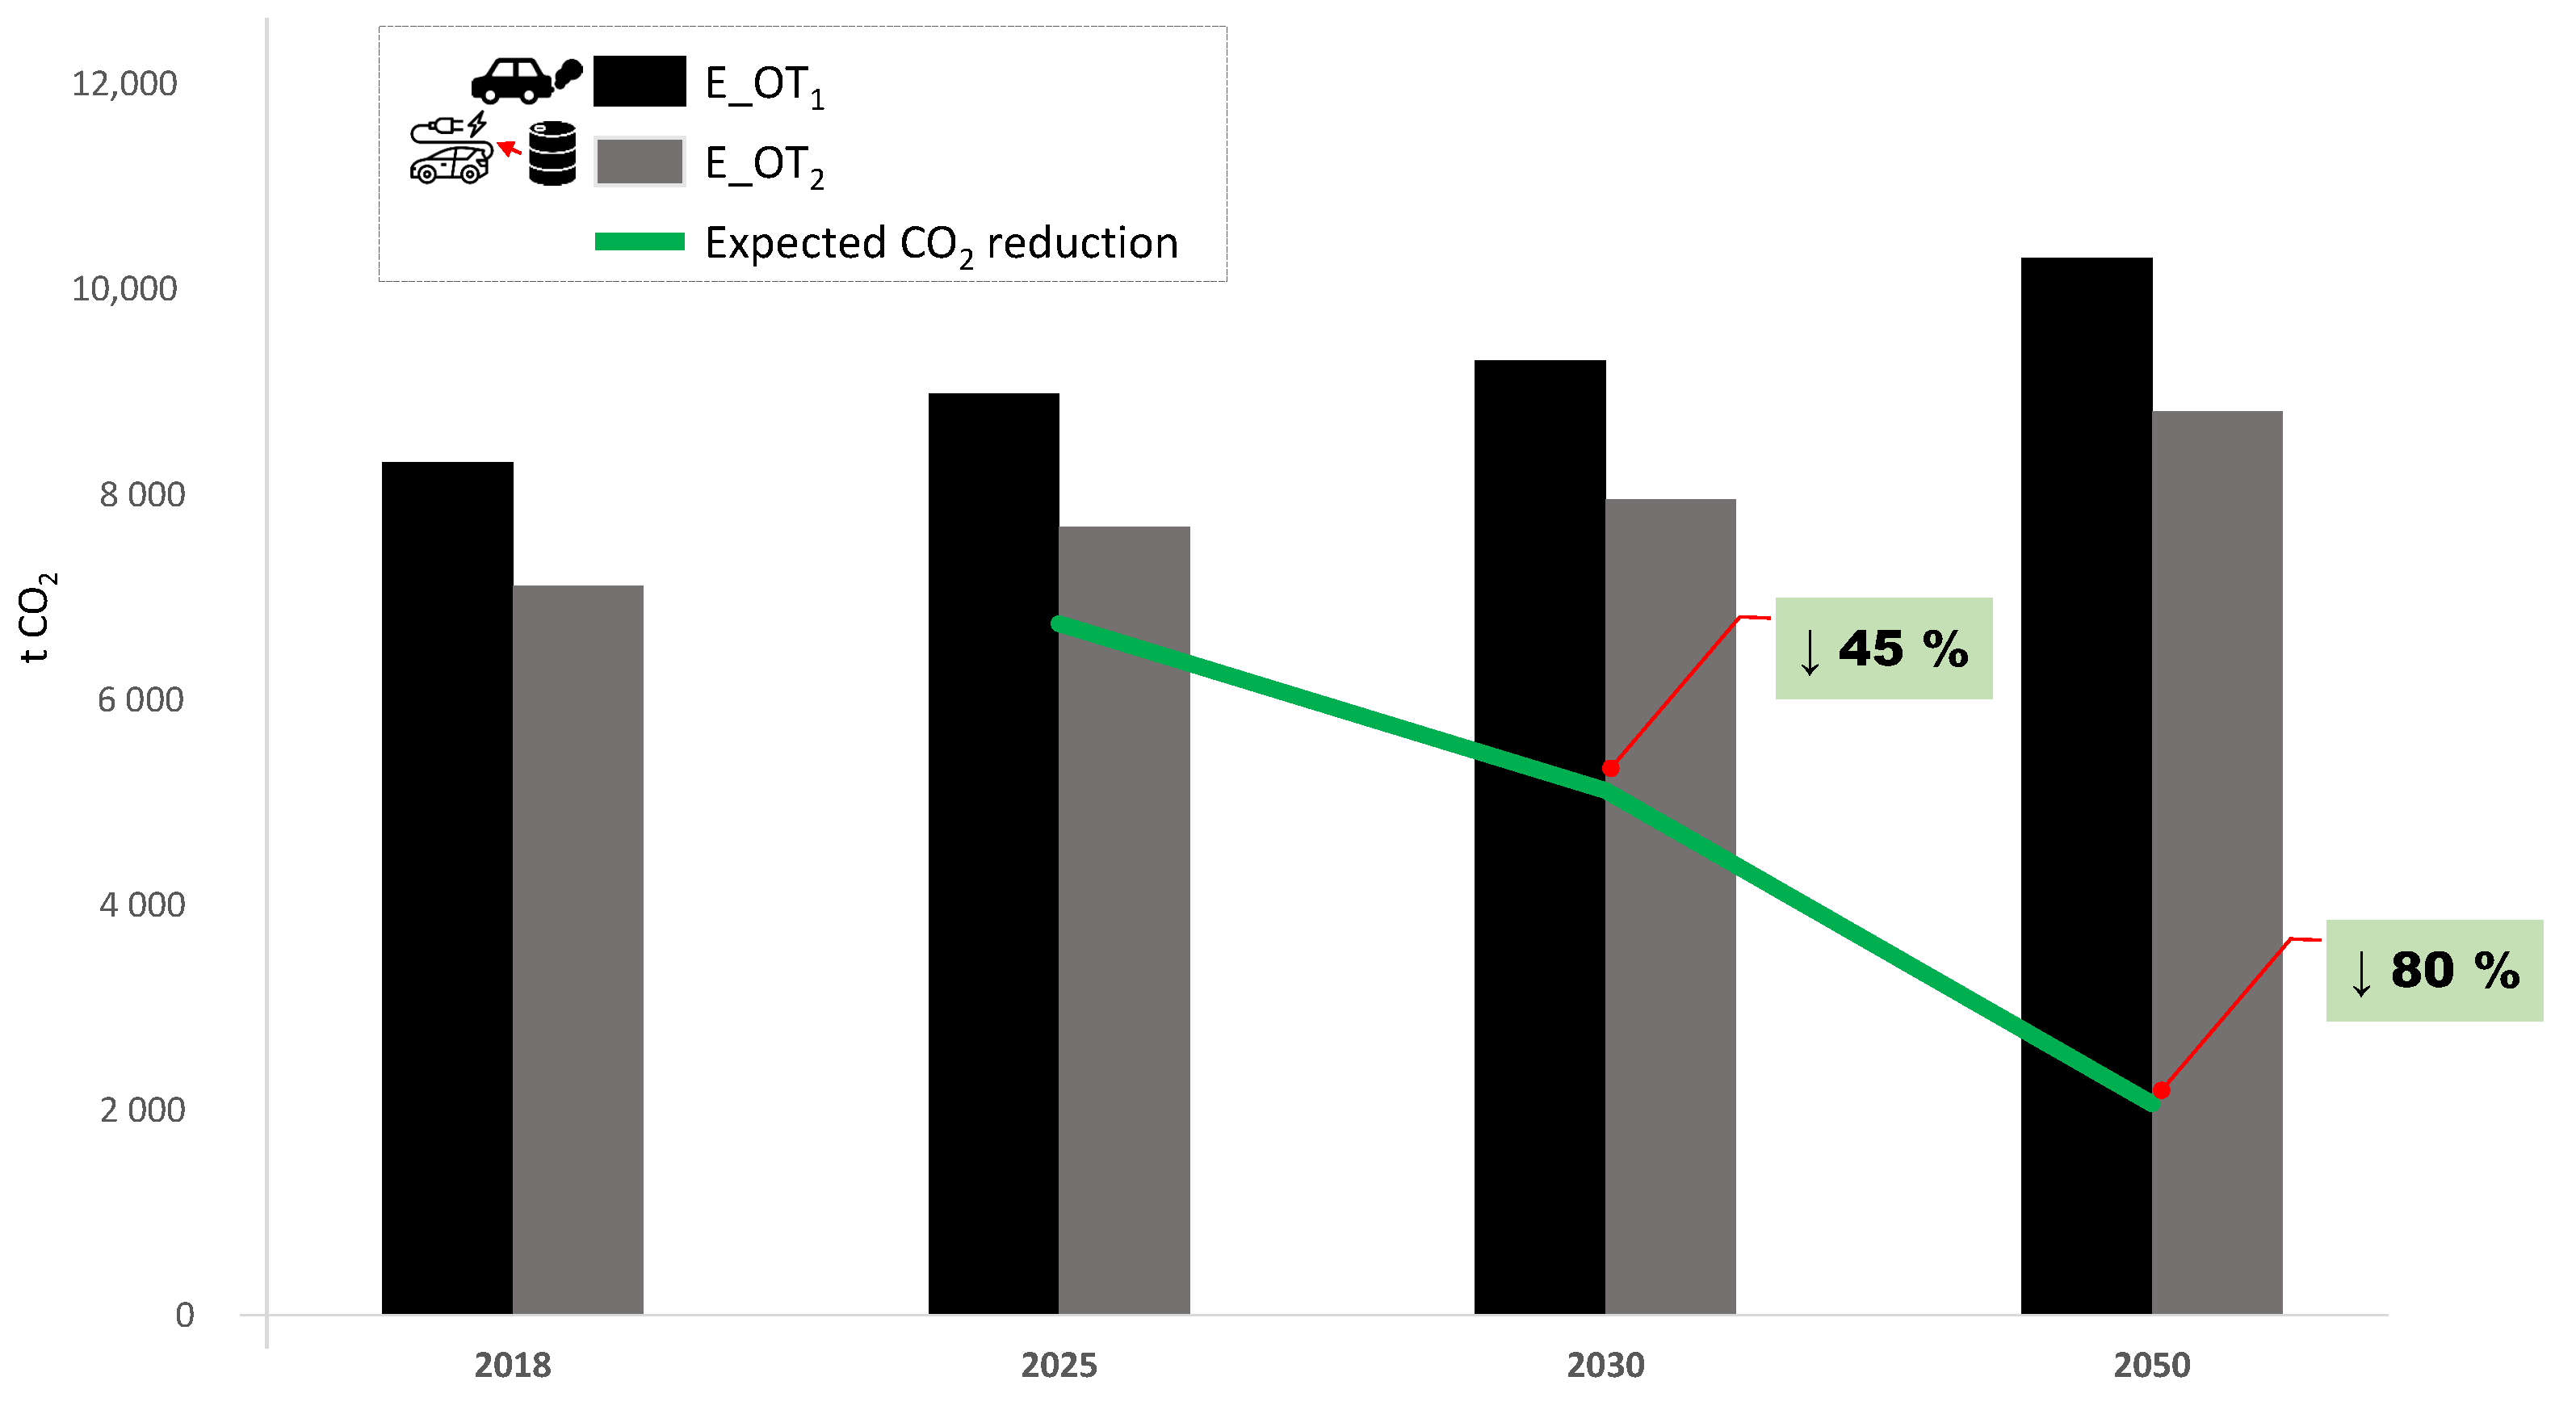
The emission reduction targets for the state of Maine are 45% and 80% for 2030 and 2050, respectively. The Governor-led Maine state climate council developed action plans to reduce Maine’s greenhouse gas emissions [53]. 
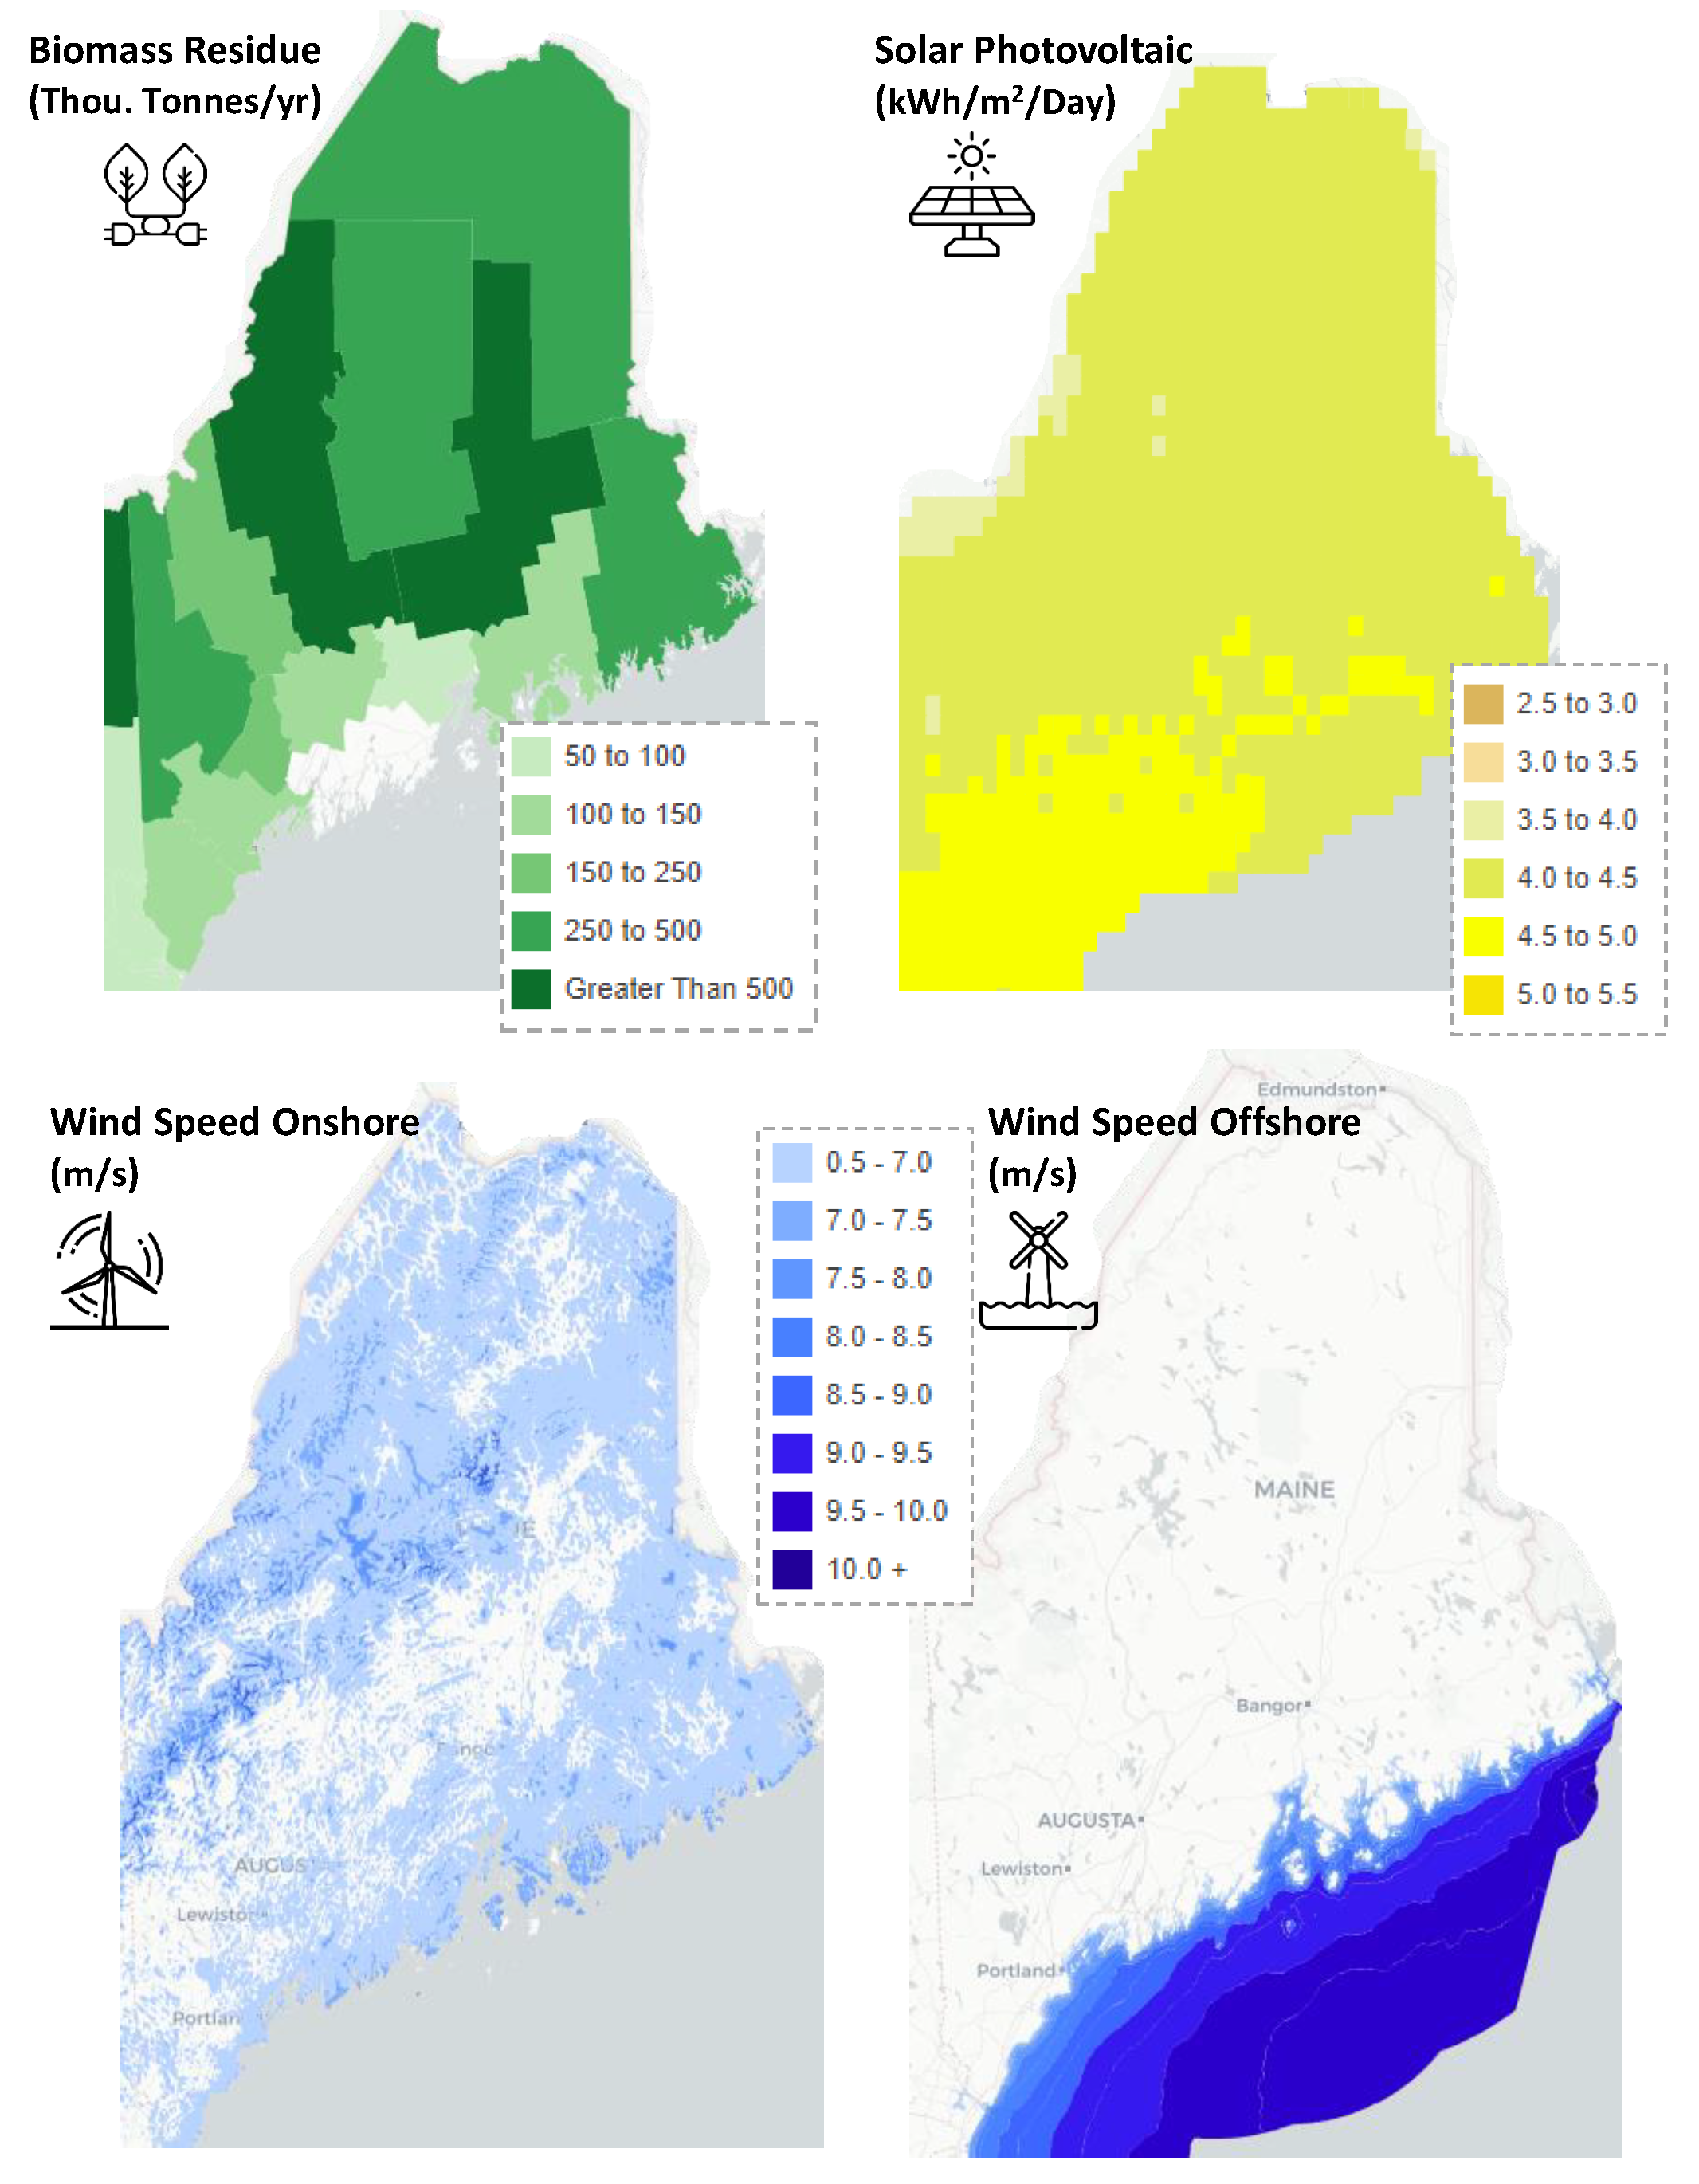
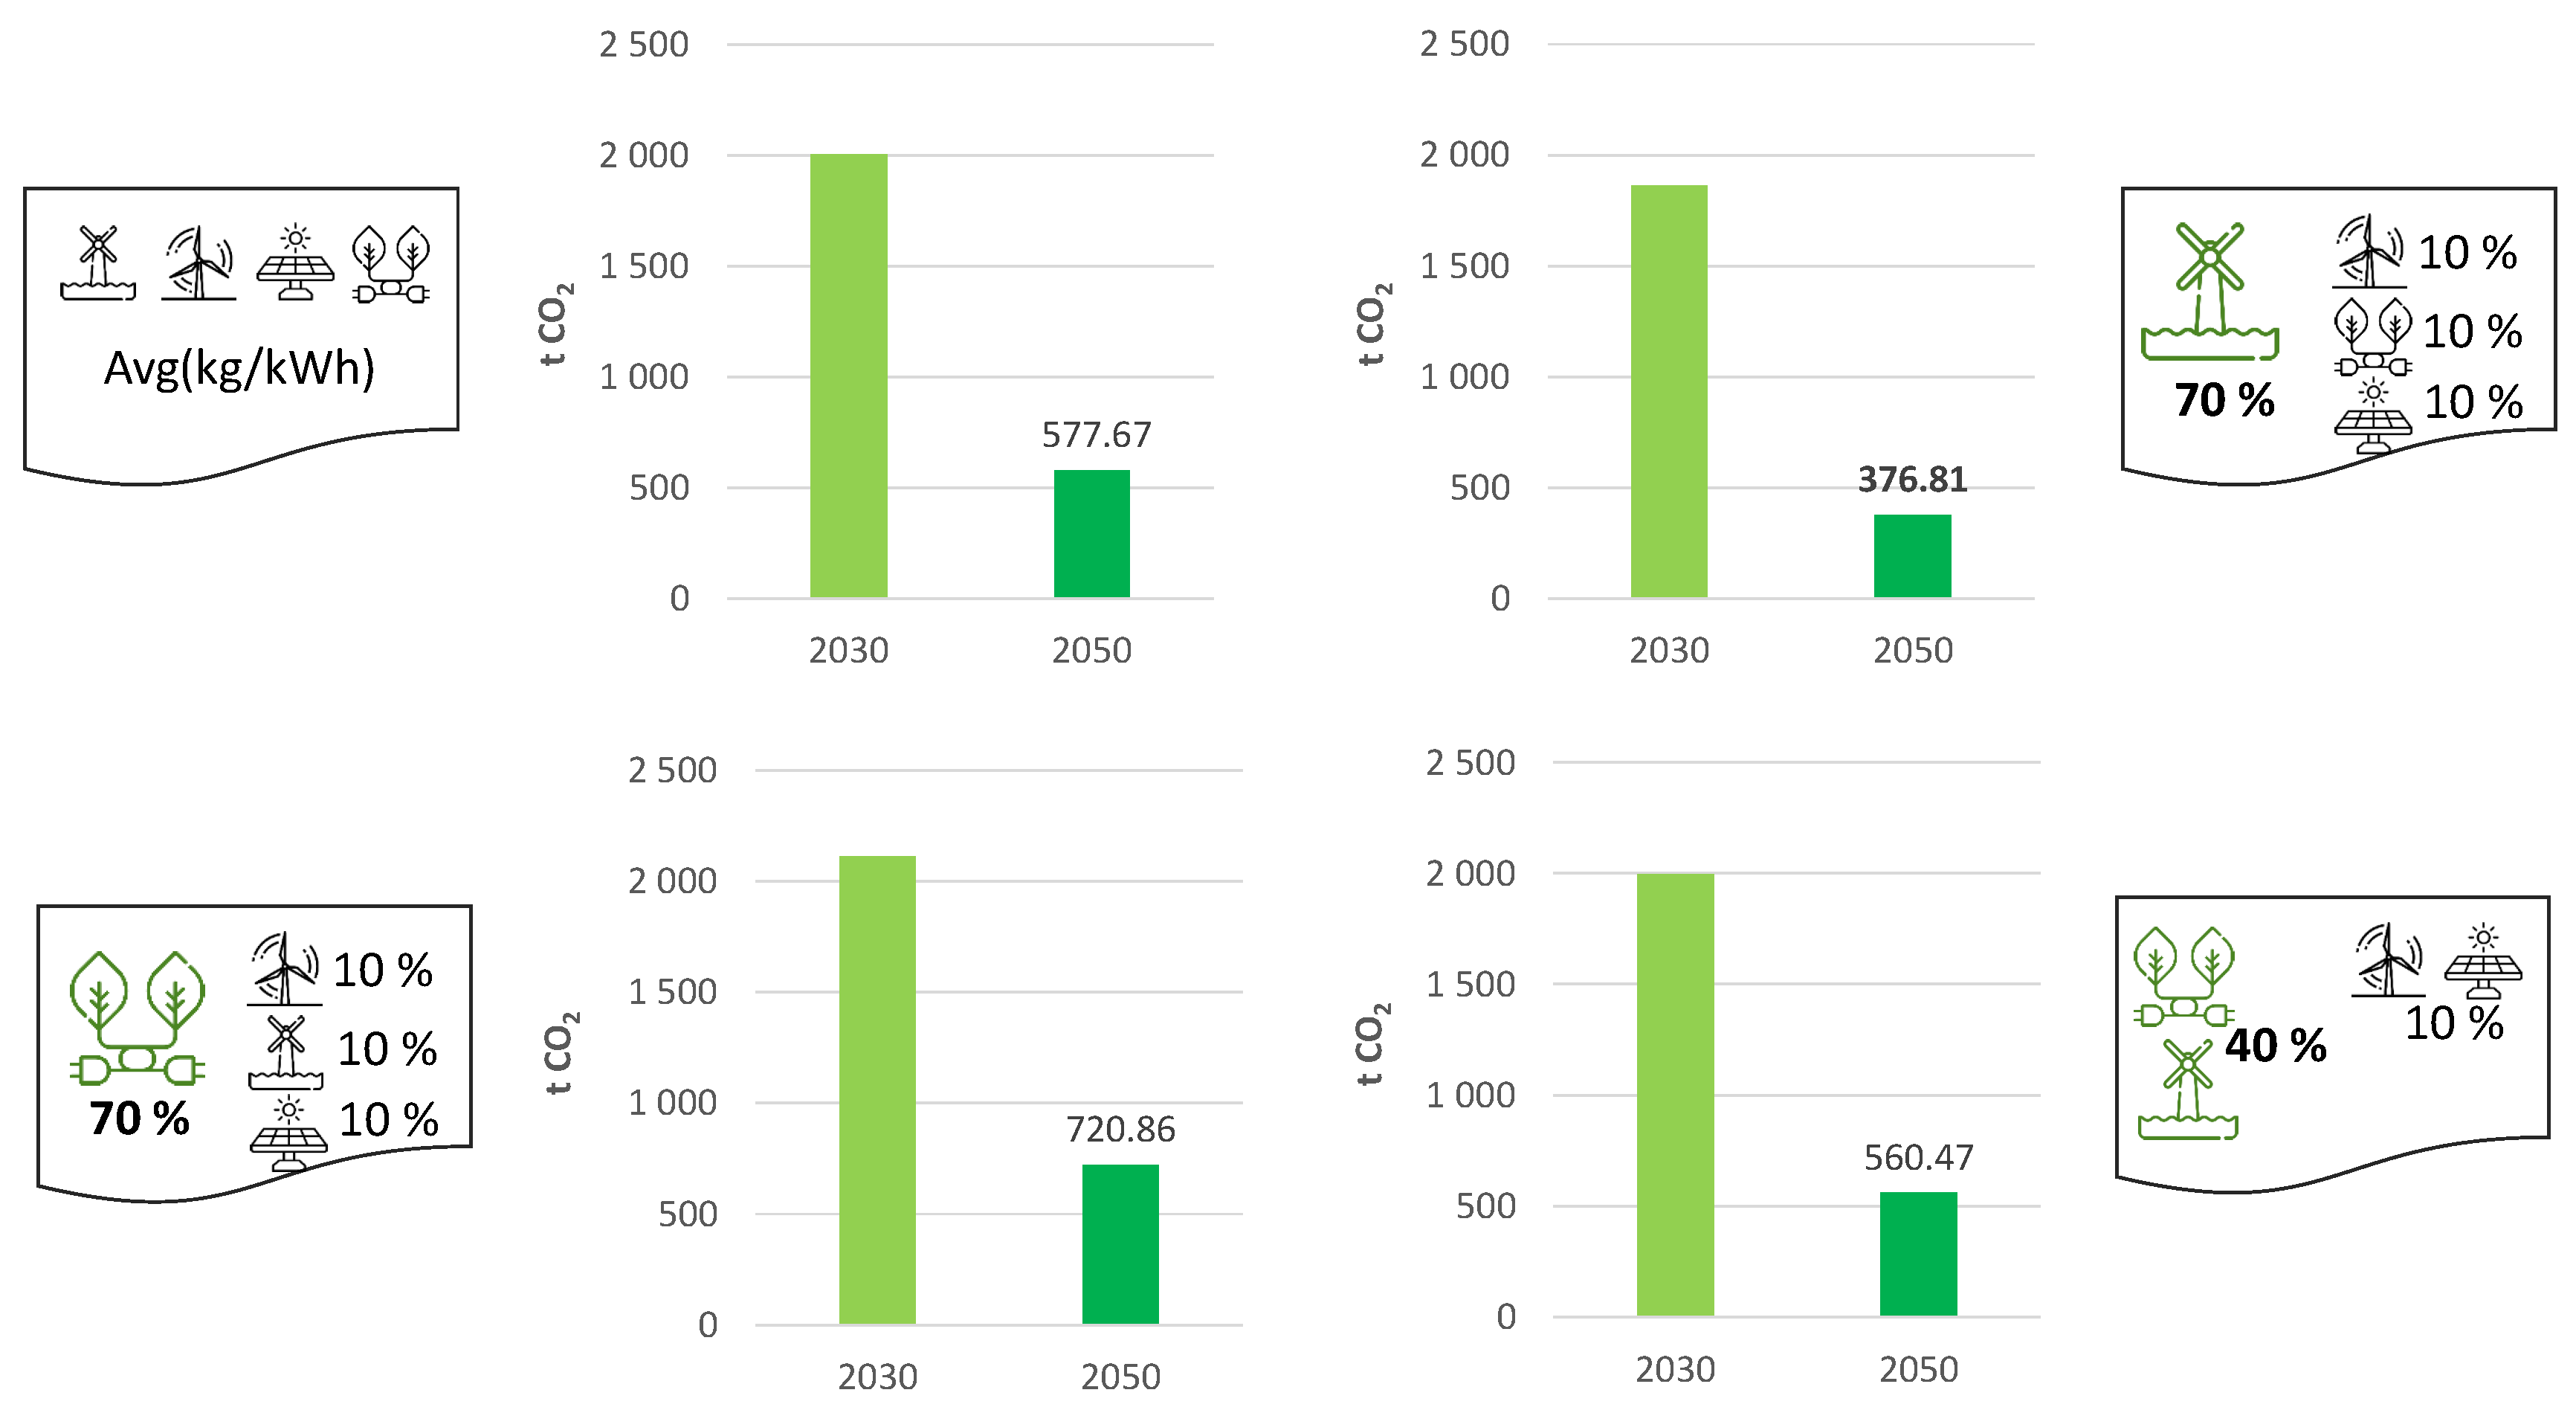
Figure 5 depicts the renewable source potential; mainly based on biomass, photovoltaic solar, and wind (onshore and offshore). This RES potential is very relevant and, today, the Maine energy mix is classified as robust [54], as 40.48% of the total energy consumption comes from renewables—with biomass standing out 67.46% and accounting for 31,710 GWh. Wind power is expected to install 8 GW of power capacity by 2030, including 5 GW wind offshore [53]. In total, the coasts of Maine account for 156 GW offshore wind power estimated capacity [55].
The emissions of vehicles powered by fossil fuels mainly depend on the type of fuel: gasoline or diesel. Shin et al. [57] affirm that consumers recognize diesel type as clean diesel, having low emissions compared with gasoline. Woo et al. [58] establishes that WtW gasoline emissivity is 2778.2 gCO 2 /L (WtT: 2314.4 gCO 2 /L and TtW: 463.8 gCO 2 /L). Considering that the residential transport of the study area is mainly based on gasoline, we calculate the emissions for the base year (2018) and extrapolate until 2050, according to the expected population increase [59]. Results of the scenario E _ O T 1 are summarized in Table A1 (Appendix A). As was previously discussed, the EV scenarios to replace ICEV vehicles include an analysis of economic and technological barriers. In this way, the state of Maine applies instant rebates [60] in the purchase of a group of EVs, which are included in each scenario. Three categories are identified according to the EV autonomy: >300 miles, between 300 and 225 miles, and less than 225, with 50%, 30%, and 20% penetration, respectively; see Table 5. Table A4 summarizes the EV data sheet.

4. Results and Discussion

The impact and fusion of EV powered with renewables within the energy transition is analyzed from a multi-indicator perspective. Results of the different scenarios summarized in Table 2, and some drawbacks to overcome barriers in the transportation sector are following discussed.

4.1. CO 2 Emission Targets

CO 2 emissions are determined according to the penetration of the different EV scenarios, from expressions (4) and (5). The emission factor of the power system generated by oil is estimated as 0.53 kg CO 2 /kWh [61] for the base year t. Results of the scenario E_OT 2 are summarized in Table A2. Subsequently, and based on the scenario E_OT 2 emissions, the expected emissions for the year 2030 and 2050 are determined according to Emission Reduction Targets (ERT); see Table A3. The emission reduction with EV large penetration but without integration of renewables—EV powered by conventional generation units based on fossil fuels— do not meet such emission reduction objectives. Consequently, the integration of renewables in the generation mix of the power system is necessary. With this aim, scenarios E_OT 3 and E_OT 4 are designed by applying the iterative process described in Section 2. The estimation of minimum renewable integration into the generation mix is carried out according to (6). Table 6 gives the expected CO 2 emission reduction for both scenarios. The emission factor of the power system with renewable integration is assumed as 0.04 kg CO 2 /kWh [61,62], from an averaged estimation of the different RES factors with potential in the state of Maine: biomass, photovoltaic solar, and onshore/offshore wind energy.
The replacement of ICEV by EV in the residential sector has a potential emission reduction of 15%. However, the targets set by the state of Maine are 45% and 80% for 2030 and 2050, respectively; see Figure 6. Therefore, additional efforts focused on renewable integration into generation power systems are proposed to fulfill such targets. Moreover, this integration is considered by previous contributions as crucial to decrease emissions. In this way, Nichols et al. [30] conclude that emissions would be even greater if the electric charge is powered by coal, being an important drawback to the EV integration. Another study focused in China, Reference [63], assessed the potential impact of electrification, varying the EV level in the fleet and integration renewables. Results thus implied a significant GHG emission reduction when the generation mix includes a high renewable percentage. In the same way, Abdul–Manan [64] affirms that EV integration does not reduce emissions, specially when the power system generation is based on conventional fossil fuels. Longo et al. [36] demonstrated that the replacement of the vehicle and motorcycle fleet by EVs in the residential sector of Canada and Italy by promoting renewables (wind and solar energy) gives relevant and additional benefits for the environment.
With regard to scenario E_OT 3 , 39% renewable integration into the generation power system is required to fulfill the 45% emission target. Scenario E_OT 4 implies a minimum of 82% renewable integration to fulfill 80% emission target. In this way, a total of 8248 t CO 2 are avoided with respect to scenario E_OT 1 ; see Figure 7. The maximum allowable non-renewable generation limit is 61% (E_OT 3 ) and 18% (E_OT 4 ), respectively. A clear relationship between emission decreasing and RES integration increasing can be deduced from Figure 8, which shows the EV replacement scenarios—see Table 3—in terms of emission reduction and RES integration. In the case study, RES targets are really ambitious and more severe than ERT, expecting 100% renewable in 2050 [52]. In fact, such RES integration targets would address 78% and 94% emission reductions for (E_OT 3 ) and (E_OT 4 ) scenario, respectively; see Figure 8B.
The model assumes that human behavior on the use of EV is the same as in ICEs, however studies have shown that it is not the same in daily mobility [65]. If the pattern of use is lower than the current one, it can be very beneficial from the environmental point of view, the emissions avoided would be higher.

4.2. Renewable Potential and Integration Targets

By considering the renewable resource potential of a specific area, the power generation from renewables differs according to the participation of such resources into the power system. As an example, Figure 9 shows different combinations of renewable resources according to the renewable potential of the study area. The Emission factor of the electrical system generated with renewable sources are assumed according to Table 7 [61,62]. A high offshore wind resource integration addresses a decrease in emissions of almost 35% with respect to the average contributions. This offshore wind participation is aligned with the renewable strategies of the State of Maine in terms of wind power plant designs in the Gulf of Maine, in turn with the high offshore wind potential [55].

4.3. Barriers to EV Massive Adoption

As was previously affirmed, both the growth of the EV fleets and the increase of renewable integration contribute significantly to climate change mitigation [66]. New EV models are designed every year, and they are available to be purchased; in 2020, 5 new models were incorporated into the top 10, as in Figure 2, which shows the trend towards change.
However, and though EV provide a lot of environmental and economic promises [67], they are still not widely adopted by most of countries. Different barriers can be identified, being the related technology one of the main obstacles to frustrate such EVs’ domination [68]. The performance of the battery, its life cycle and the thermal management constitute the main technological barriers that are in full process of improvement. Bhattacharjee et al. [69] developed a novel study on the optimization of thermal management for lithium-ion batteries by designing an immersion liquid cooling system to ensure maximum heat dissipation.
Economic barriers are mostly associated with the price of EVs, still higher than conventional vehicles and linked mainly by battery costs [70]. Comparing the price of both medium-sized cars, the EV costs 40% more than a conventional ICE [71]. Nevertheless, recent studies show that the price of batteries begins to decrease: at the end of 2019 the prices were around USD 200/kWh, a 50% USD 100/kWh decrease is expected by 2030 [72]. With the aim of promoting the EV deployment, many countries have offered different measures to provide economic incentives. For example, Canada established new purchase incentive for ZEV (Zero–Emissions Vehicle) available to both individuals and businesses, of up to $5000 for electric battery or hydrogen fuel cell vehicles with a manufacturer’s suggested retail price of less than $45,000 [73]. Japan established tax incentives and/or exemptions for the acquisition of PHEV and BEV, among others [74]. In Europe, and as Gómez-Vilches et al. [75] affirm, the effectiveness of such financial incentives may differ significantly as a consequence of the consumers’ socio-economic characteristic variability in each European country. For example, in the Netherlands, there is a more favorable income tax rate for people who use low or zero emission company cars for private use (4%) compared to 25% for ICE vehicles. Specifically in Amsterdam, a subsidy scheme was offered for the purchase of frequently used electric vehicles in the city [76]. Denmark, until 1 January 2016, was at the forefront of the European countries with the most sales of battery electric vehicles (BEV), since they were exempt from registration tax, being a great incentive. Once a progressive reduction of the tax exemption was decided, sales were reduced, the new policies have been modified again as of 2017 [77].
Logistic barriers refer to the sites destined to load the EVs, as well as the loading schedules. Although EVs can be loaded at different sites, the infrastructure developed globally for gasoline/diesel refueling cannot be compared to the current EV infrastructure whether private or public. On the other hand, the most appropriate period to charge a battery is over night, although various factors could influence the charging behaviors of EVs [78]. Jägger et al. [79] suggest to introduce a random delay, satisfying the boundary condition that the battery is sufficiently charged in the morning. Efficient EV charging strategies have been proposed in the specific literature to minimize their impact on the grid. Limmer and Rodemann [80] propose a strategy for the establishment of dynamic price offers for different loading times and the scheduling of loading processes. Bastida–Molina et al. [81] evaluate an EV recharging method minimizing the impact on the grid, avoiding peak demand hours in daily electricity demand and taking advantage of temporary valleys. Javed et al. [82] propose a new charging method called Mobile-Vehicle-to-Vehicle (M2V) charging strategy, where EV charging is performed in a Peer-to-Peer (P2P) manner: vehicles are then charged by Charging Stations (CS) or Mobile Vehicles (MV) in the absence of a central entity. More recently, Arribas–Ibar et al. [83] study those factors that influence on the EV ecosystem growth during a pandemic, with an application to the current COVID-19 pandemic.

4.4. Limitations and Future Scope

The proposed analysis presents the following limitations: (i) the study area must be a region committed to slowing down climate change and with policies to promote emission reduction; (ii) minimum required input data: the fossil fuel energy consumption in the residential transport sector—whether of ICE gasoline or fuel vehicles for the base year of study, the Emission Reduction Targets (ERT) of the study area for 2030 and 2050; and the potential of the different renewable energy sources available in the study area. Some topics of interest to extend this work include:
  • Replicate the model in another study area, according to previous limitations and compare the output indicators.
  • Implement new technological substitution scenarios, based on decision-making with multi-criteria evaluation methods.
  • Include additional input data indicators, such as human usage patterns of EV.

5. Conclusions

This paper proposes a multi-indicator analysis to evaluate the massive EV penetration combined with renewable energy source potential and reduction emission targets in the transportation sector. Based on a preliminary renewable energy source potential estimation, four scenarios are identified from the current state of ICE vehicles to the massive introduction of EVs with different levels and combinations of renewables. By considering 100% ICE vehicle replacement, the results can be summarized as follows:
  • By 2030, with the goal of reducing emissions by 45%, the maximum allowable non-renewable electricity limit is 61%, avoiding 4186 t CO 2 .
  • By 2050, with the goal of reducing emissions by 80%, the maximum allowable non-renewable electricity limit is 18% avoiding 8248 t CO 2 .
By considering the high offshore wind resource available in the case study area, emissions can be reduced an additional 35%. The proposed methodology can be applied to other locations, with different renewable potentials and policies, providing a global EV integration analysis from complementary points of view.

Author Contributions

Conceptualization, I.C.G.-G. and M.S.G.-C.; methodology, I.C.G.-G. and H.D.; formal analysis, H.D.; investigation, A.M.-G.; resources, M.S.G.-C.; writing—original draft preparation, I.C.G.-G.; writing—review and editing, A.M.-G.; supervision, A.M.-G.; funding acquisition, M.S.G.-C. All authors have read and agreed to the published version of the manuscript.

Funding

This research received no external funding.

Institutional Review Board Statement

Not applicable.

Informed Consent Statement

Not applicable.

Data Availability Statement

Data available on request from the authors.

Acknowledgments

The authors acknowledge the support of the Fundación Seneca (Region of Murcia, Spain) through the Grant 19882–GERM–15.

Conflicts of Interest

The authors declare no conflict of interest.

Abbreviations

The following abbreviations are used in this manuscript:
BEVFull electric battery vehicle
C O 2 E t CO 2 Emissions
CO 2 Carbon dioxide
C O 2 E _ R E Emissions with all EV scenarios
E _ O T 1 - E _ O T 4 Output scenarios
E F o i l Emission factor of the power generation units based on oil
E F R E S Power system emission factor generated with renewable energy source
ElCEV consumption
EVElectric vehicle
F C t Energy consumption (Fuel)
G C t Energy consumption (Gasoline)
ICEInternal combustion engine
I C E _ F E t CO 2 Emissions. ICE fuel
I C E _ G E t CO 2 Emissions. ICE gasoline
LnRMaximum non–renewable power generation allowed
nScenario
NO x Nitrogen oxides
OECDOrganization for Economic Co-operation and Development
PRESParticipation of renewable energy sources
PHEVPlug-in hybrid electric vehicle
PRESTRenewable energy penetration targets
RESRenewable energy sources
tyear
USUnited States

Appendix A

Table A1. CO 2 Emissions. Scenario E_OT 1 .
2018202520302050
C O 2 E (t CO 2 )8315.28987.49302.110,309.7
Table A2. CO 2 Emissions. Scenario E_OT 2 .
2018202520302050
C O 2 E (t CO 2 )7107.97682.57951.58812.8
Table A3. Expected CO 2 emission reduction.
202520302050
Expected emission reduction (%)254580
Expected emission (t CO 2 )6740.55116.12061.9
Table A4. EV datasheet. (MPGe: Miles per gallon gasoline equivalent, Au: Autonomy, BS: Battery Size, CT: Charge Time, Cpt: Consumption, Un: Unidentified).
MPGeAu (mi)BS (kWh)CT (h)Cpt (kWh/100 km) [84,85]
Tesla Model 3 [86]123322621216.1
Tesla Model Y [86]121315751021.3
Ford Mustang Mach-E [87]Un30088Un23.27
Chevrolet Bolt [88]11925966917.6
Hyundai Kona Electric [89]12025860915.4
Kia Soul [90]10824327519.3
Kia Niro EV [90]11223964914.5
Nissan LEAF [91]11222662818.8
Hyundai Ioniq Electric [89]13617039.3415.5
BMW i3 [92]11815342.2717.8
Volkswagen e-Golf [93]11912536417.4
Smart EQ fortwo [94]1085818319.3

References

  1. Gielen, D.; Boshell, F.; Saygin, D.; Bazilian, M.D.; Wagner, N.; Gorini, R. The role of renewable energy in the global energy transformation. Energy Strategy Rev. 2019, 24, 38–50. [Google Scholar] [CrossRef]
  2. Lu, Y.; Khan, Z.A.; Alvarez-Alvarado, M.S.; Zhang, Y.; Huang, Z.; Imran, M. A critical review of sustainable energy policies for the promotion of renewable energy sources. Sustainability 2020, 12, 5078. [Google Scholar] [CrossRef]
  3. Abdmouleh, Z.; Alammari, R.A.; Gastli, A. Review of policies encouraging renewable energy integration & best practices. Renew. Sustain. Energy Rev. 2015, 45, 249–262. [Google Scholar] [CrossRef]
  4. Hasanuzzaman, M.; Zubir, U.S.; Ilham, N.I.; Seng Che, H. Global electricity demand, generation, grid system, and renewable energy polices: A review. Wiley Interdiscip. Rev. Energy Environ. 2017, 6, e222. [Google Scholar] [CrossRef]
  5. The World Bank. Data. 2020. Available online: https://data.worldbank.org/ (accessed on 10 February 2021).
  6. United Nations. World Population Prospects: The 2015 Revision; Working Paper No. ESA/P/WP.241; Department of Economic and Social Affairs, Population Division, United Nations: New York, NY, USA, 2015. [Google Scholar]
  7. International Energy Outlook 2019 with Projections to 2050. 2019. Available online: https://www.eia.gov/outlooks/ieo/pdf/ieo2019.pdf (accessed on 10 February 2021).
  8. Bulkeley, H.; Coenen, L.; Frantzeskaki, N.; Hartmann, C.; Kronsell, A.; Mai, L.; Marvin, S.; McCormick, K.; van Steenbergen, F.; Voytenko Palgan, Y. Urban living labs: Governing urban sustainability transitions. Curr. Opin. Environ. Sustain. 2016, 22, 13–17. [Google Scholar] [CrossRef] [Green Version]
  9. Bulkeley, H.; Coenen, L.; Frantzeskaki, N.; Hartmann, C.; Kronsell, A.; Mai, L.; Palgan, Y.V. An Urban Politics of Climate Change Experimentation and the Governing of SocioTechnical Transitions; Routledge: London, UK, 2014; Volume 22. [Google Scholar]
  10. Madlener, R.; Sunak, Y. Impacts of urbanization on urban structures and energy demand: What can we learn for urban energy planning and urbanization management? Sustain. Cities Soc. 2011, 1, 45–53. [Google Scholar] [CrossRef]
  11. International Energy Agency, Tracking Transport 2020. Available online: https://www.iea.org/reports/tracking-transport-2020 (accessed on 10 February 2021).
  12. Fan, Y.V.; Perry, S.; Klemes, J.J.; Lee, C.T. A review on air emissions assessment: Transportation. J. Clean. Prod. 2018, 194, 673–684. [Google Scholar] [CrossRef]
  13. Gössling, S.; Cohen, S. Why sustainable transport policies will fail: EU climate policy in the light of transport taboos. J. Transp. Geogr. 2014, 39, 197–207. [Google Scholar] [CrossRef] [Green Version]
  14. Purkus, A.; Gawel, E.; Thrän, D. The Role of a Renewable Energy Target for the Transport Sector Beyond 2020: Lessons Learned from EU Biofuel Policy. In The European Dimension of Germany’s Energy Transition: Opportunities and Conflicts; Gawel, E., Strunz, S., Lehmann, P., Purkus, A., Eds.; Springer International Publishing: Cham, Switzerland, 2019; pp. 527–542. [Google Scholar] [CrossRef]
  15. Hasan, M.; Chapman, R.; Frame, D. Acceptability of transport emissions reduction policies: A multi-criteria analysis. Renew. Sustain. Energy Rev. 2020, 133, 110298. [Google Scholar] [CrossRef]
  16. Connolly, D.; Lund, H.; Mathiesen, B. Smart Energy Europe: The technical and economic impact of one potential 100% renewable energy scenario for the European Union. Renew. Sustain. Energy Rev. 2016, 60, 1634–1653. [Google Scholar] [CrossRef]
  17. Dominković, D.; Baceković, I.; Ćosić, B.; Krajacić, G.; Puksec, T.; Duić, N.; Markovska, N. Zero carbon energy system of South East Europe in 2050. Appl. Energy 2016, 184, 1517–1528. [Google Scholar] [CrossRef] [Green Version]
  18. REN21. Renewables 2020 Global Status Report; REN21 Secretariat: Paris, France, 2020. [Google Scholar]
  19. Greene, D.L.; Park, S.; Liu, C. Analyzing the transition to electric drive vehicles in the U.S. Futures 2014, 58, 34–52. [Google Scholar] [CrossRef]
  20. Dominković, D.; Baceković, I.; Pedersen, A.; Krajacić, G. The future of transportation in sustainable energy systems: Opportunities and barriers in a clean energy transition. Renew. Sustain. Energy Rev. 2018, 82, 1823–1838. [Google Scholar] [CrossRef]
  21. European Environment Information and Observation Network (Eionet). 2019. Available online: https://www.eea.europa.eu/data-and-maps/indicators/proportion-of-vehicle-fleet-meeting-5/assessment (accessed on 10 February 2021).
  22. Global EV Outlook 2020 Entering the Decade of Electric Drive? 2021. Available online: https://www.iea.org/reports/global-ev-outlook-2020 (accessed on 10 February 2021).
  23. EV-Volumes. The Electric Vehicle World Sales Database. 2021. Available online: https://www.ev-volumes.com/ (accessed on 10 February 2021).
  24. United States Environmental Protection Agency (EPA). 2020. Available online: https://www.epa.gov/automotive-trends/highlights-automotive-trends-report (accessed on 10 February 2021).
  25. World’s Top Cleantech Site. Available online: https://cleantechnica.com/ (accessed on 10 February 2021).
  26. Ghosh, A. Possibilities and Challenges for the Inclusion of the Electric Vehicle (EV) to Reduce the Carbon Footprint in the Transport Sector: A Review. Energies 2020, 13, 2602. [Google Scholar] [CrossRef]
  27. Szinai, J.K.; Sheppard, C.J.; Abhyankar, N.; Gopal, A.R. Reduced grid operating costs and renewable energy curtailment with electric vehicle charge management. Energy Policy 2020, 136, 111051. [Google Scholar] [CrossRef]
  28. Li, Y.; Chang, Y. Road transport electrification and energy security in the Association of Southeast Asian Nations: Quantitative analysis and policy implications. Energy Policy 2019, 129, 805–815. [Google Scholar] [CrossRef]
  29. Raugei, M.; Hutchinson, A.; Morrey, D. Can electric vehicles significantly reduce our dependence on non-renewable energy? Scenarios of compact vehicles in the UK as a case im point. J. Clean. Prod. 2018, 201, 1043–1051. [Google Scholar] [CrossRef]
  30. Nichols, B.G.; Kockelman, K.M.; Reiter, M. Air quality impacts of electric vehicle adoption in Texas. Transp. Res. Part D Transp. Environ. 2015, 34, 208–218. [Google Scholar] [CrossRef]
  31. Aare, A.; Krajacić, G.; Puksec, T.E.A. The integration of renewable energy sources and electric vehicles into the power system of the Dubrovnik region. Energ. Sustain. 2015, 5. [Google Scholar] [CrossRef] [Green Version]
  32. Gebrehiwot, M.; Van den Bossche, A. Driving Electric Vehicles: As Green as the Grid; AFRICON: Addis Ababa, Ethiopia, 2015; pp. 1–8. [Google Scholar]
  33. Huo, H.; Cai, H.; Zhang, Q.; Liu, F.; He, K. Life-cycle assessment of greenhouse gas and air emissions of electric vehicles: A comparison between China and the U.S. Atmos. Environ. 2015, 108, 107–116. [Google Scholar] [CrossRef]
  34. Shokrzadeh, S.; Bibeau, E. Sustainable integration of intermittent renewable energy and electrified light-duty transportation through repurposing batteries of plug-in electric vehicles. Energy 2016, 106, 701–711. [Google Scholar] [CrossRef]
  35. Dennis, K.; Colburn, K.; Lazar, J. Environmentally beneficial electrification: The dawn of emissions efficiency. Electr. J. 2016, 29, 52–58. [Google Scholar] [CrossRef] [Green Version]
  36. Longo, M.; Yaïci, W.; Zaninelli, D. “Team Play” between Renewable Energy Sources and Vehicle Fleet to Decrease Air Pollution. Sustainability 2016, 8, 27. [Google Scholar] [CrossRef] [Green Version]
  37. Herrera, O.; Taiebat, M.; Sassani, F.; Mérida, W. Implications of transportation electrification in metro Vancouver. In Proceedings of the 2016 IEEE Canadian Conference on Electrical and Computer Engineering (CCECE), Vancouver, BC, Canada, 15–18 May 2016; pp. 1–4. [Google Scholar]
  38. Wolfram, P.; Wiedmann, T. Electrifying Australian transport: Hybrid life cycle analysis of a transition to electric light-duty vehicles and renewable electricity. Appl. Energy 2017, 206, 531–540. [Google Scholar] [CrossRef] [Green Version]
  39. Jhala, K.; Natarajan, B.; Pahwa, A.; Erickson, L. Coordinated Electric Vehicle Charging for Commercial Parking Lot with Renewable Energy Sources. Electr. Power Components Syst. 2017, 45, 344–353. [Google Scholar] [CrossRef]
  40. Wu, D.; Zeng, H.; Lu, C.; Boulet, B. Two-Stage Energy Management for Office Buildings With Workplace EV Charging and Renewable Energy. IEEE Trans. Transp. Electrif. 2017, 3, 225–237. [Google Scholar] [CrossRef]
  41. Gur, K.; Chatzikyriakou, D.; Baschet, C.; Salomon, M. The reuse of electrified vehicle batteries as a means of integrating renewable energy into the European electricity grid: A policy and market analysis. Energy Policy 2018, 113, 535–545. [Google Scholar] [CrossRef]
  42. Bellocchi, S.; Gambini, M.; Manno, M.; Stilo, T.; Vellini, M. Positive interactions between electric vehicles and renewable energy sources in CO2-reduced energy scenarios: The Italian case. Energy 2018, 161, 172–182. [Google Scholar] [CrossRef]
  43. Bellocchi, S.; Klockner, K.; Manno, M.; Noussan, M.; Vellini, M. On the role of electric vehicles towards low-carbon energy systems: Italy and Germany in comparison. Appl. Energy 2019, 255, 113848. [Google Scholar] [CrossRef]
  44. Liu, J.; Zhong, C. An economic evaluation of the coordination between electric vehicle storage and distributed renewable energy. Energy 2019, 186, 115821. [Google Scholar] [CrossRef]
  45. Zhou, S.; Qiu, Y.; Zou, F.; He, D.; Yu, P.; Du, J.; Luo, X.; Wang, C.; Wu, Z.; Gu, W. Dynamic EV Charging Pricing Methodology for Facilitating Renewable Energy With Consideration of Highway Traffic Flow. IEEE Access 2020, 8, 13161–13178. [Google Scholar] [CrossRef]
  46. Bellocchi, S.; Manno, M.; Noussan, M.; Prina, M.G.; Vellini, M. Electrification of transport and residential heating sectors in support of renewable penetration: Scenarios for the Italian energy system. Energy 2020, 196, 117062. [Google Scholar] [CrossRef]
  47. Yazdanie, M.; Noembrini, F.; Heinen, S.; Espinel, A.; Boulouchos, K. Well-to-wheel costs, primary energy demand, and greenhouse gas emissions for the production and operation of conventional and alternative vehicles. Transp. Res. Part D Transp. Environ. 2016, 48, 63–84. [Google Scholar] [CrossRef]
  48. Ke, W.; Zhang, S.; He, X.; Wu, Y.; Hao, J. Well-to-wheels energy consumption and emissions of electric vehicles: Mid-term implications from real-world features and air pollution control progress. Appl. Energy 2017, 188, 367–377. [Google Scholar] [CrossRef]
  49. U.S. Energy Information Administration (EIA). Maine. 2021. Available online: https://www.eia.gov/beta/states/states/me/overview (accessed on 10 February 2021).
  50. MAINE. State Energy Data System (SEDS). U.S. Energy Information Administration (EIA). 2021. Available online: https://www.eia.gov/state/seds/seds-data-complete.php?sid=ME (accessed on 10 February 2021).
  51. Ali, A.; Li, W.; Hussain, R.; He, X.; Williams, B.W.; Memon, A.H. Overview of current microgrid policies, incentives and barriers in the European Union, United States and China. Sustainability 2017, 9, 1146. [Google Scholar] [CrossRef] [Green Version]
  52. State Renewable Portfolio Standards and Goals. 2021. Available online: https://www.ncsl.org/research/energy/renewable-portfolio-standards.aspx#me (accessed on 10 February 2021).
  53. An Act To Promote Clean Energy Jobs and To Establish the Maine Climate Council. 2021. Available online: http://legislature.maine.gov/bills/getPDF.asp?paper=SP0550&item=3&snum=129 (accessed on 10 February 2021).
  54. Ahmad, N.; Derrible, S. An information theory based robustness analysis of energy mix in US States. Energy Policy 2018, 120, 167–174. [Google Scholar] [CrossRef]
  55. Schwartz, M.; Heimiller, D.; Haymes, S.; Musial, W. Assessment of Offshore Wind Energy Resources for the United States; Technical Report NREL/TP-500-45889; National Renewable Energy Laboratory (NREL): Golden, CO, USA, June 2010. [Google Scholar]
  56. Geospatial Data Science. Data & Tools. NREL. 2021. Available online: https://www.nrel.gov/gis/data-tools.html (accessed on 10 February 2021).
  57. Shin, J.; Lim, T.; Kim, M.Y.; Choi, J.Y. Can next-generation vehicles sustainably survive in the automobile market? Evidence from ex–ante market simulation and segmentation. Sustainability 2018, 10, 607. [Google Scholar] [CrossRef] [Green Version]
  58. Woo, J.; Choi, H.; Ahn, J. Well-to-wheel analysis of greenhouse gas emissions for electric vehicles based on electricity generation mix: A global perspective. Transp. Res. Part D Transp. Environ. 2017, 51, 340–350. [Google Scholar] [CrossRef]
  59. Statista. U.S. population growth projections 2015–2060. 2021. Available online: https://www.statista.com/statistics/183481/united-states-population-projection/ (accessed on 10 February 2021).
  60. About Electric Vehicles. Efficiency Maine. 2021. Available online: https://www.efficiencymaine.com/evehicles/about-electric-vehicles/ (accessed on 10 February 2021).
  61. Turconi, R.; Boldrin, A.; Astrup, T. Life cycle assessment (LCA) of electricity generation technologies: Overview, comparability and limitations. Renew. Sustain. Energy Rev. 2013, 28, 555–565. [Google Scholar] [CrossRef] [Green Version]
  62. Kaldellis, J.; Apostolou, D. Life cycle energy and carbon footprint of offshore wind energy. Comparison with onshore counterpart. Renew. Energy 2017, 108, 72–84. [Google Scholar] [CrossRef]
  63. Zhao, S.J.; Heywood, J.B. Projected pathways and environmental impact of China’s electrified passenger vehicles. Transp. Res. Part D: Transp. Environ. 2017, 53, 334–353. [Google Scholar] [CrossRef] [Green Version]
  64. Abdul-Manan, A.F. Uncertainty and differences in GHG emissions between electric and conventional gasoline vehicles with implications for transport policy making. Energy Policy 2015, 87, 1–7. [Google Scholar] [CrossRef]
  65. Niklas, U.; von Behren, S.; Chlond, B.; Vortisch, P. Electric Factor—A Comparison of Car Usage Profiles of Electric and Conventional Vehicles by a Probabilistic Approach. World Electr. Veh. J. 2020, 11, 36. [Google Scholar] [CrossRef]
  66. Petrauskiene, K.; Dvarioniene, J.; Kaveckis, G.; Kliaugaite, D.; Chenadec, J.; Hehn, L.; Pérez, B.; Bordi, C.; Scavino, G.; Vignoli, A.; et al. Situation analysis of policies for electric mobility development: Experience from five european regions. Sustainability 2020, 12, 2935. [Google Scholar] [CrossRef] [Green Version]
  67. Habib, S.; Khan, M.M.; Abbas, F.; Tang, H. Assessment of electric vehicles concerning impacts, charging infrastructure with unidirectional and bidirectional chargers, and power flow comparisons. Int. J. Energy Res. 2018, 42, 3416–3441. [Google Scholar] [CrossRef]
  68. Un-Noor, F.; Padmanaban, S.; Mihet-Popa, L.; Mollah, M.N.; Hossain, E. A comprehensive study of key electric vehicle (EV) components, technologies, challenges, impacts, and future direction of development. Energies 2017, 10, 1217. [Google Scholar] [CrossRef] [Green Version]
  69. Bhattacharjee, A.; Mohanty, R.K.; Ghosh, A. Design of an Optimized Thermal Management System for Li-Ion Batteries under Different Discharging Conditions. Energies 2020, 13, 5695. [Google Scholar] [CrossRef]
  70. Adhikari, M.; Ghimire, L.P.; Kim, Y.; Aryal, P.; Khadka, S.B. Identification and Analysis of Barriers against Electric Vehicle Use. Sustainability 2020, 12, 4850. [Google Scholar] [CrossRef]
  71. Global EV Outlook 2019 Scaling-Up the Transition to Electric Mobility. 2020. Available online: https://www.iea.org/reports/global-ev-outlook-2019 (accessed on 10 February 2021).
  72. Barkenbus, J.N. Prospects for Electric Vehicles. Sustainability 2020, 12, 5813. [Google Scholar] [CrossRef]
  73. Government of Canada, Budget 2019. 2019. Available online: https://budget.gc.ca/2019/docs/plan/chap-02-en.html (accessed on 10 February 2021).
  74. METI Releases Interim Report by Strategic Commission for the New era of Automobiles, Ministry of Economy Trade and Industry. 2020. Available online: https://www.meti.go.jp/english/press/2018/0831_003.html (accessed on 10 February 2021).
  75. Gómez Vilchez, J.J.; Smyth, A.; Kelleher, L.; Lu, H.; Rohr, C.; Harrison, G.; Thiel, C. Electric Car Purchase Price as a Factor Determining Consumers’ Choice and their Views on Incentives in Europe. Sustainability 2019, 11, 6357. [Google Scholar] [CrossRef] [Green Version]
  76. Ayodele, B.V.; Mustapa, S.I. Life Cycle Cost Assessment of Electric Vehicles: A Review and Bibliometric Analysis. Sustainability 2020, 12, 2387. [Google Scholar] [CrossRef] [Green Version]
  77. International Energy Agency. Policies and Legislation on Hybrid and Electric Vehicles. 2021. Available online: http://www.ieahev.org/ (accessed on 10 February 2021).
  78. Yang, Y.; Tan, Z.; Ren, Y. Research on Factors That Influence the Fast Charging Behavior of Private Battery Electric Vehicles. Sustainability 2020, 12, 3439. [Google Scholar] [CrossRef] [Green Version]
  79. Jäger, G.; Hofer, C.; Füllsack, M. The Benefits of Randomly Delayed Charging of Electric Vehicles. Sustainability 2019, 11, 3722. [Google Scholar] [CrossRef] [Green Version]
  80. Limmer, S.; Rodemann, T. Peak load reduction through dynamic pricing for electric vehicle charging. Int. J. Electr. Power Energy Syst. 2019, 113, 117–128. [Google Scholar] [CrossRef]
  81. Bastida-Molina, P.; Hurtado-Pérez, E.; Pérez-Navarro, A.; Alfonso-Solar, D. Light electric vehicle charging strategy for low impact on the grid. Environ. Sci. Pollut. Res. Int. 2020. [Google Scholar] [CrossRef] [PubMed]
  82. Javed, M.U.; Javaid, N.; Aldegheishem, A.; Alrajeh, N.; Tahir, M.; Ramzan, M. Scheduling Charging of Electric Vehicles in a Secured Manner by Emphasizing Cost Minimization Using Blockchain Technology and IPFS. Sustainability 2020, 12, 5151. [Google Scholar] [CrossRef]
  83. Arribas-Ibar, M.; Nylund, P.A.; Brem, A. The Risk of Dissolution of Sustainable Innovation Ecosystems in Times of Crisis: The Electric Vehicle during the COVID-19 Pandemic. Sustainability 2021, 13, 1319. [Google Scholar] [CrossRef]
  84. Environmental Protection Agency. 2020. Available online: https://www.epa.gov/ (accessed on 10 February 2021).
  85. Natural Resources Canada. 2020. Available online: https://www.nrcan.gc.ca/home (accessed on 10 February 2021).
  86. Tesla. 2019. Available online: https://www.tesla.com/es_ES/models (accessed on 10 February 2021).
  87. Ford. 2020. Available online: https://www.ford.es/turismos/mustang-mach-e (accessed on 10 February 2021).
  88. Chevrolet. 2019. Available online: https://www.chevrolet.com.mx/autos-electricos/bolt-ev-coche-electrico (accessed on 10 February 2021).
  89. Hyundai. 2020. Available online: https://www.hyundai.com/es/modelos/kona-electrico.html (accessed on 10 February 2021).
  90. Kia. 2020. Available online: https://www.kia.com/us/es/vehicles (accessed on 10 February 2021).
  91. Nissan. 2019. Available online: https://www.nissan.es/vehiculos/nuevos-vehiculos/leaf.html (accessed on 10 February 2021).
  92. BMW. 2020. Available online: https://www.bmw.es/es/coches-bmw/bmw-i/i3/2020/presentacion.html (accessed on 10 February 2021).
  93. Volkswagen. 2020. Available online: https://www.volkswagen.es/es/modelos-configurador/e-golf.html (accessed on 10 February 2021).
  94. Smart. 2020. Available online: https://www.smart.com/es/es/modelos/eq-fortwo-coupe#126 (accessed on 10 February 2021).
Figure 1. New electric vehicles sales (millions). Source: References [22,23]—own elaboration.
Sustainability 13 03430 g001
Figure 2. Ranking of electric vehicles sales (2019-preliminary 2020). Source: References [23,25]—own elaboration.
Sustainability 13 03430 g002
Figure 3. Proposed methodology. Own elaboration.
Sustainability 13 03430 g003
Figure 4. Study zone. State of Maine, United States (A). Energy consumption by sector. 2018 (B). Energy consumption by source. 2018 (C). Source: Reference [50]—own elaboration.
Sustainability 13 03430 g004
Figure 5. Potential from renewable sources. State of Maine. Source: Reference [56]—own elaboration.
Sustainability 13 03430 g005
Figure 6. CO 2 emissions and expected reduction in the period 2018–2050. Scenarios E_OT 1 (The vehicle fleet maintains the traditional ICE ) and E_OT 2 (ICE vehicle substituted by EV without RES integration). Decrease in expected emissions (2018–2050). Own elaboration.
Sustainability 13 03430 g006
Figure 7. Emitted and avoided emissions (2050). Own elaboration.
Sustainability 13 03430 g007
Figure 8. Power system generation mix and EV integration (2050). Emissions reduction target (A), RES penetration targets (B). Own elaboration.
Sustainability 13 03430 g008
Figure 9. CO 2 emissions according to the RES integration targets with different contributions. Own elaboration.
Sustainability 13 03430 g009
Table 1. Electrification of the transport sector analysis review. Integration with renewable energies (I ( R E S ) ), Penetration Renewable Energy Targets (PREST), Renewable energy source potential in the area (PoRES), Reduction of CO 2 (↓ C O 2 ), Emission Reduction Targets (ERT).
Indicators
Ref.YearI ( RES ) PRESTPoRES↓CO 2 ERT
[30]2015X X
[31]X X
[32]X X
[33]X X
[34]2016X X
[35]X X
[36]X X
[37]X X
[38]2017X X
[39]X
[40]X
[29]2018X
[41]X
[42]X X
[28]2019X X
[43]X X
[44]X
[45]X
[27]2020X
[46]X X
[26]X X
Proposed analysis XXXXX
Table 2. Electric Vehicles (EV) and Renewable Energy Sources (RES) integration scenarios.
ScenariosDescription
E_OT 1 The vehicle fleet maintains the traditional ICE
E_OT 2 ICE vehicle substituted by EV without RES integration
E_OT 3 EV scenario with RES integration to fulfill ERT-2030
E_OT 4 EV scenario with RES integration to fulfill ERT-2050
Table 3. Output indicators.
ScenariosIndicatorExtrapolated to 2050
E_OT 1 C O 2 E t
C O 2 E t (ERT)
E_OT 2 C O 2 E _ R E t
E_OT 3 (2030)LnR
& P R E S
E_OT 4 (2050) C O 2 E _ R E t P _ R E S i
Table 4. Disaggregated data of the transport sector. State of Maine (USA, 2018). Source: Reference [50].
ConceptBillion Btu%
Coal0
Natural gas8510.77
Aviation gasoline1180.11
Distillate fuel oil26,79024.17
Biodiesel9850.89
Hydrocarbon gas liquids70.01
Jet fuel55625.02
Lubricants5840.53
Motor gasoline75,50968.13
Residual fuel oil4170.38
All petroleum products109,97299.23
Total energy consumed110,823100
Table 5. CO 2 Emissions. Scenario E_OT 2 .
Scenarios EV 1 EV 2 EV 3
Categories ( mi ) >300[225, 300]<225
Penetration level ( % ) 503020
Autonomy ( mi ) 312.3245126.5
Battery ( kWh ) 7555.833.9
Consumption ( kWh / 100 km ) 20.2217.217.5
Table 6. Expected CO 2 emission reduction.
E_OT 3 E_OT 4
Year20302050
L n R ( % ) 6118
P _ R E S ( % ) 3982
Emission (t CO 2 )5053.72059.9
Table 7. Emission factor of power system generation from RES. Source: References [61,62].
Renewable Energy SourceEmission Factor (kgCO 2 /kWh)
Wind Offshore16
Wind Onshore9
Biomass51.02
Photovoltaic solar65.05
Publisher’s Note: MDPI stays neutral with regard to jurisdictional claims in published maps and institutional affiliations.

