
Improved Cognitive Vigilance Assessment after Artifact Reduction with Wavelet Independent Component Analysis


Abstract
:1. Introduction
2. Methodology
2.1. Participants
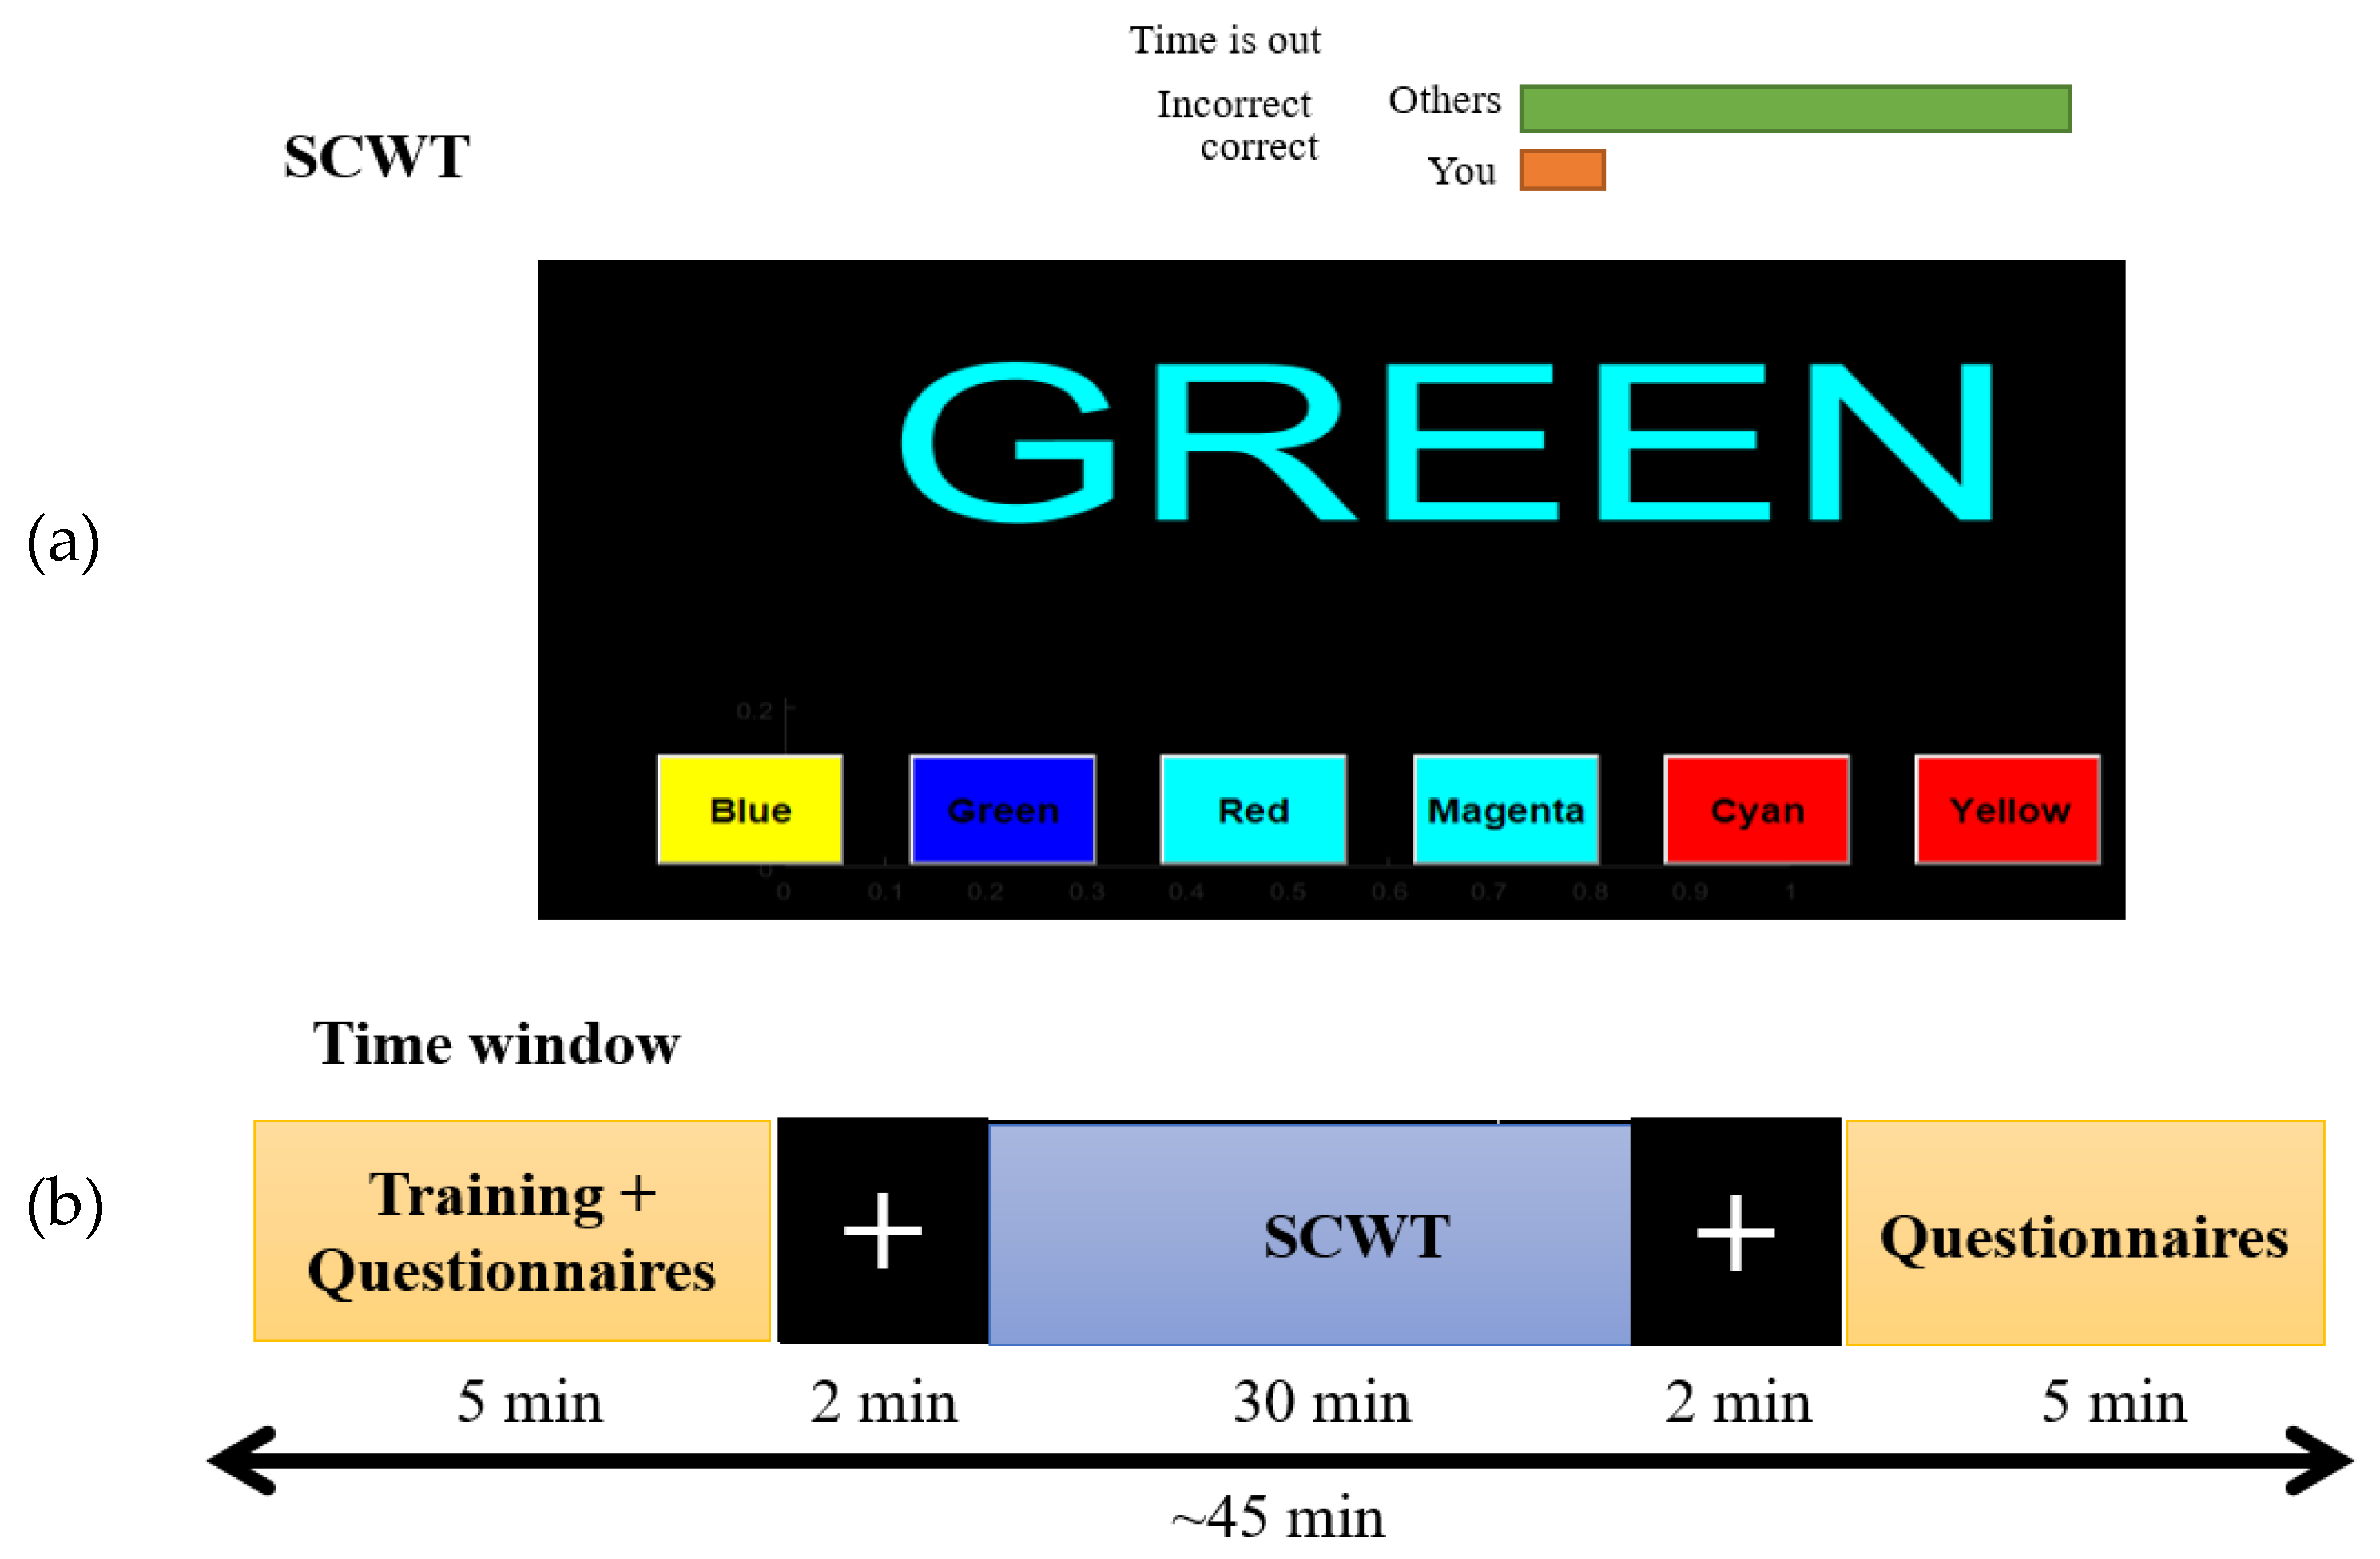
2.2. Vigilance Task
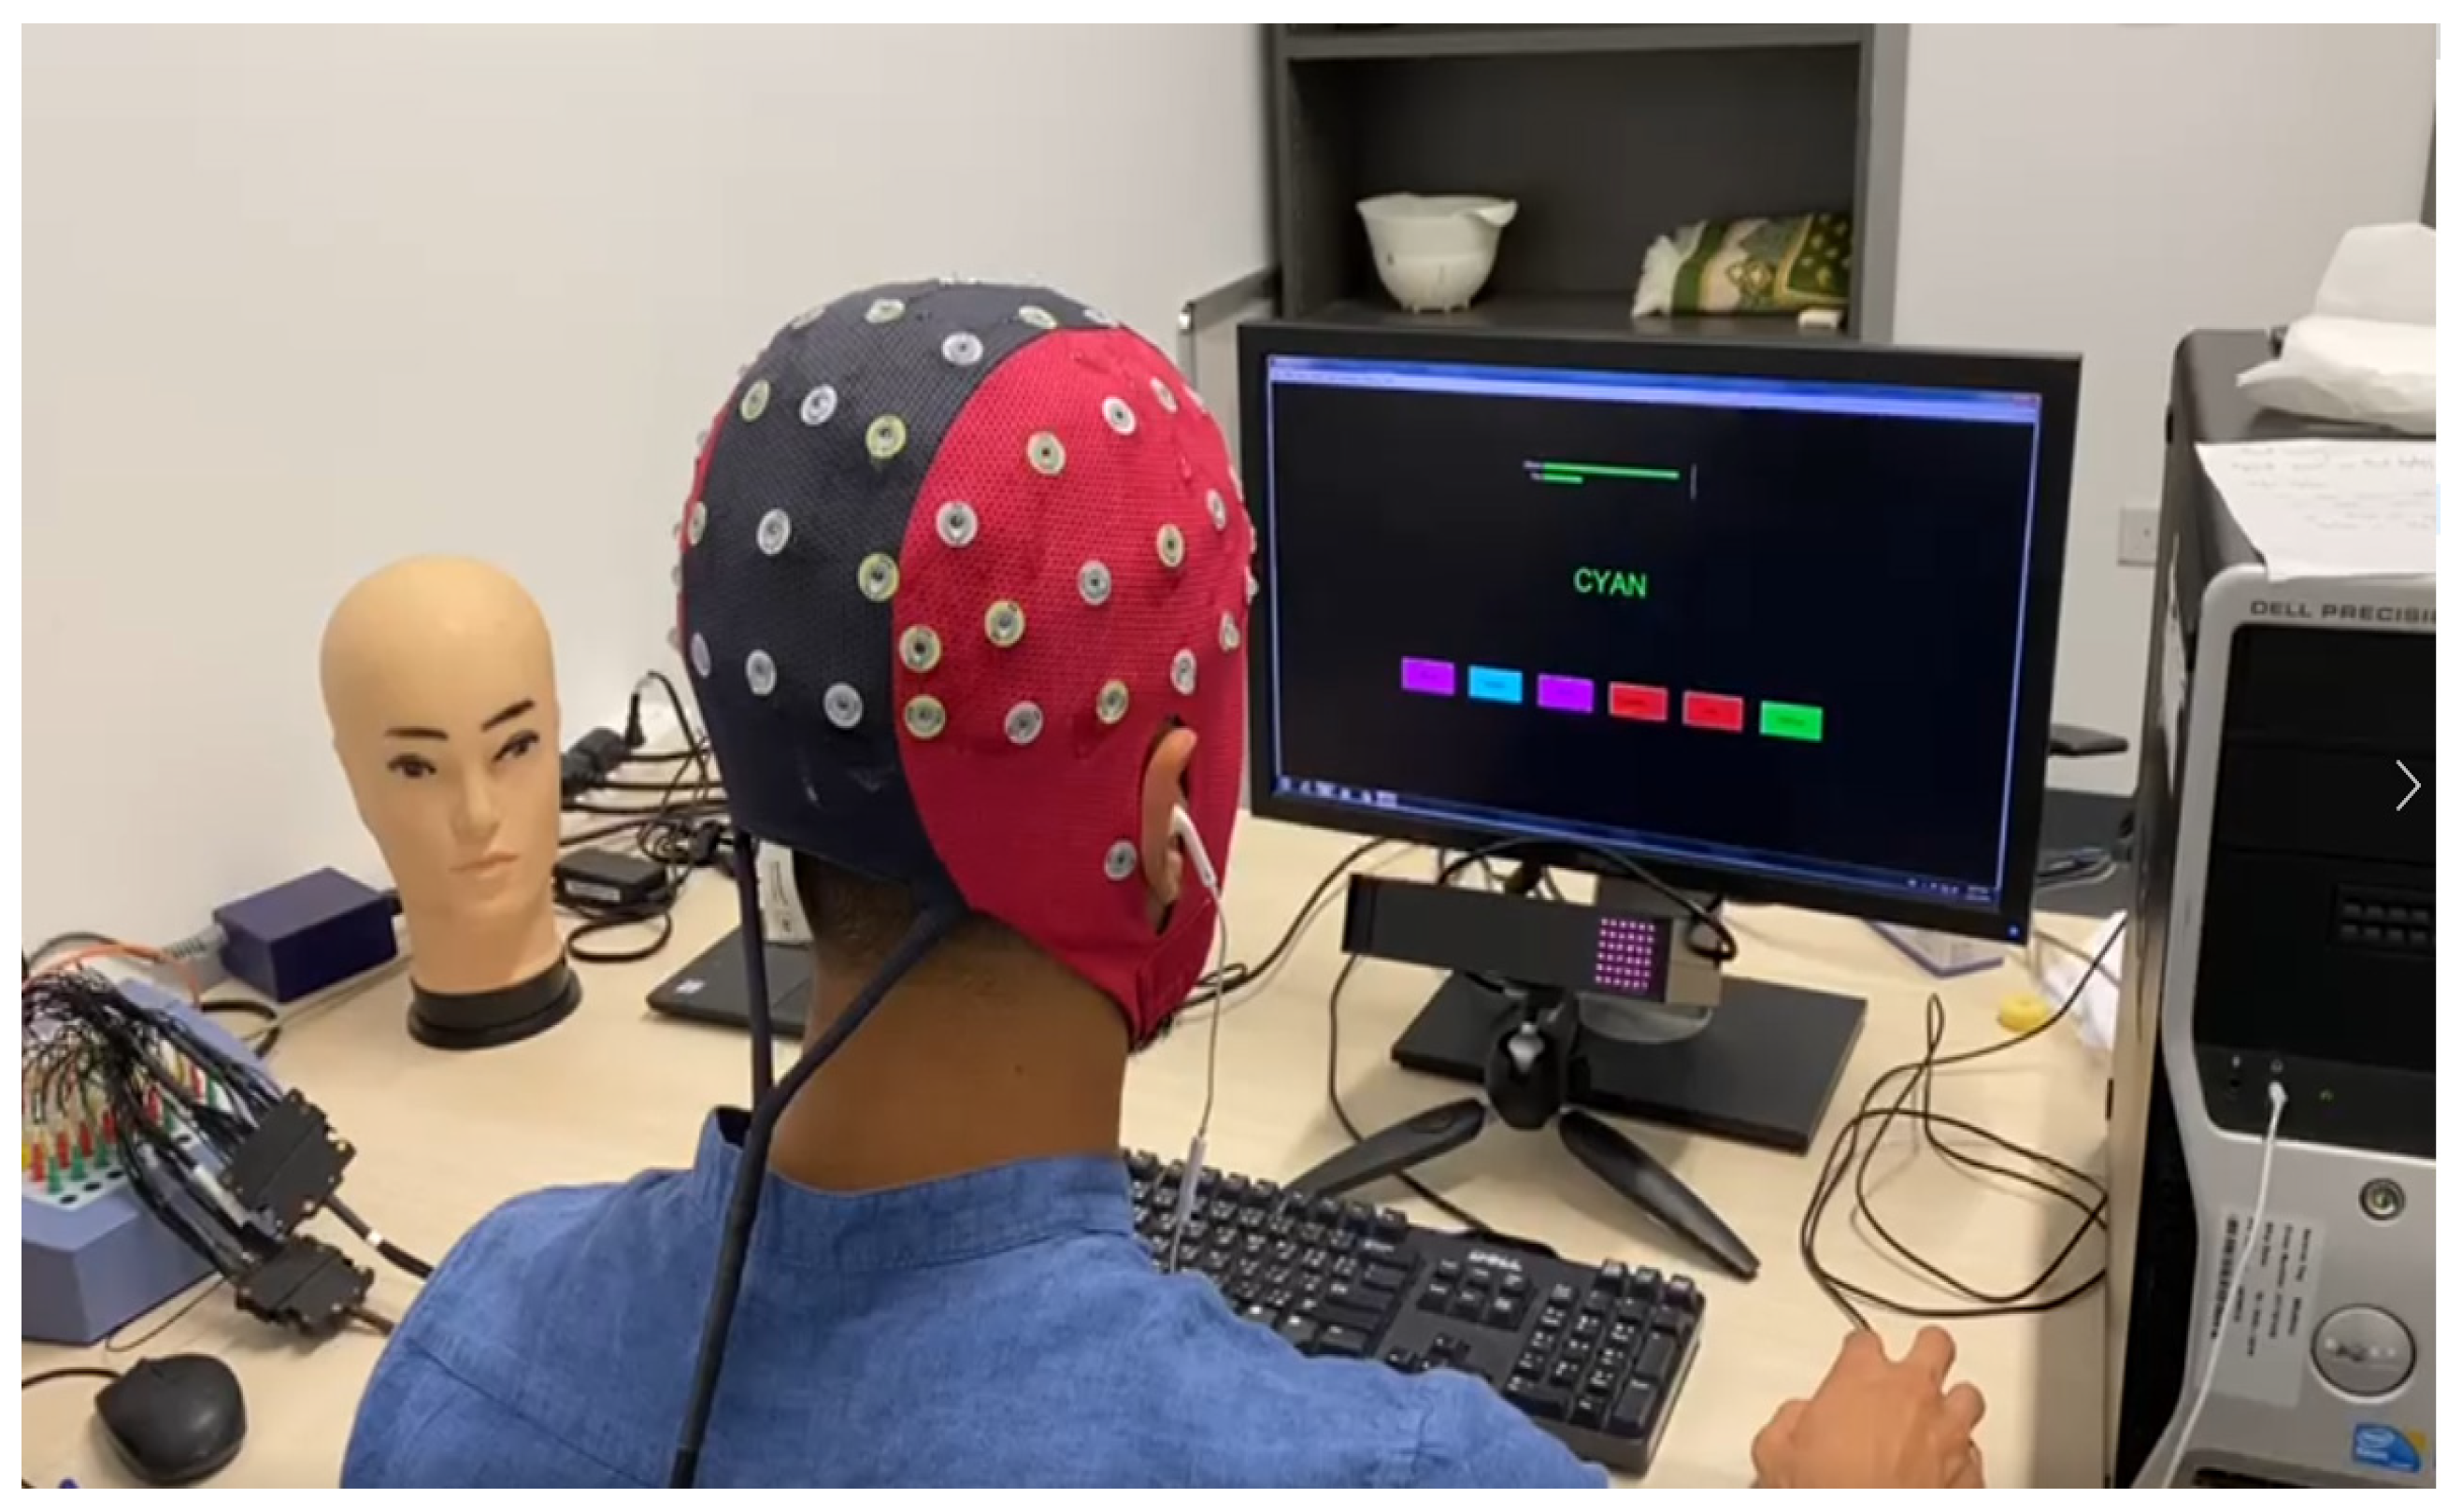
2.3. Experimental Setup and Data Acquisition
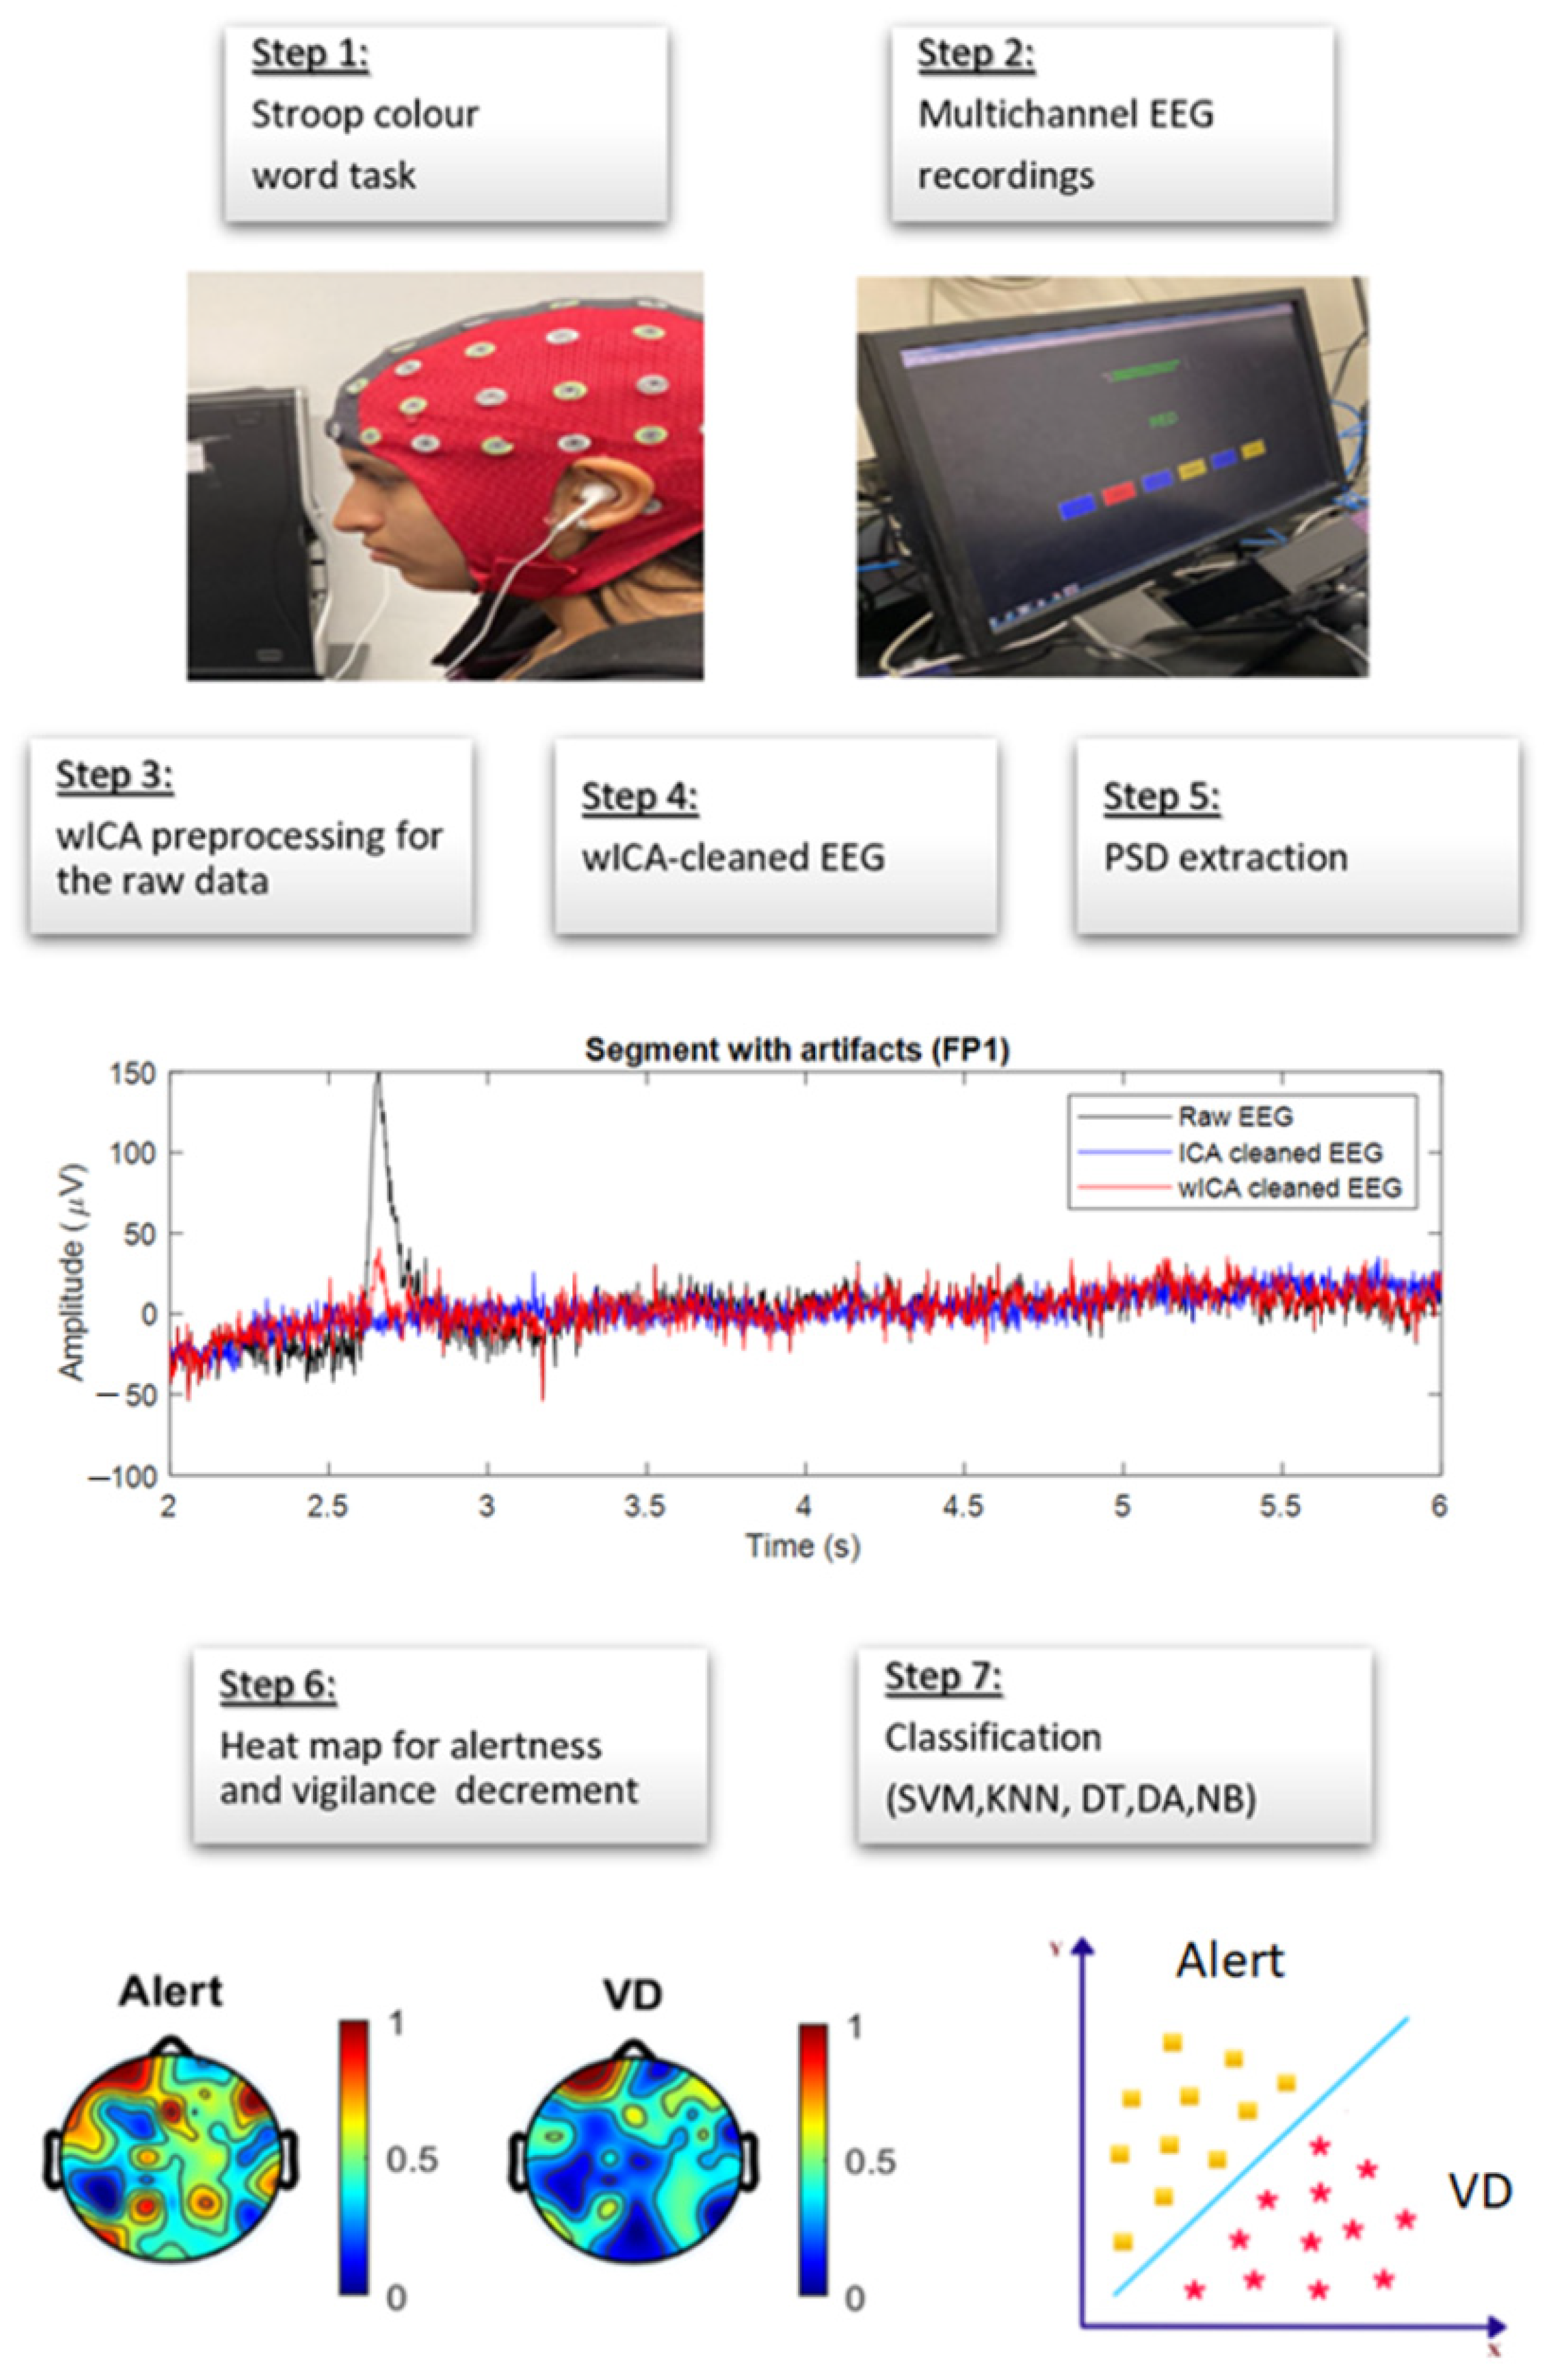
2.4. EEG Data Preprocessing
- In standard ICA analysis [26,31], the recorded EEG signal matrix, X(t), is modeled by the source components sT = [, , …, ], where n is the source number, which are assumed to be statistically independent, mixed using the mixing matrix M to produce the EEG signals:After identifying the artifact components, they can be set to equal zero. Artifact removal will be followed by ICA signal reconstruction. The reconstructed EEG is:
- In wICA, the artifact components are identified and subtracted from the signal to keep the neural components, unlike the conventional ICA artifact removal which sets all artifact components to zero. Let us assume an independent component which is a combination of a high amplitude artifact and a low amplitude neural signal such that:
- The features of the signals and can be estimated. The artifact has high power that is localized in both time and frequency domains, whereas has low power. Then, by estimating , we can subtract it to reconstruct clean data as follows:where is the corresponding weight from the mixing matrix M, and the artifact-free signal is the ICA-corrected EEG signal.
- To separate the artifact from the neural information in s1, we apply wavelet transformation on the independent components to obtain the wavelet coefficients , where and are integers that play a role in the decomposition level and the temporal localization. The wavelet coefficients are then thresholded by setting the coefficients more than a certain threshold to zero. This way, the coefficients representing the artifact are removed. Thresholding was optimized following the techniques found in [39]. The threshold value, T is defined by T =, where N is the length of the data segment to be processed, and σ2 is the estimator of the variance of the neural wideband signal part.
- The remaining wavelet coefficients are then used to reconstruct the independent components s1, which are predominantly neural signals. Steps 3 to 6 are repeated for all independent components.
- We then construct the wICA-cleaned EEG using the demixing matrix and the independent components:
3. Feature Extraction
4. Results
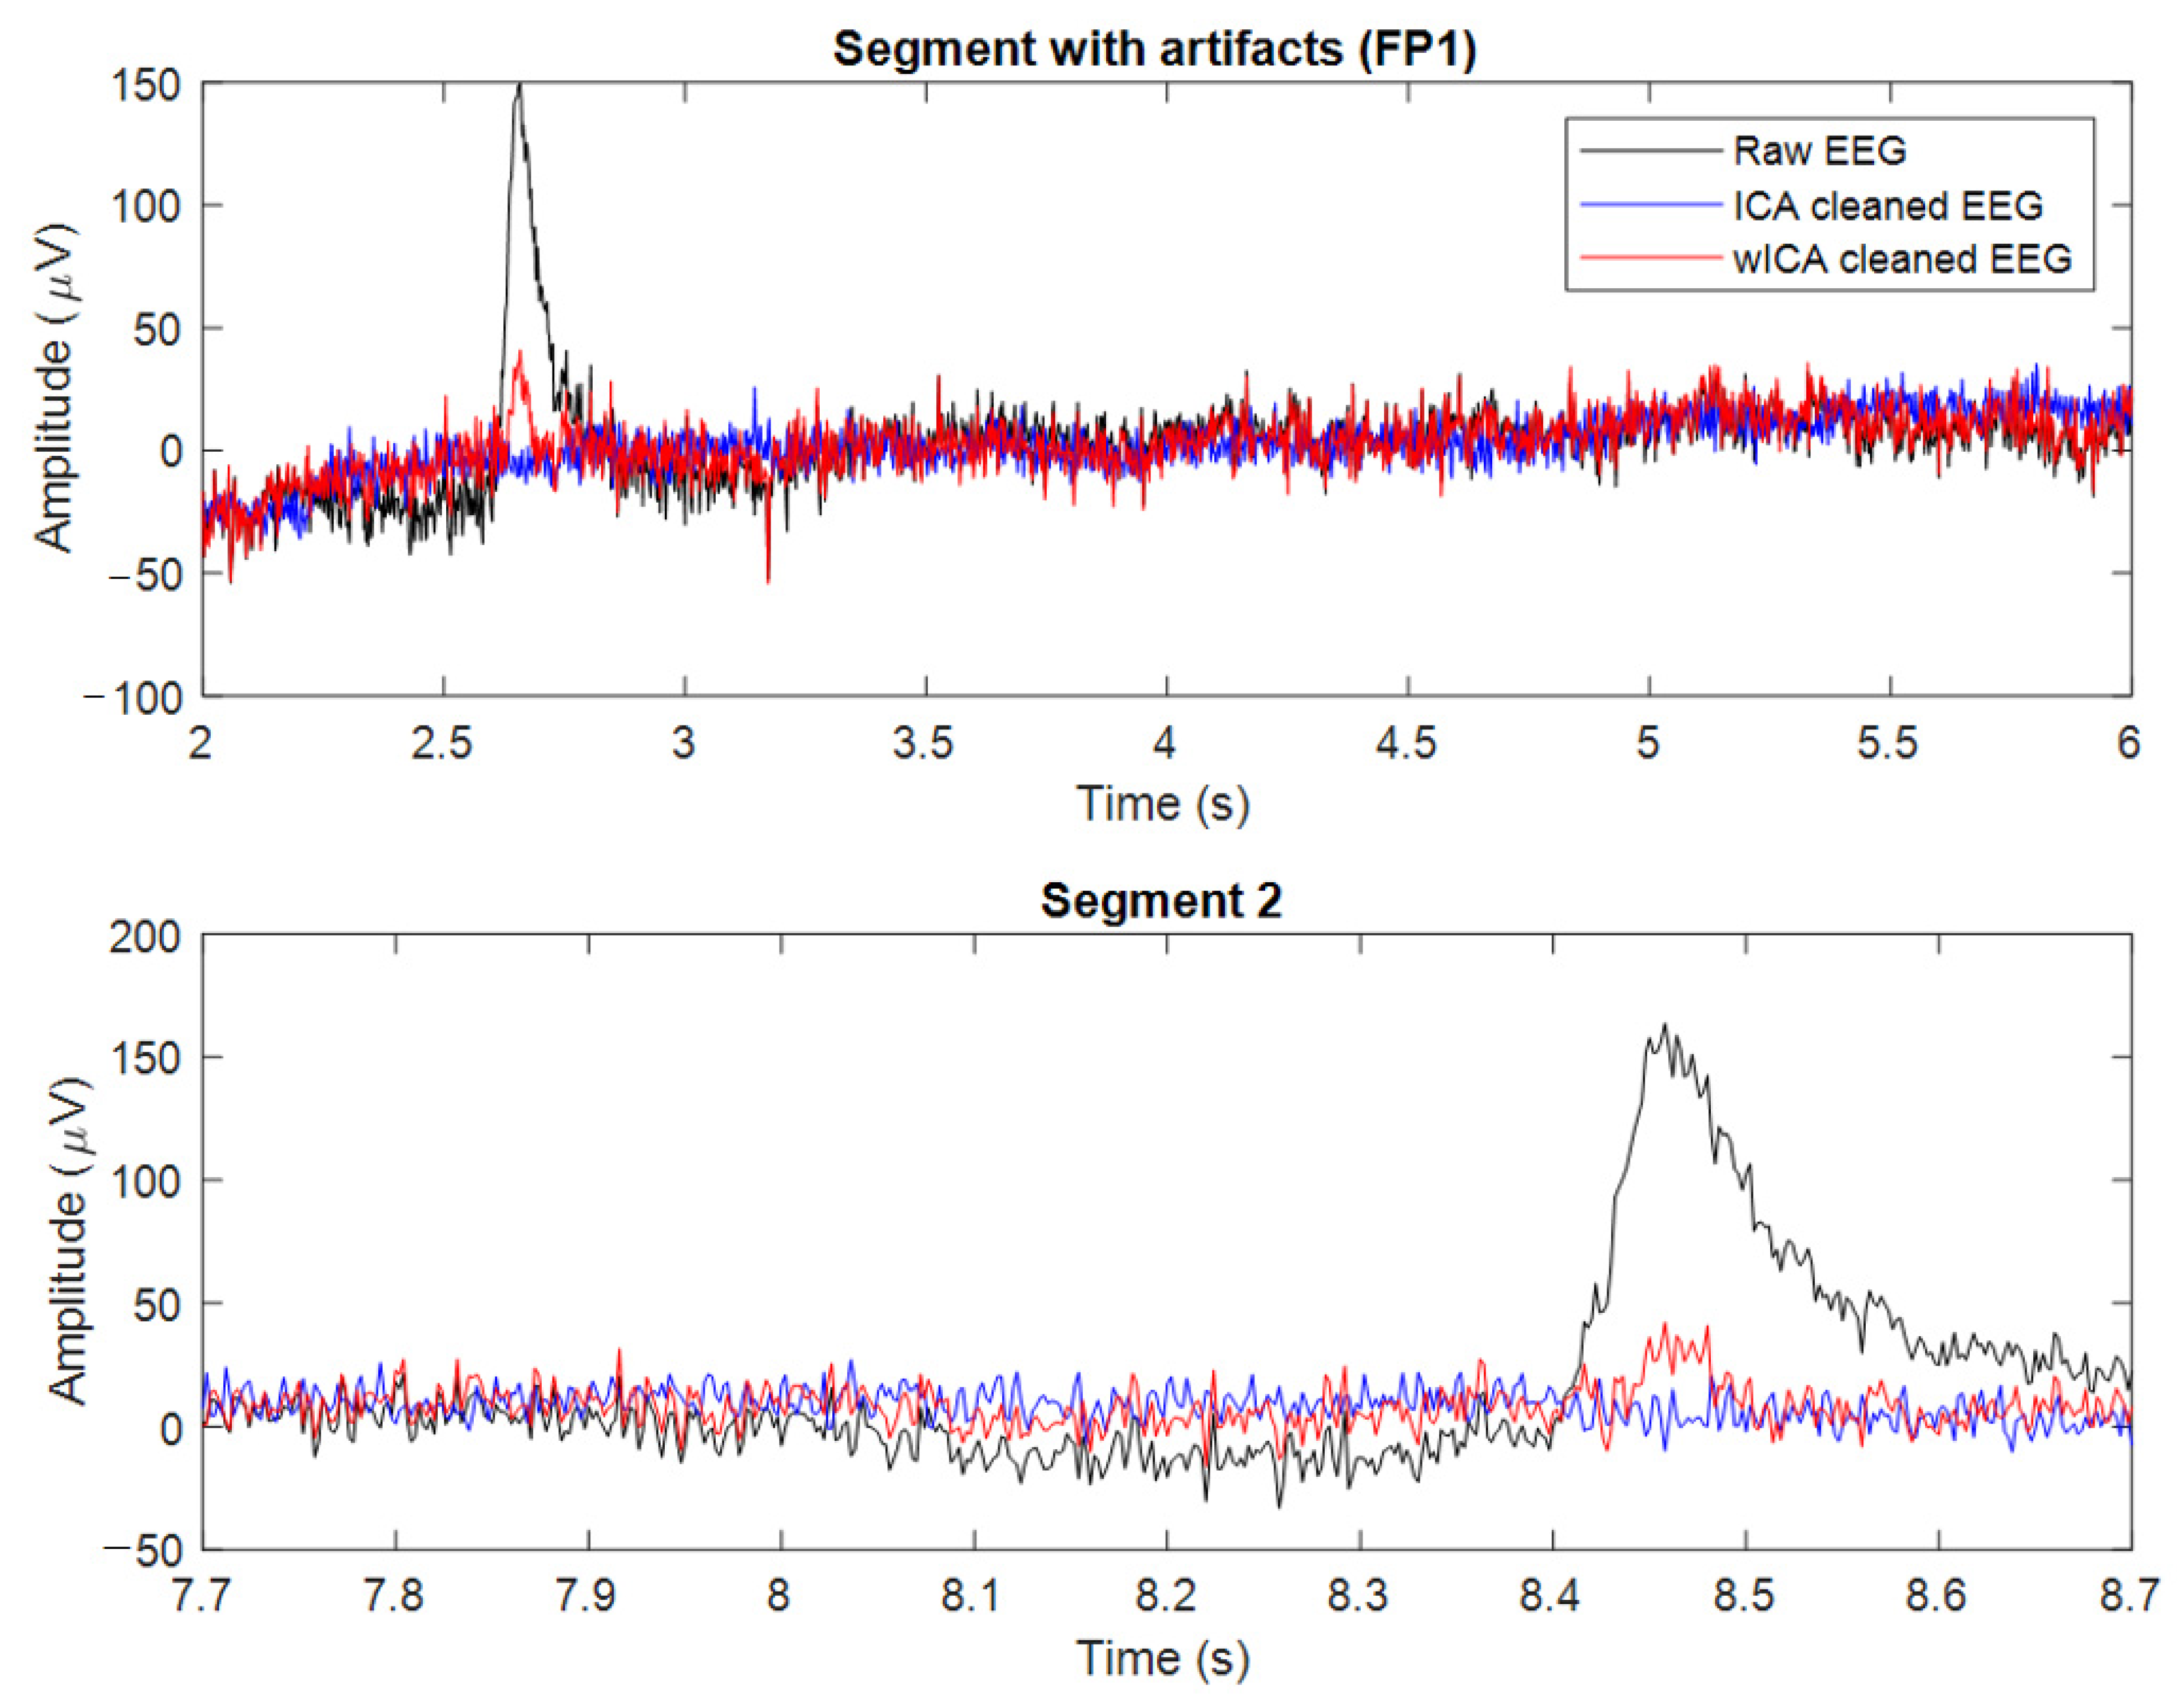
4.1. Artifact Removal and PSD
4.2. PSD
4.3. Classification
5. Discussion
6. Conclusions
Author Contributions
Funding
Institutional Review Board Statement
Informed Consent Statement
Data Availability Statement
Acknowledgments
Conflicts of Interest
References
- McIntire, L.K.; McKinley, R.A.; Goodyear, C.; McIntire, J.P. Detection of vigilance performance using eye blinks. Aviat. Sp. Environ. Med. 2013, 45, 354–362. [Google Scholar] [CrossRef] [PubMed]
- Warm, J.S.; Parasuraman, R.; Matthews, G. Vigilance Requires Hard Mental Work and Is Stressful. Hum. Factors J. Hum. Factors Ergon. Soc. 2008, 50, 433–441. [Google Scholar] [CrossRef] [PubMed]
- Al-Shargie, F.; Tariq, U.; Mir, H.; Alawar, H.; Babiloni, F.; Al-Nashash, H. Vigilance Decrement and Enhancement Techniques: A Review. Brain Sci. 2019, 9, 178. [Google Scholar] [CrossRef] [PubMed] [Green Version]
- Katmah, R.; Al-Shargie, F.; Tariq, U.; Babiloni, F.; Al-Mughairbi, F.; Al-Nashash, H. A Review on Mental Stress Assessment Methods Using EEG Signals. Sensors 2021, 21, 5043. [Google Scholar] [CrossRef]
- Al-Shargie, F.; Tang, T.B.; Kiguchi, M. Mental stress grading based on fNIRS signals. In Proceedings of the 2016 38th Annual International Conference of the IEEE Engineering in Medicine and Biology Society (EMBC), Orlando, FL, USA, 16–20 August 2016; pp. 5140–5143. [Google Scholar] [CrossRef]
- Pattyn, N.; Neyt, X.; Henderickx, D.; Soetens, E. Psychophysiological investigation of vigilance decrement: Boredom or cognitive fatigue? Physiol. Behav. 2008, 93, 369–378. [Google Scholar] [CrossRef]
- Lang, E.W.; Tomé, A.M.; Keck, I.R.; Górriz-Sáez, J.M.; Puntonet, C.G. Brain connectivity analysis: A short survey. Comput. Intell. Neurosci. 2012, 2012. [Google Scholar] [CrossRef]
- Debie, E.; Rojas, R.F.; Fidock, J.; Barlow, M.; Kasmarik, K.; Anavatti, S.; Garratt, M.; Abbass, H.A. Multimodal Fusion for Objective Assessment of Cognitive Workload: A Review. IEEE Trans. Cybern. 2019, 51, 1542–1555. [Google Scholar] [CrossRef]
- Henelius, A.; Sallinen, M.; Huotilainen, M.; Müller, K.; Virkkala, J.; Puolamäki, K. Heart Rate Variability for Evaluating Vigilant Attention in Partial Chronic Sleep Restriction. Sleep 2014, 37, 1257–1267. [Google Scholar] [CrossRef] [Green Version]
- Sauter, C.; Danker-Hopfe, H.; Loretz, E.; Zeitlhofer, J.; Geisler, P.; Popp, R. The assessment of vigilance: Normative data on the Siesta sustained attention test. Sleep Med. 2013, 14, 542–548. [Google Scholar] [CrossRef]
- Akin, M.; Kurt, M.B.; Sezgin, N.; Bayram, M. Estimating vigilance level by using EEG and EMG signals. Neural Comput. Appl. 2007, 17, 227–236. [Google Scholar] [CrossRef]
- Mavros, P.; Austwick, M.Z.; Smith, A.H. Geo-EEG: Towards the Use of EEG in the Study of Urban Behaviour. Appl. Spat. Anal. Policy 2016, 9, 191–212. [Google Scholar] [CrossRef] [Green Version]
- Banerjee, S.; Frey, H.-P.; Molholm, S.; Foxe, J.J. Interests shape how adolescents pay attention: The interaction of motivation and top-down attentional processes in biasing sensory activations to anticipated events. Eur. J. Neurosci. 2014, 41, 818–834. [Google Scholar] [CrossRef] [PubMed]
- Zarjam, P.; Epps, J.; Lovell, N. Beyond Subjective Self-Rating: EEG Signal Classification of Cognitive Workload. IEEE Trans. Auton. Ment. Dev. 2015, 7, 301–310. [Google Scholar] [CrossRef]
- Zhang, X.; Li, J.; Liu, Y.; Zhang, Z.; Wang, Z.; Luo, D.; Zhou, X.; Zhu, M.; Salman, W.; Hu, G.; et al. Design of a Fatigue Detection System for High-Speed Trains Based on Driver Vigilance Using a Wireless Wearable EEG. Sensors 2017, 17, 486. [Google Scholar] [CrossRef] [Green Version]
- Radüntz, T.; Scouten, J.; Hochmuth, O.; Meffert, B. Automated EEG artifact elimination by applying machine learning algorithms to ICA-based features. J. Neural Eng. 2017, 14, 046004. [Google Scholar] [CrossRef]
- Wang, H.; Lei, X.; Zhan, Z.; Yao, L.; Wu, X. A New fMRI Informed Mixed-Norm Constrained Algorithm for EEG Source Localization. IEEE Access 2018, 6, 8258–8269. [Google Scholar] [CrossRef]
- Jiang, X.; Bian, G.-B.; Tian, Z. Removal of Artifacts from EEG Signals: A Review. Sensors 2019, 19, 987. [Google Scholar] [CrossRef] [Green Version]
- Scott, A.; Courtney, W.; Wood, D.; De la Garza, R.; Lane, S.; Wang, R.; King, M.; Roberts, J.; Turner, J.A.; Calhoun, V.D. Coins: An innovative informatics and neuroimaging tool suite built for large heterogeneous datasets. Front. Neuroinform. 2011, 5, 33. [Google Scholar] [CrossRef] [Green Version]
- Mouček, R.; Brůha, P.; Jezek, P.; Mautner, P.; Novotny, J.; Papez, V.; Prokop, T.; Řondík, T.; Štěbeták, J.; Vareka, L. Software and hardware infrastructure for research in electrophysiology. Front. Neuroinform. 2014, 8, 20. [Google Scholar]
- Rejer, I.; Górski, P. Independent Component Analysis for EEG data preprocessing-algorithms comparison. In Proceedings of the 12th IFIP TC8 International Conference, CISIM 2013, Krakow, Poland, 25–27 September 2013; Springer: Berline/Heidelberg, Germany, 2013; pp. 108–119. [Google Scholar]
- Delorme, A.; Makeig, S. EEGLAB: An Open Source Toolbox for Analysis of Single-Trial EEG Dynamics Including Independent Component Analysis. J. Neurosci. Methods 2004, 134, 9–21. [Google Scholar] [CrossRef] [Green Version]
- Mognon, A.; Jovicich, J.; Bruzzone, L.; Buiatti, M. ADJUST: An automatic EEG artifact detector based on the joint use of spatial and temporal features. Psychophysiol. 2011, 48, 229–240. [Google Scholar] [CrossRef] [PubMed]
- Nolan, H.; Whelan, R.; Reilly, R.B. FASTER: Fully Automated Statistical Thresholding for EEG artifact Rejection. J. Neurosci. Methods 2010, 192, 152–162. [Google Scholar] [CrossRef] [PubMed]
- Bigdely-Shamlo, N.; Mullen, T.; Kothe, C.; Su, K.M.; Robbins, K.A. The PREP pipeline: Standardized preprocessing for large-scale EEG analysis. Front. Neuroinform. 2015, 9, 16. [Google Scholar] [CrossRef] [PubMed]
- Azzerboni, B.; Carpentieri, M.; La Foresta, F.; Morabito, F. Neural-ICA and wavelet transform for artifacts removal in surface EMG. In Proceedings of the 2004 IEEE International Joint Conference on Neural Networks (IEEE Cat. No.04CH37541), Budapest, Hungary, 25–29 July 2004; Volume 4, pp. 3223–3228. [Google Scholar] [CrossRef]
- Kalayci, T.; Ozdamar, O. Wavelet preprocessing for automated neural network detection of EEG spikes. IEEE Eng. Med. Biol. Mag. 1995, 14, 160–166. [Google Scholar] [CrossRef]
- Farha, N.A.; Al-Shargie, F.; Tariq, U.; Al-Nashash, H. Artifact Removal of Eye Tracking Data for the Assessment of Cognitive Vigilance Levels. In Proceedings of the 2021 IEEE Sixth International Conference on Advances in Biomedical Engineering (ICABME), Wardaniyeh, Lebanon, 7–9 October 2021; pp. 175–179. [Google Scholar]
- Alex, M.; Tariq, U.; Al-Shargie, F.; Mir, H.S.; Al Nashash, H. Discrimination of Genuine and Acted Emotional Expressions Using EEG Signal and Machine Learning. IEEE Access 2020, 8, 191080–191089. [Google Scholar] [CrossRef]
- Pedroni, A.; Bahreini, A.; Langer, N. Automagic: Standardized preprocessing of big EEG data. NeuroImage 2019, 200, 460–473. [Google Scholar] [CrossRef] [Green Version]
- Al-Shargie, F.; Tariq, U.; Hassanin, O.; Mir, H.; Babiloni, F.; Al-Nashash, H. Brain Connectivity Analysis Under Semantic Vigilance and Enhanced Mental States. Brain Sci. 2019, 9, 363. [Google Scholar] [CrossRef] [Green Version]
- Brandt, R.; Herrero, D.; Massetti, T.; Crocetta, T.B.; Guarnieri, R.; Monteiro, C.B.D.M.; Viana, M.D.S.; Bevilacqua, G.; de Abreu, L.C.; Andrade, A. The Brunel Mood Scale Rating in Mental Health for Physically Active and Apparently Healthy Populations. Health 2016, 8, 125–132. [Google Scholar] [CrossRef] [Green Version]
- Akay, M. Wavelets, Wavelet Packets, and Matching Pursuits with Biomedical Applications. Aviat. Sp. Environ. Med. 1998, 1, 209–210. [Google Scholar] [CrossRef]
- Davies, M.; James, C. Source separation using single channel ICA. Signal Process. 2007, 87, 1819–1832. [Google Scholar] [CrossRef]
- Chen, B.; Chen, Z.-W.; Wang, G.-J.; Xie, W.-P. Damage Detection on Sudden Stiffness Reduction Based on Discrete Wavelet Transform. Sci. World J. 2014, 2014, 807620. [Google Scholar] [CrossRef] [PubMed]
- Aydemir, Ö.; Kayikçioğlu, T. Investigation of the most appropriate mother wavelet for characterizing imaginary EEG signals used in BCI systems. Turkish J. Electr. Eng. Comput. Sci. 2016, 24, 38–49. [Google Scholar] [CrossRef]
- Bodala, I.P.; Li, J.; Thakor, N.V.; Al-Nashash, H. EEG and Eye Tracking Demonstrate Vigilance Enhancement with Challenge Integration. Front. Hum. Neurosci. 2016, 10, 273. [Google Scholar] [CrossRef] [PubMed] [Green Version]
- Yu, K.; Prasad, I.; Mir, H.; Thakor, N.; Al-Nashash, H. Cognitive workload modulation through degraded visual stimuli: A single-trial EEG study. J. Neural Eng. 2015, 12, 046020. [Google Scholar] [CrossRef] [Green Version]
- Castellanos, N.; Makarov, V.A. Recovering EEG brain signals: Artifact suppression with wavelet enhanced independent component analysis. J. Neurosci. Methods 2006, 158, 300–312. [Google Scholar] [CrossRef]
- Lepik, Ü. Application of the Haar wavelet transform to solving integral and differential equations. Proc. Est. Acad. Sci. Physics Math. 2007, 56, 28–46. [Google Scholar] [CrossRef]
- Tomar, D.; Agarwal, S. A survey on Data Mining approaches for Healthcare. Int. J. Bio-Sci. Bio-Technol. 2013, 5, 241–266. [Google Scholar] [CrossRef]
- Jacobson, S.; Marcus, E.M. Neuroanatomy for the Neuroscientist; Springer Science + Business Media, LLC: New York, NY, USA, 2008; ISBN 978-0-387-70970-3. [Google Scholar]
- Al-shargie, F.; Hassanin, O.; Tariq, U.; Al-Nashash, H. EEG-Based Semantic Vigilance Level Classification using Directed Connectivity Patterns and Graph Theory Analysis. IEEE Access 2020, 8, 115941–115956. [Google Scholar] [CrossRef]
- Charbonnier, S.; Caplier, A. Monitoring Drowsiness Online Using a Single Encephalographic Channel. Biomed. Eng. 2009, 145–164. [Google Scholar] [CrossRef] [Green Version]
- Strijkstra, A.M.; Beersma, D.G.; Drayer, B.; Halbesma, N.; Daan, S. Subjective sleepiness correlates negatively with global alpha (8–12 Hz) and positively with central frontal theta (4–8 Hz) frequencies in the human resting awake electroencephalogram. Neurosci. Lett. 2003, 340, 17–20. [Google Scholar] [CrossRef]
- Leger, D.; Philip, P.; Jarriault, P.; Metlaine, A.; Choudat, D. Erratum: Effects of a combination of napping and bright light pulses on shift workers’ sleepiness at the wheel: A pilot study. J. Sleep Res. 2009, 18, 472–479. [Google Scholar] [CrossRef] [PubMed]
- Wright, N.; Powell, D.; McGown, A.; Broadbent, E.; Loft, P. Avoiding involuntary sleep during civil air operations: Validation of a wrist-worn alertness device. Aviat. Space Environ. Med. 2005, 76, 847–856. [Google Scholar] [PubMed]
- Picot, A.; Charbonnier, S.; Caplier, A. Online automatic detection of driver drowsiness using a single electroencephalographic channel. In Proceedings of the 2008 30th Annual International Conference of the IEEE Engineering in Medicine and Biology Society, Vancouver, BC, Canada, 20–25 August 2008; pp. 3864–3867. [Google Scholar] [CrossRef] [Green Version]
- Pal, N.R.; Chuang, C.; Ko, L.; Chao, C. EEG-Based Subject- and Session-independent Drowsiness Detection: An Detection: An Unsupervised Approach. EURASIP J. Adv. Signal Process. 2008, 2008, 519480. [Google Scholar] [CrossRef] [Green Version]
- Papadelis, C.; Chen, Z.; Kourtidou-Papadeli, C.; Bamidis, P.; Chouvarda, I.; Bekiaris, E.; Maglaveras, N. Monitoring sleepiness with on-board electrophysiological recordings for preventing sleep-deprived traffic accidents. Clin. Neurophysiol. 2007, 118, 1906–1922. [Google Scholar] [CrossRef]
- Papadelis, C.; Kourtidou-Papadeli, C.; Bamidis, P.D.; Chouvarda, I.; Koufogiannis, D.; Bekiaris, E.; Maglaveras, N. Indicators of Sleepiness in an ambulatory EEG study of night driving. In Proceedings of the 2006 International Conference of the IEEE Engineering in Medicine and Biology Society, New York, NY, USA, 30 August–3 September 2006; pp. 6201–6204. [Google Scholar]
- Jap, B.T.; Lal, S.; Fischer, P. Inter-hemispheric electroencephalography coherence analysis: Assessing brain activity during monotonous driving. Int. J. Psychophysiol. 2010, 76, 169–173. [Google Scholar] [CrossRef] [Green Version]
- Tremmel, C.; Herff, C.; Sato, T.; Rechowicz, K.; Yamani, Y.; Krusienski, D.J. Estimating Cognitive Workload in an Interactive Virtual Reality Environment Using EEG. Front. Hum. Neurosci. 2019, 13, 401. [Google Scholar] [CrossRef]
- Shi, L.-C.; Lu, B.-L. EEG-based vigilance estimation using extreme learning machines. Neurocomputing 2012, 102, 135–143. [Google Scholar] [CrossRef]
- Hamaneh, M.B.; Chitravas, N.; Kaiboriboon, K.; Lhatoo, S.D.; Loparo, K. Automated Removal of EKG Artifact from EEG Data Using Independent Component Analysis and Continuous Wavelet Transformation. IEEE Trans. Biomed. Eng. 2013, 61, 1634–1641. [Google Scholar] [CrossRef]
- Stone, J.V. Independent component analysis: An introduction. Trends Cogn. Sci. 2002, 6, 59–64. [Google Scholar] [CrossRef]
- Tong, S.; Bezerianos, A.; Paul, J.; Zhu, Y.; Thakor, N. Removal of ECG interference from the EEG recordings in small animals using independent component analysis. J. Neurosci. Methods 2001, 108, 11–17. [Google Scholar] [CrossRef]
- Wallstrom, G.L.; Kass, R.E.; Miller, A.; Cohn, J.F.; Fox, N.A. Automatic correction of ocular artifacts in the EEG: A comparison of regression-based and component-based methods*1. Radiother. Oncol. 2004, 53, 105–119. [Google Scholar] [CrossRef]
- Akhtar, M.T.; Mitsuhashi, W.; James, C.J. Employing spatially constrained ICA and wavelet denoising, for automatic removal of artifacts from multichannel EEG data. Signal Process. 2012, 92, 401–416. [Google Scholar] [CrossRef]
- Djuwari, D.; Kumar, D.; Palaniswami, M. Limitations of ICA for Artefact Removal. In Proceedings of the 2005 IEEE Engineering in Medicine and Biology 27th Annual Conference, Shanghai, China, 17–18 January 2006; Volume 5, pp. 4685–4688. [Google Scholar] [CrossRef] [Green Version]
- Pontifex, M.B.; Gwizdala, K.; Parks, A.C.; Billinger, M.; Brunner, C. Variability of ICA decomposition may impact EEG signals when used to remove eyeblink artifacts. Psychophysiology 2017, 54, 386–398. [Google Scholar] [CrossRef] [PubMed] [Green Version]
- Delorme, A.; Sejnowski, T.; Makeig, S. Enhanced detection of artifacts in EEG data using higher-order statistics and independent component analysis. Neuroimage 2010, 34, 1443–1449. [Google Scholar] [CrossRef] [PubMed] [Green Version]
- Han, L.; Li, C.W.; Guo, S.L.; Su, X.W. Feature extraction method of bearing AE signal based on improved FAST-ICA and wavelet packet energy. Mech. Syst. Signal Process. 2015, 62, 91–99. [Google Scholar] [CrossRef]
- Ren, X.; Hu, X.; Wang, Z.; Yan, Z. MUAP extraction and classification based on wavelet transform and ICA for EMG decomposition. Med Biol. Eng. Comput. 2006, 44, 371–382. [Google Scholar] [CrossRef]
- Bang, J.W.; Choi, J.-S.; Park, K.R. Noise Reduction in Brainwaves by Using Both EEG Signals and Frontal Viewing Camera Images. Sensors 2013, 13, 6272–6294. [Google Scholar] [CrossRef] [Green Version]

| Band | Delta | Theta | Alpha | Beta | |
|---|---|---|---|---|---|
| Classifier | |||||
| Accuracy | |||||
| SVM | 95.4 ± 1.8 | 96.4 ± 1.7 | 96.0 ± 2.5 | 97.5 ± 1.8 | |
| KNN | 91.6 ± 3.4 | 91.7 ± 3.4 | 89.3 ± 5.3 | 92 ± 5.6 | |
| DT | 84.0 ± 5.7 | 85.5 ± 5.5 | 84.8 ± 4.6 | 88.7 ± 6.6 | |
| DA | 99.3 ± 0.2 | 99.5 ± 0.4 | 99.5 ± 0.4 | 99.4 ± 0.3 | |
| NB | 80.0 ± 5.7 | 82.3 ± 6.6 | 82.6 ± 7.6 | 87.3 ± 7.3 | |
| Specificity | |||||
| SVM | 94.5 ± 2.4 | 95.5 ± 2.0 | 96.6 ± 2.4 | 97.0 ± 2.5 | |
| KNN | 91.8 ± 4.1 | 93 ± 3.2 | 91.5 ± 5.6 | 92.1 ± 7.2 | |
| DT | 85.0 ± 5.6 | 85.4 ± 4.7 | 83.6 ± 4.9 | 88.7 ± 6.4 | |
| DA | 99.3 ± 0.5 | 99.4 ± 0.7 | 99.5 ± 0.5 | 99.5 ± 0.3 | |
| NB | 79.3 ± 4.1 | 83.7 ± 5.1 | 80.3 ± 11 | 87.9 ± 5.7 | |
| Sensitivity | |||||
| SVM | 96.3 ± 2.5 | 97.3 ± 2.1 | 95.5 ± 3.9 | 98.1 ± 1.4 | |
| KNN | 91.4 ± 5.1 | 90.5 ± 5.6 | 87.2 ± 7.4 | 92.2 ± 7.5 | |
| DT | 83.0 ± 5.6 | 85.5 ± 4.7 | 85.9 ± 4.8 | 88.7 ± 6.4 | |
| DA | 99.3 ± 0.3 | 99.6 ± 0.4 | 99.6 ± 0.4 | 99.4 ± 0.9 | |
| NB | 80.7 ± 9.5 | 81.8 ± 9.6 | 84.8 ± 7.7 | 86.7 ± 9.5 | |
| Band | Delta | Theta | Alpha | Beta | |
|---|---|---|---|---|---|
| Classifier | |||||
| Accuracy | |||||
| SVM | 96.1 ± 2.6 | 97.6 ± 0.8 | 97.0 ± 1.3 | 98.3 ± 0.8 | |
| KNN | 92.2 ± 4.8 | 92.1 ± 4.5 | 90.5 ± 3.8 | 95.4 ± 4.0 | |
| DT | 85.1 ± 7.4 | 86.4 ± 5.3 | 82.5 ± 6.2 | 89.2 ± 5.4 | |
| DA | 99.3 ± 0.2 | 99.4 ± 0.1 | 99.4 ± 0.2 | 99.3 ± 0.5 | |
| NB | 82 ± 6.8 | 85 ± 6.8 | 82.9 ± 8.5 | 89.3 ± 6.0 | |
| Specificity | |||||
| SVM | 95.8 ± 3 | 97 ± 1.7 | 97.2 ± 1.5 | 98.2 ± 0.8 | |
| KNN | 93.7 ± 5.5 | 93.9 ± 4.8 | 92.6 ± 4.2 | 96.2 ± 4.5 | |
| DT | 85.4 ± 7.1 | 87.2 ± 6.1 | 82.4 ± 6.5 | 89.3 ± 4.9 | |
| DA | 99.3 ± 0.2 | 99.5 ± 0.3 | 99.5 ± 0.3 | 99.6 ± 0.3 | |
| NB | 82.6 ± 8.6 | 85.3 ± 8.0 | 82.6 ± 12.5 | 91.6 ± 4.6 | |
| Sensitivity | |||||
| SVM | 96.4 ± 2.6 | 98.3 ± 0.6 | 96.9 ± 2.2 | 98.4 ± 1.4 | |
| KNN | 90.7 ± 5.7 | 90.4 ± 5.7 | 88.4 ± 5.1 | 94.5 ± 5.5 | |
| DT | 84.7 ± 8.1 | 85.7 ± 4.7 | 82.6 ± 6.6 | 89 ± 6.1 | |
| DA | 99.2 ± 0.4 | 99.3 ± 0.2 | 99.3 ± 0.2 | 99 ± 1.0 | |
| NB | 81.3 ± 8.1 | 84.7 ± 6.8 | 83.2 ± 9.6 | 87 ± 8.4 | |
| EEG Frequency Band | Delta | Theta | Alpha | Beta |
|---|---|---|---|---|
| wICA -SVM classification accuracy | 96.1 ± 2.6 | 97.6 ± 0.8 | 97 ± 1.3 | 98.3 ± 0.8 |
| Fast ICA-SVM classification accuracy | 95.4 ± 1.8 | 96.4 ± 1.7 | 96.0 ± 2.5 | 97.5 ± 1.8 |
| ICA-SVM classification accuracy [43] | 87.9 ± 9.5 | 82.8 ± 12.8 | 83.3 ± 13.4 | 96.9 ± 2.2 |
Publisher’s Note: MDPI stays neutral with regard to jurisdictional claims in published maps and institutional affiliations. |
© 2022 by the authors. Licensee MDPI, Basel, Switzerland. This article is an open access article distributed under the terms and conditions of the Creative Commons Attribution (CC BY) license (https://creativecommons.org/licenses/by/4.0/).
Share and Cite
Abu Farha, N.; Al-Shargie, F.; Tariq, U.; Al-Nashash, H. Improved Cognitive Vigilance Assessment after Artifact Reduction with Wavelet Independent Component Analysis. Sensors 2022, 22, 3051. https://doi.org/10.3390/s22083051
Abu Farha N, Al-Shargie F, Tariq U, Al-Nashash H. Improved Cognitive Vigilance Assessment after Artifact Reduction with Wavelet Independent Component Analysis. Sensors. 2022; 22(8):3051. https://doi.org/10.3390/s22083051
Chicago/Turabian StyleAbu Farha, Nadia, Fares Al-Shargie, Usman Tariq, and Hasan Al-Nashash. 2022. "Improved Cognitive Vigilance Assessment after Artifact Reduction with Wavelet Independent Component Analysis" Sensors 22, no. 8: 3051. https://doi.org/10.3390/s22083051
APA StyleAbu Farha, N., Al-Shargie, F., Tariq, U., & Al-Nashash, H. (2022). Improved Cognitive Vigilance Assessment after Artifact Reduction with Wavelet Independent Component Analysis. Sensors, 22(8), 3051. https://doi.org/10.3390/s22083051