
Optimal Design of a Synchronous Reluctance Motor Using a Genetic Topology Algorithm

1
Department of Electrical, Electronic and Computer Engineering, University of Ulsan, Ulsan 44610, Korea
2
R&D Division, Hyundai-Transys, Seosan 31930, Korea
3
Korea Railroad Research Institute, Uiwang 16105, Korea
*
Author to whom correspondence should be addressed.
Processes 2021, 9(10), 1778; https://doi.org/10.3390/pr9101778
Submission received: 26 August 2021
/
Revised: 29 September 2021
/
Accepted: 1 October 2021
/
Published: 5 October 2021
(This article belongs to the Special Issue Design, Concepts and Applications of Electric Machines)
Abstract
:The topology algorithm (TA) can effectively find an optimal solution by changing the material and shape of the design target without the limitation of design variables. In this paper, a genetic topology algorithm (GTA) is proposed for the design optimization of a synchronous reluctance motor (SynRM). By applying the stochastic algorithm (genetic algorithm (GA)) and the deterministic algorithm (ON-OFF method) to the design, the optimal shape can be found quickly and effectively. The GTA, which improves manufacturability by removing the aliasing that occurs in TA, was applied to the design of SynRM to search for the optimal model. After dividing the rotor into a reverse mesh grid, the optimal topology was searched for by GA and ON-OFF methods. Then, mechanical stability was verified through stress analysis, and additional performance improvement was obtained through the skew technique. The final design, which satisfies the minimum efficiency, required torque, and torque ripple was derived by applying the step-by-step design using GTA to the SynRM optimization.
1. Introduction
Since industrial motors are price-sensitive applications, relatively inexpensive and robust induction motors (IMs) are used [1,2,3]. However, the efficiency requirements (IE4, e.g., Super Premium Efficiency) for industrial motors are tightening, therefore, interest in synchronous reluctance motors (SynRMs), which have high efficiency and torque density compared to IMs, is growing [4,5,6]. The SynRMs that utilize reluctance torque are inexpensive and reliable because they do not contain permanent magnets, unlike IM motors. Furthermore, in terms of energy efficiency, SynRMs qualify as candidates to meet high efficiency standards, such as IE4, issued by the International Electrotechnical Commission. Unlike IMs, since the SynRMs do not have windings or squirrel cage conductor bars in the rotor, secondary copper loss does not occur, and losses are relatively low. In the same frame size, a SynRM is estimated to be reduced by 25% compared to the loss of IE3 IM [4,7]. The performance of an industrial electric motor is determined by its torque density and torque ripple.
High-performance electric motors such as SynRM have non-linear characteristics due to flux saturation in the core. Therefore, analysis should be performed using the finite element method (FEM). However, the FEM analysis requires a huge amount of computation. Many optimization techniques have been introduced to minimize the amount of computation [8,9]. There are stochastic and deterministic techniques for finding the optimal solution through an algorithm. The stochastic method searches for the optimal solution quickly and accurately, however, the final value convergence is slow. On the other hand, the deterministic method has excellent convergence in the single-goal search, but it has a disadvantage in that it cannot find the most optimal value in a region with several optimal points. Therefore, in the beginning, many optimization techniques were introduced that roughly found the global optimal value using a stochastic algorithm, and then the optimal value was identified with a deterministic algorithm [10,11].
Unlike other parametric algorithms, topology algorithms do not depend on design variables and can explore different geometries. This is useful for the optimal design of complex shapes which have design variables that are difficult to specify, and it has the advantage of being able to find unexpected optimal shapes. Although the topology algorithm increases the amount of computation exponentially according to the number of materials to be designed, it is appropriate to apply the topology algorithm because the rotor of SynRM, which does not use magnets, has only two materials, iron and air.
Because TAs are very effective when it comes to finding an optimal design, they have been widely used in SynRM optimization problems [12,13,14,15]. To apply stochastic and deterministic algorithms to a TA, genetic algorithm (GA) and ON-OFF methods were adopted. The GA is a method for solving optimization problems based on a natural selection process that mimics biological evolution. The ON-OFF method is an algorithm that changes the existing shape little by little, identifying which part causes an increase in the objective function and then changing the overall shape to obtain a better one. By applying GTA (genetic topology algorithm) with various techniques, including GA and ON-OFF, to the 15 kW class industrial SynRM design, a high-performance motor that satisfies the requirements was manufactured.
2. Design Method
Since air has a very small reluctance compared to iron, proper arrangement of air and iron produces different reluctances depending on the direction due to this magnetoresistance. In this state, if a magnetic field is applied from the outside, a torque is generated in the direction in which the magnetic resistance is minimized, and this causes the object to rotate. This is called reluctance torque and is expressed by the following formula [4,16,17].
where is the number of poles, is the flux linkage, is the current, is the reluctance, is the salient pole ratio, and θ is the current angle, respectively. Through this equation, the torque at a fixed voltage and operating speed increases as the salient pole ratio increases, and the maximum torque can be obtained by adjusting the current angle. Therefore, creating large salient ratios is very important in SynRM designs.
2.1. Preprocess
The GTA consists of four main processes. Firstly, preprocessing, including mesh grid generation and 2D encoding, are required to facilitate a geometric structure search with an automated code. Secondly, GA is applied to the target area that has undergone preprocessing to find an approximate optimal model. Next, the optimal shape can be effectively found by applying the ON-OFF method to the GA optimization result. Finally, the GTA improves manufacturability through a smoothing operation, verifies mechanical stability through stress analysis, and reduces torque ripple through a skew technique. The sequence of steps is summarized in Figure 1. As shown in Figure 1, the entire process of GTA consists of preprocessing, GA, ON-OFF method, and postprocessing, and detailed explanation of each process will be explained in the main body of the paper.
The target of optimization is the 15 kW class SynRM used for pumps, belts, etc. The performance of industrial electric motors is determined by torque density and torque ripple. The higher the torque density, the greater the output in a given volume, and the smaller the torque ripple, the lesser the vibration and noise. The minimum design requirements and parameters of the motor are shown in Table 1 and Table 2. The target area corresponds to 45º of the four-pole rotor, as shown in Figure 2. A line symmetry of the 45º model creates a 90º model that corresponds to one pole of the SynRM.
To apply TA, the design target area is divided into a grid mesh, as shown in Figure 3. Figure 3 (left) is the simplest mesh grid that can be implemented by dividing the radius and angle into equal parts. When the rotor shape is drawn on a mesh grid, as in Figure 3 (left), aliasing which looks like a staircase is created. Aliasing disrupts the d-axis flux flow, which reduces spherical polarity and ultimately degrades the performance of the motor. Therefore, to optimally design a SynRM rotor, aliasing must be mitigated. The simplest way to mitigate aliasing is to reduce the mesh grid spacing to create a finer mesh. However, if the mesh spacing is set narrower, the processing time of the TA increases exponentially. Figure 4 shows the results of analysis by flowing a current after inserting the whole core. In Figure 3 (left), there is a grating in the direction that interferes with this magnetic flux line; on the other hand, it can be confirmed that the grating shown in Figure 3 (right) is very similar to the magnetic flux line of Figure 4. By creating a grating through the outer concentric circles, the flux flow can be left undisturbed, and the salient pole ratio rises.
Since SynRM is a motor that generates torque using the salient pole ratio of the d-q axis, iron and air must be properly arranged to increase the output density. The multi-layered SynRM rotor has strengths in terms of torque and torque ripple [18,19,20,21]. To increase the accuracy and speed of TA convergence, a prefix layer was inserted into the mesh grid, as shown in Figure 5. These layers ensure minimum d-axis flux paths and avoid the creation of one large air layer during optimization.
Before starting the full-scale optimization process, a sample model was created to verify how effective the optimization results were. The prototype model is a model with three layers of circular air layers. The shape of the sample model and the magnetic flux density under the rated operating conditions are shown in Figure 6. The sample model had a torque of 86.71 Nm and a torque ripple of 116.54%.
2.2. Genetic Algorithm
The GA, an algorithm that mimics the evolution of living things in the natural world by adaptation to the environment, was first proposed by John Holland in 1975. Because the GA is convenient to implement and can find the optimal solution quickly and effectively, it has been applied to several optimization problems [22,23]. Based on natural selection, superior individuals leave offspring, while inferior individuals are culled. Describing the process in detail, superior parent genes are crossed to create offspring genes, and some mutations are added to improve search capabilities. Repeating this process, the entire gene converges in a more and more superior direction. Finally, when convergence that meets the termination condition occurs, the GA is terminated.
Binary coding is required to apply GA to rotor design. Through binary coding, a model with many cells can be expressed as a single binary code, and a rotor shape can be created by substituting the binary code into the model again [24]. The initial gene is generated using the following discrete equation.
where indicates the type of material corresponding to the cell, is a random number between 0 and 1, and is a material variable and controls the ratio of iron and air to be assigned. Since the SynRM rotor has an air layer inserted into the iron, the value was adjusted so that the iron part occupies more than the air part in the total area.
After creating the initial gene group, each gene is substituted into the rotor shape to obtain the objective function value through the FEM analysis. The objective function is based on the average torque, and the upper gene is preserved as an elite set to generate the next generation. When generating the next generation, random mutant genes are inserted to broaden the search range. A generation consists of N parental genes, M offspring genes, and K mutant genes. Figure 7a,b show the shape of the parent generation. In Figure 7c, the white cells and the dark gray cells are cells in which the materials of both parents are unified, and the material of the child solution is determined to be iron and air. It is an unfinished cell. These fields are randomly assigned a material by the material parameter. Figure 7d shows the next generation generated by this process.
As generations progressed, models with progressively higher average torque were derived. The average torque of the GA result model, as shown in Figure 8, is 61.19 Nm and the torque ripple is 94.93%. To meet the design requirements, the next optimization proceeds through the methods described below.
2.3. ON-OFF Method
The ON-OFF method is used to find features with higher torque that the results obtained from the GA. In the GA optimization model, since the FEM analysis should be repeated for each model in which each cell is inverted, the process takes considerable time. However, the ON-OFF method is an optimization technique that can find the optimal shape very effectively.
First, the expected gain of each cell is calculated. Figure 9a shows the initial model (GA model). In Figure 9a, one square represents one cell, which is the smallest unit that can change shape, gray represents the iron core while white represents air. in Figure 9a,b conveys the objective function value of the design. OF in Figure 9a means the objective function value of the initial model, while OF in Figure 9b denotes the objective function value when the cell (1, 1) is changed. In Figure 9b, the difference between the objective function values of the initial model and the model with the material of the cell highlighted in red (indicating that it has changed) is entered into the cell. Since the objective function value of the initial model is 10 and the objective function value of the changed model is 9, the expected value is −1. Figure 9c shows the result of obtaining the expected gain of all cells by repeating this process. The reason why it is called expected gain, not simply gain, is that the changed gain may be different if it is changed like other cells. Figure 9d shows cells with positive expected gains among all cells. Blue cells are cells with a small positive expected gain and purple cells are cells with a high expected gain when the material is changed. Reversing all cells with a positive expected gain causes excessive strain in the shape, as shown in Figure 9e, making the process of finding the optimal shape more difficult [25]. This is because, when many cells are changed at once, cells with positive expected gains may have a rather negative effect. Figure 9f can be obtained by inverting only the cell with high expected gain.
As the same process is repeated, the shape is gradually updated. Table 3 shows the results of the above process. Figure 10 shows the shape when the ON-OFF method is applied once, and the shape after repeating four times. Initially, the magnetic flux saturation on the rotor side is excessive, but as the ON-OFF method is repeatedly applied, the magnetic flux saturation on the rotor side changes relatively uniformly.
In Figure 10b, the average torque is 88.87 Nm, and the torque ripple is 22.59%. The average torque requirement is satisfied, but the torque ripple is still high. In addition, there is a problem in that the aliasing remains in the shape of the rotor, so that the manufacturability is poor and the manufacturing cost is increased. Therefore, it is necessary to reduce torque ripple and improve manufacturability through appropriate post-processing.
3. Postprocess
3.1. Smoothing
The SynRM model that utilizes the ON-OFF method should remove aliasing through the smoothing technique. The smoothing technique is an operation to increase manufacturability while maintaining the optimized shape of the rotor to the greatest extent possible by leveling the interface of the material. By applying the smoothing method to the rotor, additional torque can be realized and torque ripple reduction can be obtained.
Figure 11 shows how to apply the smoothing technique. A line is drawn to remove aliasing at the boundary between the two materials. In the event of the area changing from air to iron and from iron to air, the boundary is set so that the magnetic flux flow is as smooth as possible. Figure 12 shows the magnetic flux density applied with the smoothing method. The manufacturing difficulty was lowered through the smoothing technique, and the operating characteristics were also improved by increasing the average torque by 0.1 Nm and reducing the torque ripple by 2.01%.
3.2. Stress Analysis
When the rotor rotates, centrifugal force acts, and if the rotor has a weak structure, the motor may be destroyed. Since the SynRM is a motor made up of only a steel core, it has superior structural stability compared to motors with other inserted magnets. Nevertheless, since the optimal design, such as minimizing the bridge, has been made, stability problems may occur during high-speed operation. To solve this problem, stress analysis was performed to verify structural stability.
As a result of the stress analysis at the maximum speed of 5400 RPM (Rated/maximum speed), the maximum stress of the optimized model was 367 MPa, with a corresponding safety factor of 1.13, and sufficient mechanical stability was not secured. To solve the mechanical instability concern, a central column was included for radial support to reduce the mechanical burden on the bridge part. As a result of the improved design, the maximum stress was 294 MPa, which secured a safety factor of 1.41 and stability during high-speed operation. Figure 13 shows the stress analysis results before and after application. In Figure 13a, the maximum stress point of the bridge is marked in red. In Figure 13b, it was confirmed that the central column indicated in yellow withstands most of the mechanical stress and is mechanically safe.
3.3. Skew
The torque ripple of the model with the center post inserted for mechanical stability is quite high at 22.13%. Torque ripple causes vibration and noise problems, so it should be reduced as much as possible. A representative technique for torque ripple reduction is skew. To apply the skew technique to the motor rotor, the overall stack length is divided into several layers, and then each layer is slightly twisted at different angles. Although some torque loss occurs compared to the conventional rotor, the torque characteristics of the twisted rotors cancel each other out to reduce the total torque ripple [26]. Figure 14 shows how the skew technique is applied and Figure 15 shows the torque result graph. The torque was reduced from 87.87 Nm to 81.45 Nm by applying the skew and dividing it into three layers, while maintaining the design requirements. The torque ripple was reduced by more than half, from 22.13% to 11.01%. Table 4 shows the change in motor performance according to the overall optimization process. The final model reduced torque by 6.1% compared to the initial sample model, but it meets the required torque conditions, and the torque ripple is reduced by 90.6%.
4. Conclusions
In this paper, GTA was applied to the industrial IE4 SynRM optimal design problem, and a high-performance rotor that satisfies the requirements was designed. The GTA can effectively solve the problem of optimal design of electronic devices by combining the stochastic optimization method (GA) and the deterministic optimization method (ON-OFF method), while maintaining the advantages of the existing TA. Through the reverse mesh grid, it was possible to search for a shape more suitable for magnetic flux flow that is more efficient than the existing mesh grid. Further, after optimizing the topology, the smoothing technique was applied to increase manufacturability and obtain additional property improvement. The superior performance of the GTA was confirmed by step-by-step improved torque magnitude, reduced torque ripple, and mechanical stability. The final model achieved the design goals with a torque of 81.45 Nm, a torque ripple of 11.01%, a loss of 601.8 W, an efficiency of 96.23%, and a safety factor of 1.13. The GTA can be used to solve various design problems to which parameter optimization algorithms are difficult to apply. Based on these advantages, the proposed GTA is expected to be widely used in contexts of optimal motor design in which various performance factors need to be considered.
Author Contributions
Investigation, T.-H.L.; writing—original draft preparation, T.-H.L.; writing—review and editing, J.-H.L., K.-P.Y. and D.-K.L. All authors have read and agreed to the published version of the manuscript.
Funding
This research received no external funding.
Acknowledgments
This research was supported by a grant from the R&DProgram of the Korea Railroad Research Institute, Republic of Korea.
Conflicts of Interest
The authors declare no conflict of interest.
References
- De Martin, M.; Luise, F.; Pieri, S.; Tessarolo, A.; Poloni, C. Numerical multi-objective optimization of a squirrel cage induction motor for industrial application. In Proceedings of the 2015 International Aegean Conference on Electrical Machines & Power Electronics (ACEMP), Side, Turkey, 2–4 September 2015. [Google Scholar]
- Li, H.; Curiac, R.S. Designing More Efficient Large Industrial Induction Motors by Utilizing the Advantages of Adjustable-Speed Drives. IEEE Trans. Ind. Appl. 2010, 46, 1805–1809. [Google Scholar] [CrossRef]
- Staton, D.; Boglietti, A.; Cavagnino, A. Solving the More Difficult Aspects of Electric Motor Thermal Analysis in Small and Medium Size Industrial Induction Motors. IEEE Trans. Energy Convers. 2005, 20, 3. [Google Scholar] [CrossRef] [Green Version]
- Jeong, S.-W. Optimal Design of IE4 Super Premium Efficiency Synchronous Reluctance Motor for Industrial Application. Master’s Thesis, Department Electrical and Information Engineering, Seoul University, Seoul, Korea, 2020. [Google Scholar]
- Park, J.H.; Seo, J.H.; Cha, C.-H.; Lee, J. Characteristics Analysis of 15kW Industrial Machine using Synchronous Reluctance Motor for High Efficiency. In Proceedings of the 2013 International Conference on Electrical Machines and Systems (ICEMS), Piscataway, NJ, USA, 26–29 October 2013. [Google Scholar]
- Weigel, T. Control of Synchronous Reluctance Motors without Encoder for Industrial Applications. In Proceedings of the 2016 6th International Electric Drives Production Conference, Nuremberg, Germany, 30 November–1 December 2016. [Google Scholar]
- ABB. High Output Synchronous Reluctance Motor and Drive Package. Optimized Cost of Ownership for Pump and Fan Applications; ABB: Zurich, Switzerland, 2013. [Google Scholar]
- Lopez, C.; Michalski, T.; Espinosa, A.; Romeral, L. Rotor of Synchronous Reluctance Motor Optimization by Means Reluctance Network and Genetic Algorithm. In Proceedings of the 2016 XXII International Conference on Electrical Machines (ICEM), Laussane, Switzerland, 4–7 September 2016. [Google Scholar]
- Cupertino, F.; Pellegrino, G.; Gerada, C. Design of Synchronous Reluctance Motors with Multi-objective Optimization Algorithms. IEEE Trans. Ind. Appl. 2014, 50, 6. [Google Scholar] [CrossRef] [Green Version]
- Kang, Y.-R.; Son, J.-C.; Lim, D.-K. Optimal Design of IPMSM for Fuel Cell Electric Vehicles Using Autotuning Elliptical Niching Genetic Algorithm. IEEE Access 2020, 8, 117405–117412. [Google Scholar] [CrossRef]
- Lee, T.H.; Kang, Y.R.; Son, J.C.; Lim, D.K. Optimized Design of Permanent Magnet Assisted Synchronous Reluctance Motor Using Oriented Auto-tuning Niching Algorithm. J. Electr. Eng. Technol 2021, 16, 1495–1503. [Google Scholar] [CrossRef]
- Okamoto, Y.; Hoshino, R.; Wakao, S.; Tsuburaya, T. Improvement of Torque Characteristics for a Synchronous Reluctance Motor Using MMA-based Topology Optimization Method. IEEE Trans. Magn. 2017, 54, 1–4. [Google Scholar] [CrossRef]
- Otomo, Y.; Igarashi, H. Topology Optimization Using Gabor Filter: Application to Synchronous Reluctance Motor. IEEE Trans. Magn. 2021, 57, 6. [Google Scholar] [CrossRef]
- Sato, S.; Sato, T.; Igarashi, H. Topology Optimization of Synchronous Reluctance Motor Using Normalized Gaussian Network. IEEE Trans. Magn. 2015, 51, 3. [Google Scholar] [CrossRef] [Green Version]
- Hidaka, Y.; Igarashi, H. Topology Optimization of Synchronous Reluctance Motors Considering Localized Magnetic Degradation Caused by Punching. IEEE Trans. Magn. 2017, 53, 6. [Google Scholar] [CrossRef]
- Lipo, T.A.; Miller, T.J.; Vagati, A.; Boldea, I.; Malesani, L.; Fukao, T. Synchronous Reluctance Drives. In Proceedings of the IEEE IAS Annual Meeting, Denver, CO, USA, 2–6 October 1994. [Google Scholar]
- Vagati, A. The Synchronous Reluctance Solution: A New Alternative in AC Drives, 1994. In Proceedings of the 20th International Conference of IEEE Industrial Electronics, Bologna, Italy, 5–9 September 1994; Volume 1, pp. 1–13. [Google Scholar]
- Bianchi, N.; Bolognani, S.; Carraro, E.; Castiello, M.; Fornasiero, E. Electric Vehicle Traction Based on Synchronous Reluctance Motors. IEEE Trans. Ind. Appl. 2016, 52, 4762–4769. [Google Scholar] [CrossRef]
- Diao, X.; Zhu, H.; Qin, Y.; Hua, Y. Torque Ripple Minimization for Bearingless Synchronous Reluctance Motor. IEEE Trans. Appl. Supercond. 2018, 28, 3. [Google Scholar] [CrossRef]
- Ding, H.; Zhu, H.; Hua, Y. Optimization Design of Bearingless Synchronous Reluctance Motor. IEEE Trans. Appl. Supercond. 2018, 28, 1–5. [Google Scholar] [CrossRef]
- Ishikawa, T.; Nakayama, K.; Kurita, N.; Dawson, F.P. Optimization of Rotor Topology in PM Synchronous Motors by Genetic Algorithm Considering Cluster of Materials and Cleaning Procedure. IEEE Trans. Magn. 2014, 50, 2. [Google Scholar] [CrossRef]
- Dilettoso, E.; Salerno, N. A Self-Adaptive Niching Genetic Algorithm for Multimodal Optimization of Electromagnetic Devices. IEEE Trans. Magn. 2006, 42, 2006. [Google Scholar] [CrossRef]
- Maruyama, T.; Igarashi, H. An Effective Robust Optimization Based on Genetic Algorithm. IEEE Trans. Magn. 2008, 44, 990–993. [Google Scholar] [CrossRef] [Green Version]
- Cohoon, J.P.; Paris, W. Genetic Placement. In Proceedings of the IEEE International Conference on Computer-Aided Design, Port Chester, NY, USA, 7 October 1985; pp. 422–425. [Google Scholar]
- Im, C.H.; Jung, H.-K.; Kim, Y.J. Hybrid Genetic Algorithm for Electromagnetic Topology Optimization. IEEE Trans. Magn. 2003, 39, 5. [Google Scholar]
- Ocak, O.; Aydin, M. An Innovative Semi-FEA Based, Variable Magnet-Step-Skew to Minimize Cogging Torque and Torque Pulsations in Permanent Magnet Synchronous Motors. IEEE Access 2020, 8, 210775–210783. [Google Scholar] [CrossRef]
Figure 1.
Flow chart of the GTA.

Figure 2.
90-degree periodic model with symmetry properties.
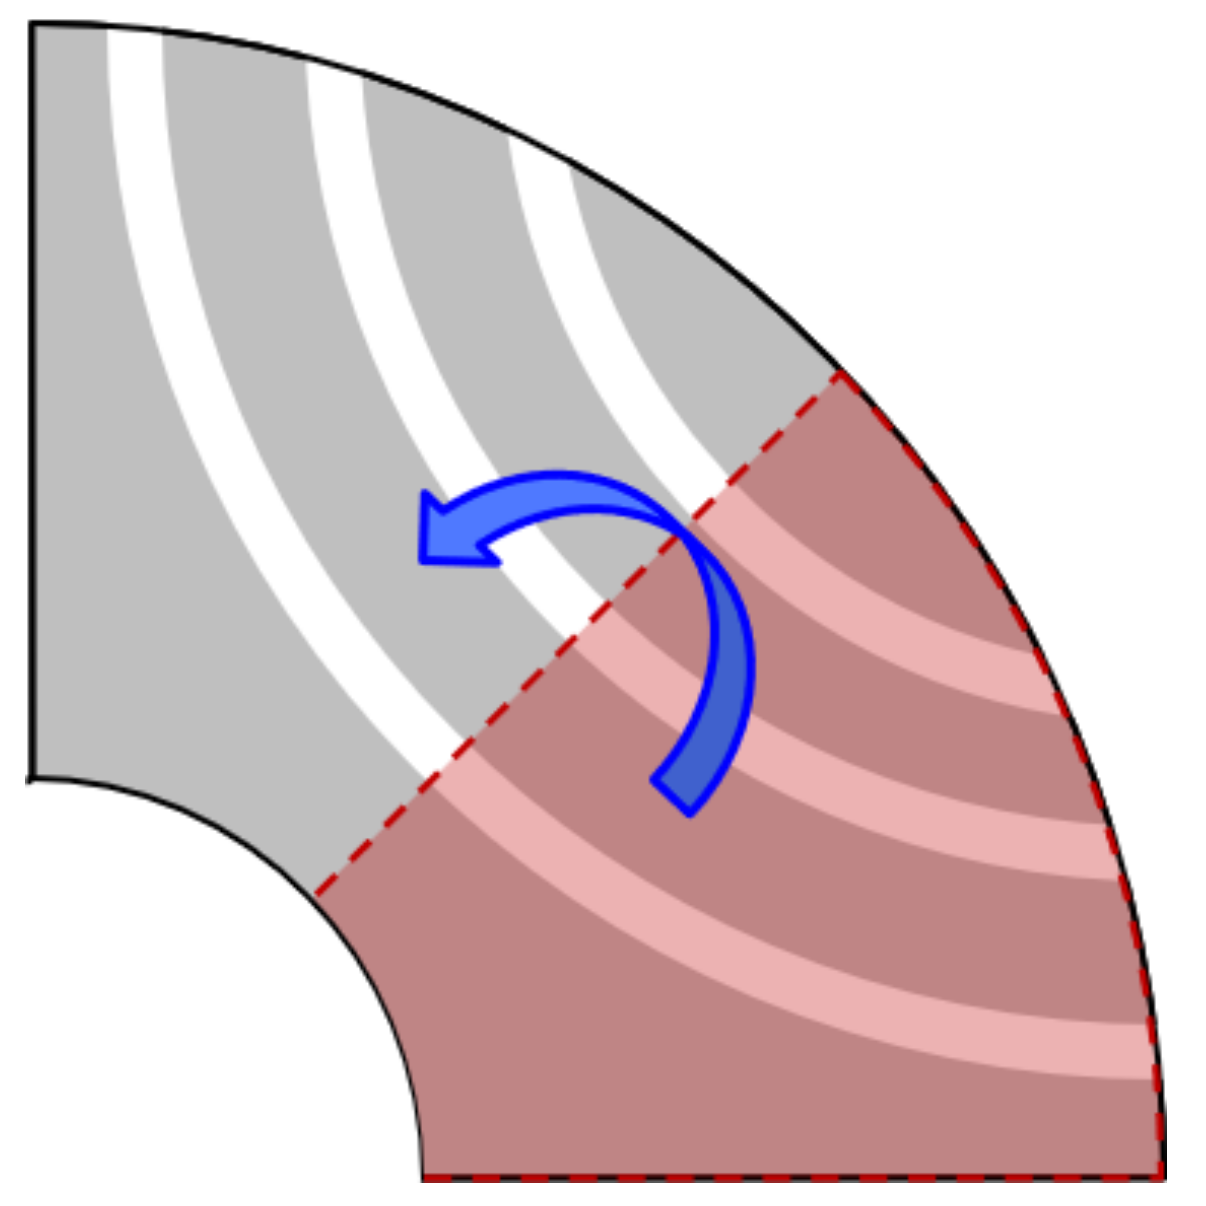
Figure 3.
Forward mesh grid (left) and reverse mesh grid (right).

Figure 4.
Magnetic flux flowing through the core.

Figure 5.
Example of inserting steel layers.
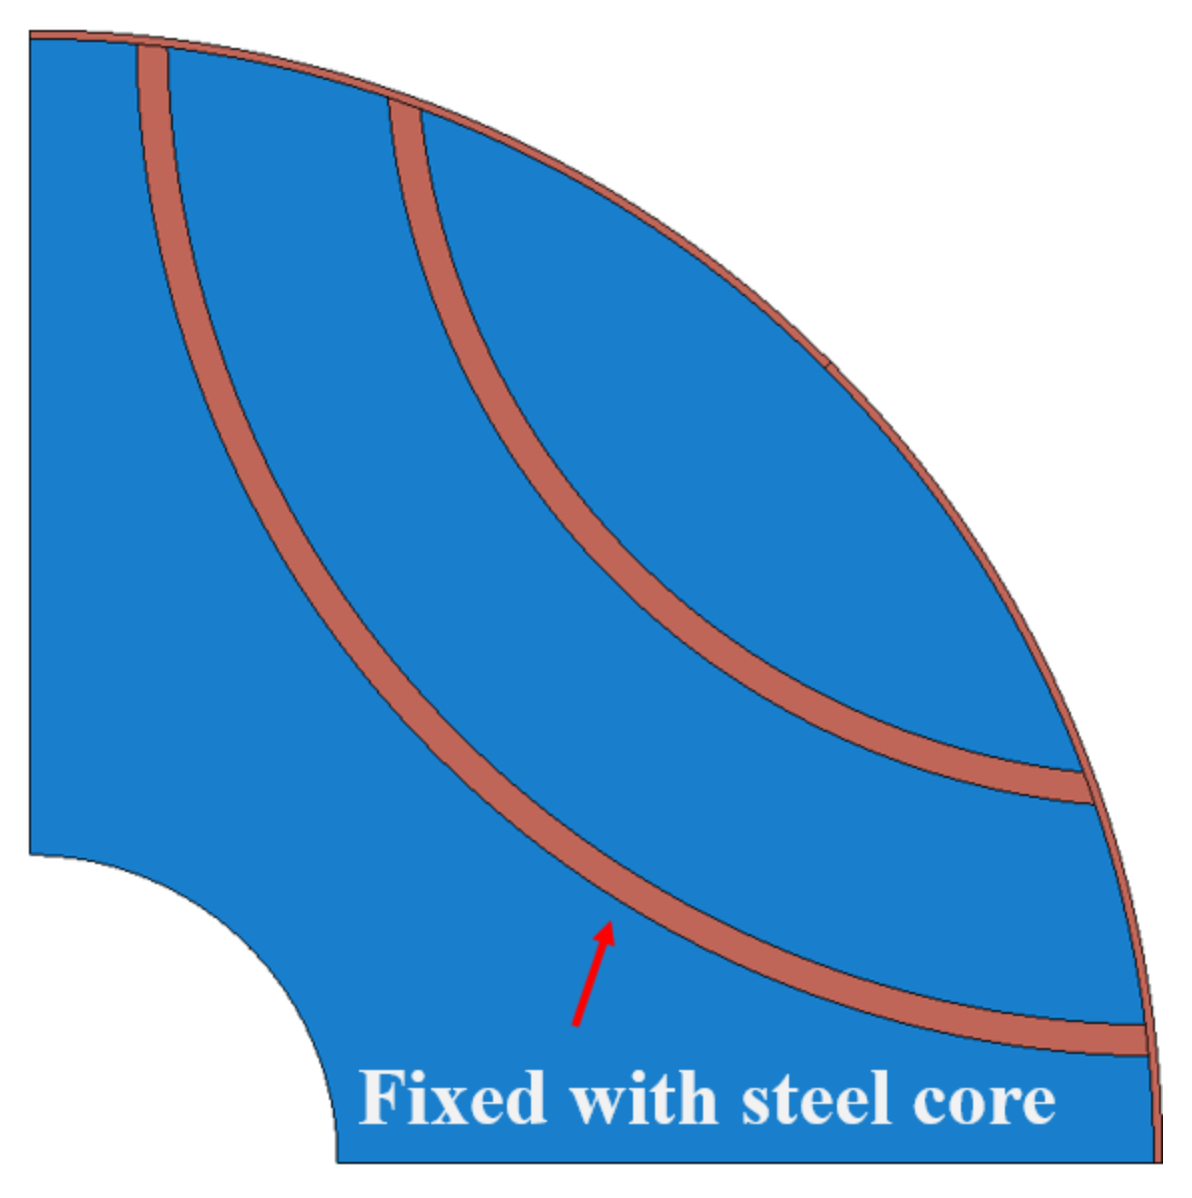
Figure 6.
Shape and magnetic flux density of sample model.

Figure 7.
An example to explain the GA process. An example illustrating the GA process. (a,b) initial parental genes, (c) predicted offspring genes; (d) generated offspring genes.
Figure 7.
An example to explain the GA process. An example illustrating the GA process. (a,b) initial parental genes, (c) predicted offspring genes; (d) generated offspring genes.

Figure 8.
Shape and magnetic flux density of GA result model.

Figure 9.
An example to explain the ON-OFF method. (a) Initial shape (objective function value = 10); (b) A shape in which one cell is inverted (objective function value = 9); (c) Initial model with expected gains; (d) Model showing cells with positive expected gains (purple: large gain, blue: small gain); (e) A model inverted cell with low expected gain; (f) A model that reversed only the cell, which is a large expected benefit.
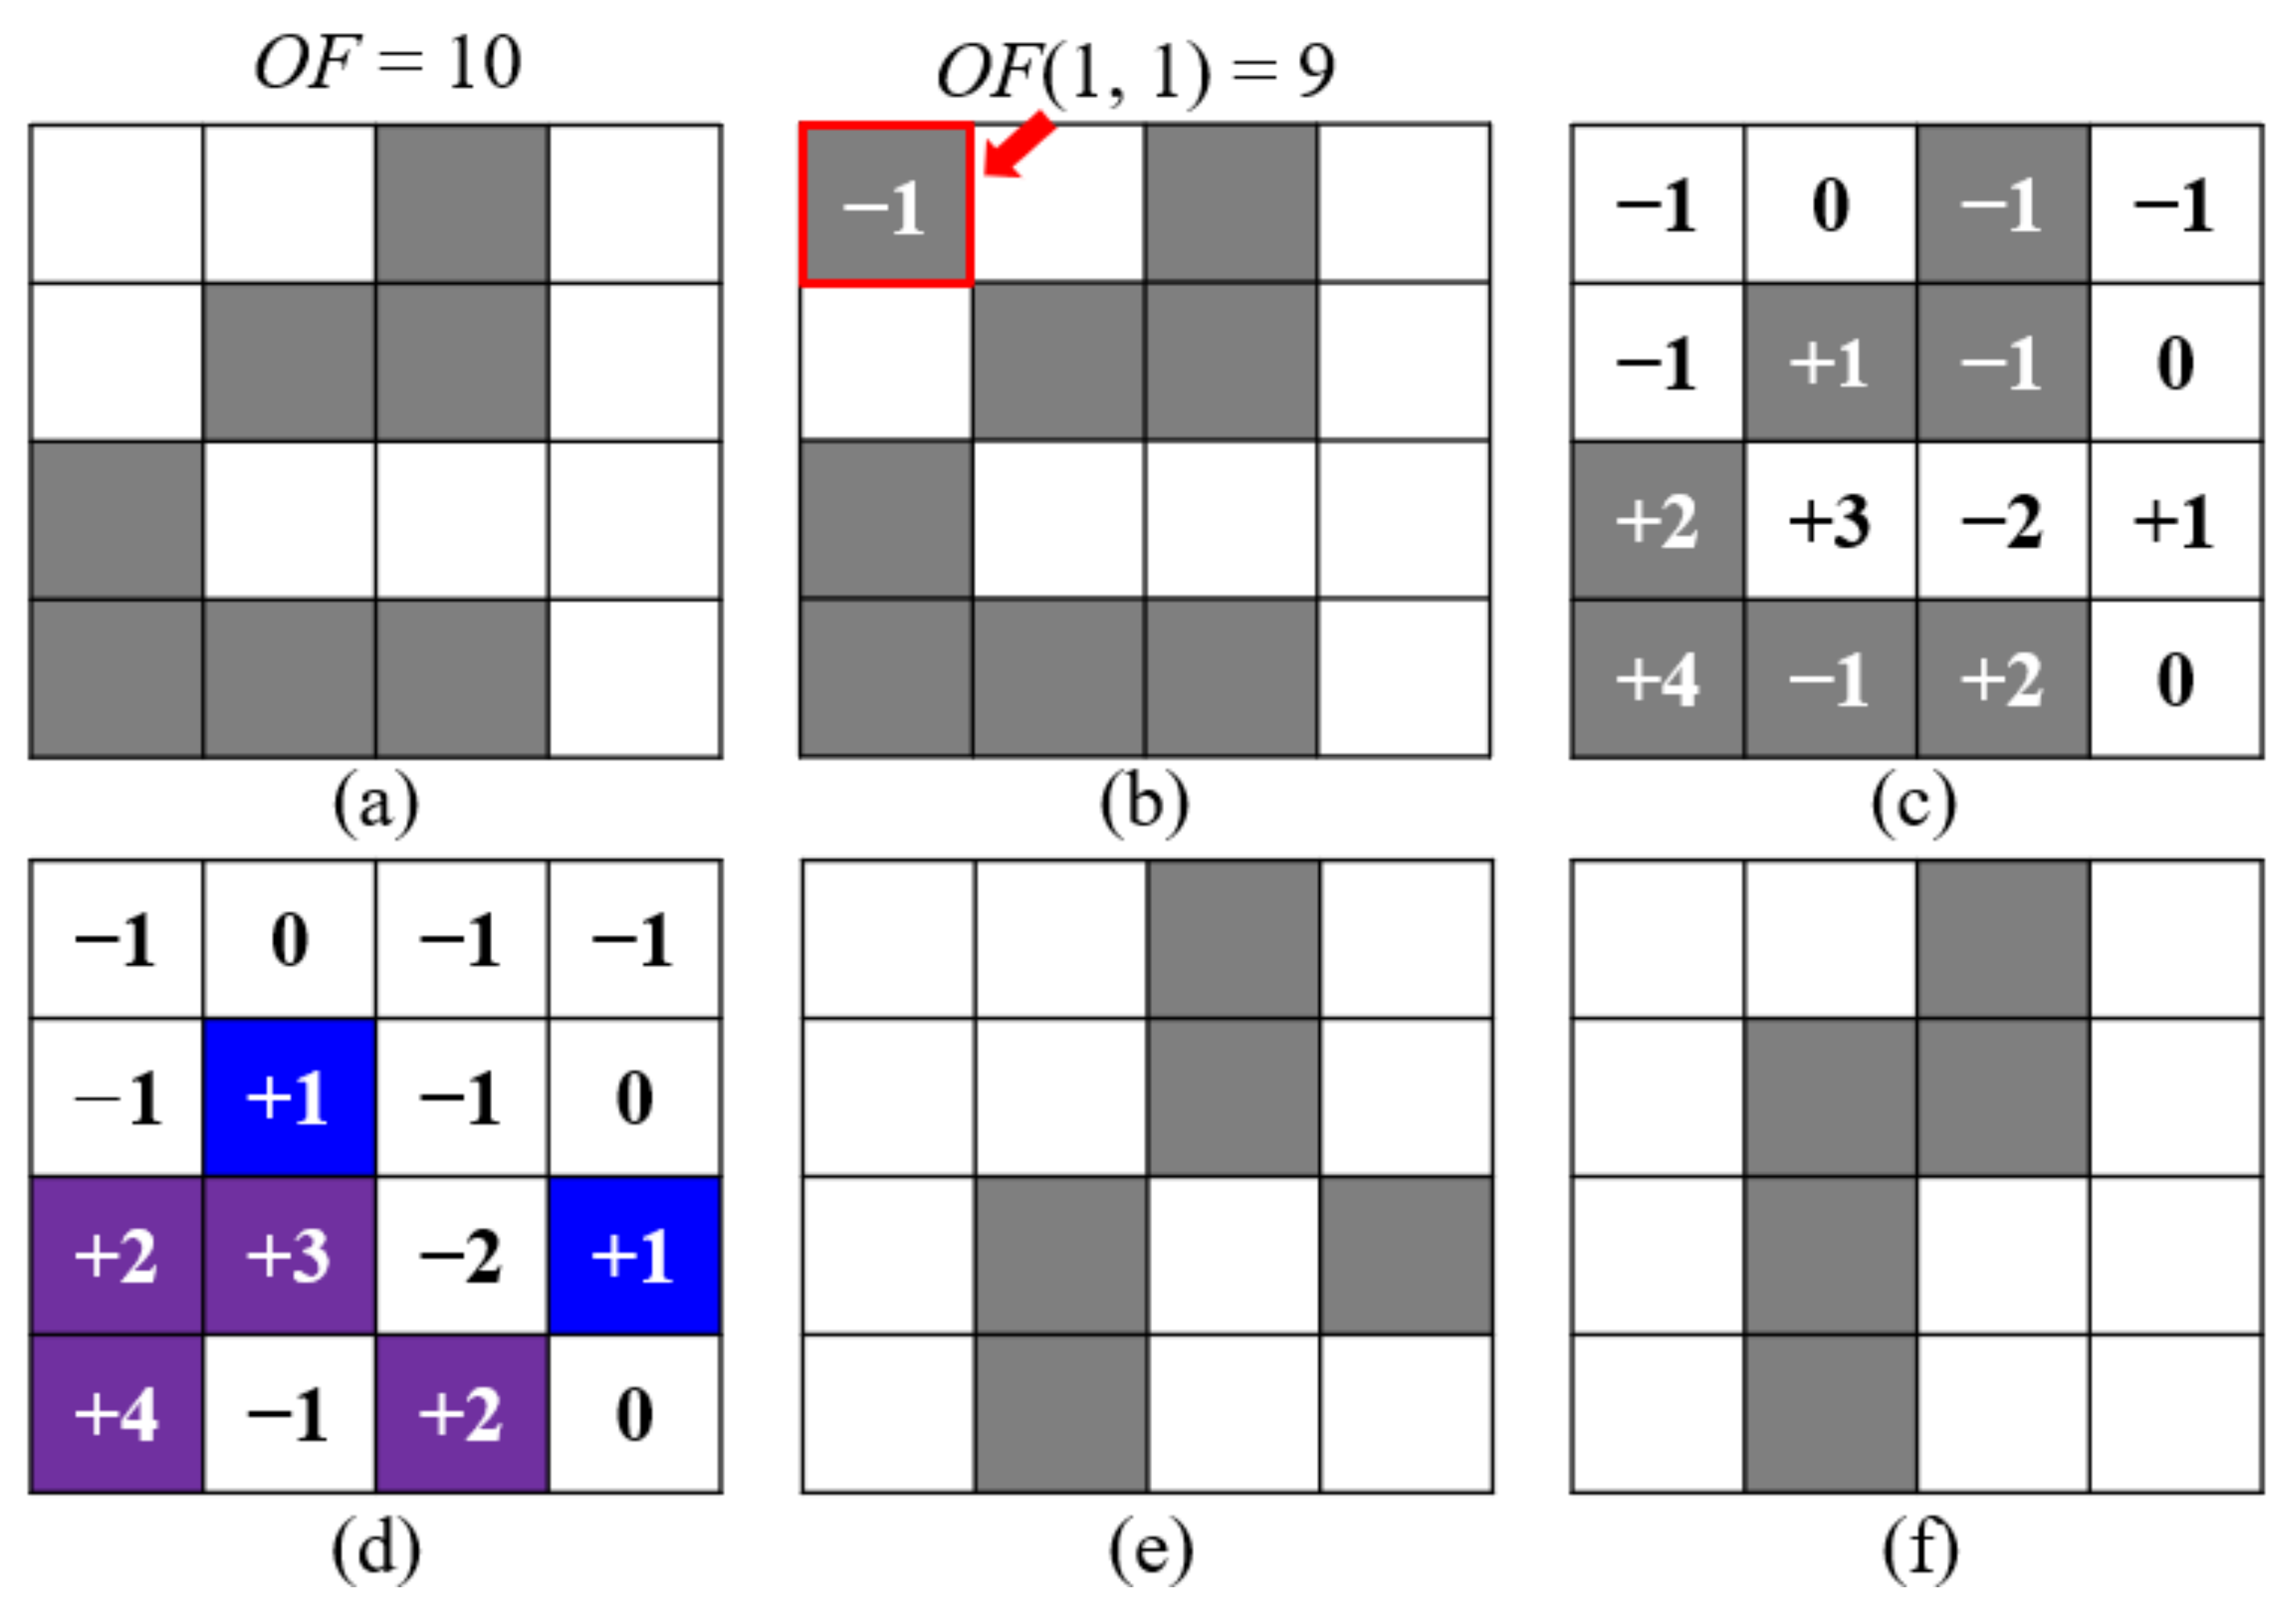
Figure 10.
Shape and magnetic flux density of the model resulting from the ON-OFF method. (a) Step 1; (b) Step 4.
Figure 10.
Shape and magnetic flux density of the model resulting from the ON-OFF method. (a) Step 1; (b) Step 4.

Figure 11.
Example of application of smoothing technique. Before applying the smoothing technique (left); After applying the smoothing technique (right).
Figure 11.
Example of application of smoothing technique. Before applying the smoothing technique (left); After applying the smoothing technique (right).
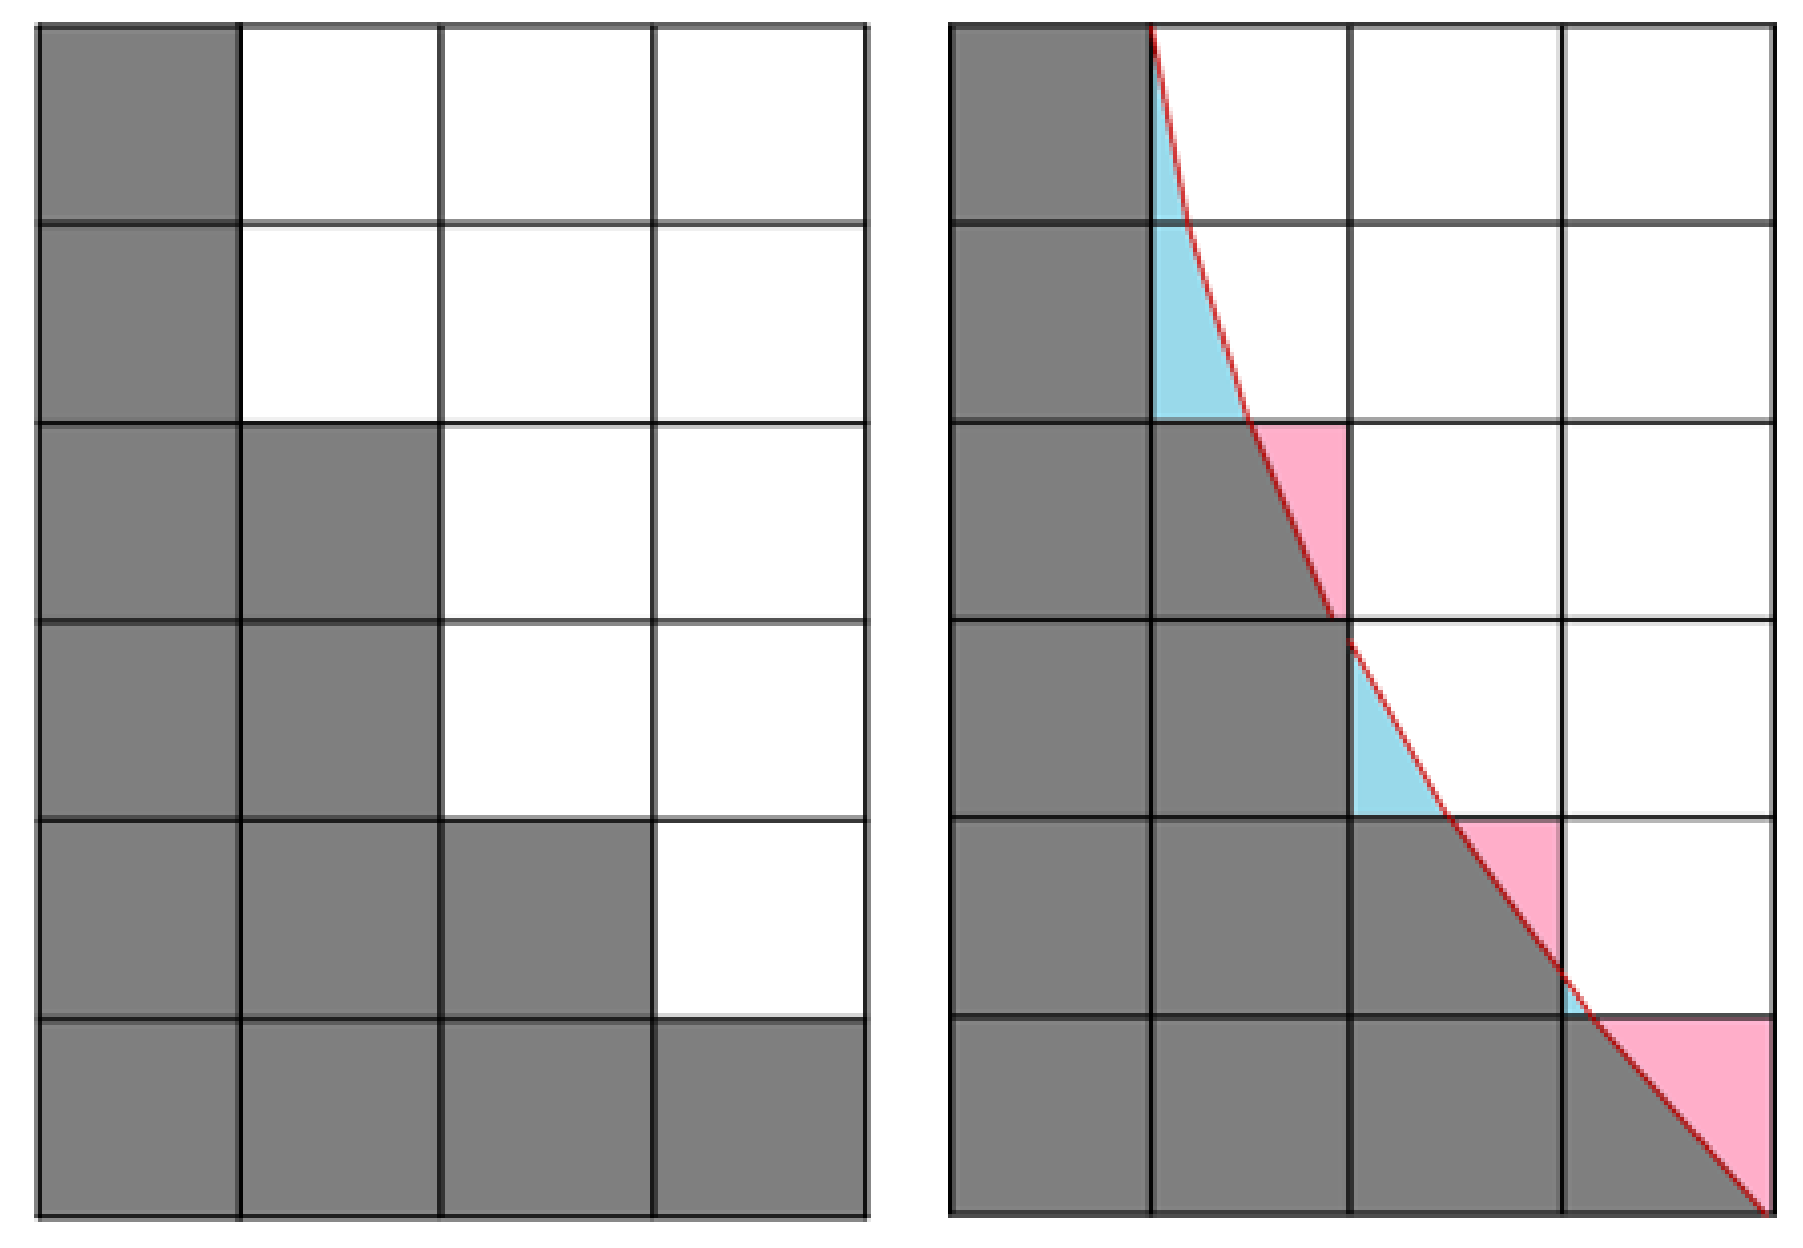
Figure 12.
Comparison of magnetic flux density between. (a) ON-OFF result model and (b) model applying smoothing technique.
Figure 12.
Comparison of magnetic flux density between. (a) ON-OFF result model and (b) model applying smoothing technique.
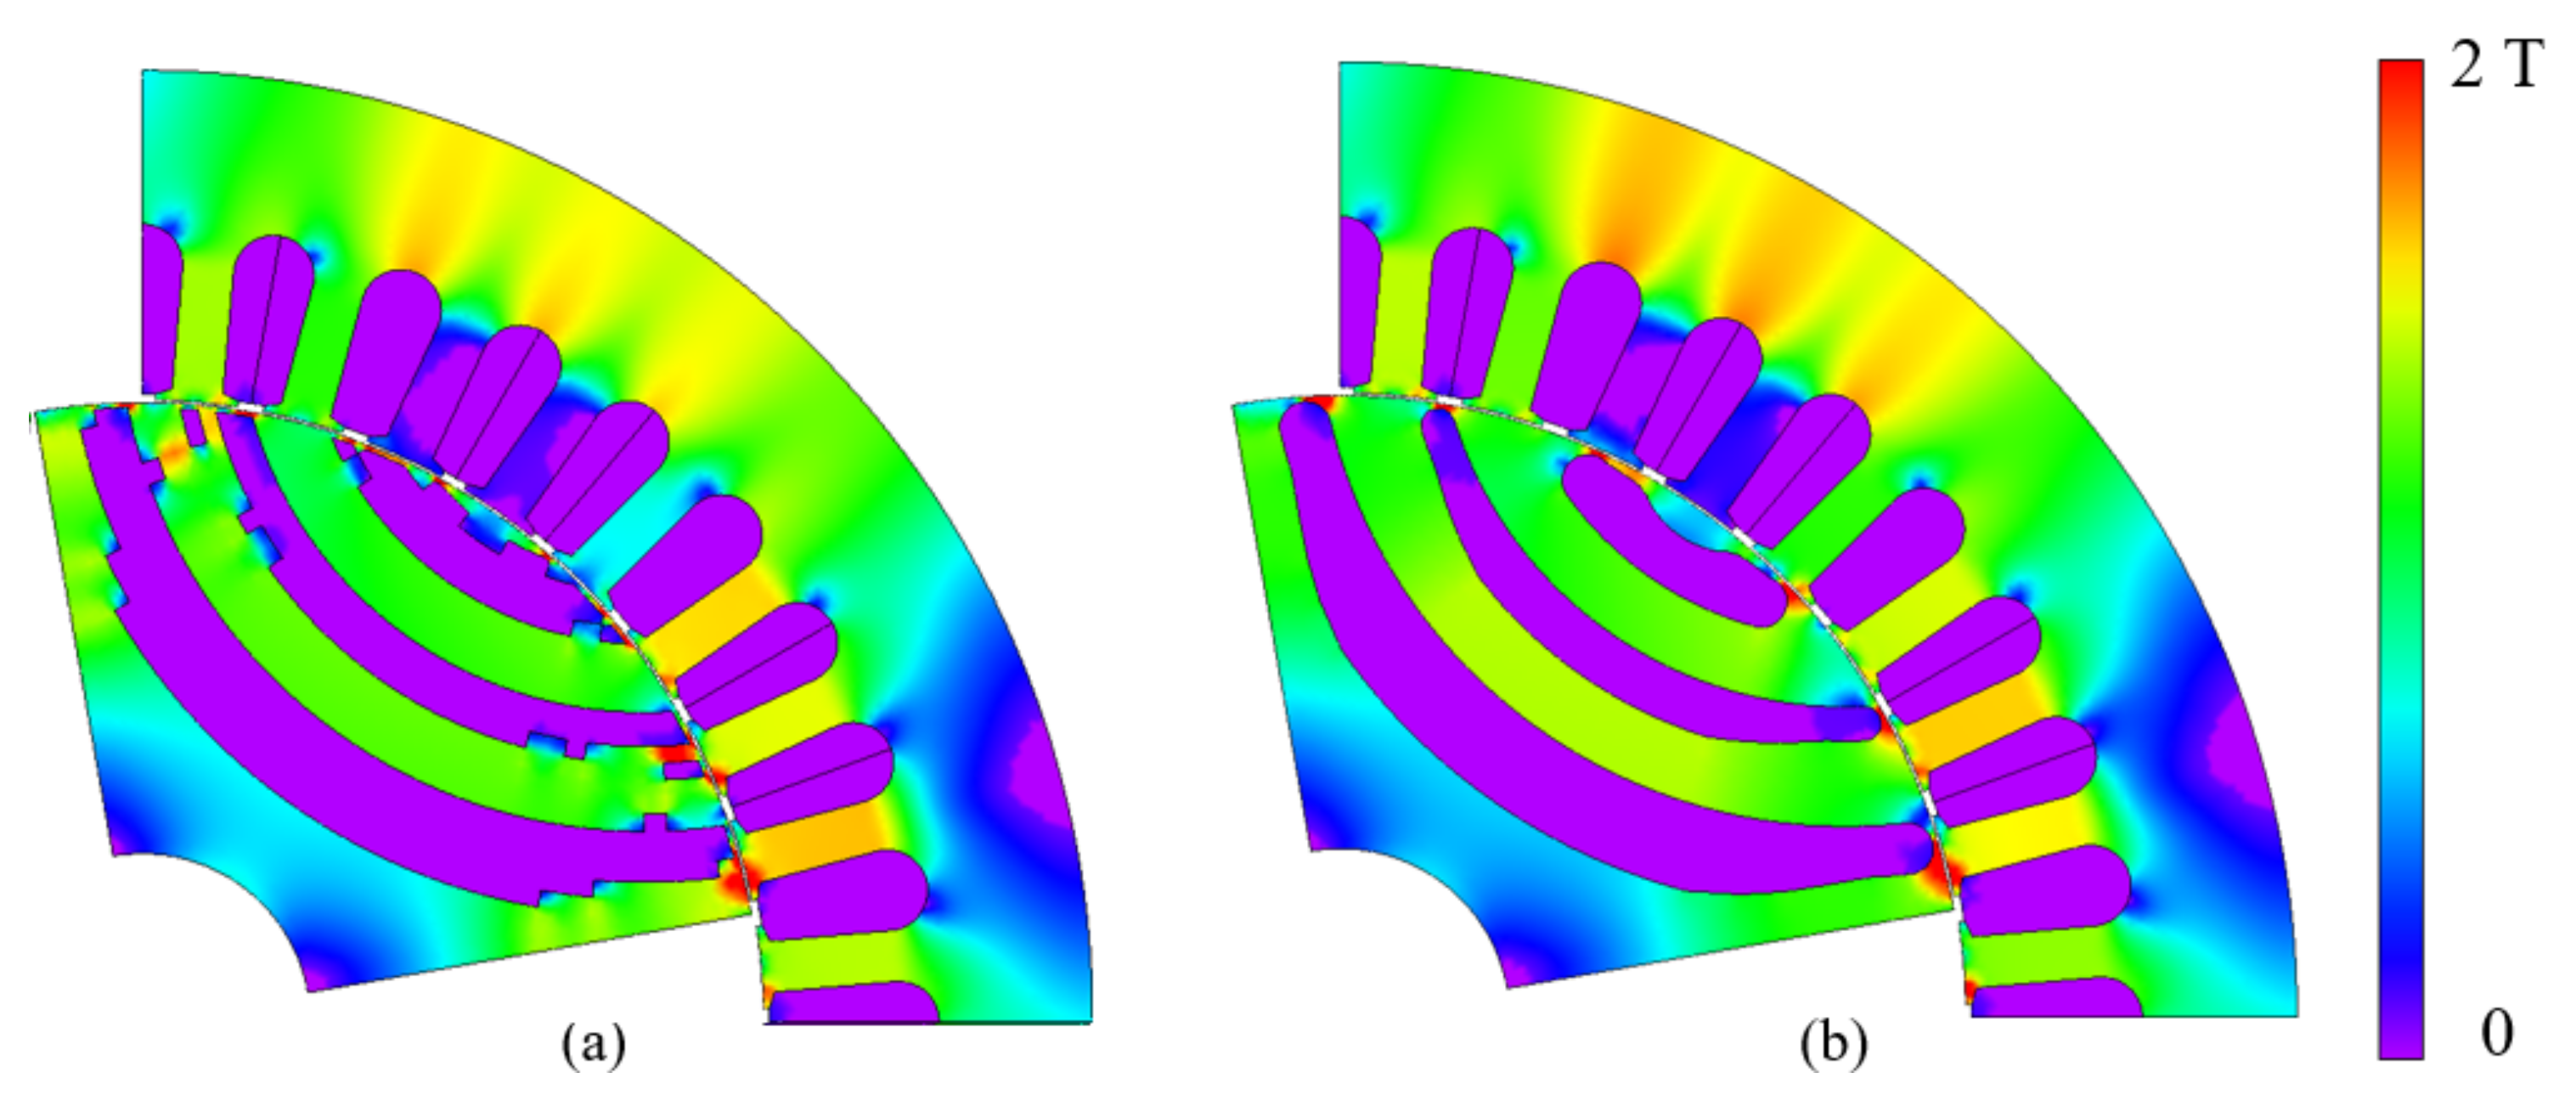
Figure 13.
Results of stress analysis for (a) a model before center post insertion and (b) a model with center post inserted.
Figure 13.
Results of stress analysis for (a) a model before center post insertion and (b) a model with center post inserted.
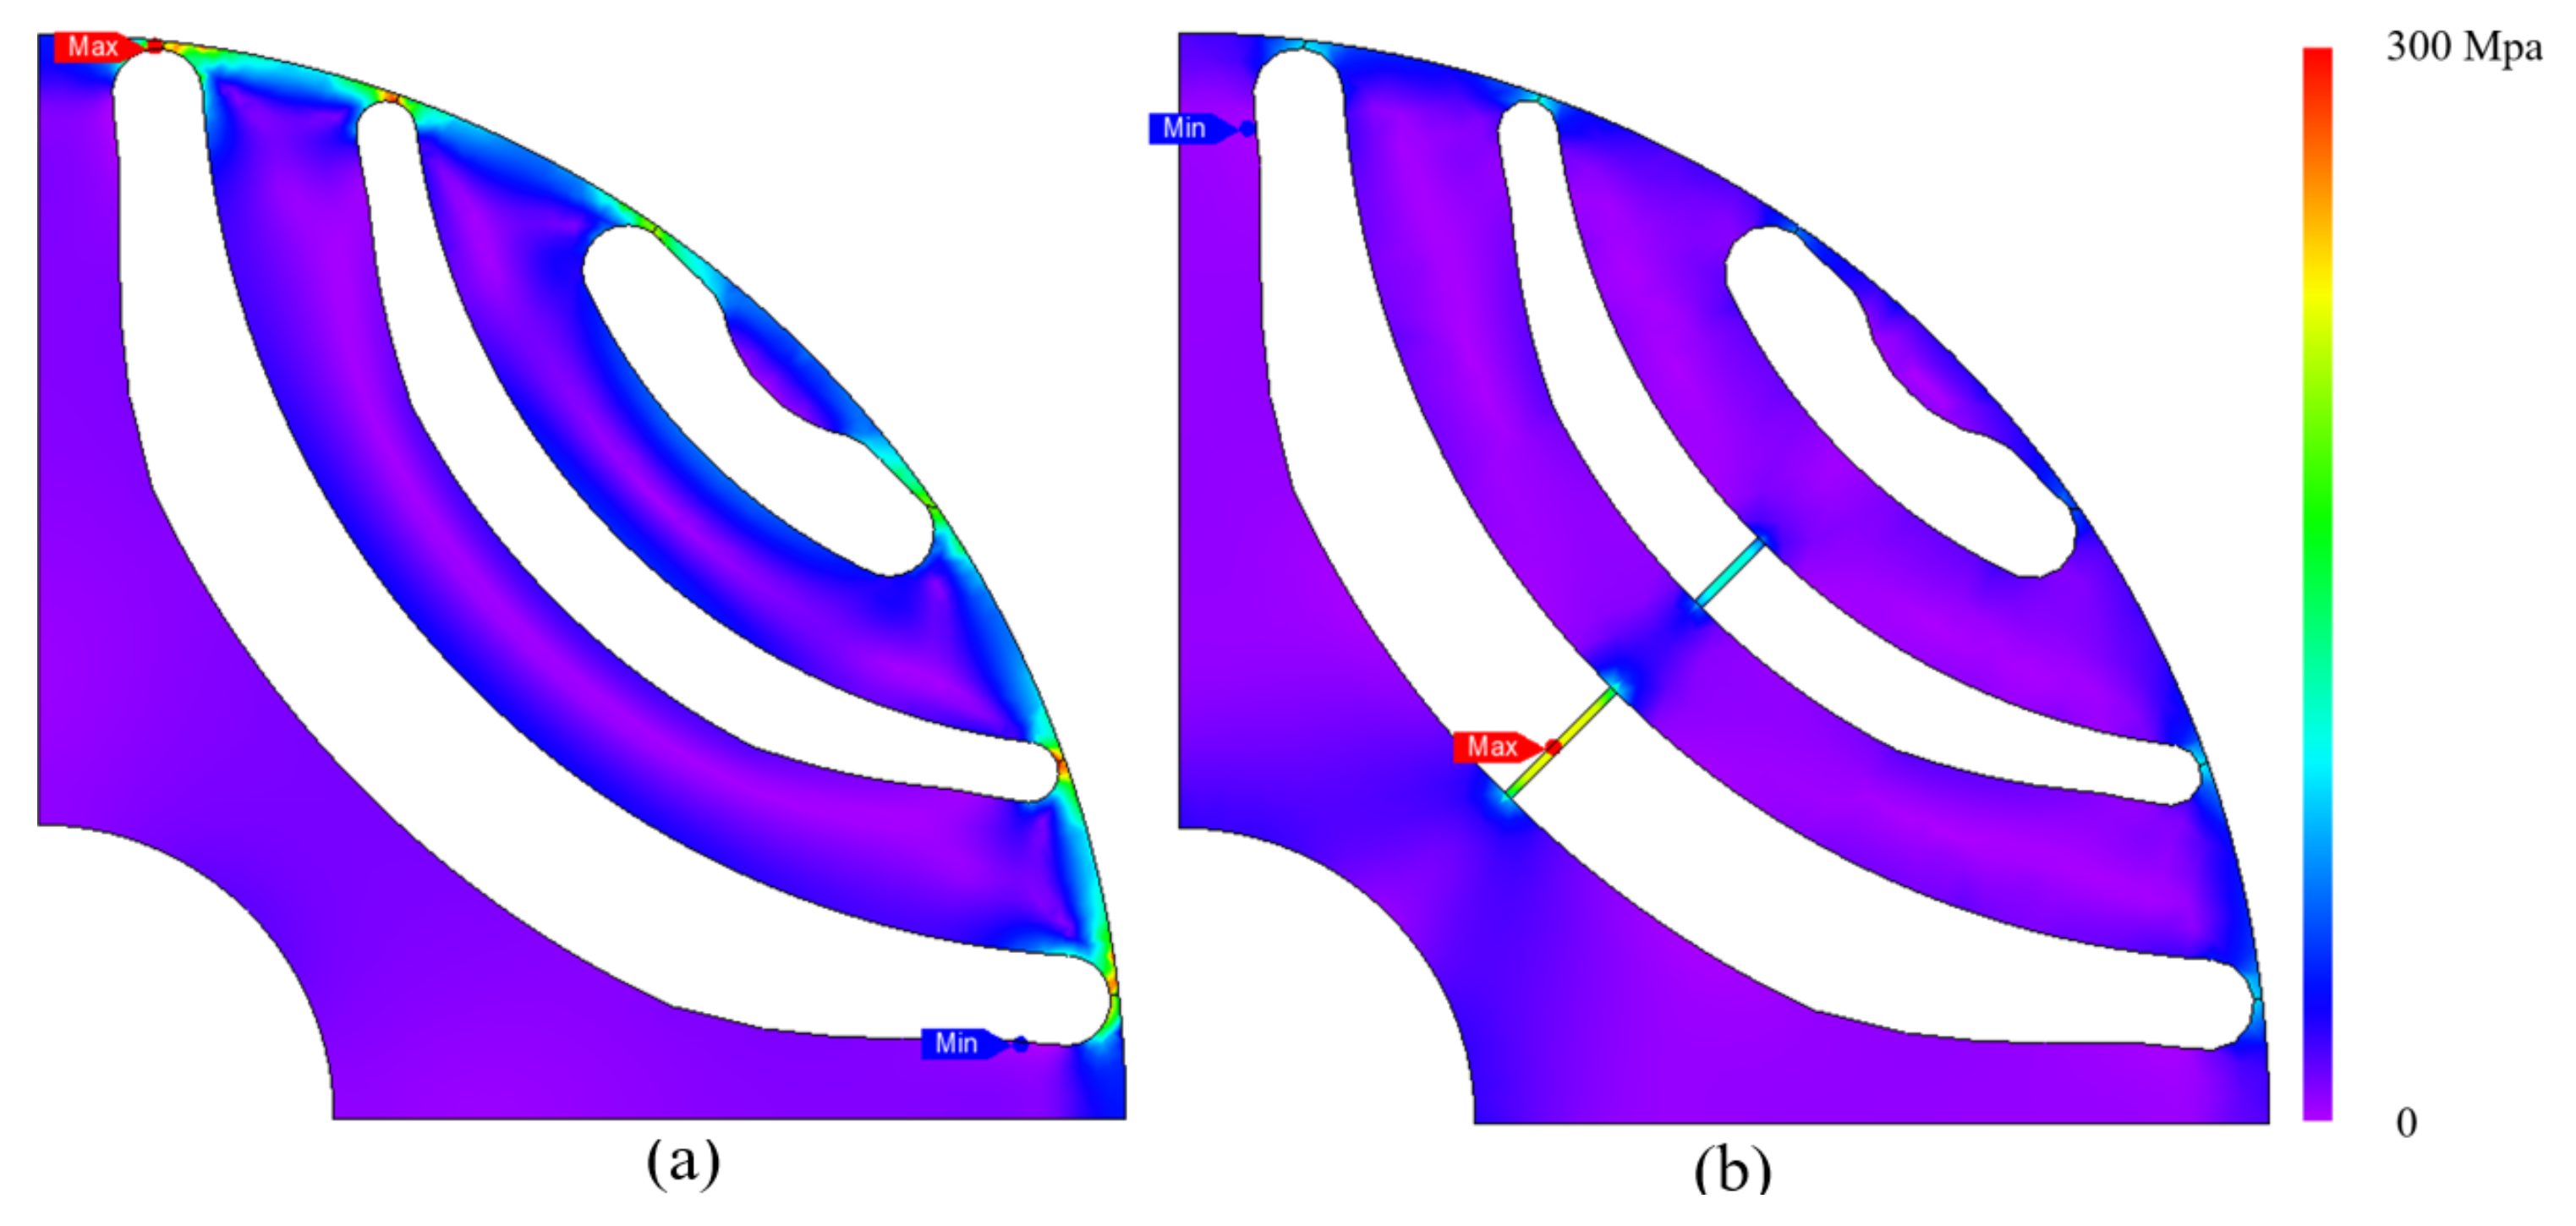
Figure 14.
Instructions for applying the skew technique.
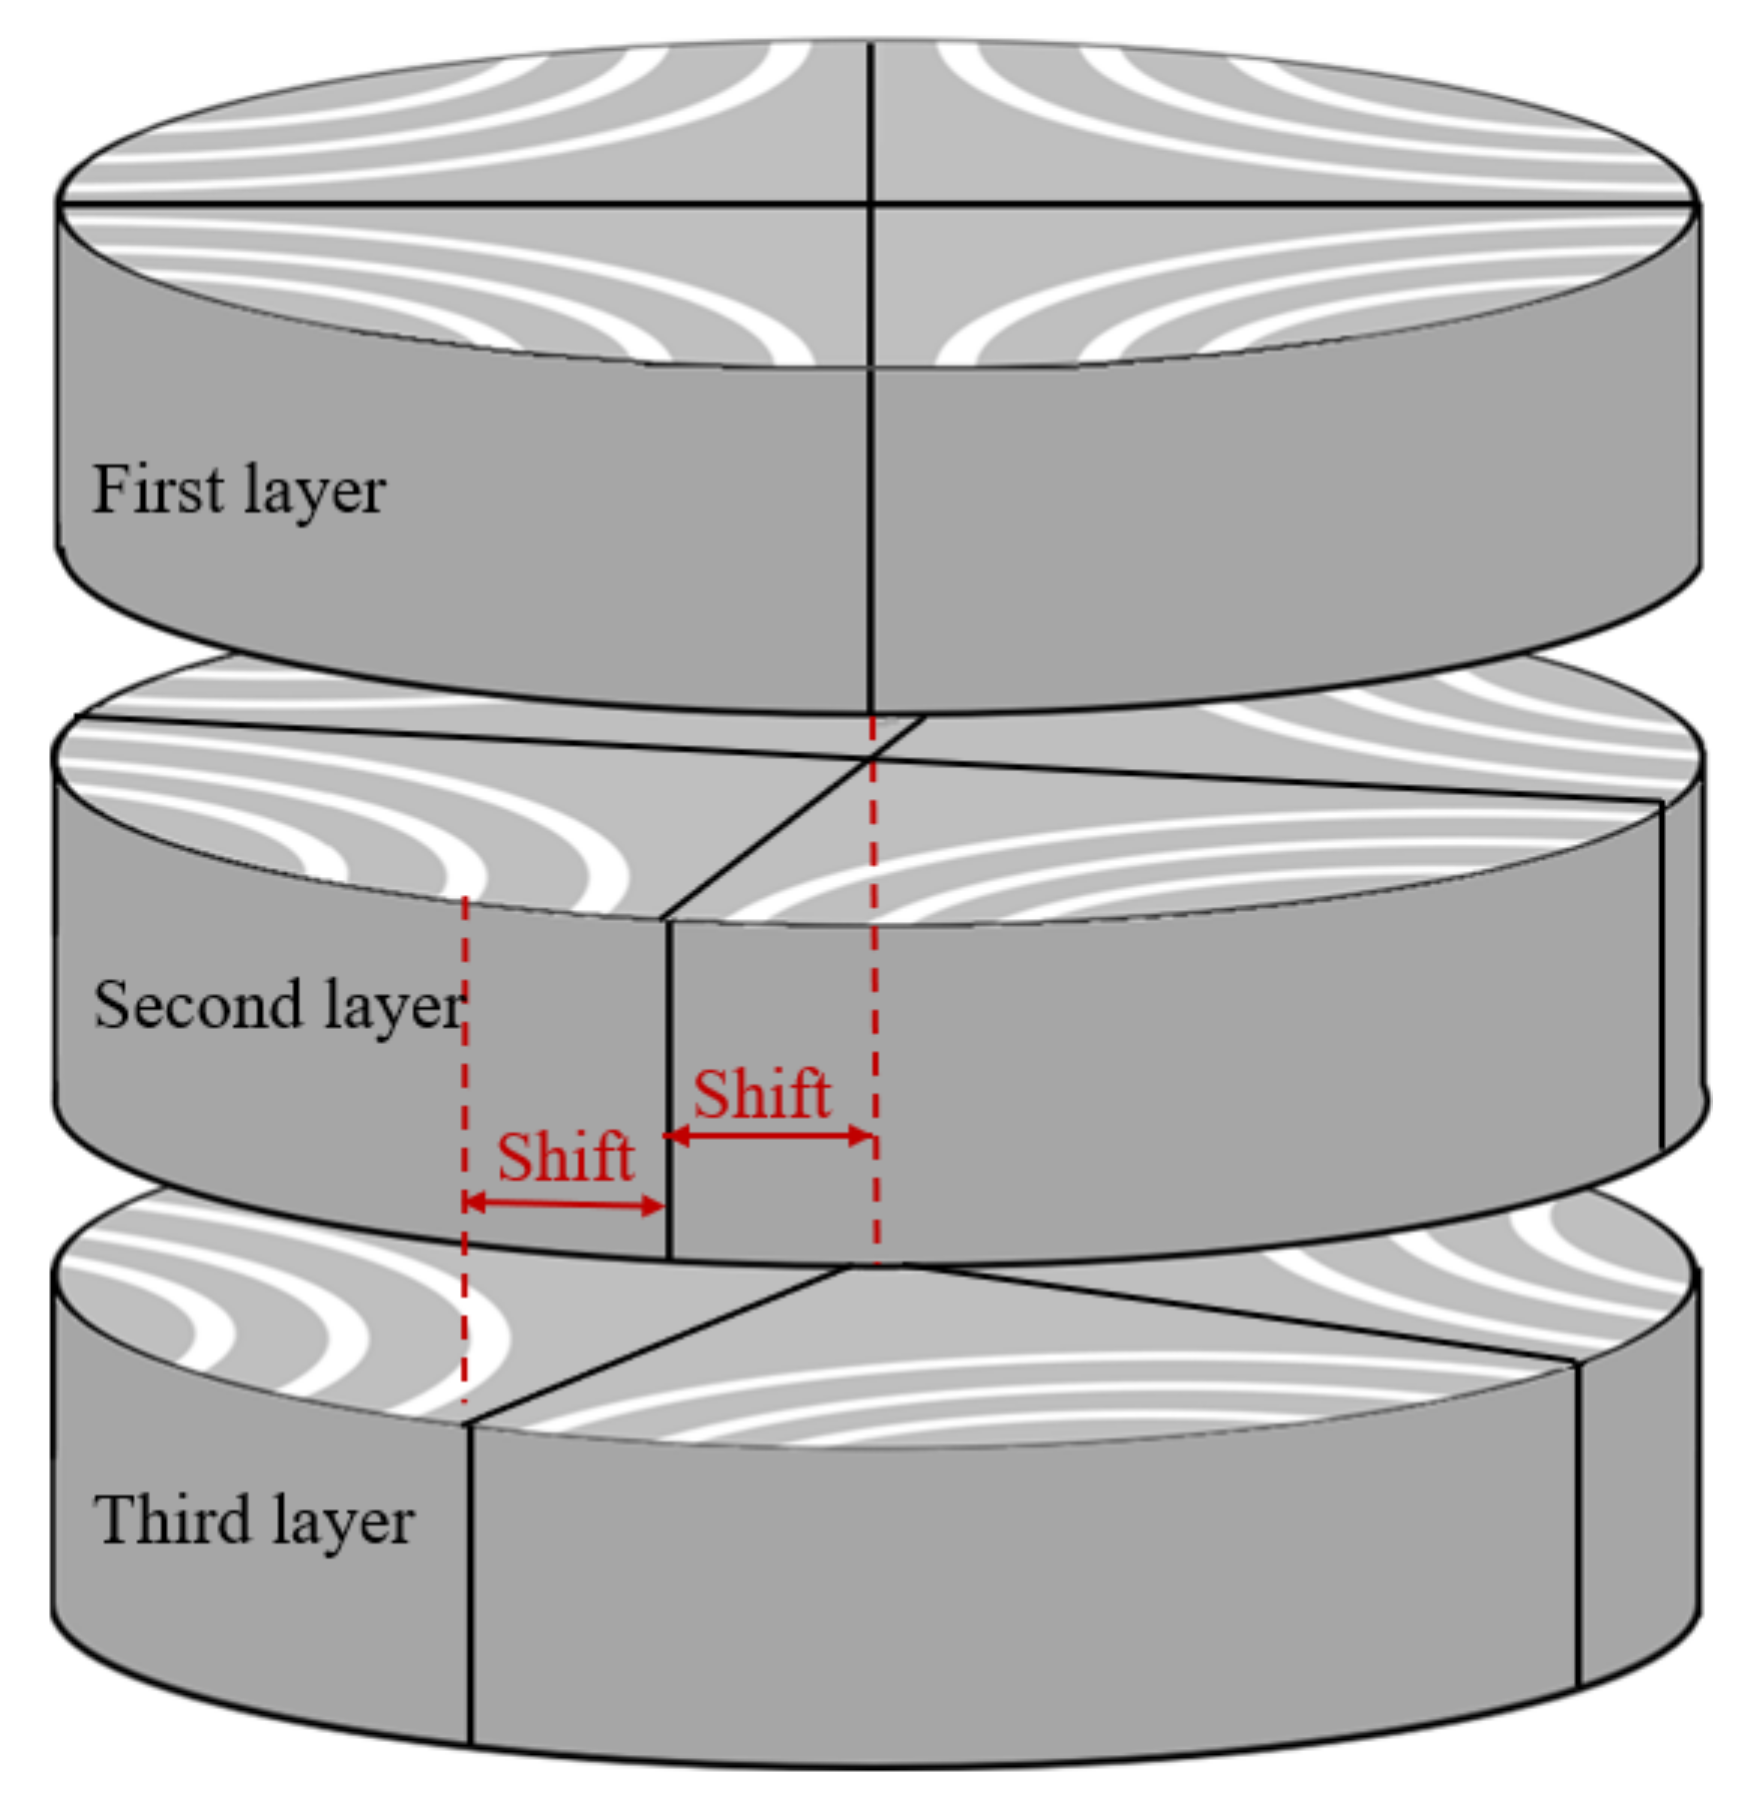
Figure 15.
Results of applying the skew to the design model. Black line: the model without skew; red line: the skewed model.
Figure 15.
Results of applying the skew to the design model. Black line: the model without skew; red line: the skewed model.


Table 1.
Requirements of an objective motor.
| Requirement | Value |
|---|---|
| Rated power (kW) | 15 |
| Rated torque (Nm) | 80 |
| Rated/maximum speed (RPM) | 1800/5400 |
| Lowest efficiency limit (%) Safety factor | 94.1 1.2 |
Table 2.
Specifications of an objective motor.
| Parameter | Value |
|---|---|
| Number of poles | 4 |
| Number of slots | 36 |
| Stator outer/inner diameter (mm) | 260/170 |
| Rotor outer/inner diameter (mm) | 169.2/46 |
| Air gap (mm) | 0.8 |
| Stacking length (mm) | 205 |
| Coil occupancy rate (%) | 0.47 |
| Material of core | 50JN290 |
Table 3.
Performance comparison by ON-OFF step.
| Step | Tave (Nm) | Tripple (%) |
|---|---|---|
| 0(GA) | 61.19 | 94.93 |
| 1 | 81.98 | 102.5 |
| 2 | 85.27 | 33.76 |
| 3 | 85.82 | 35.86 |
| 4 | 88.87 | 22.59 |
Table 4.
Performance comparison for each optimization step.
| Model | Tave (Nm) | Tripple (%) | Ploss (W) | Efficiency (%) |
|---|---|---|---|---|
| Sample | 86.71 | 116.54 | 598.3 | 96.47 |
| GA | 61.19 | 94.93 | 593.5 | 95.11 |
| ON-OFF | 88.87 | 22.59 | 611.5 | 96.48 |
| Smoothing | 88.97 | 20.58 | 607.7 | 96.50 |
| Center post | 87.87 | 22.13 | 606.8 | 96.47 |
| Skew | 81.45 | 11.01 | 601.8 | 96.23 |
Publisher’s Note: MDPI stays neutral with regard to jurisdictional claims in published maps and institutional affiliations. |
© 2021 by the authors. Licensee MDPI, Basel, Switzerland. This article is an open access article distributed under the terms and conditions of the Creative Commons Attribution (CC BY) license (https://creativecommons.org/licenses/by/4.0/).
Share and Cite
MDPI and ACS Style
Lee, T.-H.; Lee, J.-H.; Yi, K.-P.; Lim, D.-K. Optimal Design of a Synchronous Reluctance Motor Using a Genetic Topology Algorithm. Processes 2021, 9, 1778. https://doi.org/10.3390/pr9101778
AMA Style
Lee T-H, Lee J-H, Yi K-P, Lim D-K. Optimal Design of a Synchronous Reluctance Motor Using a Genetic Topology Algorithm. Processes. 2021; 9(10):1778. https://doi.org/10.3390/pr9101778
Chicago/Turabian StyleLee, Tae-Hee, Jin-Hwan Lee, Kyung-Pyo Yi, and Dong-Kuk Lim. 2021. "Optimal Design of a Synchronous Reluctance Motor Using a Genetic Topology Algorithm" Processes 9, no. 10: 1778. https://doi.org/10.3390/pr9101778
Note that from the first issue of 2016, this journal uses article numbers instead of page numbers. See further details here.