Article

Treatment of Chromium Removal Wastewater from Tanning by a New Coupling Technology

1
School of Chemical Engineering and Technology, Hebei University of Technology, Tianjin 300130, China
2
Engineering Research Center of Seawater Utilization of Ministry of Education, Tianjin 300130, China
3
Hebei Collaborative Innovation Center of Modern Marine Chemical Technology, Tianjin 300130, China
*
Author to whom correspondence should be addressed.
Processes 2022, 10(6), 1134; https://doi.org/10.3390/pr10061134
Submission received: 7 May 2022 / Revised: 24 May 2022 / Accepted: 27 May 2022 / Published: 6 June 2022
(This article belongs to the Section Environmental and Green Processes)

Abstract

:
In this study, the coupling process of flocculation and membrane separation was used to treat tannery chromium removal wastewater, and the experimental results of the different process operating conditions were investigated to optimize the entire process design. First, the wastewater was pretreated by flocculation ultrafiltration (UF), and the produced water could directly enter nanofiltration (NF) for concentration treatment. The removal rates of turbidity, chroma, and chemical oxygen demand (COD) of the pretreated wastewater were 96.5%, 53.7%, and 45.8%, respectively. Then, NF multistage treatment was used to control the freshwater recovery rate to 90%, where the salt content of the primary freshwater was 200–500 mg·L−1, and the salt content of the secondary freshwater was 800–1000 mg·L−1, which all met the reuse standards of the factory. The total dissolved solids (TDS) and COD of the concentrated wastewater were 44,000–46,000 mg·L−1 and 10,000–13,000 mg·L−1, respectively. Finally, electrodialysis (ED) was used to desalinate the wastewater, and the desalination rate after primary ED desalination was 52.2%. Subsequently, by increasing the temperature of the wastewater in the desalination chamber to 31 °C, the wastewater was subjected to two-stage ED to remove the sulfate in the wastewater for the second time, and the total desalination rate reached 61.9%. The results showed that this new coupling process could realize the efficient reuse of chromium removal from tannery wastewater.

1. Introduction

The leather industry promotes China’s economic prosperity but also causes severe environmental pollution [1]. At present, there are more than 8400 tanning enterprises in China. According to the data, China’s leather output in 2021 was 574 million square meters, with a year-on-year increase of 14.8%. Together with this, a large amount of tanning wastewater is discharged. The tanning industry discharges more than 120–150 million tons of wastewater every year, accounting for about 0.47% of China’s total industrial wastewater. However, tannery wastewater has the characteristics of complex composition, large fluctuations in water quality, many types of organic substances, as well as a high content and difficult degradation of macromolecules [2].
If the chromium removed from tannery wastewater was directly discharged, it would still cause irreversible pollution to the environment. Therefore, it is imperative to find a process for the advanced treatment of chromium removal from tannery wastewater [3]. The most significant characteristic of membrane separation involves the driving force, which mainly consists of pressure, with no phase changes during the separation process and no heating. Compared to other separation technologies, membrane separation has significant advantages of energy savings and high efficiency. To make full use of tannery wastewater, improving the reuse rate of wastewater, realizing the comprehensive utilization of wastewater resources, and the combined process of membrane technology and other technologies has become a research hotspot for many scholars [4,5,6].
Li treated integrated wastewater from leather production via the double-membrane technology of UF and reverse osmosis as the core [7]. The results showed that the UF membrane had strong anti-pollution abilities. In addition, the turbidity of the effluent water was less than 0.5 NTU and the SDI value was less than 3, which fully met the requirements of reverse osmosis equipment (RO). The RO water COD < 30 mg·L−1 and conductivity < 500 μS/cm met the requirements of leather production process reuse water quality.
For dyeing wastewater, Hang used NF and ED integrated technology for decolorization, which involved the separation of valent salt and salt concentration [8]. The results showed that after secondary NF treatment, the chroma of the wastewater was reduced to 1/1200 of the raw water, the COD of the raw water was reduced to less than 100 mg·L−1 from 200 mg·L−1, and the mass concentration ratio of the Cl and SO42− ions was reduced to 3 from 21. In addition, ED could concentrate the total dissolved salts in the permeate of the NF membrane to more than 10%.
Streit et al. studied the ED process and used it to separate electrolytes from salting or pickling leather to recover water and chemicals reused during production. ED was also used to recover residual tanning fluids from chromate and other neutral salts [9]. However, the study found that there is a common problem in the process [10,11,12,13]. Compared with other industrial wastewater, the tannery dechromization wastewater has more suspended solids and macromolecular pollutants in the wastewater, and the membrane fouling is also more serious. When running for a long time, this cause irreversible damages to the membrane and shortens its life span.
In order to overcome this problem, flocculation and ultrafiltration as pretreatment processes are important research directions of tannery wastewater treatment process. Ultrafiltration (UF) is a pressure-driven membrane separation process that separates based upon a screening mechanism of molecular size and morphology [14]. After a certain pressure is applied to the feed liquid, the polymer and colloidal substances are blocked in the pores due to the primary adsorption of the membrane surface and micropores, and the mechanical screening of the membrane surface will be blocked by the UF membrane, while water and low molecular substances pass through the membrane.
As a pretreatment means of nanofiltration (NF) equipment, UF can provide excellent influent water quality, ensuring the stable operation of subsequent experiments, and prolonging the cleaning cycle of the NF system and the service life of the membrane [15]. NF intercepts divalent and multivalent ions and various substances with a molecular weight greater than 200 to the NF membrane through a pressure difference.
This offers the advantages of low operating pressure, energy saving, and no pollution production [16]. The main disadvantage of NF is the volume of highly concentrated salt water that is produced, which can reach 10–20% of the volume of the original wastewater, and the concentrated wastewater contains a large amount of organic and inorganic salts, which need to be further recovered. ED technology has been widely used in brackish water desalination and has started to be applied to the process operation of wastewater desalination [17,18,19].
Therefore, we discussed the UF-NF-ED coupling process, which meets the urgent requirements of reducing and recycling wastewater from the tanning and dechroming wastewater industry. In this experiment, the pretreatment effect of different UF membranes on the removal of chromium from tannery wastewater and the anti-pollution of the membrane were studied, and the effects of different pressures and molecular weights intercepted by the UF membrane were investigated on the membrane flux.
At the same time, the UF water was concentrated by NF, the concentrated wastewater was desalinated by ED, and the operating conditions of the entire process were optimized. Lastly, a set of advanced treatment processes for chromium removal from tanning wastewater was established. It was found that this process can recover 90% of fresh water and 61.9% of inorganic salts. As a new process, it can realize the efficient reuse of tannery dechromization wastewater.

2. Materials and Methods

2.1. Experimental Design and Process

The experimental process flow diagram is shown in Figure 1, consisting of flocculation sedimentation, UF, NF, and ED. The flocculation effects of the different flocculants and their dosage on the tannery wastewater were investigated in the pretreatment stage. In the UF process, different types of UF membranes were used to select the most suitable UF membrane for this experiment, and the effects of operating pressure and time on UF were investigated. The average turbidity of the UF produced water was 0.5 NTU, where the overall removal rate reached more than 95%, and COD could be reduced to a certain extent.
The NF process adopted a multi-stage concentration process, and the effects of different feed pressures and recovery rates on the concentration effect were investigated. Thus, 90% of freshwater could be recovered. The concentrated water after NF was desalted by the ED equipment, and the inorganic salt in the concentrated water could be recycled. In the ED process, the limit current density was analyzed, the desalting conditions of different voltages and feed flow in the desalination chamber were investigated, and the process conditions were optimized. Finally, 61.9% of the inorganic salt was recovered for industrial production.

2.2. Performance Parameters of the UF Membrane

As a pretreatment stage, the UF plays a protective role in the use of subsequent experimental equipment; thus, it was very important to select an appropriate UF membrane. Excellent UF membrane have shown to play a significant role in reducing or decreasing membrane pollution, and maintaining membrane flux. Table 1 shows the performance parameters of four UF membranes selected in this experiment.

2.3. Physico-Chemical Analysis of the Wastewater

Ca2+ and Mg2+ were analyzed according to the ethylenediaminetetraacetic (EDTA) titration method. The concentration of Cl was tested by silver nitrate titration (ASTM D512-89 (1999), standard test methods for chloride ion in water) [20], and SO42− was analyzed by EDTA back titration, in which each sample was diluted to meet the feeding requirements. The amount of Na+ was calculated as follows:
C Na + = C SO 4 2 96 × 2 + C Cl 35 . 5 C Ca 2 + 40 × 2 C Mg 2 + 24 × 2 × 23   ,  
where C is the ion concentration (mg·L−1).
The TDS was measured at 300 °C according to the thermostatic weighing method, and the conductivity was measured by a multi-parameter water quality analyzer (DDS-11A). The pH was measured by the glass electrode method (GB6920-1986) and chromaticity using the multiple dilution method (GB11903-1989). The turbidity was determined by spectrophotometry (GB 1320091).
The COD was measured by rapid digestion spectrophotometry (HJ/T399-2007), and the COD was calculated as follows:
ρ COD = n k A s A b + a ,
where ρ(COD) is the COD value of the water sample (mg·L−1), n is the dilution multiple of the water sample, k is the sensitivity of the calibration curve (mg·L−1), As is the absorbance value of the water sample, Ab is the measured value of the blank sample, and a is the intercept of the calibration curve (mg·L−1).

2.4. Characteristics of Tannery Chromium Removal Wastewater

The tannery wastewater was obtained from a leather company in Fujian, which used the addition and subtraction precipitation method to remove chromium from tannery wastewater, and the remaining wastewater was further treated. The properties of the chromium removal tannery wastewater are shown in Table 2 and Table 3.

3. Results and Discussion

3.1. Wastewater Pretreatment Process

The pretreatment of the raw water adopted the flocculation-UF process to remove the suspended solids and macromolecular solid pollutants from wastewater.

3.1.1. Experimental Study on Chemical Flocculation

The type of flocculant was the key to determining the effect of chemical flocculation on wastewater treatment. Figure 2 show the influence curves of different chemical flocculants on the chroma, turbidity, and COD. When the flocculation time was 30 min, the same dose of flocculant and coagulant aid were used for flocculation at different pH values. As shown in Figure 2a,b, PAC improved the turbidity and chroma, and the overall removal effect of COD was better than PFS as a flocculant. When PAC was used as a chemical flocculant, the flocculation effect was the best when pH = 8, the turbidity removal rate was 65%, the COD removal rate was 31.5%, and the chroma removal rate was 30%.
When PFS was used as a flocculant, we observed back turbidity in the wastewater, and the turbidity removal rate was low. Therefore, PAC was selected as the flocculant and PAM served as the coagulant aid in the subsequent large-scale coagulation treatment, and the pH was about 8. To optimize the experimental conditions, the water quality changes in the flocculation supernatant were investigated when different flocculant addition amounts were used. The results are shown in Figure 3. We observed the best effect when the addition amount was 1%, and the removal rates of turbidity, chroma, and cod were 64.6%, 35%, and 31.5%, respectively.
When the flocculant addition amount was too low or too high, the flocculation effect was not ideal. According to the relevant literature and analysis, this was because the additional amount of PAC was insufficient, and PAC could not fully adsorb the suspended solids in the wastewater through bridging. After the flocculation time was over, it still contained some suspended solids or colloids in the wastewater; however, when the addition amount of PAC was too high, there was an insufficient number of adsorption active sites on the particle surface required for bridging, which reduced the bridging effect due to the supersaturation of the addition, which made the flocculation effect worse.

3.1.2. Comparison of UF Membranes

After flocculation treatment, the supernatant entered the UF device after passing through the security filter. The change trend in the UF membrane flux of the different materials with time is shown in the figure below, under the same pressure of 0.2 MPa and backwashing with the produced water every 30 min for 45 s.
As shown in Figure 4, at the same time, pressure, and material, different rejections had a certain impact on UF. With increasing UF time, the membrane flux of the two membranes decreased continuously. After 30 min of operation, the membrane flux recovered after backwashing, and the membrane flux at the beginning of the different retained molecular weights was different. When the retained molecular weight values of both the PVC and PES UF membranes increased, the membrane flux also increased. For PVC, when the retained molecular weight was 100 kDa, the maximum membrane flux was 271.1 L/(h·m2).
After 30 min of working time, the membrane flux decreased to 66.67 L/(h·m2); however, when the molecular weight interception was 150 kDa, the maximum membrane flux increased to 308.89 L/(h·m2), and the membrane flux at 30 min was 77.78 L/(h·m2). The PES UF membrane also showed the same trend. When a 65 kDa molecular weight interception UF membrane was used, the maximum membrane flux was only 220 L/(h·m2) and decreased to 55.56 L/(h·m2) after 30 min. Compared to 65 kDa, the initial membrane flux of a PES UF membrane with 150 kDa molecular weight was 253 L/(h·m2) and 71.11 L/(h·m2) at 30 min.
Based on the above data, we observed that when the retained molecular weight increased, both the initial membrane flux and membrane flux after working for a period of time as well as the anti-pollution performance and membrane flux of the UF membrane were good. Subsequently, the reason for this observation was analyzed. When the retained molecular weight decreased, the membrane surface continued to accumulate pollutants when filtering the wastewater; thus, the membrane surface was blocked by the macromolecular pollutants, reducing the membrane flux.
As shown in Figure 5, at the same time, different materials with the same retention value had an impact on UF. Each time the water sample was backwashed, the recovery of the two membranes was very good, and they recovered to the membrane flux at the last backwashing. However, overall, there was a certain gap between the membrane flux of the 150 kDa PES UF membrane and the PVC membrane. The membrane flux of the PVC UF membrane was greater than the PES membrane, and the recovery degree of the membrane flux improved after each backwash.
Through thermogravimetric analysis of the organic pollutants in the membrane filtration process, the optical online monitoring of suspended particles in the intercepted solution, and scanning electron microscopy analysis of the membrane pore and membrane surface pollution, Jin Pengkang found that the smaller the intercepted molecular weight UF membrane, the more pollutants on the membrane surface, and the more serious the membrane pollution. After the measurements, the 150 kDa PVC UF membrane was finally selected for subsequent experiments.

3.1.3. Influence of pressure on UF

The influence of operating pressure on the flux and UF effect of the UF membrane was investigated while maintaining the feed temperature at 26–28 °C and the pH at 6–7. As shown in Figure 6, the membrane flux increased as the operating pressure of the UF membrane increased. When the pressure was 0.2 MPa, the maximum membrane flux exceeded 300 L/(h·m2), and was 77.78 L/(h·m2) after working for 30 min, which was better than the membrane flux at 0.1 MPar and 0.15 MPa. This was because UF technology used pressure as its driving force to separate the pollutants and wastewater. When the pressure increased, the driving force also increased.
However, when the operating pressure was too large, it also led to the rupture of membrane filaments, which affected the UF results. To make the UF membrane run efficiently and smoothly, 0.2 MPa was found to be the most suitable operating pressure for the membrane, because compared with 0.1 MPa and 0.15 MPa, 0.2 MPa had a larger internal and external pressure difference. As the transmembrane pressure difference increased, the membrane flux also increased. The subsequent determination of UF water turbidity and removal rate is shown in Figure 7.
The average removal rate of turbidity is more than 90%. The general pore size of the UF membrane is between 1 and 100 nm. For macromolecular organic matter larger than membrane pores in wastewater, suspended solids and colloidal particles can be separated, but for those smaller than membrane pores. Those organic matters and inorganic salt ions dissolved in wastewater cannot be completely removed, and further treatment is required for the salts and organic matters remaining in the wastewater.

3.1.4. Cleaning of the UF Membrane

After the long-term use of UF equipment for the UF treatment of tannery chromium removal from wastewater, we found that the membrane flux was significantly reduced, which was due to the accumulation of pollutants on the membrane surface during the long-term use of the UF membrane for filtration treatment, reducing the membrane flux. At this time, the UF membrane had to be chemically cleaned, and the pollutants on the membrane surface were collected for X-ray diffraction characterization. The characterization results are shown in Figure S1, which showed that the pollutants were mainly CaCO3.
Considering the influent pH requirements of the UF membrane, the hydrochloric acid solution with a concentration of 0.01 mol/L was selected for pickling. After acid washing was complete, excess hydrochloric acid on the membrane surface was cleaned with clean water. Then, the membrane surface was washed with NaOH solution and sodium hypochlorite solution using the same methods to remove residual organic pollutants and microorganisms.
After long-term use of the UF membrane, the minimum membrane flux was reduced to 48 L/(h·m2). The recovery degree of UF membrane flux after chemical cleaning is shown in Figure S2, where the minimum membrane flux was restored to 78 L/(h·m2), and the average membrane flux increased from 65–70 L/(h·m2) to 145–148 L/(h·m2). The UF membrane after chemical cleaning could continue being used, as regular chemical cleaning could not only improve the reduction of UF membrane flux, but also prolong its service life.

3.2. Multistage Concentration NF Experiment

To improve the recovery rate of wastewater as much as possible, multi-stage concentration was used to continuously concentrate the tanning and dechromed wastewater in the simulated industrial production process. The wastewater was continuously concentrated at an appropriate operating pressure, with a water temperature between 25–30 °C. The test scheme is shown in Table 4. The total recovery was controlled at about 90%, and a two-stage concentration was designed.

NF Primary Concentration

During the continuous operation of NF primary concentration tanning and chromium removal from the wastewater, the effects of operation time on the membrane flux, desalination rate, wastewater concentration rate, and concentrated freshwater TDS were investigated.
As shown in Figure 8, there were three main stages in the variation of membrane flux with time. First, 0–30 min was the beginning stage of NF, the surface of the NF membrane was relatively loose, and the membrane flux was also the largest for a period of time. At later times, the freshwater membrane flux decreased rapidly due to the gradual formation of a concentration polarization layer. Over the next 30–70 min, the membrane flux continued to show a downward trend; however, the decline rate decreased significantly. This was due to the decrease caused by the gradual deposition and adsorption of some solutes on the surface of the NF membrane.
After 70 min, the membrane flux gradually stabilized and fluctuated up and down overall. This was because the solutes in the wastewater were further deposited on the membrane surface, and the membrane flux passing through the NF membrane was stable. Finally, it fluctuated up and down at 13 L/(h m2). As shown in Figure 9 and Figure 10, during the NF process, the change in the desalination rate and concentration rate with time was not obvious.
During the process of continuous operation, the TDS content of concentrated water was maintained at about 23 g·L−1, and the TDS content of freshwater was below 0.4 g·L−1. The overall effect on the desalination rate and concentration rate of the concentrated water was good. After primary concentration, 75% of the wastewater was recycled, and the remaining 25% of the concentrated wastewater continued for secondary concentration.
After primary concentration treatment, 25% of the concentrated water still required further treatment. Secondary concentration of the wastewater was continued, and the primary concentration method continued to be used to control the concentration dilution ratio at 2:3. Thus, the effects of time on membrane flux, desalination rate, wastewater concentration rate, and concentrated freshwater TDS were investigated.
Figure 11 shows the change trend of membrane flux with increasing NF operation time. Compared to primary concentration, the initial membrane flux and membrane flux during the secondary NF concentration process showed an obvious downward trend. The flux decreased from 6.8 L/(h·m2) to 5.02 L/(h·m2), which was a large gap compared to the initial 16.6 L/(h·m2) value of primary concentration. This was because the salt content and organic matter content of the feed wastewater in the secondary NF concentration process were higher than those in the primary concentration process, and more pollutants affected the NF membrane, thus affecting the decline of the membrane flux.
As shown in Figure 12 and Figure 13, the desalination and concentration rates of the wastewater were stable over time. When concentrating the concentrated water of the primary NF, the TDS fluctuation range of the concentrated freshwater was not large, and the TDS of the concentrated water was maintained at 44 g·L−1, while the freshwater was less than 1.1 g·L−1. Several groups of experiments proved that NF could effectively concentrate the tannery chromium removal wastewater, where the total recovery of wastewater was about 90%, and the TDS of the concentrated water reached about 44 g·L−1.

4. Desalting Stage by ED

The wastewater after secondary concentration by NF contained a large number of inorganic salts and organic substances. After analysis and titration, the inorganic salts in the wastewater were mainly Na2SO4 and NaCl, and the Na2SO4 content reached 25 g·L−1 while the NaCl content reached 13.5 g·L−1. The inorganic salts in the wastewater were extracted and utilized as resources, while the wastewater was desalinated by ED technology. The limiting current of the ED system was measured, and the influence of voltage and circulating flow on the recovery rate of inorganic salts was investigated. Two-stage ED was performed on the SO42− that could not be removed.

4.1. Determination of Limiting Current

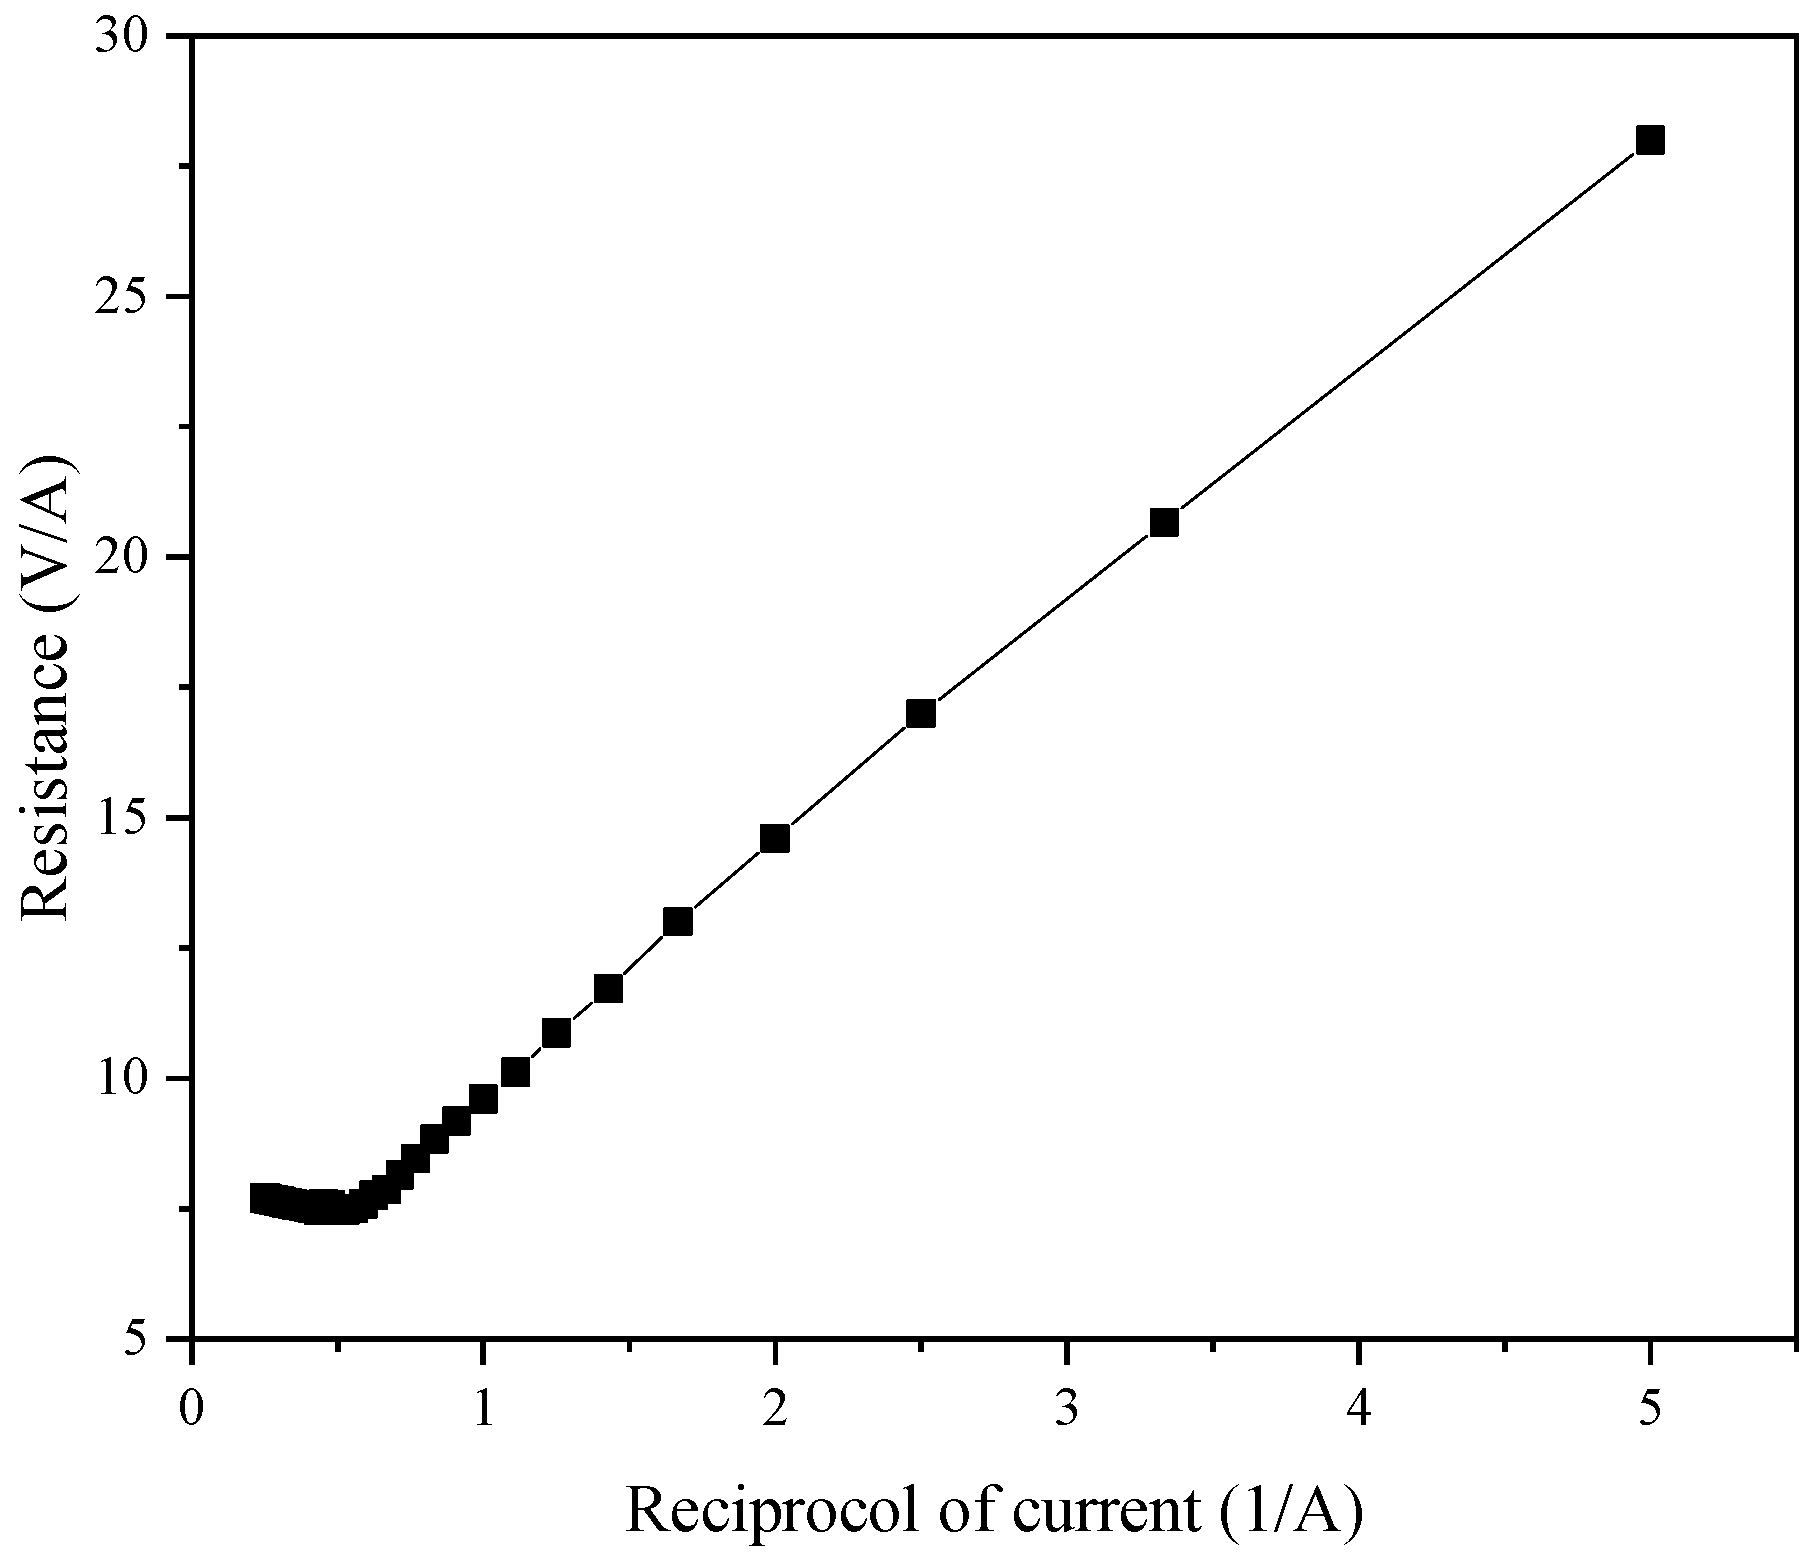
One of the most important parameters in ED applications involves the limiting current. Because the current affects the performance of the ED system, the selection of the limiting voltage and limiting current is very important, and the limiting current will be affected by the plate and membrane specifications. To measure the limiting current, commonly used methods include the voltage–current method, the current-effluent pH value method, and the resistance–current method. After comprehensive consideration, in this experiment, we adopted the resistance–current method to measure the limiting current, and 22 pairs of common anion and cation exchange membranes were used.
The polar liquid consisted of 5% Na2SO4 solution, where the concentration chamber contained 15% NaCl solution, and the thin chamber contained NF concentrated water to measure the limit voltage. The actual operation of the experiment finally obtained the current and voltage curve as shown in Figure 14. The extreme point was the limit current point, and after measurements, the limit voltage and limit current were 22 V and 4.0 A, respectively. However, after consulting the literature, we found that the limit current was not one constant, but varies with the working conditions and working time of the ED process.

4.2. Influence of Operating Conditions on ED

4.2.1. Influence of Voltage on ED

The concentrated NF water was placed into the ED desalination chamber, and the conductivity changed with time under the four constant applied voltages. As shown in Figure 15, the TDS of the desalination chamber decreased exponentially with time under different voltages. The main reason was that the solution in the desalination chamber was electrolytically separated under the action of voltage. When operating ED under the different applied voltages, we observed certain differences in the conductivity of the desalination chamber, with a high ion migration rate under a voltage of 25 V.
When the voltage continued to increase, the energy consumption increased, resulting in certain energy loss and heat. When the temperature was too high, it also had an adverse impact on the ED membrane, shortening the service life of the membrane. As shown in Figure 16, we found that there were also significant differences in the overall desalination rate of the desalination chamber under different voltages. When the voltage was 15 V, the overall desalination rate was only 37.2%; however, when the voltage increased to 27 V, the desalination rate reached 52.2%, and the recovery rate of inorganic salt in the NF concentrated water increased by 15%.
This showed that with an increase in voltage, the current increased. Due to the constant membrane area and current density, the transmembrane migration of ions in the desalination chamber to the concentrated chamber increased. Thus, the recovery rate of inorganic salts improved. At this time, most salts in the concentrated water were recovered. As shown in Figure 17, the chloride in the concentrated water was essentially removed, and the rest was basically sulfate. The reason for the analysis is that the properties of different ions are different, indicating that under different voltages, the removal rate of Cl is faster than that of SO42−, and Cl can be removed more effectively at the same time.

4.2.2. Effect of Feed Flow on ED

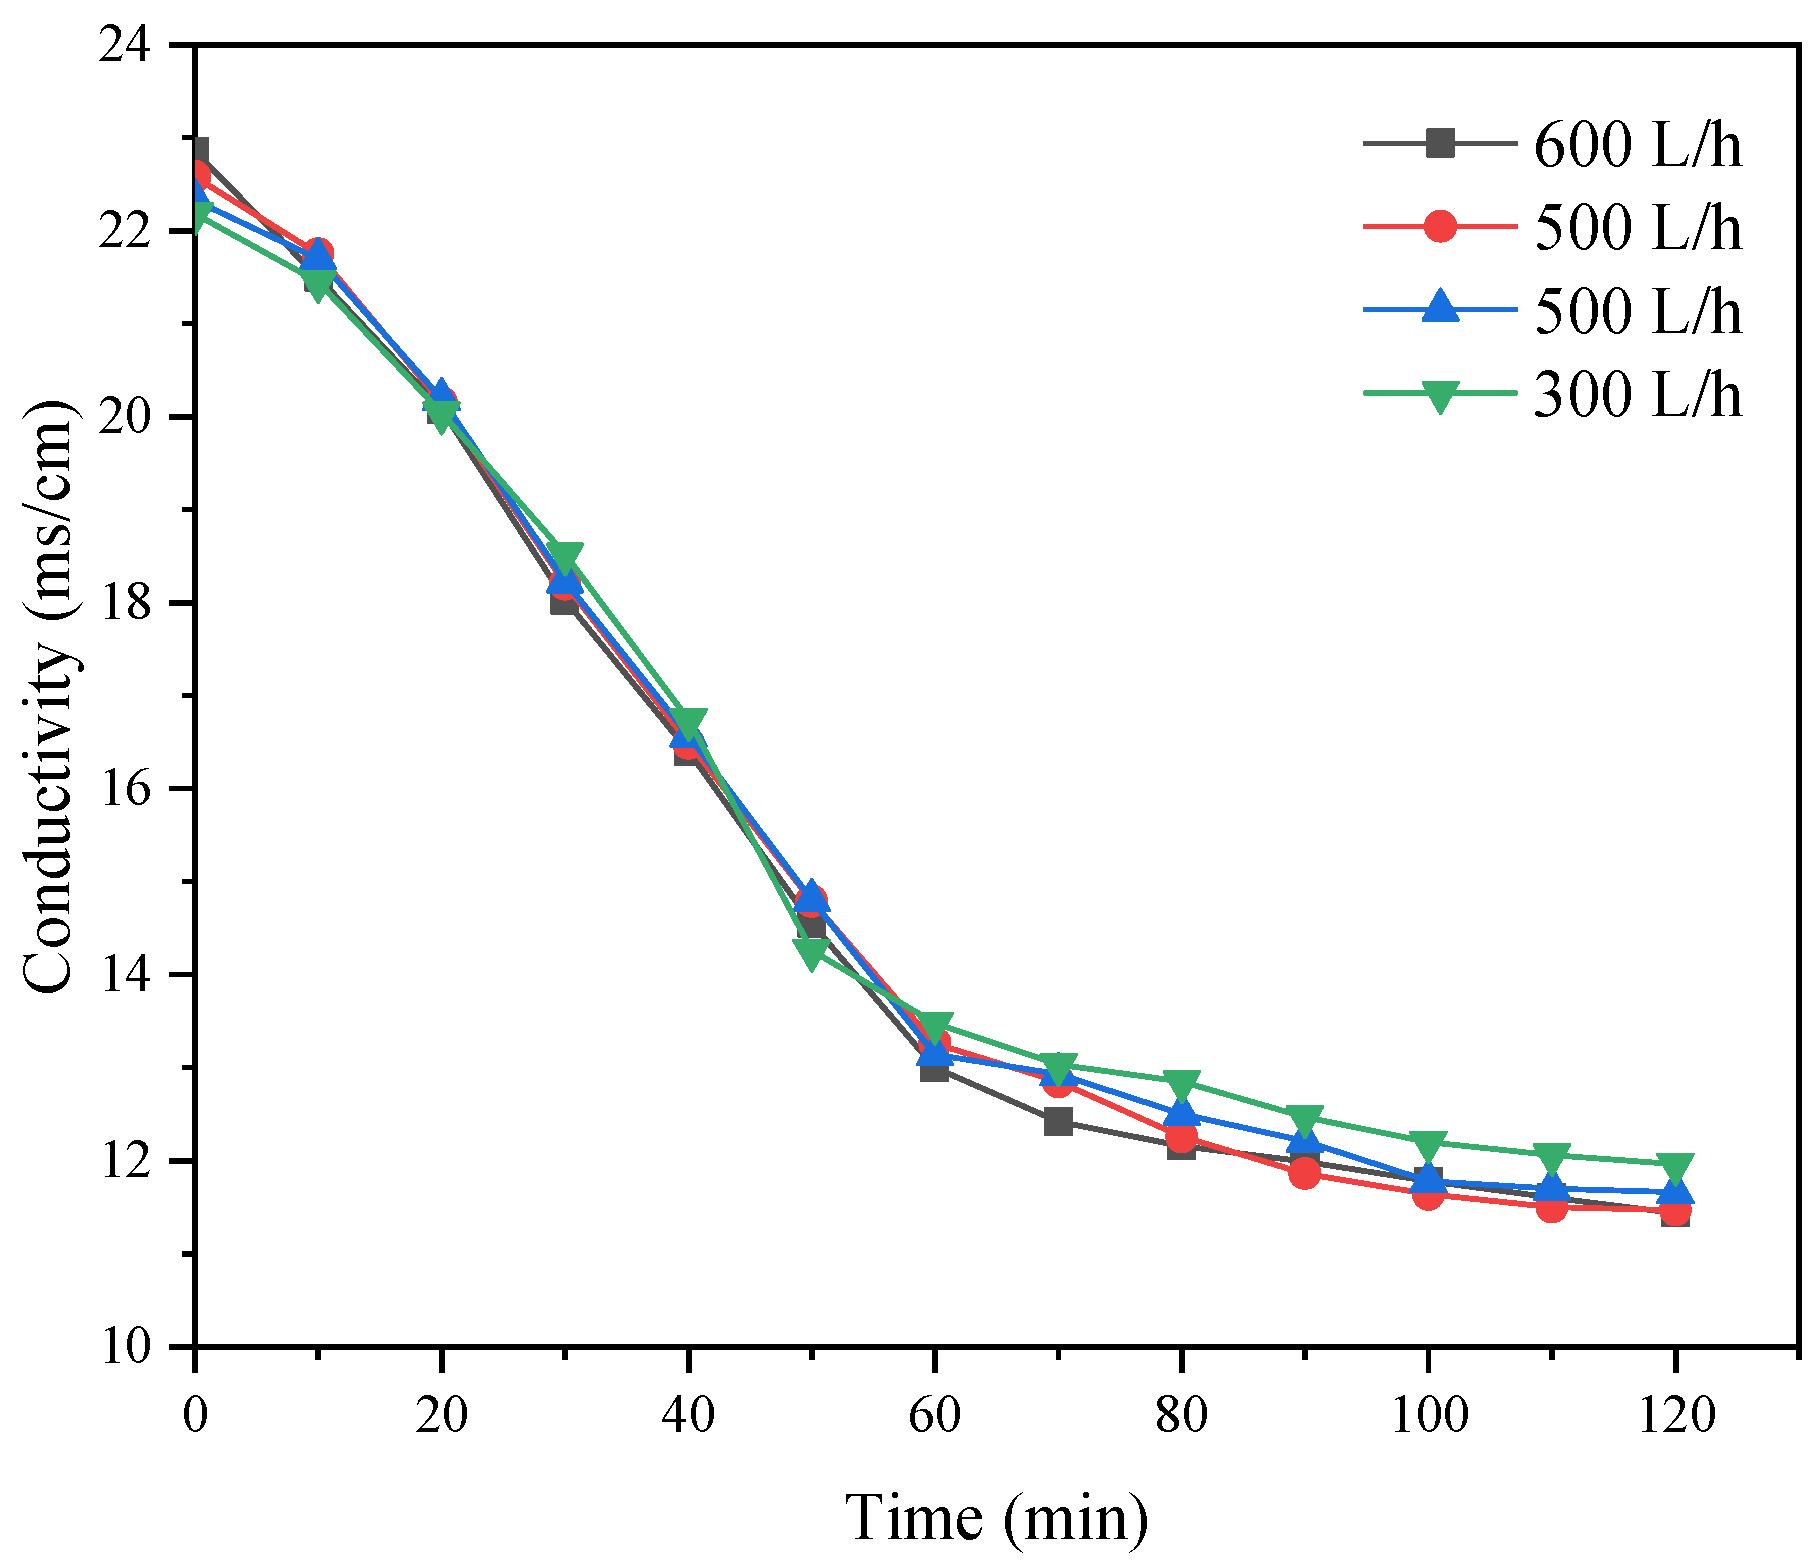
Theoretically, the feed flow can improve desalination efficiency, but this improvement will be limited. Therefore, the operating flow had to be determined and controlled within an appropriate range. In the experiment, the voltage was fixed at 25 V to carry out the research experiments with different feed flow rates. To reduce the influence of differential pressure leakages, the flow rate of the concentration chamber was maintained at 1:1, and in all experiments, the flow rate of the pole chamber remained unchanged. As shown in Figure 18, we observed that increasing the feed flow had little effect on the desalination effect of the desalination chamber, and the conductivity of the desalination chamber was in the range of 11.44–11.96 ms/cm after 120 min.
At 2 h, the conductivity of the desalination chamber reached the lowest value, and the desalination rate reached a maximum value of 49.93%. When the influent flow was too small, the ion migration rate per unit time accelerated; however, the membrane surface flow rate was too small, and the ion migration amount could not be replenished, resulting in a low desalination rate in the desalination chamber. The mass concentration of the mixed salt and relative concentration rate of the mixed salt was reduced. If the flow velocity of the membrane surface was too large, the ions in the thin chamber would leave the thin chamber because the flow velocity of the membrane surface was too large, and the mass concentration of the mixed salt and relative concentration of the mixed salt rate would cause a reduction.

4.3. Experimental Study on Two-Stage ED

After a period of ED treatment, most sulfates still could not pass ED treatment. After consulting the literature, we found that the temperature had a certain impact on the desalination efficiency of ED. After increasing the temperature to about 31 °C in the desalination chamber, the limiting voltage and current of the water produced in the light chamber after a period of ED treatment were remeasured.
According to Figure 19, the limit voltage of two-stage ED was 16 V, and at this time, the current did not exceed 1.0 A. Compared to the limit current and voltage of one-stage ED, this was mainly due to the decrease in salt content in the wastewater and the change in wastewater quality. On this basis, the other conditions remained unchanged. Second stage ED was conductedon the wastewater after primary desalination, and the sulfate content in the light chamber was measured. As observed in Figure 20, SO42− was further removed after the temperature increased, SO42− in the overall dilute chamber decreased from 12.28 to 7.13 g·L−1, and the overall desalination rate also increased to 61.9%.
This is because the ion hydration is inhibited at a higher temperature, the viscosity of the liquid is reduced, and the speed of ion movement is improved. At higher temperature, the conductivity of the ion-exchange membrane increases and the hydration of the counter-ion weakens, which is also beneficial to the electrodialysis. If the temperature is too high, the performance and life of the membrane will be affected.

5. Conclusions

Aiming for the advanced treatment and recycling of tannery wastewater after chromium removal, a new coupling process of flocculation membrane separation technology was proposed. We also investigated the effects of different operating conditions on the overall treatment effect of tannery chromium removal wastewater, and the process conditions were optimized. Our experimental conclusions are as follows.
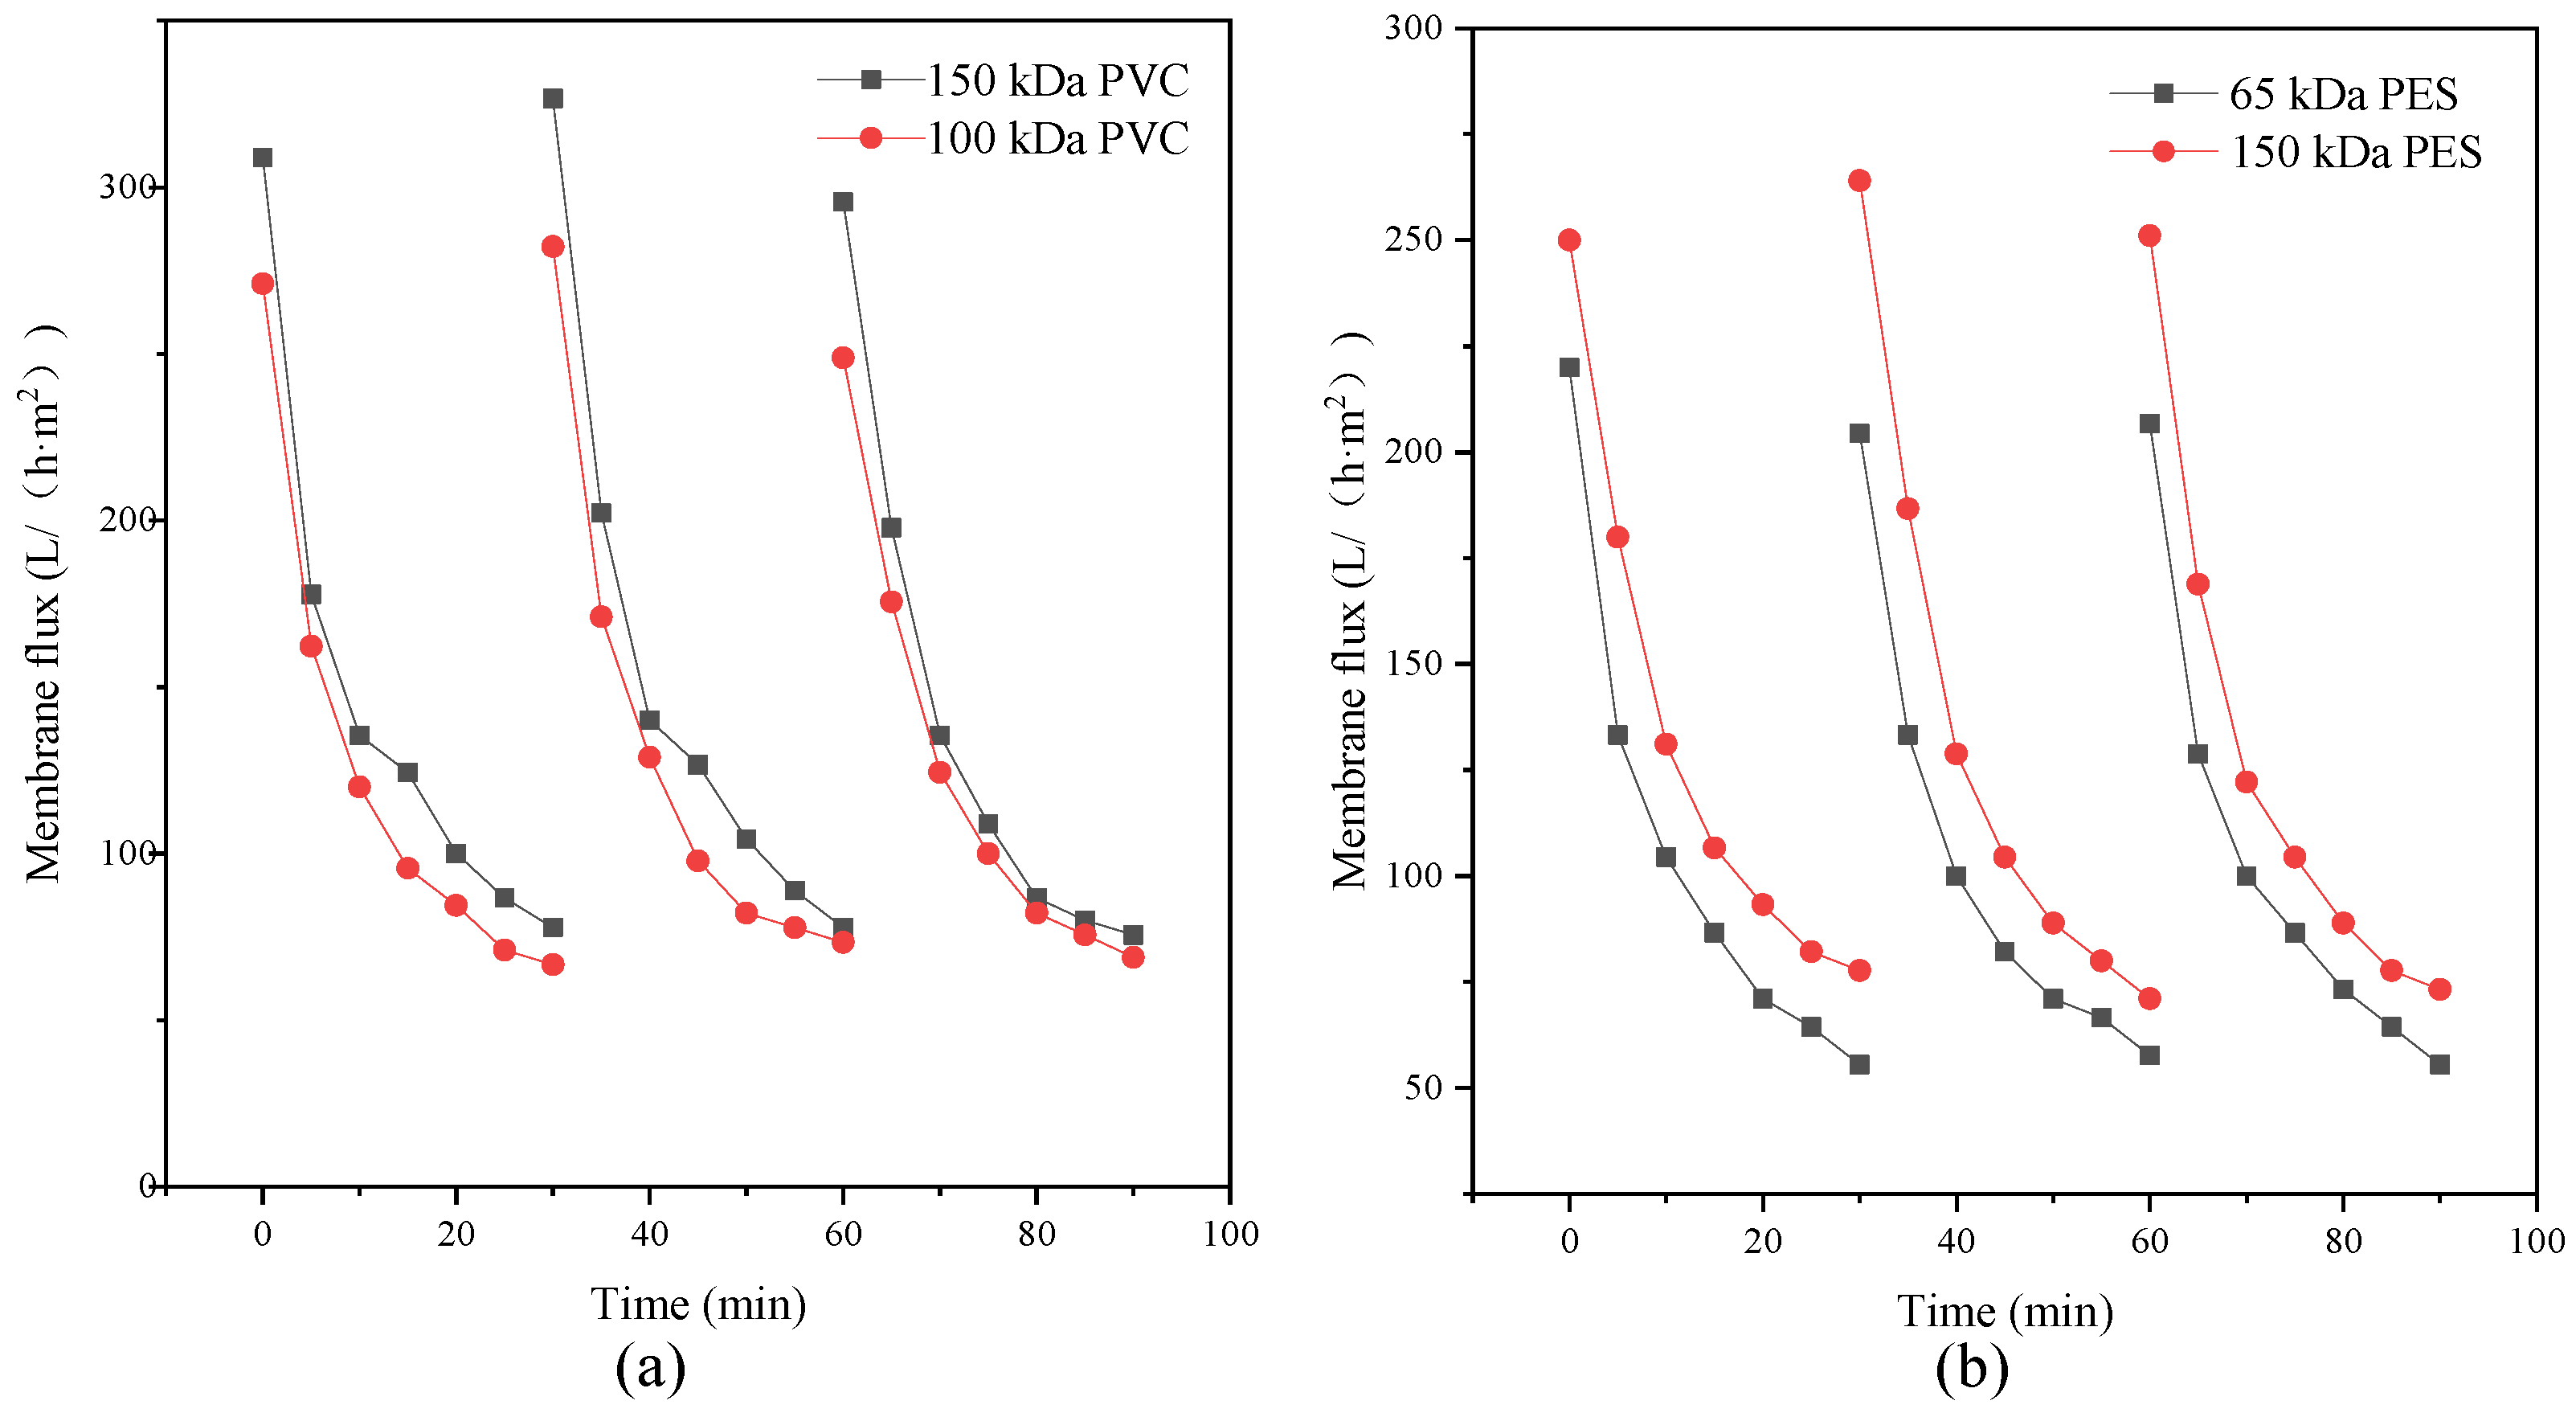
The type of flocculant, the amount of addition and the use of pH all have a certain influence on the flocculation effect. According to this experimental study, the combination of 1‰ PAC + PAM achieved the best effect under the condition of pH = 8. The comparison results of the four UF membrane modules show that the PVC UF membrane with a larger molecular weight cutoff had a greater flux effect. The membrane flux in the UF process increased with the increase of the pressure; however, the excessive pressure also caused the membrane filaments to rupture. The turbidity, chroma and COD removal rates of the pretreated wastewater were 96.5%, 53.7% and 45.8%, respectively.
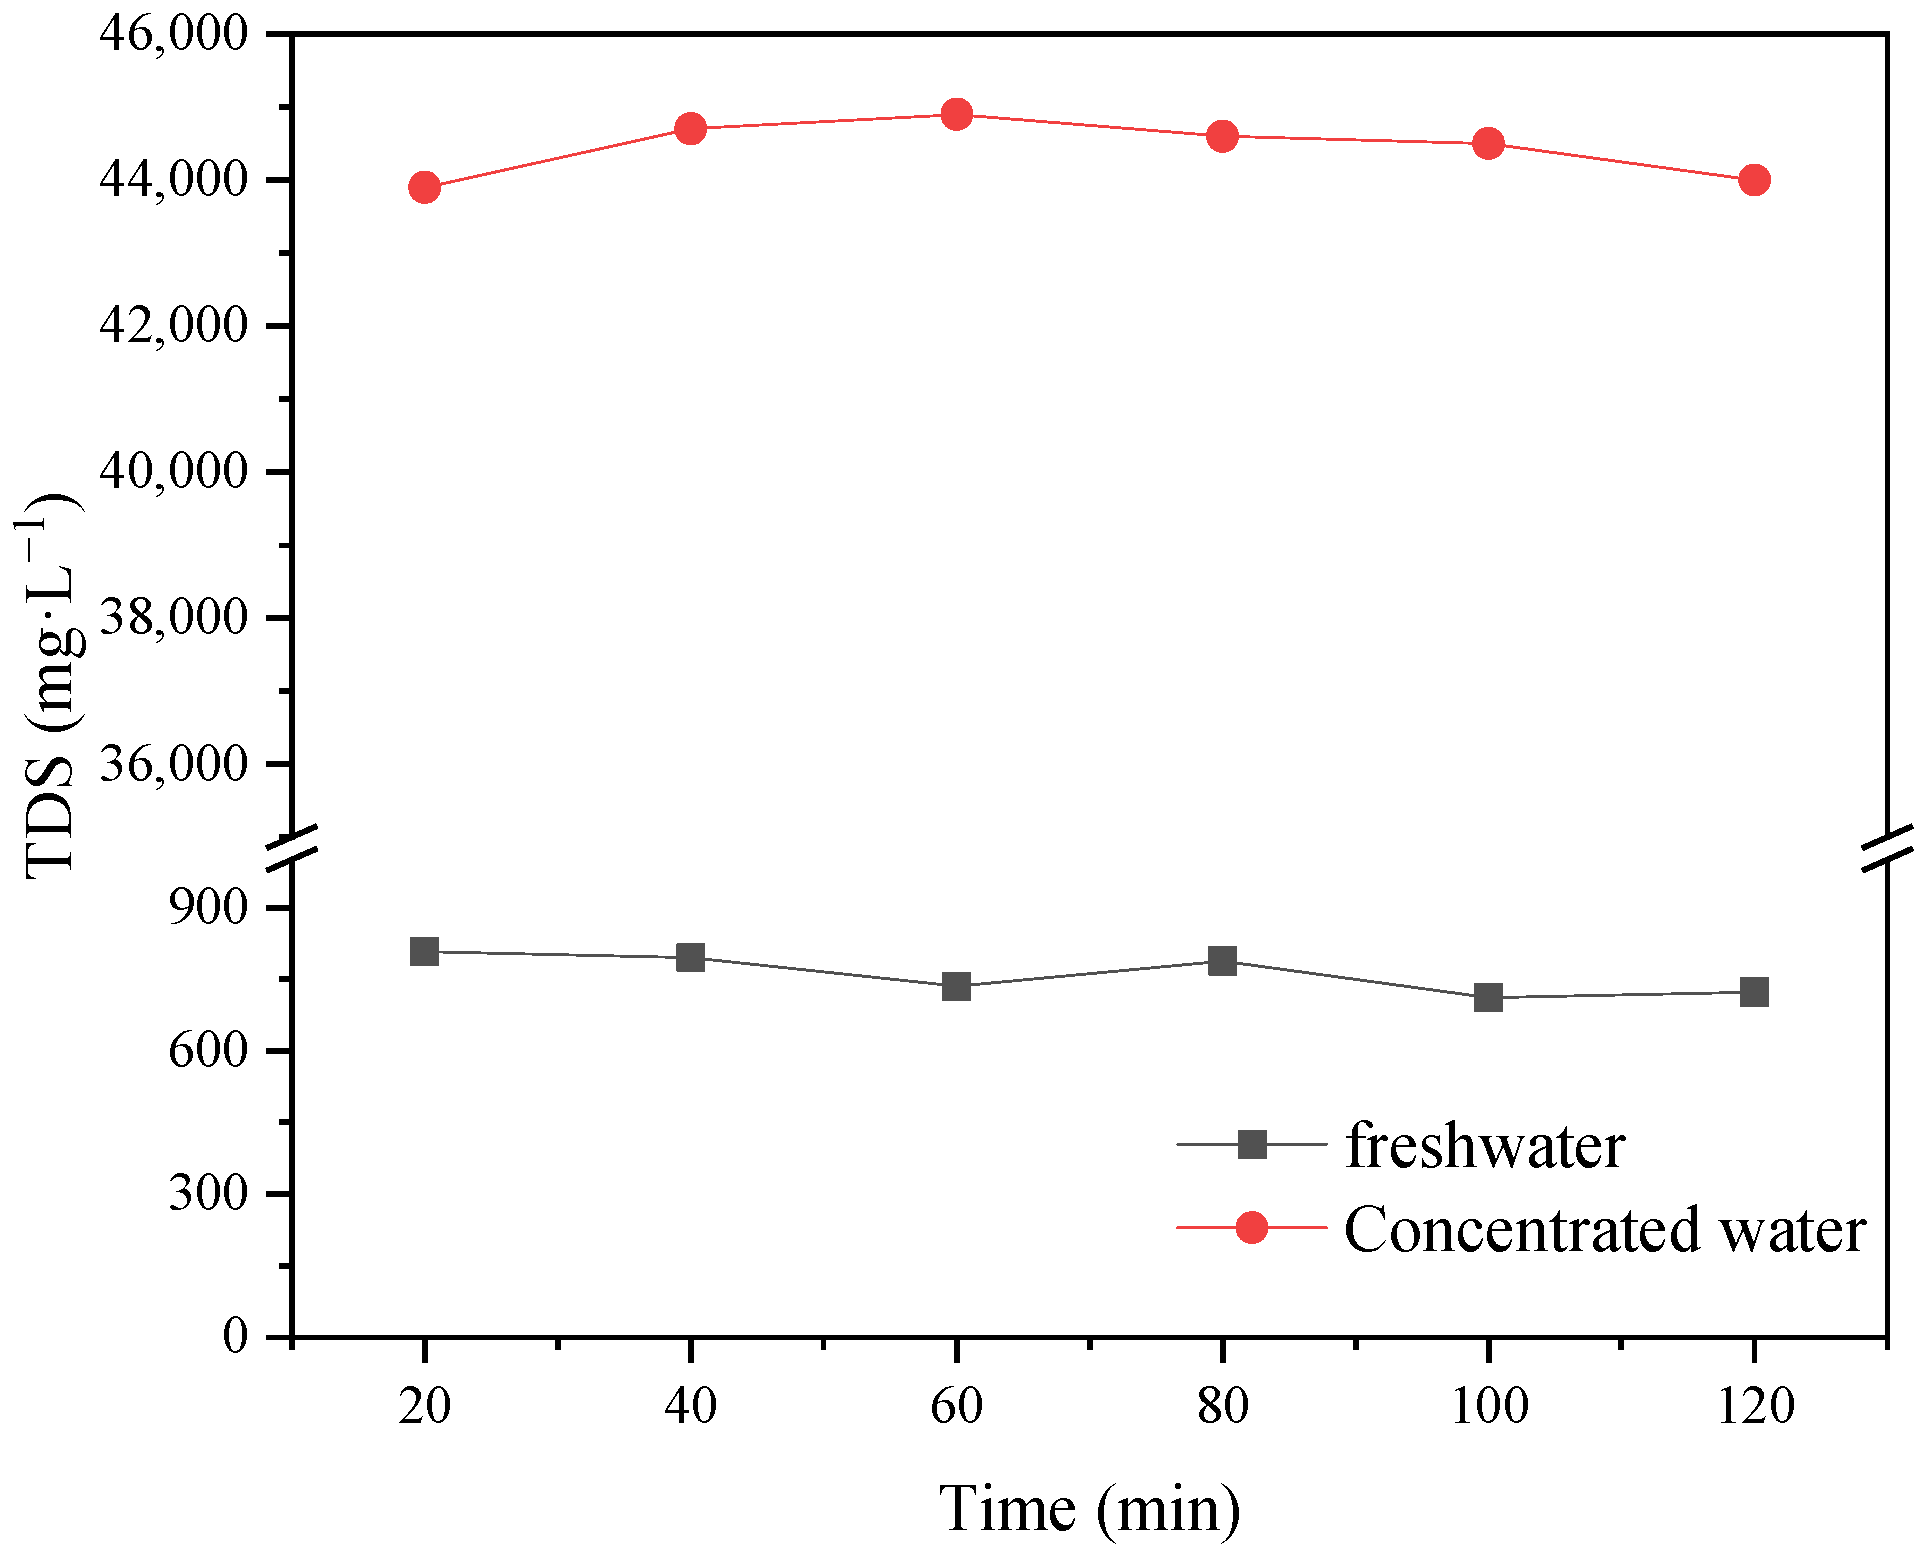
The operating pressure and feed temperature are the key factors affecting the recovery rate and ion interception rate of NF-produced water. The recovery rate of fresh water after two-stage concentration was 90%, and the TDS of concentrated wastewater was more than 36,000 mg·L−1. The operating voltage and circulating flow rate had clear effects on the desalination rate of ED. The desalination rate of two-stage ED reached 61.9%. The results show that this new coupling process can realize the efficient reuse of chromium removal from tannery wastewater.

Supplementary Materials

The following supporting information can be downloaded at: https://www.mdpi.com/article/10.3390/pr10061134/s1, Figure S1. X-ray diffraction patterns of the contaminants on the membrane surface, Figure S2. UF membrane flux before and after chemical reflux.

Author Contributions

Conceptualization, Z.L. and M.L.; methodology, Z.L.; software, Z.L.; validation, Z.L., G.C. and J.Y.; formal analysis, M.L.; investigation, Z.L., resources, J.Y.; data curation, Z.L.; writing—original draft preparation, Z.L.; writing—review and editing, Z.L. and J.Y.; supervision, J.Y.; project administration, J.Y. All authors have read and agreed to the published version of the manuscript.

Funding

This study was supported by the National Key Research and Development Programe of China (2016YFB0600504). The research was also supported by the Science and Technology of Quanzhou City, Fujian Province, China (2019C107).

Conflicts of Interest

The authors declare no conflict of interest.

References

  1. Paltahe, A.; Cornelius, T.; Sambo, B. Physico-Chemical Characterization of Local Tannery Waste Water Before and After Floculation Treatment. Int. J. Chem. 2019, 11, 77. [Google Scholar] [CrossRef] [Green Version]
  2. Ramees Raja, H.A.; Aneez, M.M. A study on the physico-chemical characteristics of Tannery Waste Water at Tiruchirappalli district. Int. J. Res. Pharm. Sci. Technol. 2019, 10, 2417–2425. [Google Scholar] [CrossRef] [Green Version]
  3. Souza, E.A.; Silva, L.A.; Cerqueira, U.M.F.M. Comparative study of various advanced oxidation processes for the treatment of tannery wastewater. Desalin. Water Treat. 2020, 181, 88–97. [Google Scholar] [CrossRef]
  4. Kaplan-Bekaroglu, S.S.; Gode, S. Investigation of ceramic membranes performance for tannery wastewater treatment. Desalin. Water Treat. 2015, 57, 17300–17307. [Google Scholar] [CrossRef]
  5. Fazal, S.; Zhang, B.P. Membrane Separation Technology on Pharmaceutical Wastewater by Using MBR (Membrane Bioreactor). J. Environ. Prot. 2015, 6, 299–307. [Google Scholar] [CrossRef] [Green Version]
  6. Leiknes, T. The effect of coupling coagulation and flocculation with membrane filtration in water treatment: A review. J. Environ. Sci. 2019, 21, 8–12. [Google Scholar] [CrossRef]
  7. Li, H.L.; Guo, X.N.; Qiu, R.B. Application of double membrane method in advanced treatment and reuse of leather wastewater. Water Treat. Technology. 2012, 38, 132–135. [Google Scholar]
  8. Hang, X.F.; Liu, W.; Wan, Y.H. Study on treatment of fiber dyeing wastewater by NF ED. Water Treat. Technol. 2020, 46, 84–88. [Google Scholar]
  9. Streit, K.F.; Gerevni, G.G.; Rodrigues, M.A.S. ED in an Integrated NF/ED Process for Water Recovery in the Leather Industry. Sep. Sci. Technol. 2013, 48, 445–454. [Google Scholar] [CrossRef]
  10. Mujahid, A.; Godwill, K. The Removal of Selected Inorganics from Municipal Membrane Bioreactor Wastewater Using UF/NF/RO Membranes for Water Reuse Application: A Pilot-Scale Study. Membranes 2021, 11, 117. [Google Scholar]
  11. Iva, Ć.; Davor, D.; Klara, K. Textile wastewater reusability in knitted fabric washing process using UF membrane technology. J. Cleaner Prod. 2021, 299, 126899. [Google Scholar]
  12. Racar, M.; Dolar, D. Application of UF/NF/RO membranes for treatment and reuse of rendering plant wastewater. Process Saf. Environ. Prot. 2017, 105, 386–392. [Google Scholar] [CrossRef]
  13. Hashlamon, A.; Mohammad, A.W.; Ahmad, A. The effect of wastewater pretreatment on NF membrane performance. J. Water Reuse Desalin. 2017, 7, 45–52. [Google Scholar] [CrossRef] [Green Version]
  14. Sun, X.F.; Wang, C.W.; Li, Y.B. Treatment of phenolic wastewater by combined UF and NF/RO processes. Desalination 2015, 355, 68–74. [Google Scholar] [CrossRef]
  15. Vergili, I.; Gencdal, S. Applicability of combined Fenton oxidation and NF to pharmaceutical wastewater. Desalin. Water Treat. 2015, 56, 3501–3509. [Google Scholar] [CrossRef]
  16. Lafi, R.; Gzara, L.; Harfiane, A. Treatment of textile wastewater by a hybrid UF/ED process. Process Intensif. 2018, 132, 105–113. [Google Scholar] [CrossRef]
  17. Jan, H.; Hana, F.; Tomáš, J. ED-based zero liquid discharge in industrial wastewater treatment. Water Sci. Technol. 2019, 79, 1580–1586. [Google Scholar]
  18. Gally, C.R.; Benvenuti, T. ED for the tertiary treatment of municipal wastewater: Efficiency of ion removal and ageing of ion exchange membranes. J. Environ. Chem. Eng. 2018, 6, 5585–5869. [Google Scholar] [CrossRef]
  19. Wang, Q.; Gao, X.L.; Zhang, Y.S. Hybrid RED/ED system: Simultaneous osmotic energy recovery and desalination of high-salinity wastewater. Desalination 2017, 405, 59–67. [Google Scholar] [CrossRef]
  20. Liu, J.; Yuan, J.S.; Ji, Z.Y. Concentrating brine fromseawater desalination process by NF–ED integrated membrane technology. Desalination 2016, 390, 53–61. [Google Scholar] [CrossRef]
Figure 1. Process flow chart of tanning chromium removal wastewater treatment.
Processes 10 01134 g001
Figure 2. Effect of pH on the COD and chroma removal rate: (a) COD and (b) chroma.
Processes 10 01134 g002
Figure 3. Effect of PAC addition on the flocculation results.
Processes 10 01134 g003
Figure 4. Variations in membrane flux with time: (a) PVC and (b) PES.
Processes 10 01134 g004
Figure 5. Variations in membrane flux with time for the different MWCO UF membranes.
Processes 10 01134 g005
Figure 6. Effect of operating pressure on the membrane flux.
Processes 10 01134 g006
Figure 7. Removal effect of UF on turbidity.
Processes 10 01134 g007
Figure 8. Effect of time on the freshwater membrane flux of NF.
Processes 10 01134 g008
Figure 9. Effect of time on the desalination and concentration rates.
Processes 10 01134 g009
Figure 10. Effect of time on TDS.
Processes 10 01134 g010
Figure 11. Effect of time on the TDS of concentrated freshwater.
Processes 10 01134 g011
Figure 12. Effect of time on the desalination and concentration rates.
Processes 10 01134 g012
Figure 13. Effect of time on TDS.
Processes 10 01134 g013
Figure 14. Limit current measurement curve.
Processes 10 01134 g014
Figure 15. Conductivity of the fresh cells with different voltage changes with time.
Processes 10 01134 g015
Figure 16. Variations in desalination rate (a) and TDS (b) under different voltages.
Processes 10 01134 g016
Figure 17. Ion content after desalination under different voltages.
Processes 10 01134 g017
Figure 18. Diagram of conductivity changes with time of the fresh cell at different flow rates.
Processes 10 01134 g018
Figure 19. Two-stage ED limit current measurement curve.
Processes 10 01134 g019
Figure 20. Change curve of SO42− content in two-stage ED with time.
Processes 10 01134 g020
Table 1. Properties of the UF membranes.
Parameterabcd
MaterialPESPESPVCPVC
MWCO (KDa)65150100150
Membrane area (m2)4.54.54.54.5
Pure water flux (L/m2·h)>150>500>100>150
Operational pressure (MPa)>0.8>0.8>0.8>0.8
Range of feed pH2–132–132–132–13
Operational pressure (°C)1–801–805–405–40
Table 2. The main ion content of the wastewater.
Raw WaterIons Content (mg·L−1)
Ca2+Mg2+SO42ClNa+
250–280100–1201500–16001900–20001500–160
Table 3. Characteristics of the raw water.
Raw WaterCOD
(mg·L−1)
Conductivity (ms/cm)TDS
(mg·L−1)
Turbidity (NTU)ChromapH
1000–15005–75800–690015–26600–10006–7
Table 4. NF multistage concentration experimental scheme.
Index ItemsPrimary ConcentrationSecond Concentration
Recycling rates (%)7560
Operating pressure (MPa)
Feed temperature (°C)
TDS of the feed wastewater (mg·L−1)
Membrane flux (L/(h·m2))
2–2.52.6–3
27.227.2
5500–580020,000–24,000
15–165.0–6.2
Publisher’s Note: MDPI stays neutral with regard to jurisdictional claims in published maps and institutional affiliations.

