
Seeds as Potential Sources of Phenolic Compounds and Minerals for the Indian Population

 ,
,  and
and 
Abstract
1. Introduction
2. Results and Discussion
2.1. Physicochemical Characteristics
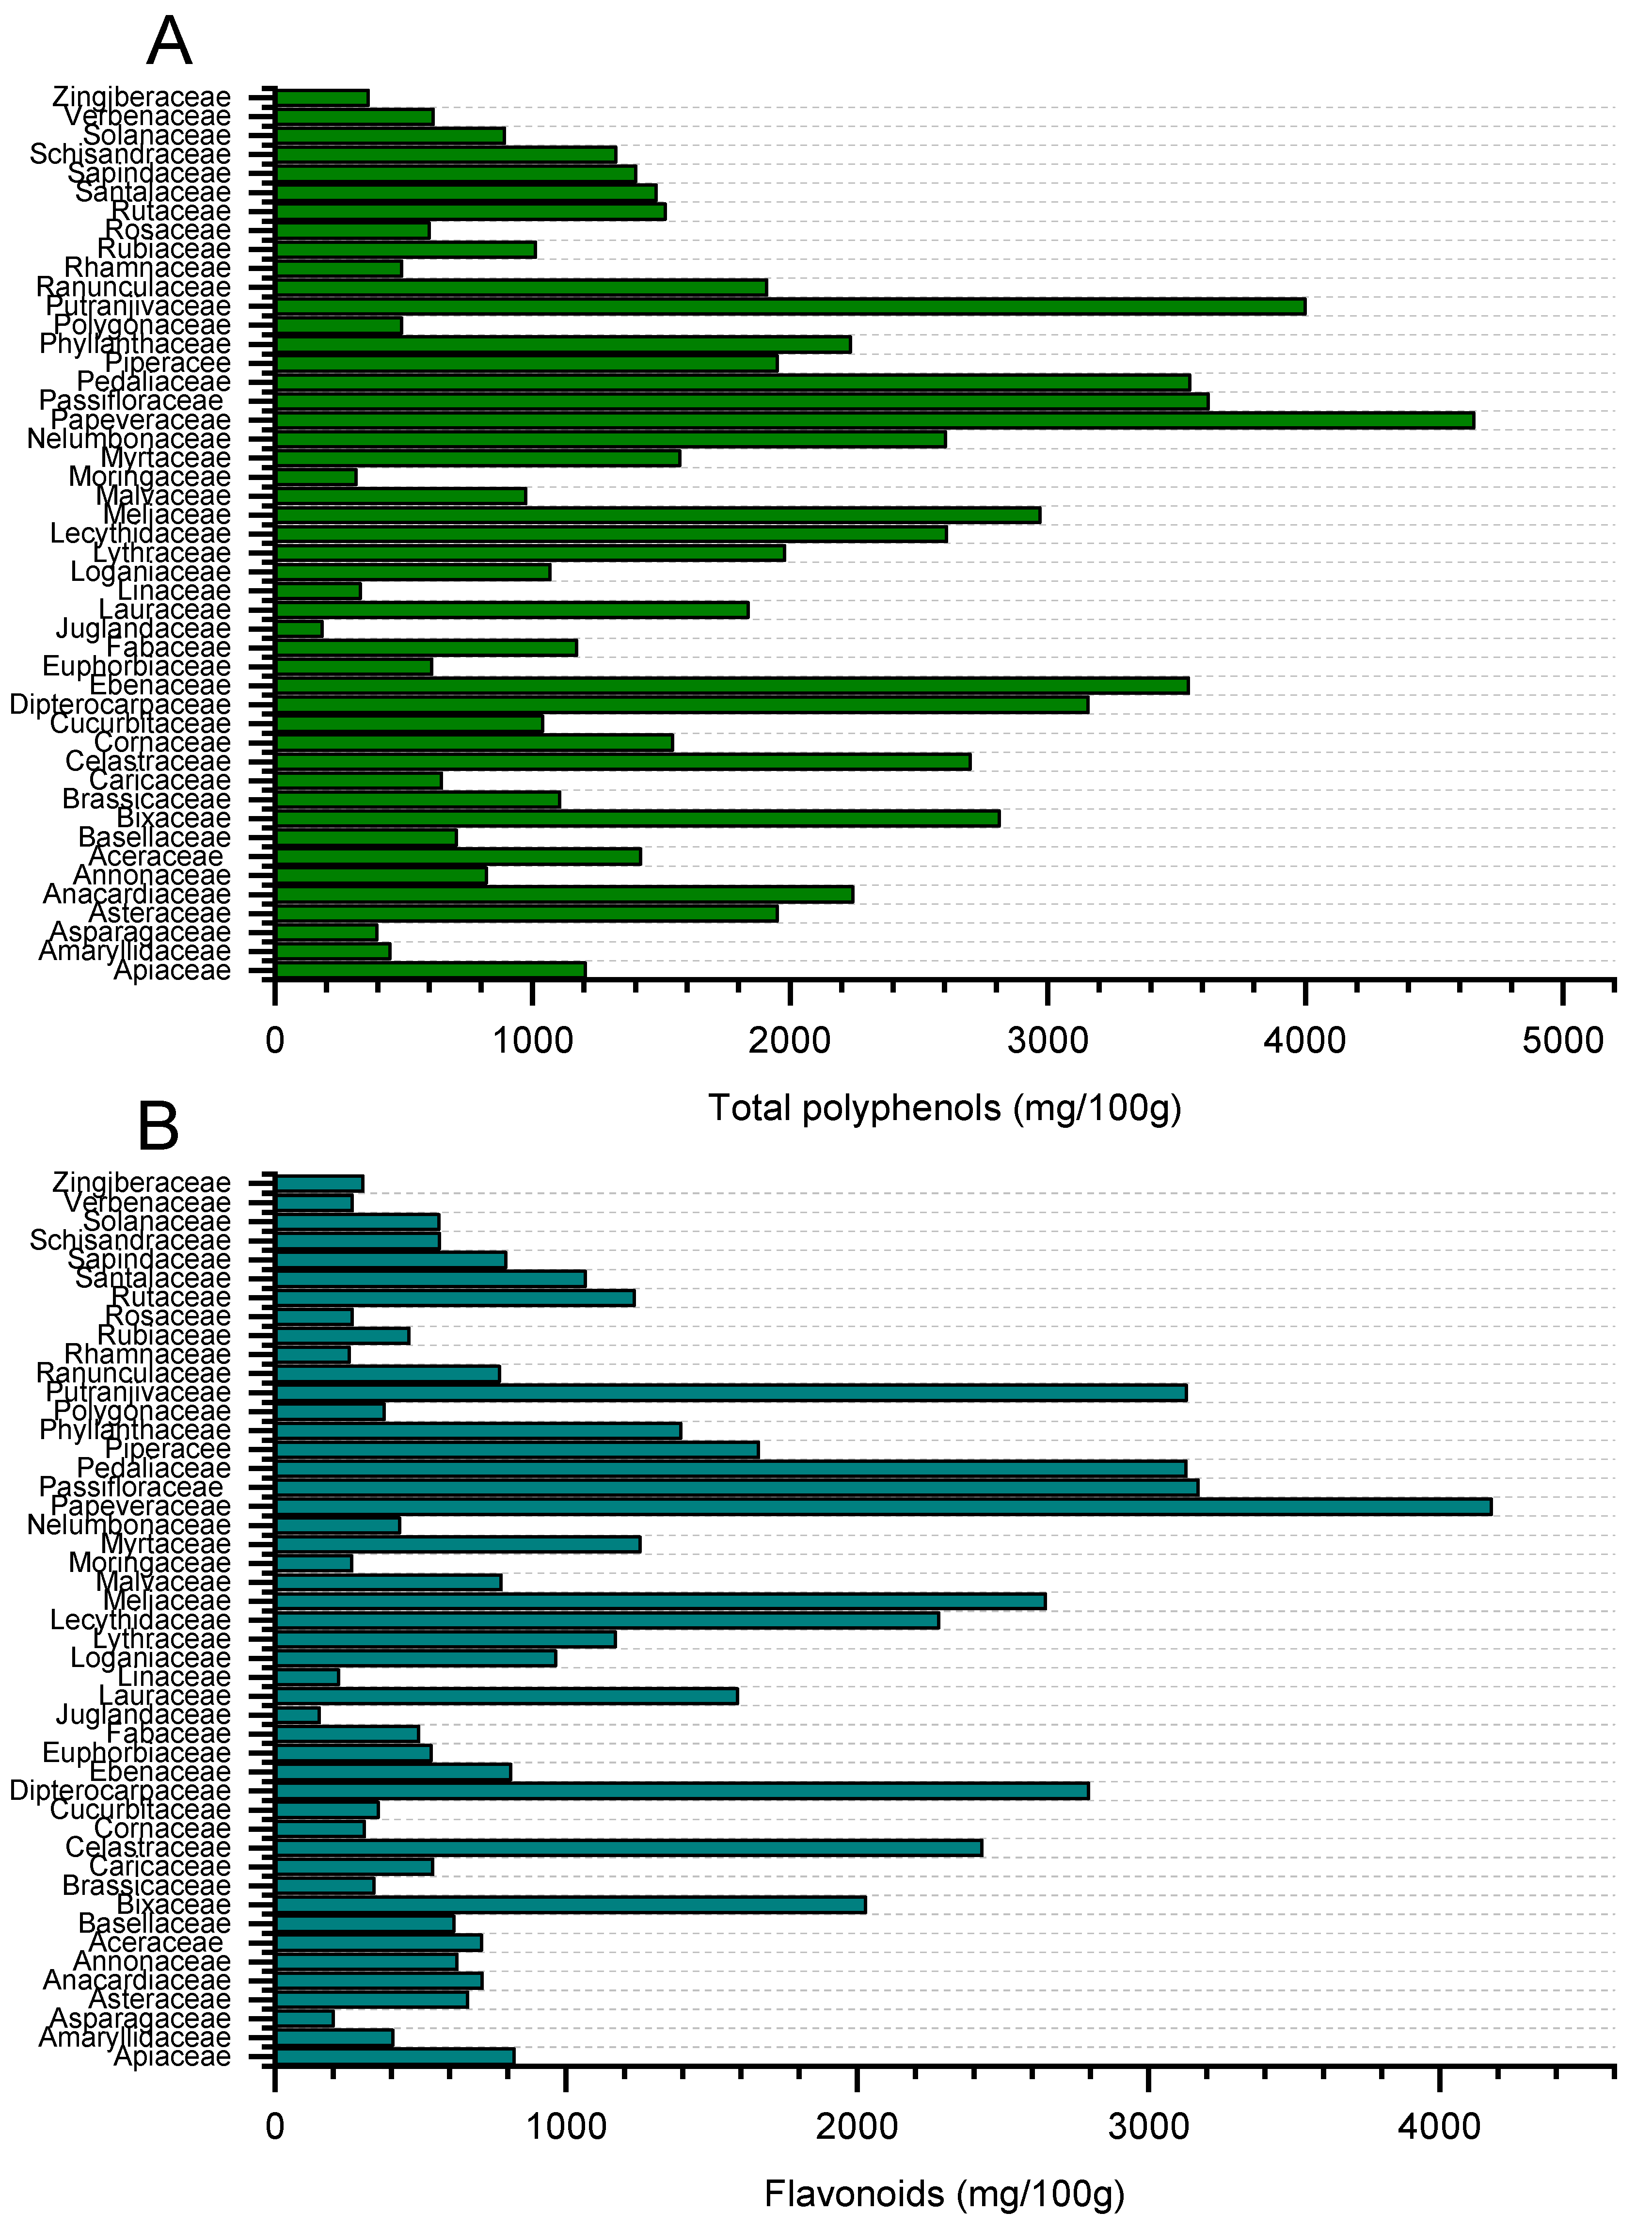
2.2. Polyphenol Contents
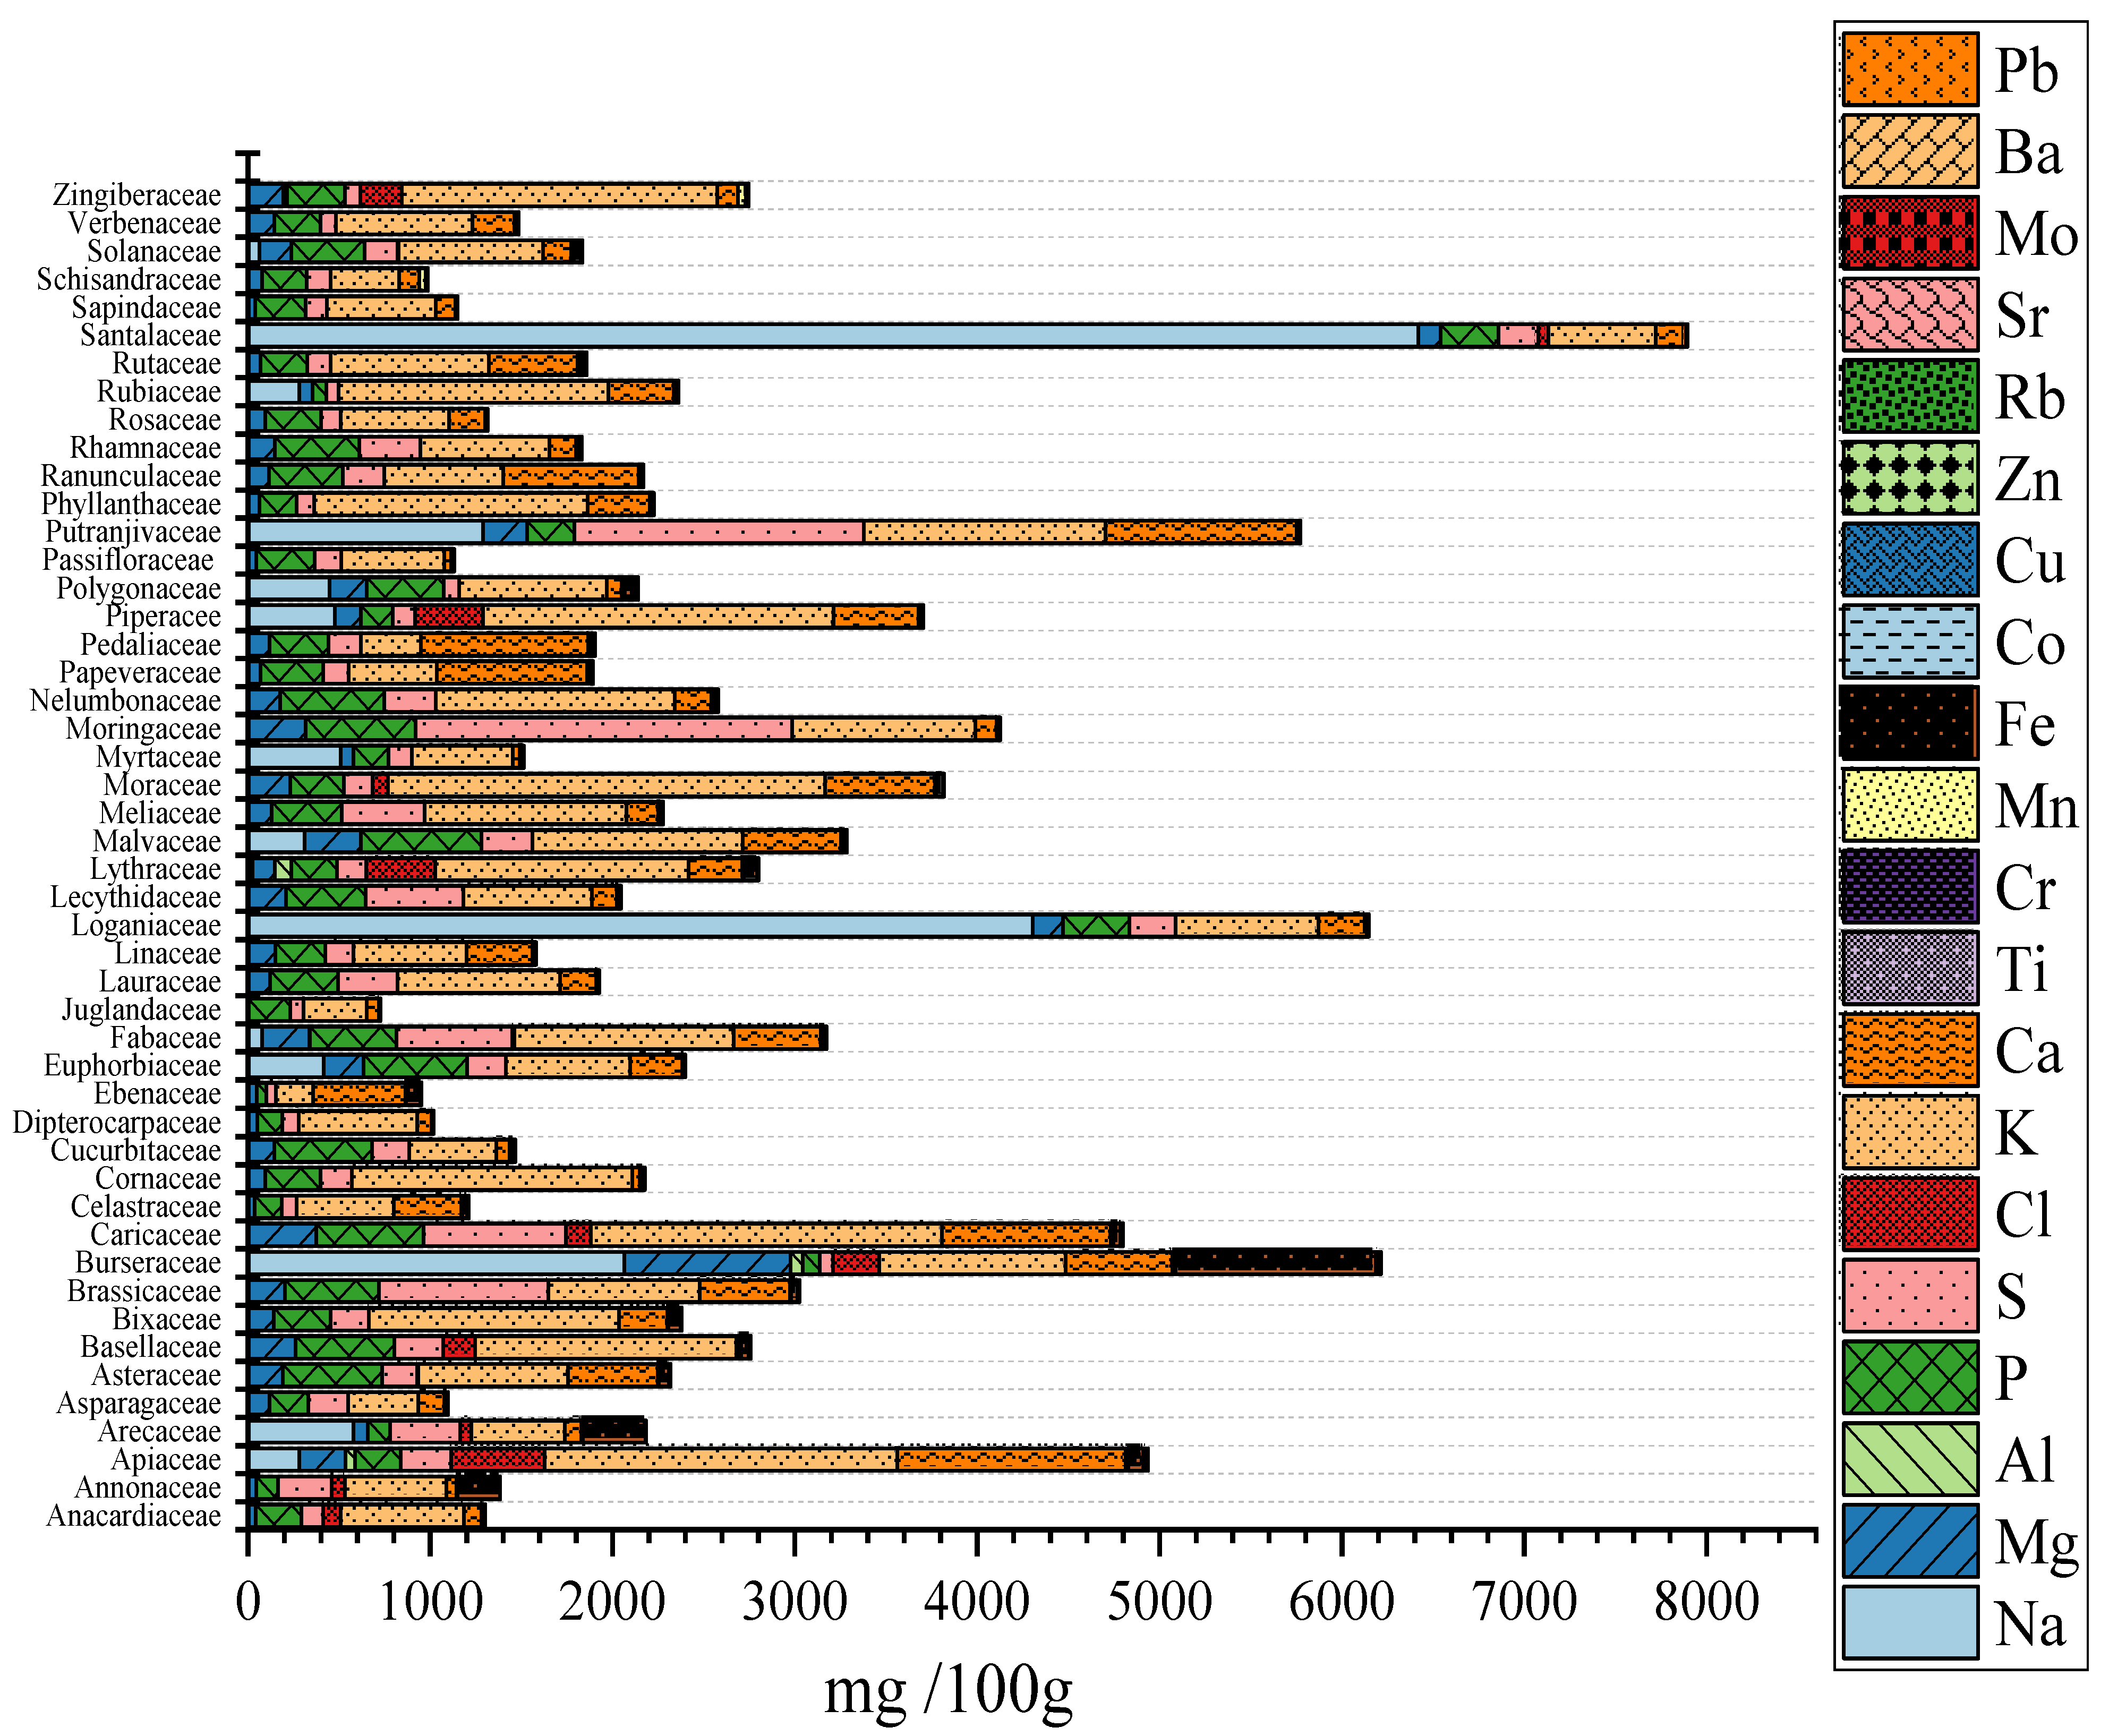
2.3. Mineral Contents
2.4. Variations in Mineral Levels as a Function of Plant Type and Family
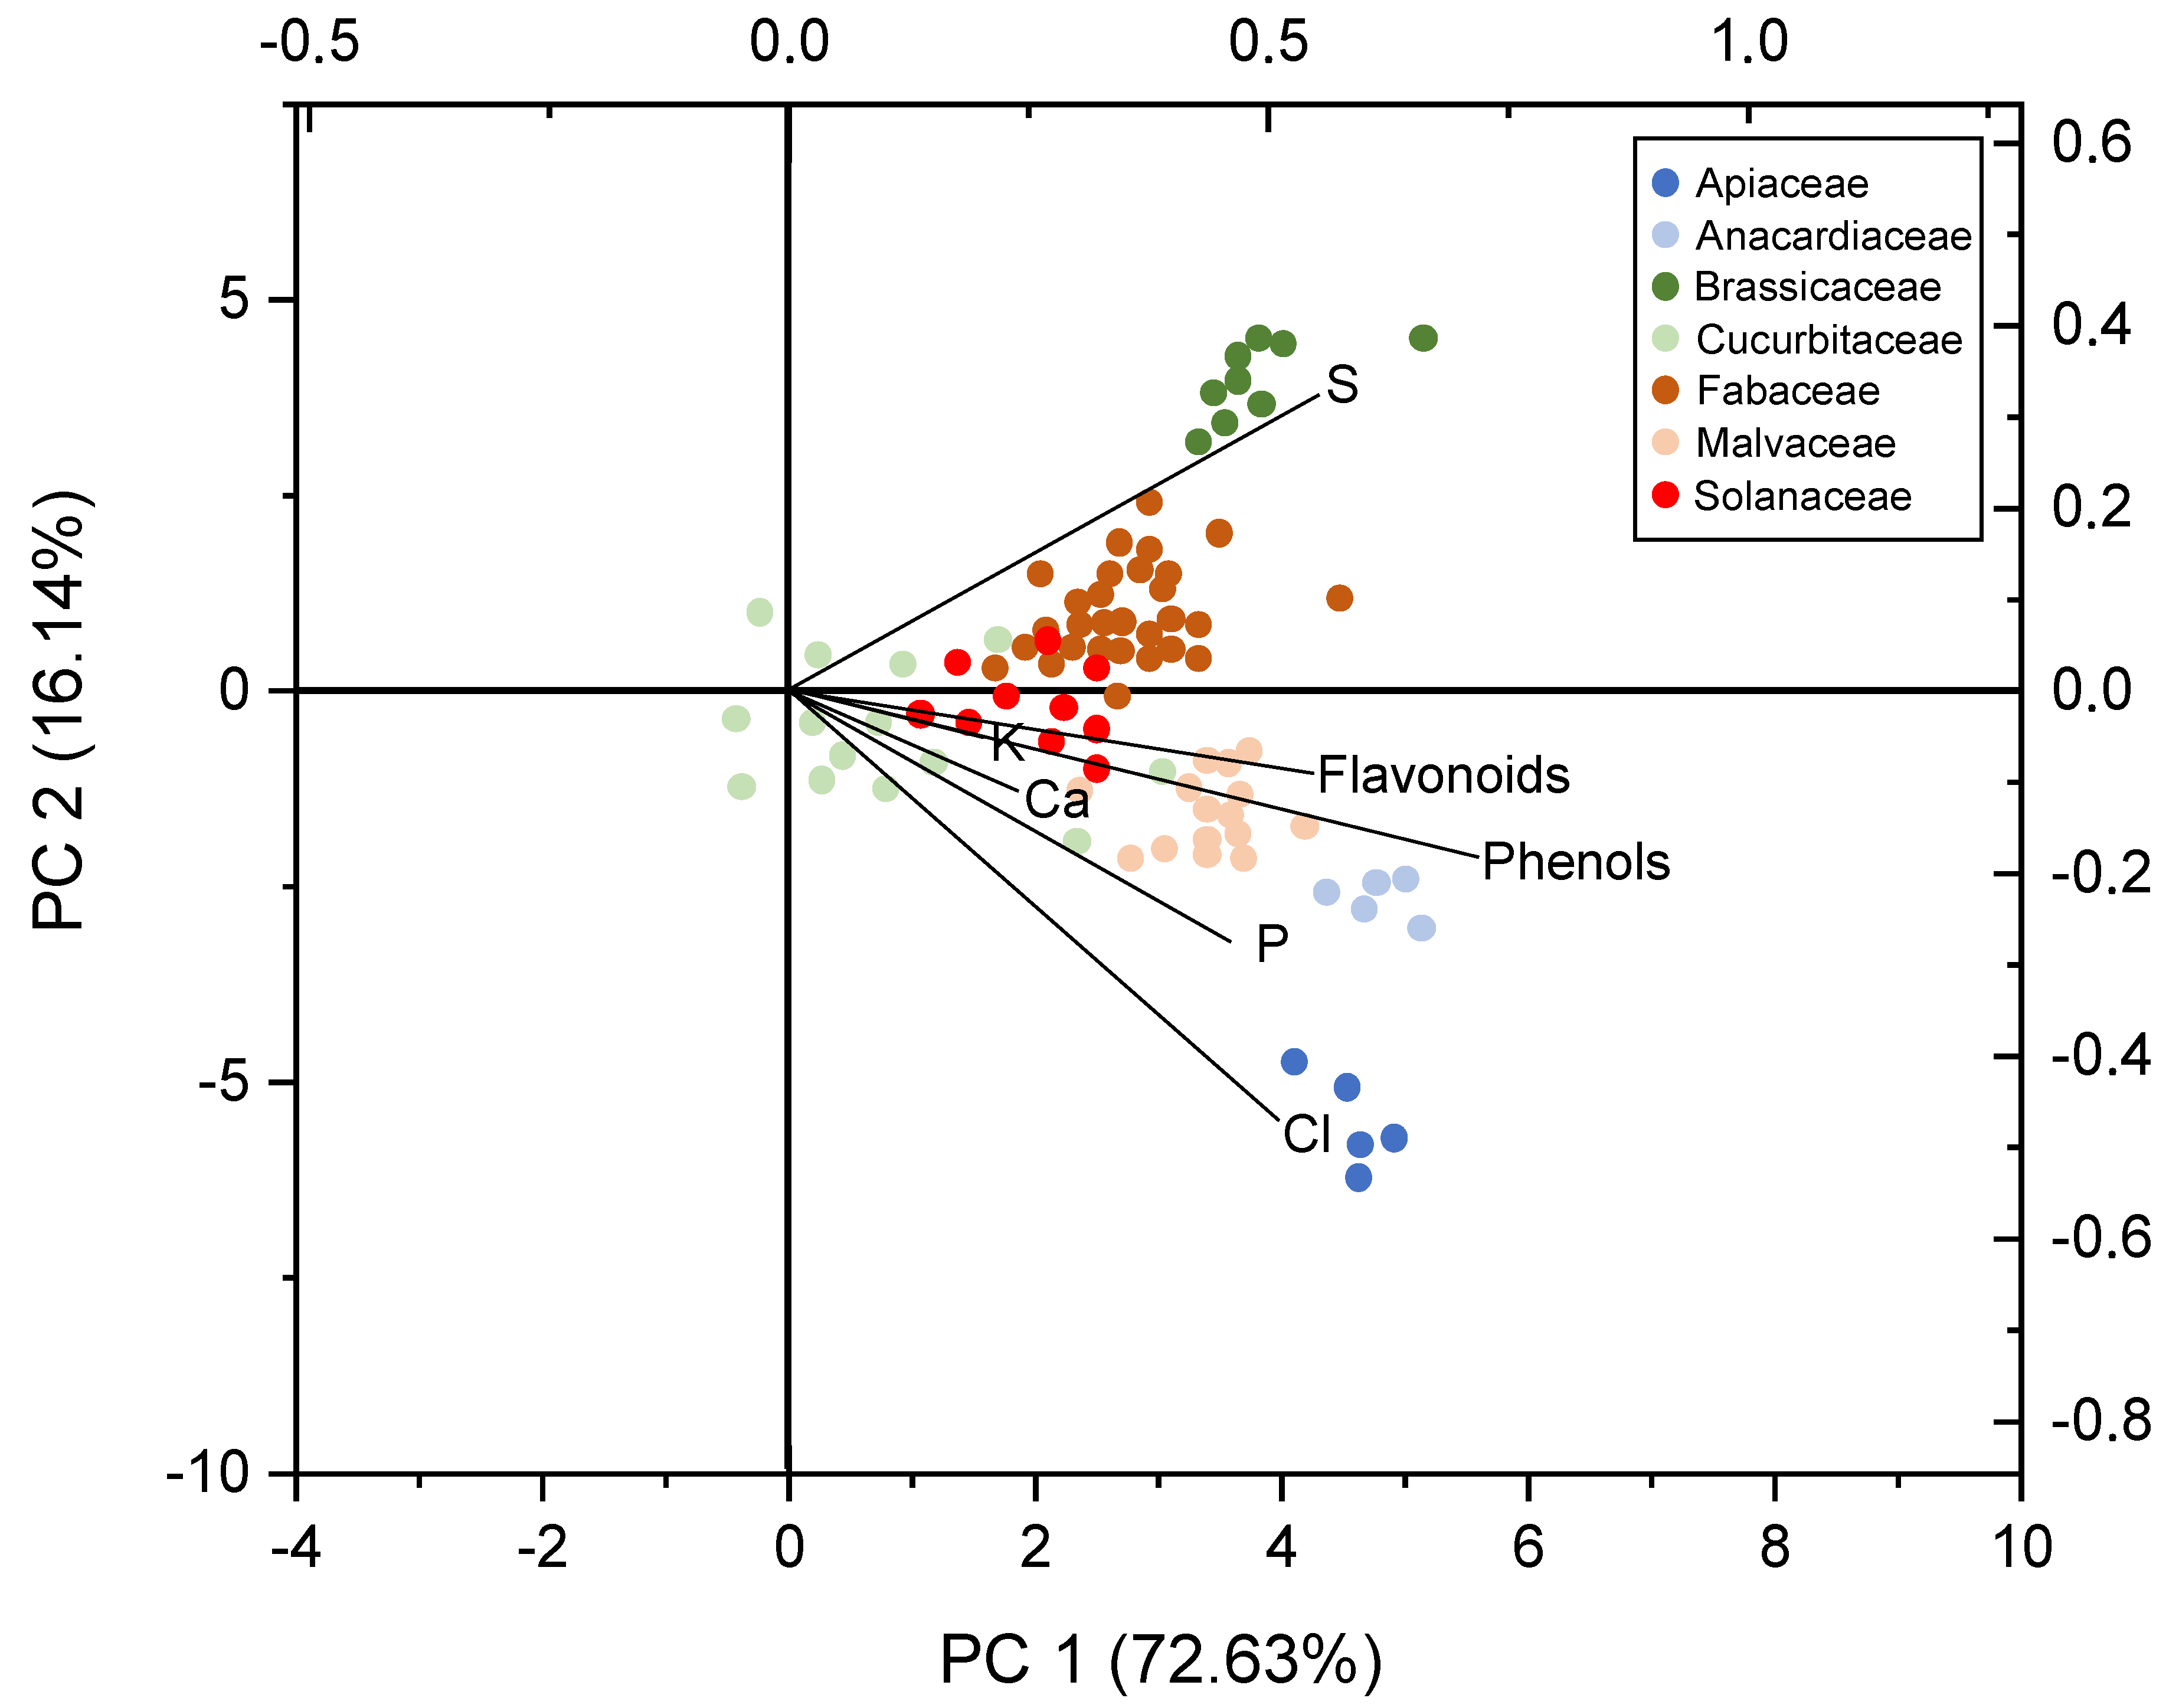
2.5. Statistical Relationship among Mineral and Phytochemical Contents
3. Materials and Methods
3.1. Sample Collection and Preparation
3.2. Total Phenolic Compound and Flavonoid Determination
3.3. Mineral Content Determination
3.4. Statistical Analysis
4. Conclusions
Supplementary Materials
Author Contributions
Funding
Institutional Review Board Statement
Informed Consent Statement
Data Availability Statement
Conflicts of Interest
Sample Availability
References
- Łoźna, K.; Styczyńska, L.; Hyla, J.; Bienkiewicz, M.; Figurska-Ciura, D.; Biernat, J.; Bronkowska, M. Mineral composition of tree nuts and seeds. J. Elem. 2020, 25, 745–756. [Google Scholar] [CrossRef]
- Caballero, B.; Trugo, L.; Finglas, P.M. Encyclopedia of Food Sciences and Nutrition, 3rd ed.; Academic Press: London, UK, 2006; pp. 134–138. [Google Scholar]
- Preedy, V.R.; Watson, R.R.; Patel, V.B. Nuts and Seeds in Health and Disease Prevention, 1st ed.; Academic Press: London, UK, 2011; pp. 243–247. [Google Scholar]
- Bistanji, G.; Hamadeh, S.; Hassan, H.; Tami, F.; Tannous, R. The potential of agro-industrial byproducts as feeds for livestock in Lebanon. Livest. Res. Rural. Dev. 2000, 12, 1–6. [Google Scholar]
- Lokanadhan, S.; Muthukrishnan, P.; Jeyaraman, S. Neem products and their agricultural applications. J. Biopest 2012, 5, 72–76. [Google Scholar]
- Gama, T. Quality of tree nuts: A review. Sci. Hortic. 2018, 242, 116–126. [Google Scholar] [CrossRef]
- Lorenzo, J.M.; Mousavi-Khaneghah, A.; Gavahian, M.; Marszałek, K.; Es, I.; Munekata, P.E.S.; Ferreira, I.C.F.R.; Barba, F.J. Understanding the potential benefits of thyme and its derived products for food industry and consumer health: From extraction of value-added compounds to the evaluation of bioaccesibility, bioavailability, anti-inflammatory, and antimicrobial activities. Crit. Rev. Food Sci. Nutr. 2019, 59, 2879–2895. [Google Scholar] [CrossRef] [PubMed]
- Panfili, G.; Niro, S.; Bufano, A.; D′Agostino, A.; Fratianni, A.; Paura, B.; Falasca, L.; Cinquanta, L. Bioactive Compounds in Wild Asteraceae Edible Plants Consumed in the Mediterranean Diet. Plant Foods Hum. Nutr. 2020, 75, 540–546. [Google Scholar] [CrossRef] [PubMed]
- Pérez-Jiménez, J.; Neveu, V.F.; Scalbert, A. Identification of the 100 richest dietary sources of polyphenols: An application of the Phenol-Explorer database. Eur. J. Clin. Nutr. 2010, 64, S112–S120. [Google Scholar] [CrossRef] [PubMed]
- Pastoriza, S.; Mesías, M.; Cabrera, C.; Rufián-Henares, J.A. Healthy properties of Green and White teas: An update. Food Funct. 2016, 8, 2650–2662. [Google Scholar] [CrossRef]
- Pandey, K.B.; Rizvi, S.I. Plant polyphenols as dietary antioxidants in human health and disease. Oxid. Med. Cell Longev. 2009, 2, 270–278. [Google Scholar] [CrossRef]
- Arjeh, E.; Akhavan, H.R.; Barzegar, M.; Carbonell-Barrachina, A. Bioactive compounds and functional properties of pistachio hull: A review. Trends Food Sci. Technol. 2020, 97, 55–64. [Google Scholar] [CrossRef]
- Mojzer, E.B.; Hrncic, M.K.; Škerget, M.; Knez, Ž.; Bren, U. Polyphenols: Extraction methods, antioxidative action, bioavailability and anticarcinogenic effects. Molecules 2016, 21, 901. [Google Scholar] [CrossRef] [PubMed]
- Khang, D.; Dung, T.; Elzaawely, A.; Xuan, T. Phenolic profiles and antioxidant activity of germinated legumes. Foods 2016, 5, 27. [Google Scholar] [CrossRef]
- Niroula, A.; Khatri, S.; Khadka, D.; Timilsina, R. Total phenolic contents and antioxidant activity profile of selected cereal sprouts and grasses. Int. J. Food Proper 2019, 22, 427–437. [Google Scholar] [CrossRef]
- Pandey, M.M.; Vijayakumar, M.; Rastogi, S.; Rawat, A.K.S. Phenolic content and antioxidant properties of selected Indian spices of Apiaceae. J. Herbs Spices Med. Plants 2012, 18, 246–256. [Google Scholar] [CrossRef]
- Karaś, M.; Jakubczyk, A.; Szymanowska, U.; Złotek, U.; Zielińska, E. Digestion and bioavailability of bioactive phytochemicals. Int. J. Food Sci. Technol. 2017, 52, 291–305. [Google Scholar] [CrossRef]
- Herbello-Hermelo, P.; Lamas, J.P.; Lores, M.; Domínguez-González, R.; Bermejo-Barrera, P.; Moreda-Piñeiro, A. Polyphenol bioavailability in nuts and in vitro dialyzability approach. Food Chem. 2018, 254, 20–25. [Google Scholar] [CrossRef]
- Singleton, V.L.; Orthofer, R.; Lamuela-Raventós, R.M. Analysis of total phenols and other oxidation substrates and antioxidants by means of Folin-Ciocalteu reagent. Meth. Enzymol. 1999, 299, 152–178. [Google Scholar]
- Fogarasi, M.; Socaci, S.A.; Dulf, F.V.; Diaconeasa, Z.M.; Fărcas, A.C.; Tofană, M.; Semeniuc, C.A. Bioactive Compounds and Volatile Profiles of Five Transylvanian Wild Edible Mushrooms. Molecules 2018, 23, 3272. [Google Scholar] [CrossRef]
- Moreno-Montoro, M.; Olalla-Herrera, M.; Gimenez-Martinez, R.; Navarro-Alarcon, M.; Rufián-Henares, J.A. Phenolic compounds and antioxidant activity of Spanish commercial grape juices. J. Food Comp. Anal. 2015, 38, 19–26. [Google Scholar] [CrossRef]
- Freitas, J.; Fernandes, D.; Czeder, L.P.; Lima, J.; Sousa, A.; Naves, M. Edible seeds and nuts. Grown in Brazil as sources of protein for human nutrition. Food Nutr. Sci. 2012, 3, 857–862. [Google Scholar] [CrossRef]
- Ferranti, P.; Berry, E.M.; Anderson, J.R. Encyclopedia of Food Security and Sustainability, 1st ed.; Elsevier: Amsterdam, The Netherlands, 2019; pp. 124–374. [Google Scholar]
- Danuko, R.N.; Tapsell, L.C.; Charlton, K.E.; Neale, E.P.; O’Donnell, K.M.; Batterham, M.J. Relationship between sodium and potassium intake and blood pressure in a sample of overweight adults. Nutrition 2017, 33, 285–290. [Google Scholar] [CrossRef] [PubMed]
- Gouveia, C.S.S.; Freitas, G.; de Brito, J.H.; Slaski, J.J.; de Carvalho, M.A.P. Nutritional and Mineral Variability in 52 Accessions of Common Bean Varieties (Phaseolus vulgaris L.) from Madeira Island. Agric. Sciences. 2014, 5, 317–329. [Google Scholar] [CrossRef][Green Version]
- Ribeiro, N.D.; Maziero, S.M.; Prigol, M.; Nogueira, C.W.; Rosa, D.P.; Della, M.T.; Possobom, F. Mineral concentrations in the embryo and seed coat of common bean cultivars. J. Food Comp. Anal. 2012, 26, 89–95. [Google Scholar] [CrossRef]
- Pinakin, D.J.; Kumar, V.; Kumar, A.; Gat, Y.; Suri, S.; Sharma, K. Mahua: A boon for pharmacy and food industry. Curr. Res. Nutr. Food Sci. 2018, 6, 371–381. [Google Scholar] [CrossRef]
- Deng, L.Z.; Mujumdar, A.S.; Zhang, Q.; Yang, X.H.; Wang, J.; Zheng, Z.A.; Gao, Z.J.; Xiao, H.W. Chemical and physical pretreatments of fruits and vegetables: Effects on drying characteristics and quality attributes–a comprehensive review. Crit. Rev. Food Sci. Nutr. 2019, 59, 1408–1432. [Google Scholar] [CrossRef] [PubMed]
- Cervera-Mata, A.; Kumar Sahu, P.; Chakradhari, S.; Sahu, Y.K.; Patel, K.S.; Singh, S.; Towett, E.K.; Martín-Ramos, P.; Quesada-Granados, J.J.; Rufián-Henares, J.A. Plant seeds as source of nutrients and phytochemicals for the Indian population. Int. J. Food Sci. Technol. 2022, 57, 525–532. [Google Scholar] [CrossRef]
- Isam, A.; Ahmed, M.; Uslu, N.; Özcan, M.M.; Juhaimi, F.; Ghafoor, K.; Babiker, E.E.; Osman, M.M.; Alqah, H.A.S. Effect of conventional oven roasting treatment on the physicochemical quality attributes of sesame seeds obtained from different locations. Food Chem. 2021, 338, 128109. [Google Scholar]
- Syed, F.; Arif, S.; Ahmed, I.; Khalid, N. Groundnut (Peanut) (Arachis hypogaea). In Oilseeds: Health Attributes and Food Applica-tions, 1st ed.; Tanwar, B., Goyal, A., Eds.; Springer: Singapore; Serdang, Malaysia, 2021; pp. 93–122. [Google Scholar]
- Selamoglu, Z. Biotechnological approaches on anticancer activity of flavonoids-mini review. Mod. Approaches Drug Des. 2017, 1, 1–2. [Google Scholar] [CrossRef]
- Schultz, W.M.; Varghese, T.; Heinl, R.E.; Dhindsa, D.S.; Mahlof, E.N.; Cai, H.C.; Southmayd, G.; Sandesara, P.B.; Eapen, D.J.; Sperling, L.S. Natural approaches in diabetes management: A review of diet, Exercise, and natural products. Curr. Pharm. Des. 2018, 24, 84–98. [Google Scholar] [CrossRef]
- Mili, A.; Das, S.; Nandakumar, K.; Lobo, A. A comprehensive review on Sesamum indicum L.: Botanical, ethnopharmacological, phytochemical, and pharmacological aspects. J. Ethnopharmacol. 2021, 281, 114503. [Google Scholar] [CrossRef]
- Amalfitano, C.; Golubkina, N.A.; Vacchio, L.; Russo, G.; Cannoniero, M.; Somma, S.; Morano, G.; Cuciniello, A.; Caruso, G. Yield, Antioxidant Components, Oil Content, and Composition of Onion Seeds Are Influenced by Planting Time and Density. Plants 2019, 8, 293. [Google Scholar] [CrossRef] [PubMed]
- Golubkina, N.A.; Nadezhkin, S.M.; Agafonov, A.F.; Kosheleva, O.V.; Molchanova, A.V.; Russo, G.; Cuciniello, A.; Caruso, G. Seed oil content, fatty acids composition and antioxidant properties as affected by genotype in Allium cepa L. and perennial onion species. Adv. Hort. Sci 2015, 29, 199–206. [Google Scholar]
- Žilic, S.; Dragišic, J.; Maksimovic, V.; Maksimovic, M.; Basic, Z.; Crevar, M.; Stankovic, G. The content of antioxidants in sunflower seed and kernel. Helia 2010, 33, 75–84. [Google Scholar] [CrossRef]
- Rizki, H.; Kzaiber, F.; Elharfi, M.; Ennahli, S.; Hanine, H. Chemical composition and morphological markers of 35 cultivars of sesame (Sesamum indicum. L) from different areas in Morocco. Int. J. Technol. Enhanc. Emerg. Eng. Res. 2015, 3, 50–55. [Google Scholar]
- Rizki, H.; Kzaiber, F.; Elharfi, M.; Latrache, H.; Zahir, H.; Hanine, H. Physicochemical characterization and in vitro antioxidant capacity of 35 cultivars of sesame (Sesamum indicum L.) from different areas in Morocco. Int. J. Sci. Eng. Res. 2014, 3, 2306–2311. [Google Scholar]
- Sahu, Y.K.; Patel, K.S.; Martın-Ramos, P.; Towett, E.K. Characterization of polyphenols and mineral contents in three medicinal weeds. Eur. J. Med. Plants 2019, 28, 1–8. [Google Scholar] [CrossRef]
- Gobalakrishnan, R.; Bhuvaneswari, R.; Rajkumar, M. Natural antimicrobial and bioactive compounds from Ludwigia parviflora Roxb. J. Anal. Pharm. Res. 2020, 9, 37–42. [Google Scholar]
- Ishikawa, T.; Kondo, K.; Kitajima, J. Water-soluble constituents of coriander. Chem. Pharm. Bull. 2003, 51, 32–39. [Google Scholar] [CrossRef]
- Barros, L.; Duenas, M.; Dias, M.I.; Sousa, M.J.; Santos-Buelga, C.; Ferreira, I.C. Phenolic profiles of in vivo and in vitro grown Coriandrum sativum L. Food Chem. 2012, 132, 841–848. [Google Scholar] [CrossRef]
- Oganesyan, E.; Nersesyan, Z.; Parkhomenko, A.Y. Chemical composition of the above-ground part of Coriandrum sativum. Pharm. Chem. J. 2007, 41, 149–153. [Google Scholar] [CrossRef]
- Mahleyuddin, N.N.; Moshawih, S.; Ming, L.C.; Zulkifly, H.H.; Kifli, N.; Loy, M.J.; Sarker, M.M.R.; Al-Worafi, Y.M.; Goh, B.H.; Thuraisingam, S.; et al. Coriandrum sativum L.: A Review on Ethnopharmacology, Phytochemistry, and Cardiovascular Benefits. Molecules 2022, 27, 209. [Google Scholar] [CrossRef] [PubMed]
- Aline, L.M.; Lamien, C.E.; Compaoré, M.M.Y.; Meda, R.N.T.; Kiendrebeogo, M.; Jeanne, B.Z.; Nacoulma, O.G. Polyphenol content and antioxidant activity of fourteen wild edible fruits from Burkina Faso. Molecules 2008, 13, 581–594. [Google Scholar]
- Ebert, A.W. Potential of underutilized traditional vegetables and legume crops to contribute to food and nutritional security, income and more sustainable production systems. Sustainability 2014, 6, 319–335. [Google Scholar] [CrossRef]
- Saikia, P.; Deka, D.C. Mineral content of some wild green leafy vegetables of North-East India. J. Chem. Pharm. Res. 2013, 5, 117–121. [Google Scholar]
- Mark, H.E.; Houghton, L.A.; Gibson, R.S.; Monterrosa, E.; Kraemer, K. Estimating dietary micronutrient supply and the prevalence of inadequate intakes from national Food Balance Sheets in the South Asia region. Asia Pac. J. Clin. Nutrition. 2016, 25, 368–376. [Google Scholar]
- Devi, S.M.; Balachandar, V.; Lee, S.I.; Kim, I.H. An outline of meat consumption in the Indian population-A pilot review. Korean J. Food Sci. Anim. Resour. 2014, 34, 507–515. [Google Scholar] [CrossRef] [PubMed]
- Rao, N.D.; Min, J.; DeFries, R.; Ghosh-Jerath, S.; Valin, H.; Fanzo, J. Healthy, affordable and climate-friendly diets in India. Glob. Environ. Change 2018, 49, 154–165. [Google Scholar] [CrossRef]
- Khare, C.P. Indian Medicinal Plants, 1st ed.; Springer: New York, NY, USA, 2008; pp. 243–246. [Google Scholar]
- Pandey, R. Mineral Nutrition of Plants. In Plant Biology and Biotechnology, 1st ed.; Bahadur, B., Venkat, R.M., Sahijram, L., Krishnamurthy, K., Eds.; Springer: New Delhi, India, 2015; pp. 499–538. [Google Scholar]
- Céccoli, G.; Ramos, J.; Pilatti, V.; Dellaferrera, I.; Tivano, J.C.; Taleisnik, E.; Vegetti, A.C. Salt glands in the Poaceae family and their relationship to salinity tolerance. Bot. Rev. 2015, 81, 162–178. [Google Scholar] [CrossRef]
- Obadi, M.; Sun, J.; Xu, B. Highland barley: Chemical composition, bioactive compounds, health effects, and applications. Food Res. Int. 2021, 140, 110065. [Google Scholar] [CrossRef]
- Liang, K.; Liang, S.; Lu, L.; Zhu, D.; Cheng, L. Geographical origin traceability of foxtail millet based on the combination of multi-element and chemical composition analysis. Int. J. Food Prop. 2018, 21, 1769–1777. [Google Scholar] [CrossRef]
- Abdi, M.R.; Rezaee-Ebrahim-Saraee, K.; Fard, M.R.; Baradaran-Ghahfarokhi, M. Potential health concerns of trace elements and mineral content in commonly consumed greenhouse vegetables in Isfahan, Iran. Adv. Biomed. Res. 2015, 4, 214. [Google Scholar] [PubMed]
- Sene, B.; Sarr, F.; Diouf, D.; Kane, A.; Traore, D. Study of mineral composition and contents about proteins and fats of eight sesame varieties (Sesamum indicum L.) introduced in Senegal for variety screening. OCL 2018, 25, A601. [Google Scholar] [CrossRef]
- Okello, J.; Okullo, J.; Eilu, G.; Nyeko, P.; Obua, J. Mineral composition of Tamarindus indica LINN (tamarind) pulp and seeds from different agro-ecological zones of Uganda. Food Sci. Nutr. 2017, 5, 959–966. [Google Scholar] [CrossRef]
- Alejandro, S.; Holler, S.; Meier, B.; Peiter, E. Manganese in plants: From acquisition to subcellular allocation. Front. Plant Sci. 2020, 11, 300. [Google Scholar] [CrossRef] [PubMed]
- AOAC. Determination of moisture, ash, protein and fat. In Official Method of Analysis of the Association of Analytical Chemists, 18th ed.; AOAC: Washington, DC, USA, 2005; pp. 141–144. [Google Scholar]
- Bertaud, F.; Tapin-Lingua, S.; Pizzi, A.; Navarrete, P.; Petit-Conil, M. Characterisation of industrial barks for their tannin contents for further green-wood based adhesives applications. In Proceedings of the COST FP0901, Hamburg, Germany, 20 August 2010. [Google Scholar]
- Chang, C.C.; Yang, M.H.; Wen, H.M.; Chern, J.C. Estimation of total flavonoid content in propolis by two complementary colorimetric methods. J. Food Drug Anal. 2002, 10, 178–182. [Google Scholar]
- Towett, E.K.; Shepherd, K.D.; Drake, B.L. Plant elemental composition and portable X-ray fluorescence (pXRF) spectroscopy: Quantification under different analytical parameters. X-ray Spectr. 2016, 45, 117–124. [Google Scholar] [CrossRef]
- Rousseau, R.M. Detection limit and estimate of uncertainty of analytical XRF results. Rigaku J. 2001, 18, 33–47. [Google Scholar]
- Sandström, B. Micronutrient interactions: Effects on absorption and bioavailability. Br. J. Nutr. 2001, 85, S181–S185. [Google Scholar] [CrossRef]


| No. | Seed | Family | Type | Mass mg | Moisture Content % | Seed Coat % | Ash % | Total Phenols mg/100 g | Flavonoids mg/100 g |
|---|---|---|---|---|---|---|---|---|---|
| 1 | Coriandrum sativum L. | Apiaceae | H | 17.87 ± 2.61 | 7.8 ± 0.2 | - | 6.8 ± 0.3 | 481 ± 10 | 405 ± 9 |
| 2 | Cuminum cyminum L. | Apiaceae | H | 3.84 ± 0.09 | 6.8 ± 0.2 | - | 5.5 ± 0.1 | 903 ± 19 | 815 ± 17 |
| 3 | Daucus carota subsp. sativus (Hoffm.) Schübl. & Martens | Apiaceae | H | 4.11 ± 0.20 | 7.5 ± 0.2 | - | 4.8 ± 0.1 | 1685 ± 35 | 1485 ± 31 |
| 4 | Foeniculum vulgare Mill. | Apiaceae | H | 4.73 ± 0.38 | 7.8 ± 0.2 | - | 4.5 ± 0.1 | 1056 ± 21 | 880 ± 18 |
| 5 | Trachyspermum ammi Sprague | Apiaceae | H | 1.97 ± 0.09 | 6.2 ± 0.2 | - | 6.5 ± 0.2 | 1899 ± 40 | 525 ± 11 |
| 6 | Allium cepa L. | Amaryllidaceae | H | 3.98 ± 0.19 | 5.8 ± 0.1 | - | 5.2 ± 0.1 | 447 ± 9 | 405 ± 9 |
| 7 | Asparagus racemosus Willd. | Asparagaceae | H | 32.33 ± 2.52 | 3.2 ± 0.1 | - | 2.2 ± 0.1 | 395 ± 8 | 200 ± 8 |
| 8 | Helianthus annuus L. | Asteraceae | H | 50.00 ± 3.12 | 4.7 ± 0.1 | - | 4.1 ± 0.1 | 590 ± 12 | 490 ± 10 |
| 9 | Stevia rebaudiana Bert. | Asteraceae | H | 2.00 ± 0.18 | 5.5 ± 0.1 | - | 3.2 ± 0.1 | 3441 ± 65 | 256 ± 6 |
| 10 | Carthamus oxyacanthus M.Bieb. | Asteraceae | H | 45.35 ± 2.51 | 4.6 ± 0.1 | - | 2.8 ± 0.1 | 1817 ± 38 | 1240 ± 25 |
| 11 | Anacardium occidentale L. | Anacardiaceae | T | 4269 ± 842 | 2.5 ± 0.1 | 59 ± 1 | 1.5 ± 0.1 | 861 ± 18 | 122 ± 3 |
| 12 | Buchanania lanzan Spreng. | Anacardiaceae | T | 310 ± 57 | 5.2 ± 0.1 | 76 ± 2 | 2.5 ± 0.1 | 2588 ± 53 | 406 ± 9 |
| 13 | Mangifera indica L. | Anacardiaceae | T | 8336 ± 113 | 12.9 ± 0.3 | 46 ± 1 | 4.5 ± 0.1 | 2583 ± 52 | 792 ± 16 |
| 14 | Pistacia vera L. | Anacardiaceae | T | 979 ± 100 | 5.7 ± 0.1 | 47 ± 1 | 2.2 ± 0.1 | 2706 ± 54 | 190 ± 4 |
| 15 | Semecarpus anacardium L.f. | Anacardiaceae | T | 2516 ± 170 | 1.9 ± 0.1 | 85 ± 2 | 2.5 ± 0.1 | 2476 ± 49 | 2048 ± 41 |
| 16 | Annona squamosa L. | Annonaceae | T | 242 ± 10 | 6.5 ± 0.2 | 37 ± 1 | 3.2 ± 0.1 | 820 ± 17 | 626 ± 13 |
| 17 | Areca catechu L. (Indian nut) | Aceraceae | T | 4380 ± 557 | 2.2 ± 0.0 | - | 1.5 ± 0.0 | 1553 ± 31 | 1236 ± 25 |
| 18 | Areca catechu L. (Chikni Supari) | Aceraceae | T | 3375 ± 451 | 2.4 ± 0.1 | - | 1.4 ± 0.0 | 2429 ± 50 | 482 ± 9 |
| 19 | Phoenix dactylifera L. | Aceraceae | T | 1065 ± 201 | 2.1 ± 0.0 | - | 1.5 ± 0.1 | 767 ± 16 | 346 ± 7 |
| 20 | Phoenix sylvestris Roxb. | Aceraceae | T | 817 ± 41 | 1.6 ± 0.0 | - | 1.8 ± 0.1 | 930 ± 19 | 770 ± 15 |
| 21 | Basella rubra L. | Basellaceae | V | 38.00 ± 0.20 | 9.1 ± 0.2 | 47 ± 1 | 3.9 ± 0.1 | 705 ± 14 | 614 ± 13 |
| 22 | Bixa orellana L. | Bixaceae | S | 32.70 ± 2.50 | 2.5 ± 0.1 | - | 2.1 ± 0.0 | 2811 ± 57 | 2028 ± 42 |
| 23 | Brassica campestris L. | Brassicaceae | H | 4.10 ± 0.30 | 8 ± 0.2 | - | 4.7 ± 0.8 | 1471 ± 29 | 234 ± 5 |
| 24 | Brassica hirta Moench | Brassicaceae | H | 4.10 ± 0.30 | 5.0 ± 0.1 | - | 4.5 ± 0.1 | 1902 ± 38 | 194 ± 4 |
| 25 | Brassica nigra (L.) W.D.J.Koch | Brassicaceae | H | 1.02 ± 0.00 | 7.4 ± 0.1 | - | 3.2 ± 0.1 | 1288 ± 26 | 254 ± 6 |
| 26 | Brassica oleracea var. capitata L. | Brassicaceae | H | 3.30 ± 0.20 | 8.6 ± 0.2 | - | 3.8 ± 0.1 | 1790 ± 37 | 242 ± 5 |
| 27 | Brassica oleracea var. botrytis L. | Brassicaceae | H | 3.20 ± 0.20 | 8.2 ± 0.3 | - | 3.7 ± 0.1 | 972 ± 20 | 292 ± 6 |
| 28 | Brassica rapa L. | Brassicaceae | H | 3.10 ± 0.10 | 7.3 ± 0.2 | - | 2.4 ± 0.1 | 471 ± 18 | 382 ± 8 |
| 29 | Lepidium sativum L. | Brassicaceae | H | 3.10 ± 0.30 | 6.4 ± 0.1 | - | 2.1 ± 0.1 | 378 ± 8 | 316 ± 7 |
| 30 | Raphanus sativus L. | Brassicaceae | H | 10.20 ± 1.60 | 5.2 ± 0.1 | - | 3.6 ± 0.1 | 266 ± 5 | 238 ± 5 |
| 31 | Sisymbrium irio L. | Brassicaceae | H | 0.21 ± 0.10 | 1.8 ± 0.1 | - | 2.0 ± 0.1 | 683 ± 13 | 590 ± 12 |
| 32 | Commiphora wightii (Arn.) Bhandari | Burseraceae | S | 163 ± 18 | 9.0 ± 0.2 | - | 4.8 ± 0.1 | 1834 ± 35 | 656 ± 13 |
| 33 | Carica papaya L. | Caricaceae | S | 15.50 ± 2.20 | 6.1 ± 0.1 | - | 5.1 ± 0.1 | 646 ± 13 | 542 ± 11 |
| 34 | Celastrus paniculatus Willd. | Celastraceae | V | 170 ± 4 | 2.2 ± 0.1 | 7.0 ± 0.0 | 1.5 ± 0.0 | 2699 ± 54 | 2428 ± 50 |
| 35 | Alangium salviifolium (L.f.) Wangerin (sage-leaf alangium) | Cornaceae | S | 229 ± 14 | 4.1 ± 0.1 | 4.0 ± 0.0 | 3.6 ± 0.1 | 1544 ± 31 | 308 ± 7 |
| 36 | Benincasa hispida (Thunb.) Cogn. | Cucurbitaceae | V | 63.80 ± 5.00 | 4.2 ± 0.1 | 47 ± 1 | 1.8 ± 0.4 | 448 ± 9 | 228 ± 9 |
| 37 | Citrullus lanatus var. lanatus (Thunb.) Matsum. & Nakai | Cucurbitaceae | V | 38.40 ± 2.00 | 4.2 ± 0.1 | 49 ± 1 | 2.9 ± 0.1 | 911 ± 19 | 728 ± 15 |
| 38 | Cucumis melo var. flexuosus (L.) Naudin | Cucurbitaceae | V | 19.9 ± 3.00 | 4.5 ± 0.1 | 33 ± 1 | 2.3 ± 0.1 | 361 ± 7 | 236 ± 5 |
| 39 | Cucumis melo var. Cantalupo Ser. | Cucurbitaceae | V | 25.30 ± 2.50 | 7.3 ± 0.2 | 28 ± 1 | 1.9 ± 0.4 | 437 ± 9 | 340 ± 8 |
| 40 | Cucumis sativus L. | Cucurbitaceae | V | 23.40 ± 1.90 | 4.7 ± 0.1 | 35 ± 1 | 1.7 ± 0.1 | 442 ± 8 | 356 ± 10 |
| 41 | Cucurbita maxima Duchesne | Cucurbitaceae | V | 132 ± 21 | 4.4 ± 0.1 | 18 ± 1 | 1.5 ± 0.0 | 542 ± 11 | 110 ± 3 |
| 42 | Diplocyclos palmatus (L.) C. Reffrey | Cucurbitaceae | V | 86.20 ± 4.70 | 4.9 ± 0.1 | 44 ± 1 | 1.6 ± 0.1 | 504 ± 11 | 304 ± 6 |
| 43 | Lagenaria siceraria (Molina) Standl. | Cucurbitaceae | V | 216 ± 5 | 4.9 ± 0.1 | 42 ± 1 | 1.7 ± 0.1 | 1316 ± 27 | 1140 ± 24 |
| 44 | Luffa acutangula (L.) Roxb | Cucurbitaceae | V | 122 ± 12 | 3.9 ± 0.1 | 47 ± 1 | 1.5 ± 0.0 | 235 ± 5 | 138 ± 3 |
| 45 | Luffa aegyptiaca Mill. | Cucurbitaceae | V | 105 ± 3 | 3.2 ± 0.1 | 43 ± 1 | 1.4 ± 0.0 | 306 ± 6 | 252 ± 5 |
| 46 | Momordica charantia L. (big karela) | Cucurbitaceae | V | 189 ± 13 | 4.7 ± 0.1 | 35 ± 1 | 1.8 ± 0.1 | 195 ± 4 | 118 ± 3 |
| 47 | Momordica charantia L. (small karela) | Cucurbitaceae | V | 102 ± 3 | 5.8 ± 0.1 | 30 ± 1 | 1.6 ± 0.1 | 3394 ± 67 | 170 ± 4 |
| 48 | Praecitrullus fistulosus (Stocks) Pangalo | Cucurbitaceae | V | 115 ± 3 | 5.0 ± 0.1 | 45 ± 1 | 1.8 ± 0.0 | 1250 ± 23 | 466 ± 14 |
| 49 | Solena amplexicaulis (Lam.) Gandhi | Cucurbitaceae | V | 178 ± 6 | 4.8 ± 0.1 | 32 ± 1 | 1.9 ± 0.1 | 4213 ± 81 | 390 ± 8 |
| 50 | Shorea robusta C.F.Gaertn. | Dipterocarpaceae | T | 995 ± 15 | 9.5 ± 0.1 | 20 ± 1 | 4.5 ± 0.1 | 3157 ± 62 | 2794 ± 55 |
| 51 | Diospyros melanoxylon Roxb. | Ebenaceae | T | 1310 ± 22 | 3.6 ± 0.1 | - | 3.5 ± 0.1 | 3546 ± 70 | 810 ± 9 |
| 52 | Jatropha curcas L. | Euphorbiaceae | S | 758 ± 15 | 7.5 ± 0.1 | 47 ± 1 | 5.5 ± 0.1 | 495 ± 6 | 426 ± 9 |
| 53 | Ricinus communis L. | Euphorbiaceae | S | 621 ± 13 | 3.5 ± 0.2 | 21 ± 1 | 3.5 ± 0.1 | 722 ± 15 | 646 ± 13 |
| 54 | Acacia auriculiformis Benth. | Fabaceae | T | 33.00 ± 2.00 | 5.6 ± 0.4 | 35 ± 1 | 3.6 ± 0.1 | 431 ± 9 | 380 ± 8 |
| 55 | Acacia catechu (L.f.) Willd. | Fabaceae | T | 57.00 ± 3.00 | 6.2 ± 0.5 | 45 ± 1 | 3.4 ± 0.1 | 954 ± 19 | 365 ± 7 |
| 56 | Acacia concinna (Willd.) DC. | Fabaceae | T | 224 ± 5 | 9.1 ± 0.6 | 39 ± 1 | 3.5 ± 0.1 | 715 ± 15 | 300 ± 6 |
| 57 | Acacia nilotica Schumach. & Thonn. | Fabaceae | T | 198 ± 4 | 7.8 ± 0.5 | 59 ± 1 | 3.8 ± 0.1 | 257 ± 5 | 255 ± 5 |
| 58 | Albizia saman (Jacq.) Merr. | Fabaceae | T | 219 ± 5 | 2.5 ± 0.1 | 42 ± 1 | 2.5 ± 0.1 | 518 ± 11 | 460 ± 13 |
| 59 | Albizia lebbek (L.) Benth | Fabaceae | T | 74.30 ± 2.00 | 7.1 ± 0.2 | 43 ± 1 | 3.1 ± 0.1 | 693 ± 14 | 405 ± 9 |
| 60 | Albizia odoratissima (L.f.) Benth | Fabaceae | T | 159 ± 3 | 2.5 ± 0.1 | 42 ± 1 | 2.5 ± 0.1 | 474 ± 15 | 430 ± 10 |
| 61 | Bauhinia purpurea L. | Fabaceae | T | 360 ± 11 | 6.2 ± 0.1 | 30 ± 1 | 3.1 ± 0.1 | 1214 ± 22 | 455 ± 9 |
| 62 | Bauhinia racemosa Lam. | Fabaceae | T | 173 ± 4 | 5.3 ± 0.1 | 72 ± 2 | 3.5 ± 0.1 | 2353 ± 47 | 415 ± 8 |
| 63 | Bauhinia vahlii Wight & Arn. | Fabaceae | T | 1855 ± 39 | 7.5 ± 0.2 | 44 ± 1 | 4.1 ± 0.1 | 293 ± 6 | 270 ± 6 |
| 64 | Butea frondosa Willd. | Fabaceae | T | 1003 ± 21 | 5.3 ± 0.1 | - | 4.5 ± 0.1 | 1816 ± 19 | 410 ± 9 |
| 65 | Caesalpinia decapetala (Roth) Alston | Fabaceae | T | 320 ± 10 | 6.5 ± 0.2 | 37 ± 1 | 3.1 ± 0.1 | 386 ± 8 | 350 ± 7 |
| 66 | Caesalpinia pulcherrima (L.) Sw. | Fabaceae | S | 38.00 ± 1.00 | 2.5 ± 0.1 | 63 ± 2 | 2.5 ± 0.1 | 2813 ± 56 | 2100 ± 41 |
| 67 | Cassia fistula L. (golden shower) | Fabaceae | T | 273 ± 5 | 4.1 ± 0.1 | 77 ± 2 | 2.1 ± 0.1 | 823 ± 17 | 460 ± 9 |
| 68 | Pithecellobium dulce (Roxb.) Benth. | Fabaceae | T | 164 ± 4 | 4.9 ± 0.1 | 25 ± 1 | 3.5 ± 0.1 | 386 ± 8 | 340 ± 7 |
| 69 | Pongamia pinnata (L.) Pierre | Fabaceae | T | 1431 ± 30 | 4.5 ± 0.1 | 5.0 ± 0.1 | 2.5 ± 0.1 | 477 ± 10 | 410 ± 9 |
| 70 | Saraca asoca (Roxb.) Willd. | Fabaceae | T | 800 ± 17 | 7.1 ± 0.2 | 15 ± 0 | 5.5 ± 0.1 | 1610 ± 31 | 1390 ± 28 |
| 71 | Sesbania grandiflora (L.) Pers. | Fabaceae | T | 85.30 ± 1.50 | 3.1 ± 0.1 | 35 ± 1 | 4.2 ± 0.1 | 1774 ± 34 | 550 ± 11 |
| 72 | Hardwickia binata Roxb. | Fabaceae | T | 294 ± 5 | 3.1 ± 0.1 | - | 2.2 ± 0.1 | 3494 ± 70 | 580 ± 12 |
| 73 | Pterocarpus marsupium Roxb. | Fabaceae | T | 880 ± 17 | 4.4 ± 0.1 | 56 ± 1 | 2.1 ± 0.1 | 2895 ± 57 | 340 ± 7 |
| 74 | Tamarindus indica L. | Fabaceae | T | 977 ± 20 | 6.5 ± 0.2 | 15 ± 0. | 3.5 ± 0.1 | 299 ± 3 | 265 ± 6 |
| 75 | Sesbania sesban (L.) Merr. | Fabaceae | S | 13.80 ± 0.20 | 1.0 ± 0.0 | - | - | 2234 ± 45 | 500 ± 10 |
| 76 | Enterolobium cyclocarpum (Jacq.) Griseb. | Fabaceae | T | 875 ± 4 | 6.5 ± 0.2 | 45 ± 1 | 4.2 ± 0.1 | 418 ± 9 | 325 ± 7 |
| 77 | Gliricidia maculata (Kunth) Steud. | Fabaceae | T | 130 ± 4 | 4.5 ± 0.1 | 18 ± 0 | 2.5 ± 0.1 | 1021 ± 21 | 360 ± 7 |
| 78 | Delonix regia (Bojer) Raf. | Fabaceae | T | 510 ± 5 | 7.5 ± 0.2 | 69 ± 2 | 2.2 ± 0.1 | 382 ± 8 | 285 ± 5 |
| 79 | Entada gigas (L.) Fawc. & Rendle | Fabaceae | V | 23623 ± 2 | 8.3 ± 0.2 | 40 ± 1 | 1.5 ± 0.0 | 1884 ± 17 | 265 ± 5 |
| 80 | Leucaena leucocephala (Lam.) de Wit | Fabaceae | S | 61.30 ± 0.50 | 6.5 ± 0.2 | 47 ± 1 | 1.6 ± 0.0 | 1243 ± 25 | 320 ± 7 |
| 81 | Mimosa pudica L. | Fabaceae | V | 21.30 ± 0.50 | 3.2 ± 0.1 | - | 1.0 ± 0.0 | 1846 ± 17 | 625 ± 13 |
| 82 | Parkia javanica Merr. | Fabaceae | T | 305 ± 5 | 6.5 ± 0.2 | 37 ± 1 | 1.5 ± 0.0 | 988 ± 10 | 910 ± 18 |
| 83 | Senna siamea (Lam.) H.S.Irwin & Barneby | Fabaceae | T | 22.00 ± 1.00 | 3.6 ± 0.1 | - | 1.2 ± 0.0 | 418 ± 9 | 305 ± 6 |
| 84 | Juglans regia L. | Juglandaceae | T | 12200 ± 238 | 2.9 ± 0.1 | 32 ± 1 | 3.3 ± 0.1 | 182 ± 4 | 152 ± 3 |
| 85 | Litsea glutinosa (Lour.) C.B.Rob. | Lauraceae | T | 248 ± 6 | 3.5 ± 0.1 | 43 ± 1 | 3.8 ± 0.1 | 1836 ± 17 | 1588 ± 29 |
| 86 | Linum usitatissimum L. | Linaceae | H | 7.20 ± 0.10 | 4.9 ± 0.1 | - | 2.8 ± 0.1 | 332 ± 6 | 218 ± 5 |
| 87 | Strychnos potatorum L.f. | Loganiaceae | T | 283 ± 5 | 4.8 ± 0.1 | 24 ± 1 | 4.1 ± 0.1 | 1068 ± 21 | 964 ± 20 |
| 88 | Lagerstroemia parviflora Roxb. | Lythraceae | T | 2669 ± 50 | 5.2 ± 0.1 | 53 ± 1 | 6.5 ± 0.2 | 2350 ± 48 | 1060 ± 21 |
| 89 | Lawsonia inermis L. | Lythraceae | S | 22.00 ± 0.50 | 1.5 ± 0.0 | - | 2.1 ± 0.1 | 1990 ± 38 | 1088 ± 21 |
| 90 | Trapa natans L. | Lythraceae | H | 4923 ± 100 | 8.8 ± 0.2 | 15 ± 0 | 4.3 ± 0.1 | 1595 ± 31 | 1360 ± 26 |
| 91 | Careya arborea Roxb. | Lecythidaceae | T | 423 ± 9 | 6.5 ± 0.2 | 35 ± 1 | 2.5 ± 0.1 | 2607 ± 53 | 2280 ± 45 |
| 92 | Azadirachta indica A.Juss. | Meliaceae | T | 345 ± 7 | 6.1 ± 0.2 | 25 ± 1 | 3.5 ± 0.1 | 2438 ± 49 | 2162 ± 44 |
| 93 | Melia azedarach L. | Meliaceae | T | 972 ± 20 | 4.5 ± 0.1 | 40 ± 1 | 3.5 ± 0.1 | 3500 ± 71 | 3130 ± 63 |
| 94 | Abelmoschus esculentus (L.) Moench | Malvaceae | H | 59.80 ± 1.00 | 4.2 ± 0.1 | - | 4.8 ± 0.1 | 496 ± 9 | 444 ± 9 |
| 95 | Abelmoschus moschatus (L.) Medik | Malvaceae | H | 17.40 ± 0.30 | 4.1 ± 0.1 | - | 4.5 ± 0.1 | 2250 ± 41 | 1960 ± 19 |
| 96 | Abutilon indicum (Link) Sweet | Malvaceae | H | 5.43 ± 0.11 | 3.5 ± 0.1 | - | 4.3 ± 0.1 | 458 ± 9 | 436 ± 9 |
| 97 | Corchorus olitorius L. | Malvaceae | H | 2.08 ± 0.12 | 3.8 ± 0.1 | - | 2.7 ± 0.1 | 424 ± 9 | 312 ± 7 |
| 98 | Corchorus olitorius L. | Malvaceae | H | 1.05 ± 0.11 | 2.3 ± 0.1 | - | 2.6 ± 0.1 | 770 ± 15 | 668 ± 13 |
| 99 | Gossypium arboreum L. | Malvaceae | H | 74.40 ± 3.00 | 3.9 ± 0.1 | - | 3.8 ± 0.1 | 2009 ± 40 | 1786 ± 37 |
| 100 | Hibiscus cannabinus L. | Malvaceae | H | 22.90 ± 0.50 | 3.8 ± 0.1 | - | 3.3 ± 0.1 | 840 ± 9 | 730 ± 15 |
| 101 | Hibiscus sabdariffa L. | Malvaceae | H | 24.60 ± 0.50 | 2.6 ± 0.1 | - | 3.6 ± 0.1 | 508 ± 11 | 394 ± 8 |
| 102 | Malachra capitata L. | Malvaceae | H | 5.15 ± 0.14 | 2.9 ± 0.1 | - | 3.1 ± 0.1 | 271 ± 6 | 232 ± 7 |
| 103 | Sida acuta Burm.f. | Malvaceae | H | 2.38 ± 0.10 | 4.4 ± 0.1 | - | 3.5 ± 0.1 | 901 ± 18 | 734 ± 14 |
| 104 | Sida cordifolia L. | Malvaceae | H | 1.26 ± 0.11 | 7.6 ± 0.2 | - | 2.9 ± 0.1 | 2058 ± 41 | 854 ± 17 |
| 105 | Sterculia foetida L. | Malvaceae | T | 1244 ± 23 | 3.1 ± 0.1 | - | 1.5 ± 0.0 | 256 ± 5 | 152 ± 3 |
| 106 | Sterculia urens Roxb. | Malvaceae | T | 193 ± 4 | 2.5 ± 0.1 | 29 ± 1 | 1.5 ± 0.0 | 479 ± 8 | 422 ± 8 |
| 107 | Thespesia populnea Sol. ex Corrêa | Malvaceae | T | 162 ± 3 | 3.2 ± 0.1 | 47 ± 1 | 2.2 ± 0.0 | 2512 ± 52 | 2202 ± 43 |
| 108 | Urena lobata L. | Malvaceae | V | 15.27 ± 2.56 | 3.6 ± 0.1 | - | 4.2 ± 0.1 | 376 ± 8 | 322 ± 6 |
| 109 | Artocarpus heterophyllus Lam. | Moraceae | T | 10640 ± 34 | 30 ± 1.0 | 8.0 ± 0.2 | 6.1 ± 0.2 | 888 ± 18 | 316 ± 7 |
| 110 | Ficus racemosa L. | Moraceae | T | 2626 ± 51 | 8.5 ± 0.2 | 27 ± 1 | 2.5 ± 0.1 | 475 ± 10 | 414 ± 8 |
| 111 | Moringa oleifera Lam. | Moringaceae | T | 381 ± 8 | 6.5 ± 0.1 | 38 ± 1 | 3.5 ± 0.1 | 316 ± 7 | 264 ± 5 |
| 112 | Psidium guajava L. | Myrtaceae | T | 27.70 ± 0.50 | 2.5 ± 0.1 | - | 1.2 ± 0.0 | 296 ± 6 | 210 ± 4 |
| 113 | Syzygium cumini (L.) Skeels | Myrtaceae | T | 1280 ± 24 | 4.5 ± 0.1 | 25 ± 1 | 3.2 ± 0.1 | 2845 ± 58 | 2298 ± 45 |
| 114 | Nelumbo nucifera Gaertn. | Nelumbonaceae | H | 1213 ± 23 | 2.2 ± 0.1 | 12 ± 0 | 3.6 ± 0.1 | 2603 ± 54 | 428 ± 5 |
| 115 | Argemone mexicana L. | Papeveraceae | H | 2.03 ± 0.09 | 5.2 ± 0.1 | - | 1.7 ± 0.0 | 5000 ± 99 | 4465 ± 90 |
| 116 | Papaver somniferum L. | Papeveraceae | H | 0.21 ± 0.00 | 4.4 ± 0.1 | - | 1.3 ± 0.0 | 4307 ± 86 | 3890 ± 75 |
| 117 | Passiflora foetida L. | Passifloraceae | H | 7.13 ± 0.12 | 6.2 ± 0.1 | - | 2.1 ± 0.1 | 3622 ± 72 | 3170 ± 63 |
| 118 | Sesamum indicum L. | Pedaliaceae | H | 2.01 ± 0.03 | 3.5 ± 0.1 | - | 1.6 ± 0.0 | 2504 ± 49 | 2120 ± 40 |
| 119 | Sesamum radiatum Schumach. & Thonn. | Pedaliaceae | H | 1.07 ± 0.01 | 3.7 ± 0.1 | - | 1.5 ± 0.0 | 3398 ± 68 | 2975 ± 61 |
| 120 | Sesamum radiatum Schumach. & Thonn. | Pedaliaceae | H | 1.03 ± 0.00 | 3.8 ± 0.1 | - | 1.7 ± 0.0 | 4750 ± 97 | 4290 ± 85 |
| 121 | Piper nigrum L. | Piperacee | H | 37.00 ± 0.60 | 8.7 ± 0.2 | - | 7.8 ± 0.2 | 1949 ± 20 | 1660 ± 32 |
| 122 | Cleistanthus collinus (Roxb.) Benth. | Phyllanthaceae | T | 155 ± 3 | 4.5 ± 0.1 | - | 2.5 ± 0.1 | 2208 ± 44 | 675 ± 14 |
| 123 | Phyllanthus emblica L. | Phyllanthaceae | T | 921 ± 21 | 8.1 ± 0.2 | 95 ± 2 | 1.5 ± 0.0 | 493 ± 8 | 375 ± 8 |
| 124 | Bridelia retusa A.Juss. (spinous kino tree) | Phyllanthaceae | T | 154 ± 9 | 4.5 ± 0.1 | 19 ± 1 | 2.2 ± 0.1 | 3999 ± 82 | 3130 ± 63 |
| 125 | Persicaria punctate Small | Polygonaceae | H | 0.79 ± 0.10 | 2.1 ± 0.1 | - | 2.7 ± 0.1 | 1908 ± 39 | 770 ± 15 |
| 126 | Putranjiva roxburghii Wall. | Putranjivaceae | T | 478 ± 10 | 5.5 ± 0.1 | 66 ± 2 | 4.2 ± 0.1 | 493 ± 10 | 255 ± 5 |
| 127 | Nigella sativa L. | Ranunculaceae | H | 20.30 ± 2.15 | 5.5 ± 0.1 | - | 4.3 ± 0.1 | 4247 ± 86 | 3750 ± 39 |
| 128 | Ziziphus mauritiana Lam. | Rhamnaceae | T | 983 ± 22 | 11 ± 0.3 | 90 ± 2 | 4.5 ± 0.1 | 1279 ± 25 | 1065 ± 11 |
| 129 | Anthocephalus indicus A.Rich. | Rubiaceae | T | 20253 ± 43 | 36 ± 1.0 | - | 5.5 ± 0.1 | 1415 ± 27 | 570 ± 12 |
| 130 | Gardenia thunbergia Thunb. | Rubiaceae | S | 5480 ± 121 | 8.5 ± 0.2 | 37 ± 1 | 3.5 ± 0.1 | 607 ± 11 | 350 ± 7 |
| 131 | Prunus dulcis (Mill.) D.A. Webb | Rosaceae | T | 2623 ± 41 | 4.5 ± 0.1 | 29 ± 1 | 2.5 ± 0.1 | 598 ± 12 | 265 ± 7 |
| 132 | Aegle marmelos L. | Rutaceae | T | 148 ± 3 | 3.5 ± 0.1 | 22 ± 1 | 1.5 ± 0.0 | 1899 ± 17 | 1530 ± 31 |
| 133 | Citrus limon (L.) Burm.f. | Rutaceae | S | 68.30 ± 1.30 | 4.1 ± 0.1 | 17 ± 0 | 4.8 ± 0.2 | 567 ± 12 | 510 ± 11 |
| 134 | Citrus × sinensis (L.) Osbeck | Rutaceae | S | 120 ± 3 | 5.4 ± 0.1 | 22 ± 1 | 5.1 ± 0.2 | 663 ± 14 | 375 ± 8 |
| 135 | Murraya koenigii Spreng. | Rutaceae | S | 155 ± 3 | 2.9 ± 0.1 | 12 ± 0 | 1.5 ± 0.0 | 2927 ± 39 | 2520 ± 52 |
| 136 | Santalum album L. | Santalaceae | T | 183 ± 4 | 2.8 ± 0.1 | 40 ± 1 | 1.8 ± 0.1 | 1480 ± 31 | 1065 ± 22 |
| 137 | Cardiospermum halicacabum L. | Sapindaceae | V | 2.50 ± 0.20 | 3.1 ± 0.1 | - | 2.1 ± 0.1 | 779 ± 15 | 275 ± 6 |
| 138 | Litchi chinensis Sonn. | Sapindaceae | T | 2168 ± 41 | 11 ± 0.2 | - | 5.5 ± 0.0 | 2043 ± 42 | 410 ± 8 |
| 139 | Sapindus emarginatus Vahl. | Sapindaceae | T | 2148 ± 42 | 6.5 ± 0.1 | 61 ± 2 | 3.5 ± 0.1 | 342 ± 7 | 290 ± 6 |
| 140 | Schleichera oleosa (Lour.) Oken | Sapindaceae | T | 352 ± 7 | 4.1 ± 0.1 | 49 ± 1 | 3.6 ± 0.1 | 2442 ± 49 | 2195 ± 44 |
| 141 | Illicium verum Hook.f. | Schisandraceae | H | 26.70 ± 0.50 | 5.5 ± 0.1 | 58 ± 2 | 3.7 ± 0.0 | 1323 ± 26 | 565 ± 12 |
| 142 | Capsicum annuum L. (small mirch) | Solanaceae | H | 6.30 ± 0.15 | 4.7 ± 0.1 | - | 4.3 ± 0.0 | 460 ± 10 | 320 ± 6 |
| 143 | Capsicum annuum L. (medium mirch) | Solanaceae | H | 4.22 ± 0.10 | 4.3 ± 0.1 | - | 4.6 ± 0.1 | 419 ± 9 | 315 ± 7 |
| 144 | Datura stramonium L. | Solanaceae | H | 18.20 ± 0.40 | 6.5 ± 0.1 | - | 3.5 ± 0.1 | 935 ± 19 | 510 ± 11 |
| 145 | Solanum lycopersicum L. | Solanaceae | H | 2.01 ± 0.23 | 5.2 ± 0.1 | - | 5.3 ± 0.1 | 1298 ± 27 | 1080 ± 21 |
| 146 | Solanum melongena L. (white) | Solanaceae | H | 3.02 ± 0.05 | 4.5 ± 0.1 | - | 5.1 ± 0.1 | 728 ± 16 | 445 ± 9 |
| 147 | Solanum melongena L. (purple) | Solanaceae | H | 2.00 ± 0.04 | 6.4 ± 0.1 | - | 4.8 ± 0.1 | 865 ± 17 | 770 ± 15 |
| 148 | Solanum melongena L. (green) | Solanaceae | H | 3.01 ± 0.06 | 6.5 ± 0.1 | - | 5.2 ± 0.0 | 520 ± 11 | 455 ± 9 |
| 149 | Solanum melongena L. (Singhi) | Solanaceae | H | 2.01 ± 0.08 | 6.6 ± 0.1 | - | 4.9 ± 0.0 | 681 ± 13 | 470 ± 10 |
| 150 | Solanum virginianum L. | Solenaceae | H | 2.02 ± 0.05 | 6.3 ± 0.1 | - | 6.5 ± 0.0 | 2123 ± 43 | 680 ± 14 |
| 151 | Withania coagulans Dunal | Solanaceae | H | 399 ± 8 | 6.1 ± 0.1 | 15 ± 0 | 3.1 ± 0.0 | 944 ± 20 | 635 ± 13 |
| 152 | Withania somnifera (L.) Dunal | Solanaceae | H | 2.02 ± 0.06 | 1.4 ± 0.1 | - | 1.2 ± 0.0 | 837 ± 17 | 505 ± 10 |
| 153 | Lantana camara L. | Verbenaceae | H | 20.40 ± 0.05 | 8.3 ± 0.1 | - | 2.1 ± 0.1 | 614 ± 12 | 265 ± 6 |
| 154 | Amomum subulatum Roxb. | Zingiberaceae | H | 17.40 ± 0.06 | 4.3 ± 0.1 | - | 4.3 ± 0.1 | 427 ± 9 | 340 ± 7 |
| 155 | Elettaria cardamomum Maton | Zingiberaceae | H | 10.30 ± 0.20 | 5.1 ± 0.1 | - | 4.6 ± 0.0 | 298 ± 6 | 265 ± 5 |
| Type | Na | Mg | Al | P | S | Cl | K | Ca | Ti | Cr | Mn | Fe | Co | Cu | Zn | Rb | Sr | Mo | Ba | Pb |
|---|---|---|---|---|---|---|---|---|---|---|---|---|---|---|---|---|---|---|---|---|
| T | 286 | 169 | 0.9 | 349 | 435 | 21 | 1034 | 334 | 0.3 | 0.2 | 3.2 | 42 | 0.06 | 1.3 | 3.5 | 1.5 | 0.9 | 0.07 | 0.1 | 0.07 |
| S | 207 | 218 | 6.4 | 380 | 281 | 34 | 1239 | 368 | 1.3 | 0.2 | 3.9 | 107 | 0.02 | 1.1 | 5.2 | 1.4 | 1.4 | 0.12 | 0.0 | 0.07 |
| H | 137 | 206 | 10.3 | 449 | 327 | 80 | 974 | 499 | 1.0 | 0.1 | 6.9 | 35 | 0.07 | 1.4 | 4.3 | 1.6 | 2.5 | 0.01 | 0.5 | 0.05 |
| V | 0.0 | 156 | 0.0 | 496 | 226 | 9 | 581 | 156 | 0.2 | 0.0 | 5.5 | 20 | 0.02 | 1.5 | 5.5 | 1.3 | 0.6 | 0.01 | 0.1 | 0.03 |
Publisher’s Note: MDPI stays neutral with regard to jurisdictional claims in published maps and institutional affiliations. |
© 2022 by the authors. Licensee MDPI, Basel, Switzerland. This article is an open access article distributed under the terms and conditions of the Creative Commons Attribution (CC BY) license (https://creativecommons.org/licenses/by/4.0/).
Share and Cite
Sahu, P.K.; Cervera-Mata, A.; Chakradhari, S.; Singh Patel, K.; Towett, E.K.; Quesada-Granados, J.J.; Martín-Ramos, P.; Rufián-Henares, J.A. Seeds as Potential Sources of Phenolic Compounds and Minerals for the Indian Population. Molecules 2022, 27, 3184. https://doi.org/10.3390/molecules27103184
Sahu PK, Cervera-Mata A, Chakradhari S, Singh Patel K, Towett EK, Quesada-Granados JJ, Martín-Ramos P, Rufián-Henares JA. Seeds as Potential Sources of Phenolic Compounds and Minerals for the Indian Population. Molecules. 2022; 27(10):3184. https://doi.org/10.3390/molecules27103184
Chicago/Turabian StyleSahu, Pravin Kumar, Ana Cervera-Mata, Suryakant Chakradhari, Khageshwar Singh Patel, Erick K. Towett, José J. Quesada-Granados, Pablo Martín-Ramos, and José A. Rufián-Henares. 2022. "Seeds as Potential Sources of Phenolic Compounds and Minerals for the Indian Population" Molecules 27, no. 10: 3184. https://doi.org/10.3390/molecules27103184
APA StyleSahu, P. K., Cervera-Mata, A., Chakradhari, S., Singh Patel, K., Towett, E. K., Quesada-Granados, J. J., Martín-Ramos, P., & Rufián-Henares, J. A. (2022). Seeds as Potential Sources of Phenolic Compounds and Minerals for the Indian Population. Molecules, 27(10), 3184. https://doi.org/10.3390/molecules27103184