
Photocatalytic Technology for Palm Oil Mill Effluent (POME) Wastewater Treatment: Current Progress and Future Perspective


Abstract

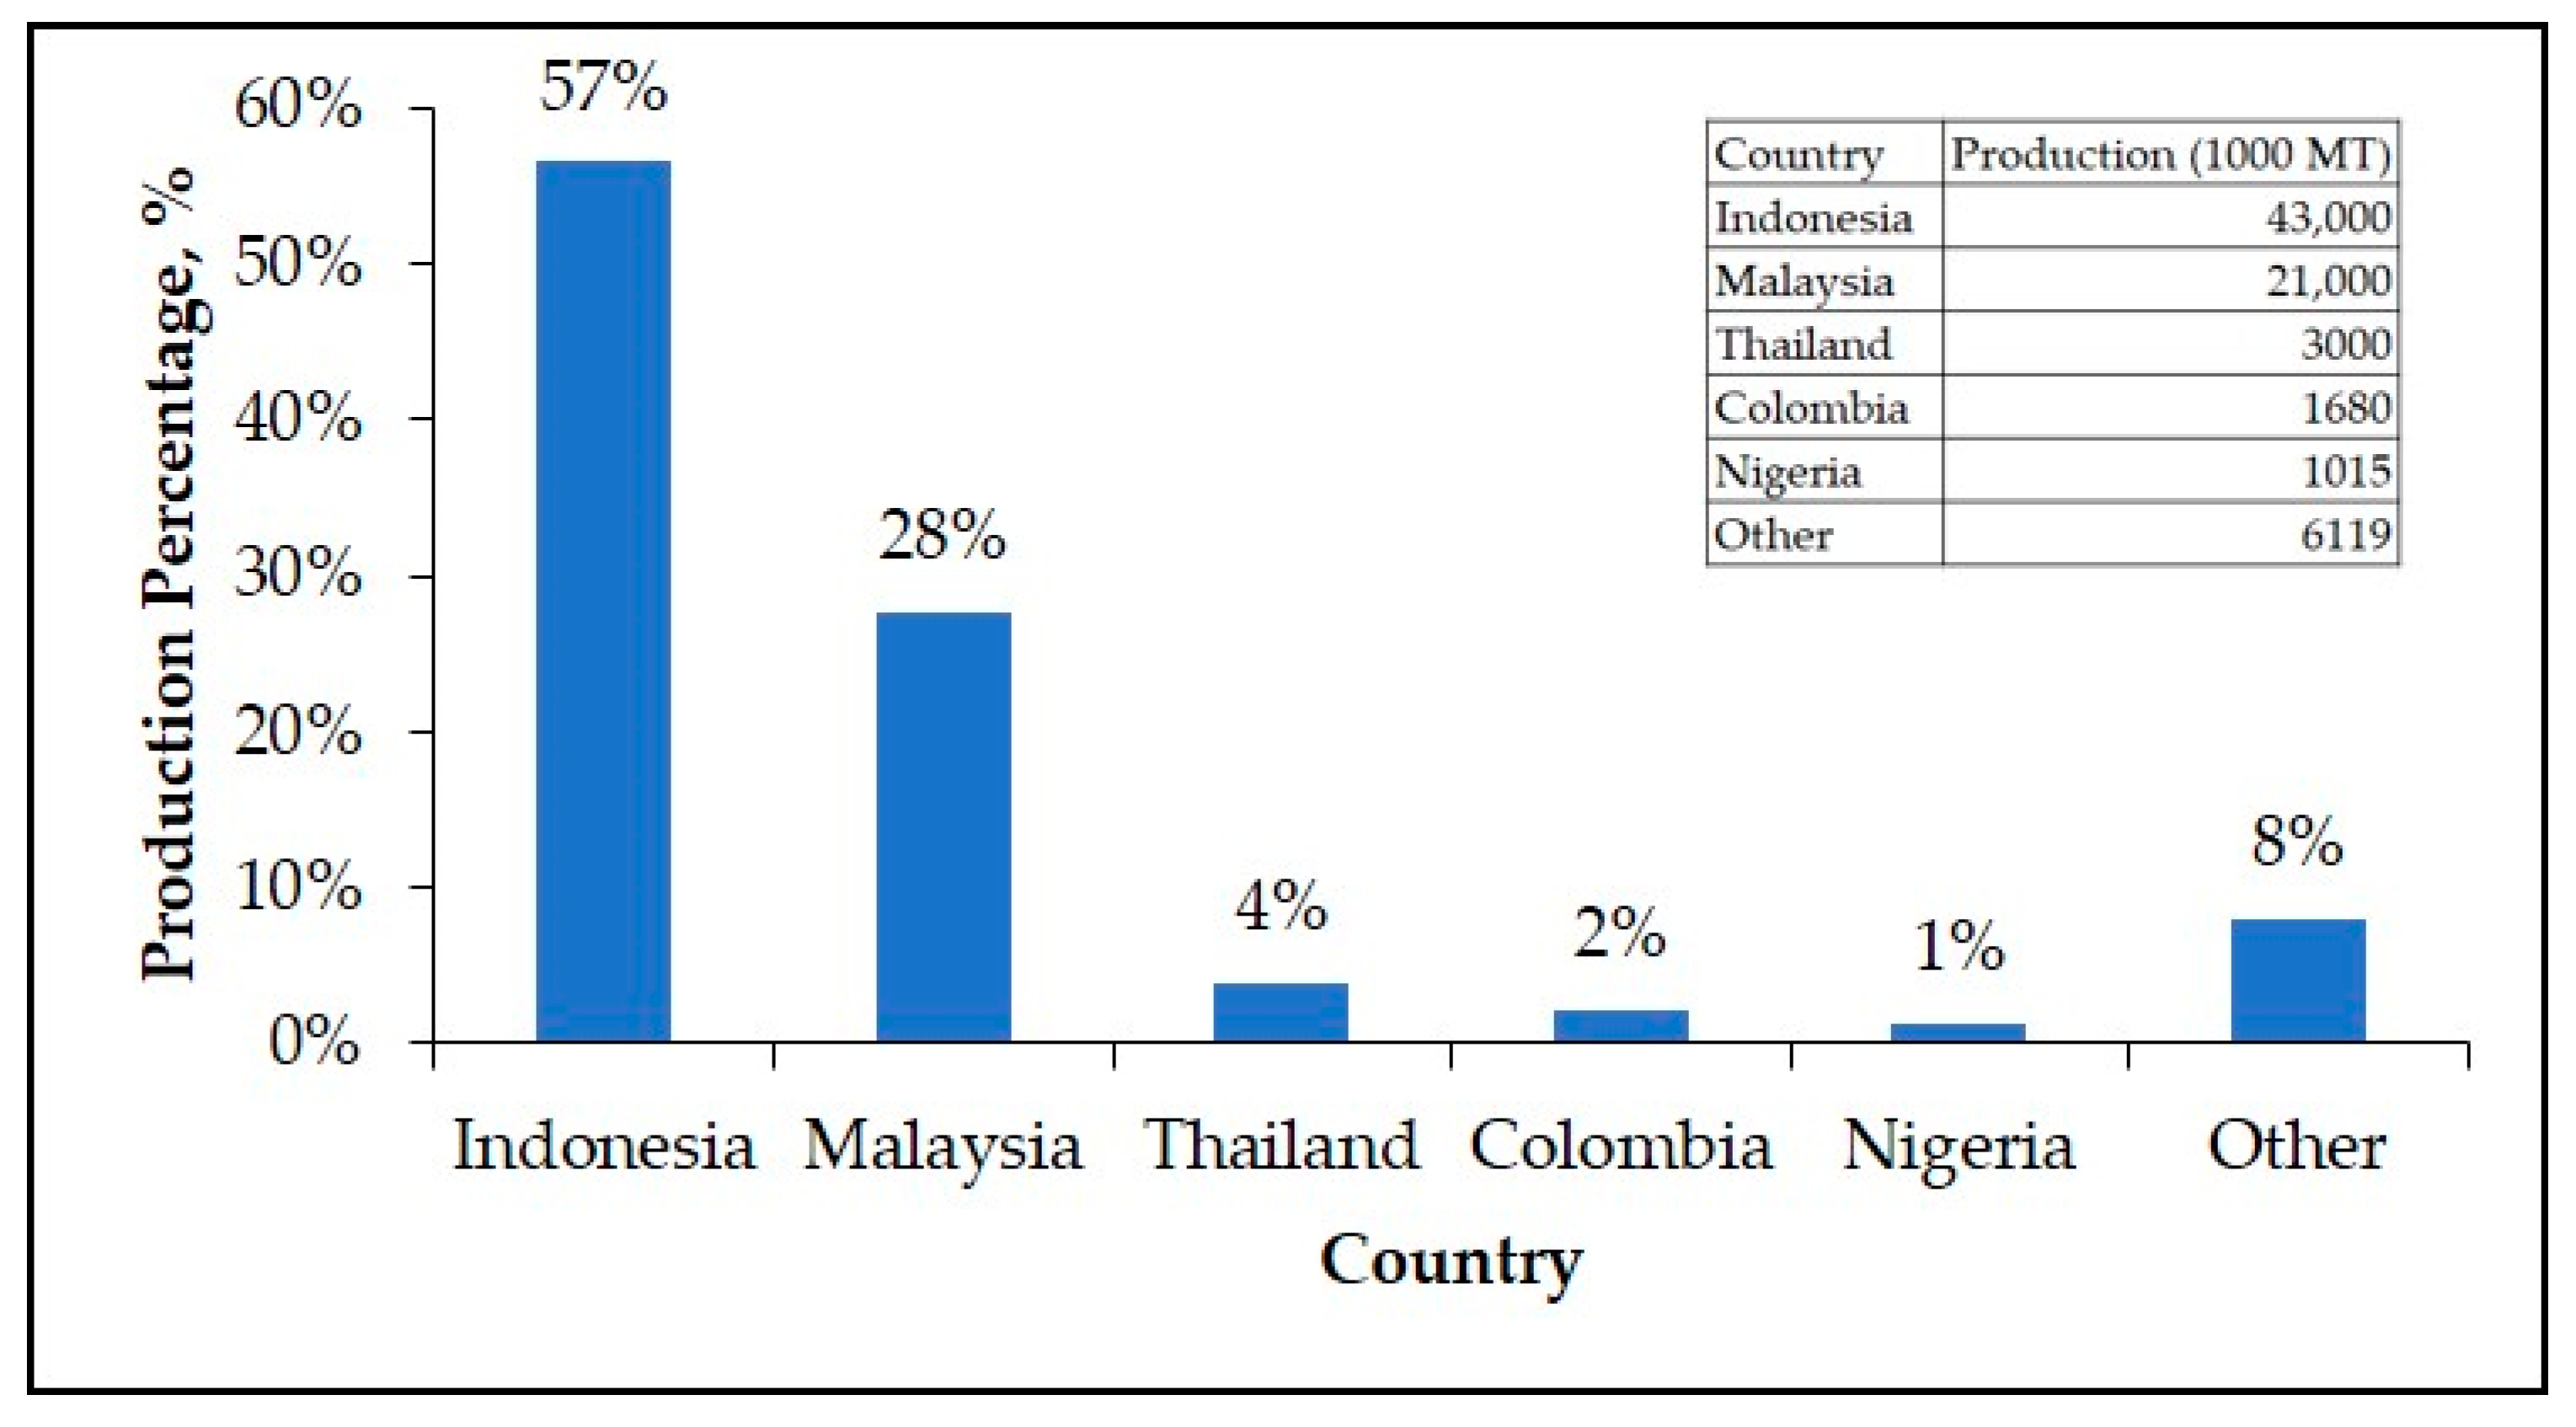
1. Introduction
2. Characteristic of POME
3. Laws and Legislations for POME Discharge
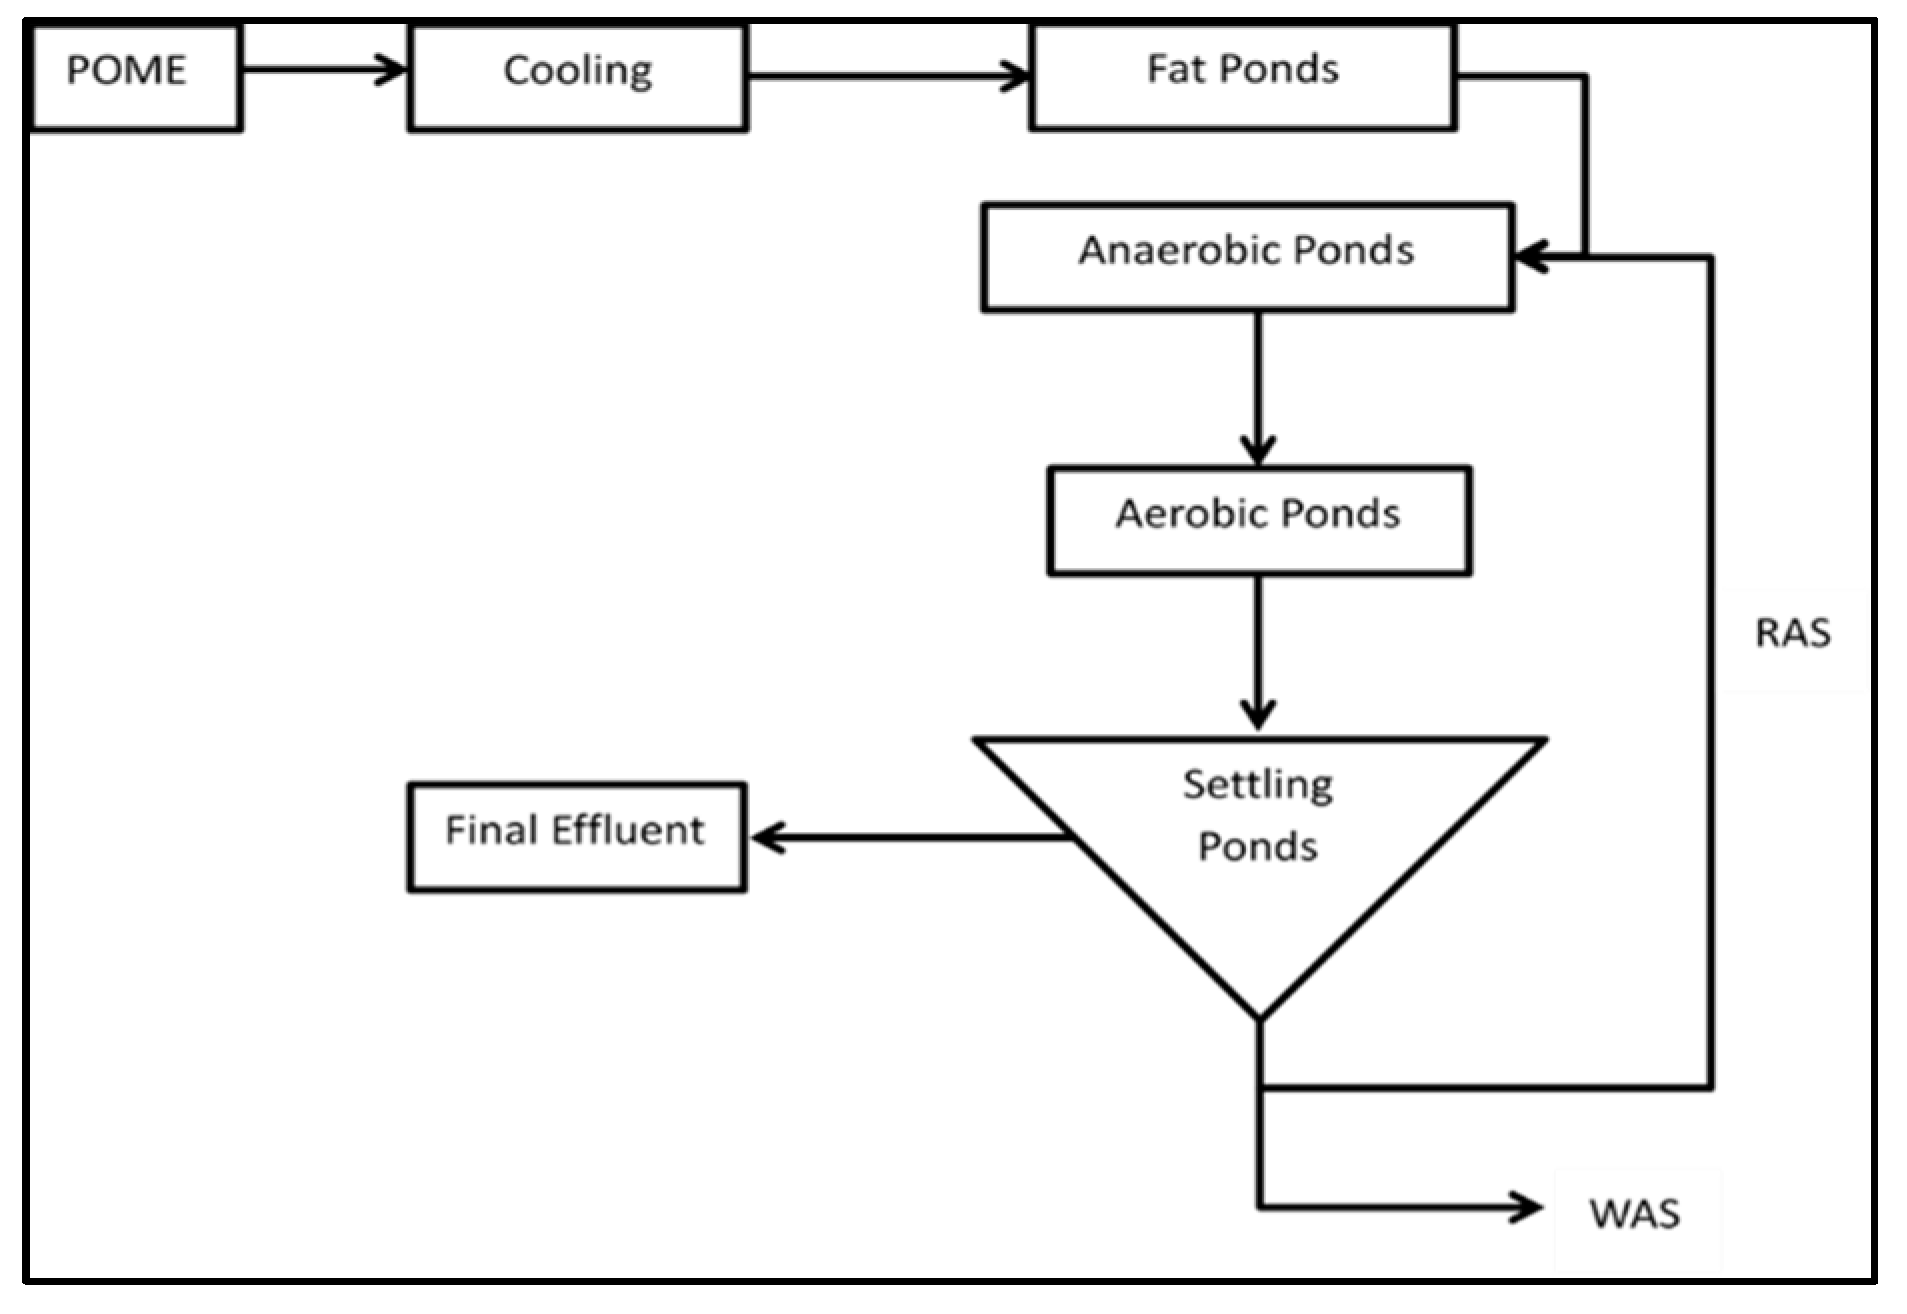
4. Conventional Palm Oil Mill Effluent (POME) Treatment Technologies
5. Alternative Palm Oil Mill Effluent (POME) Treatment Technologies
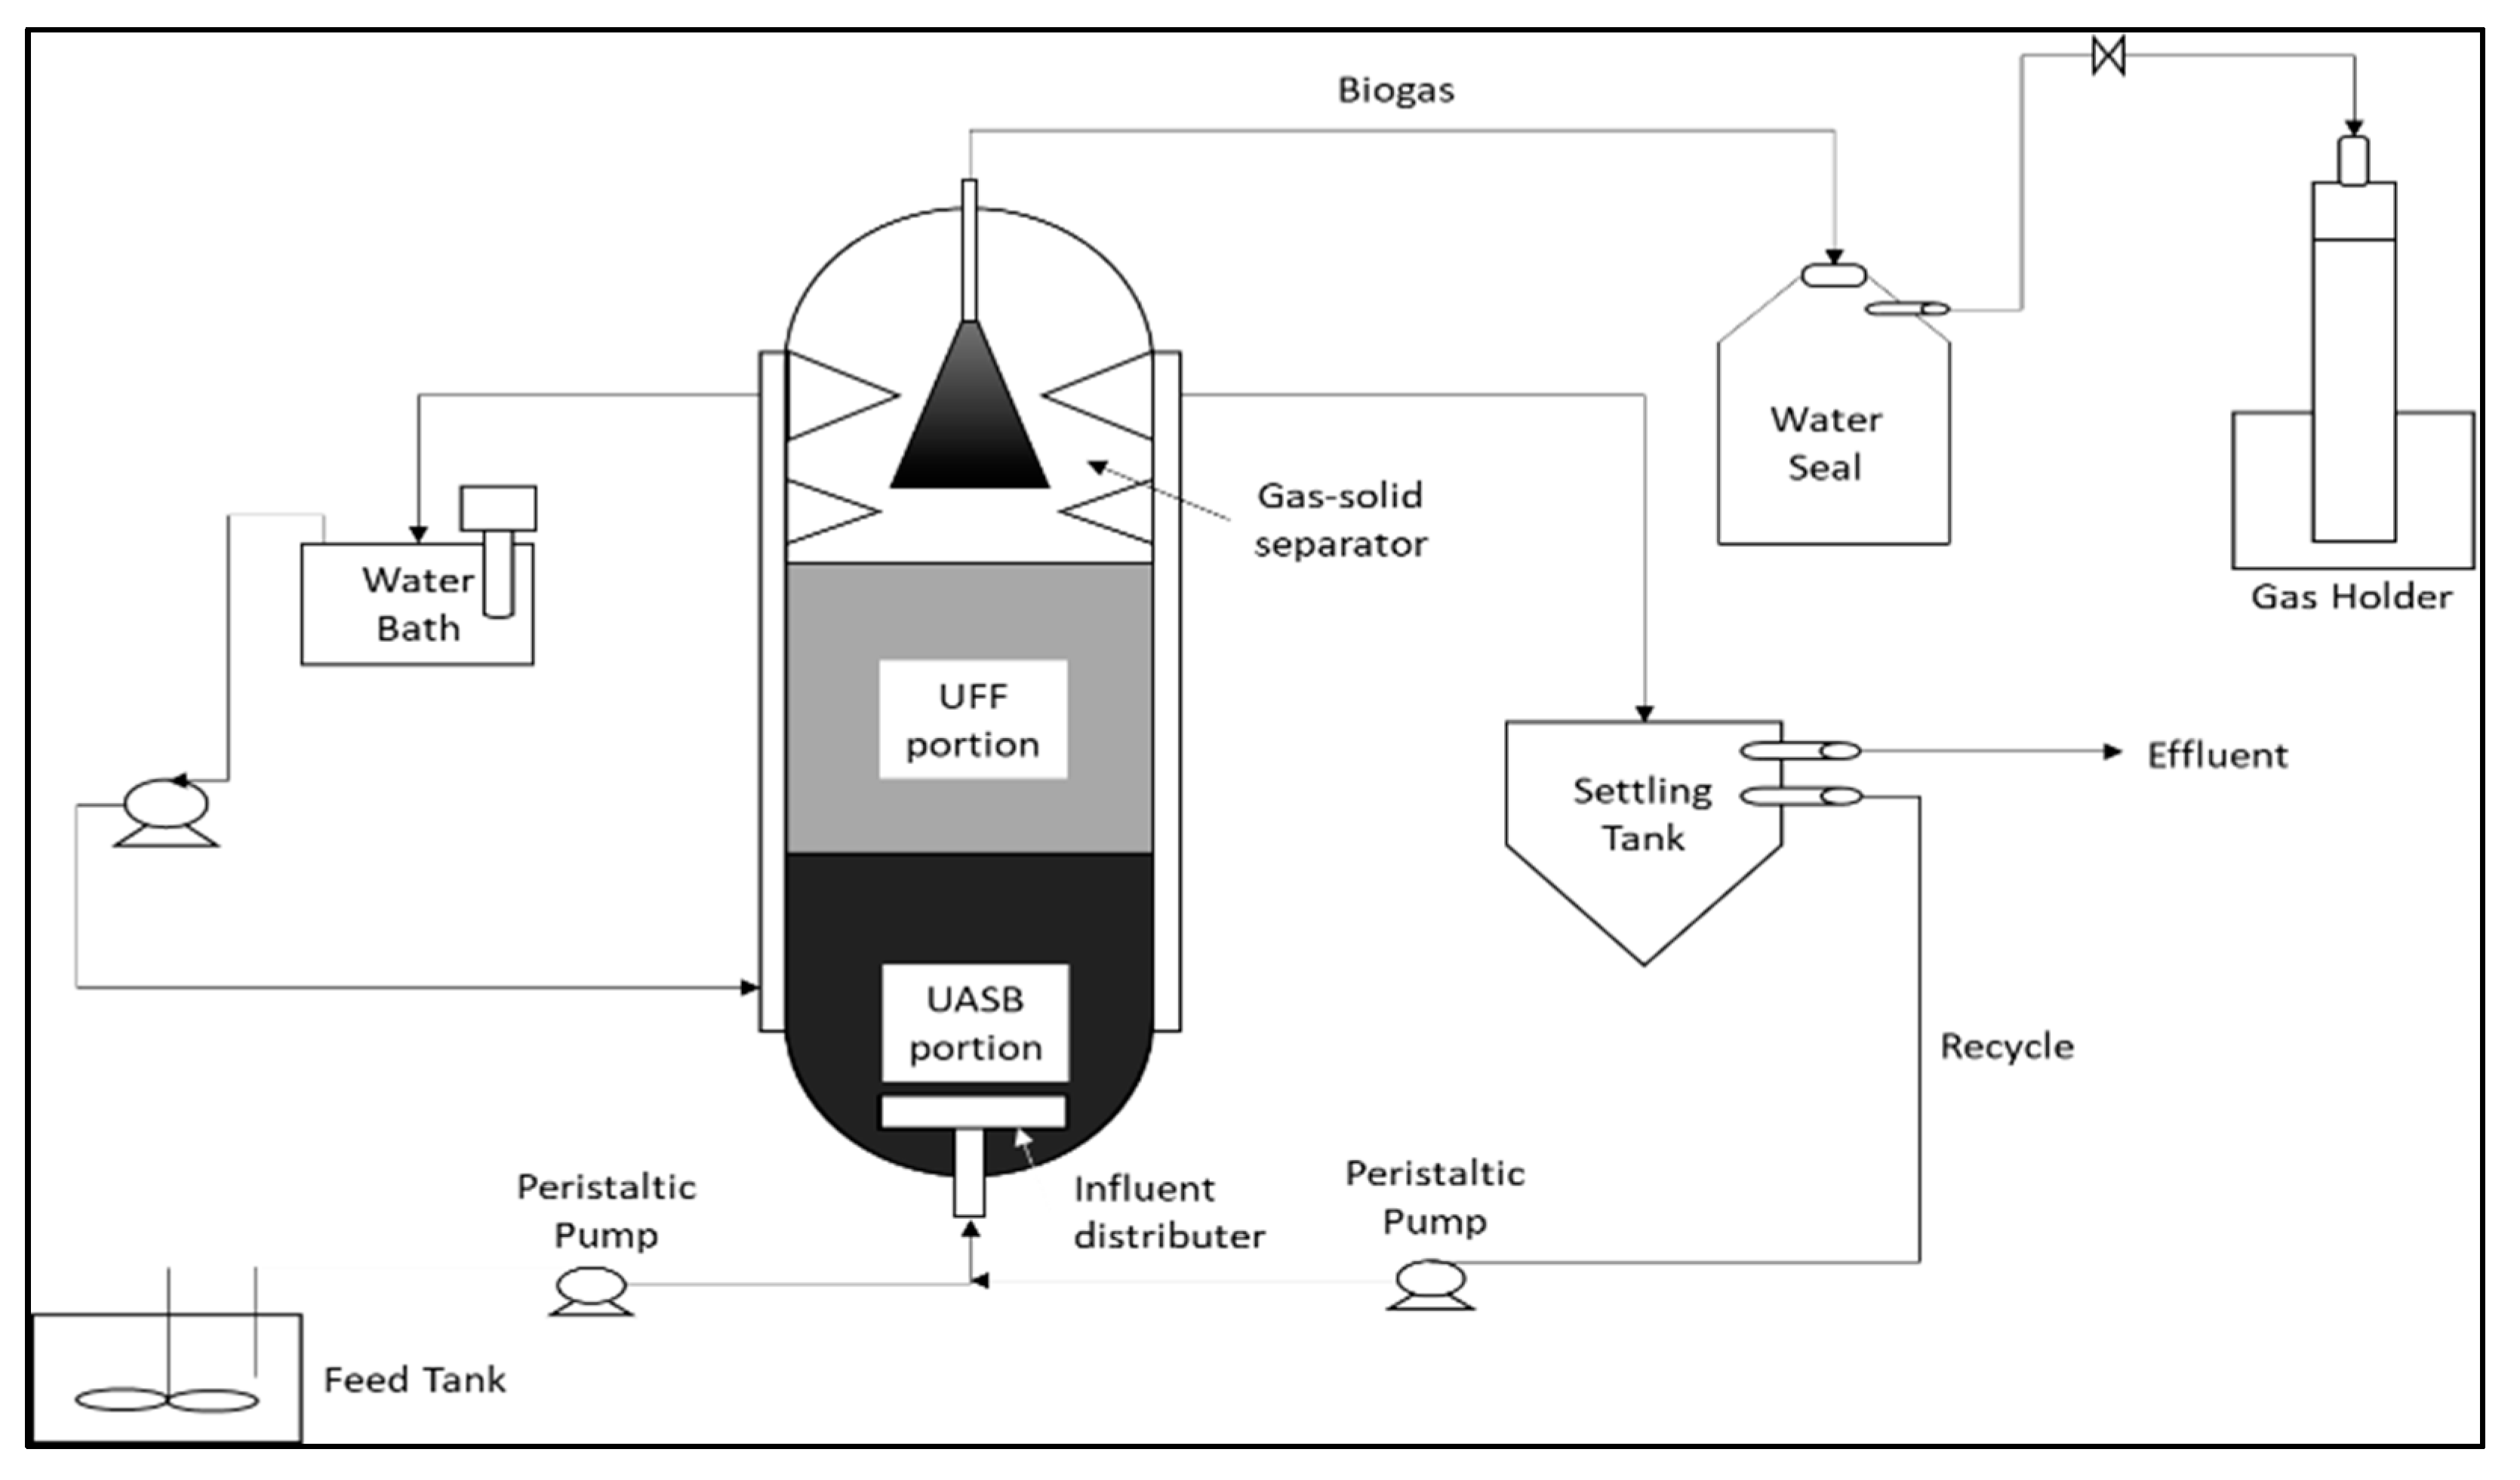
5.1. Biological Treatment
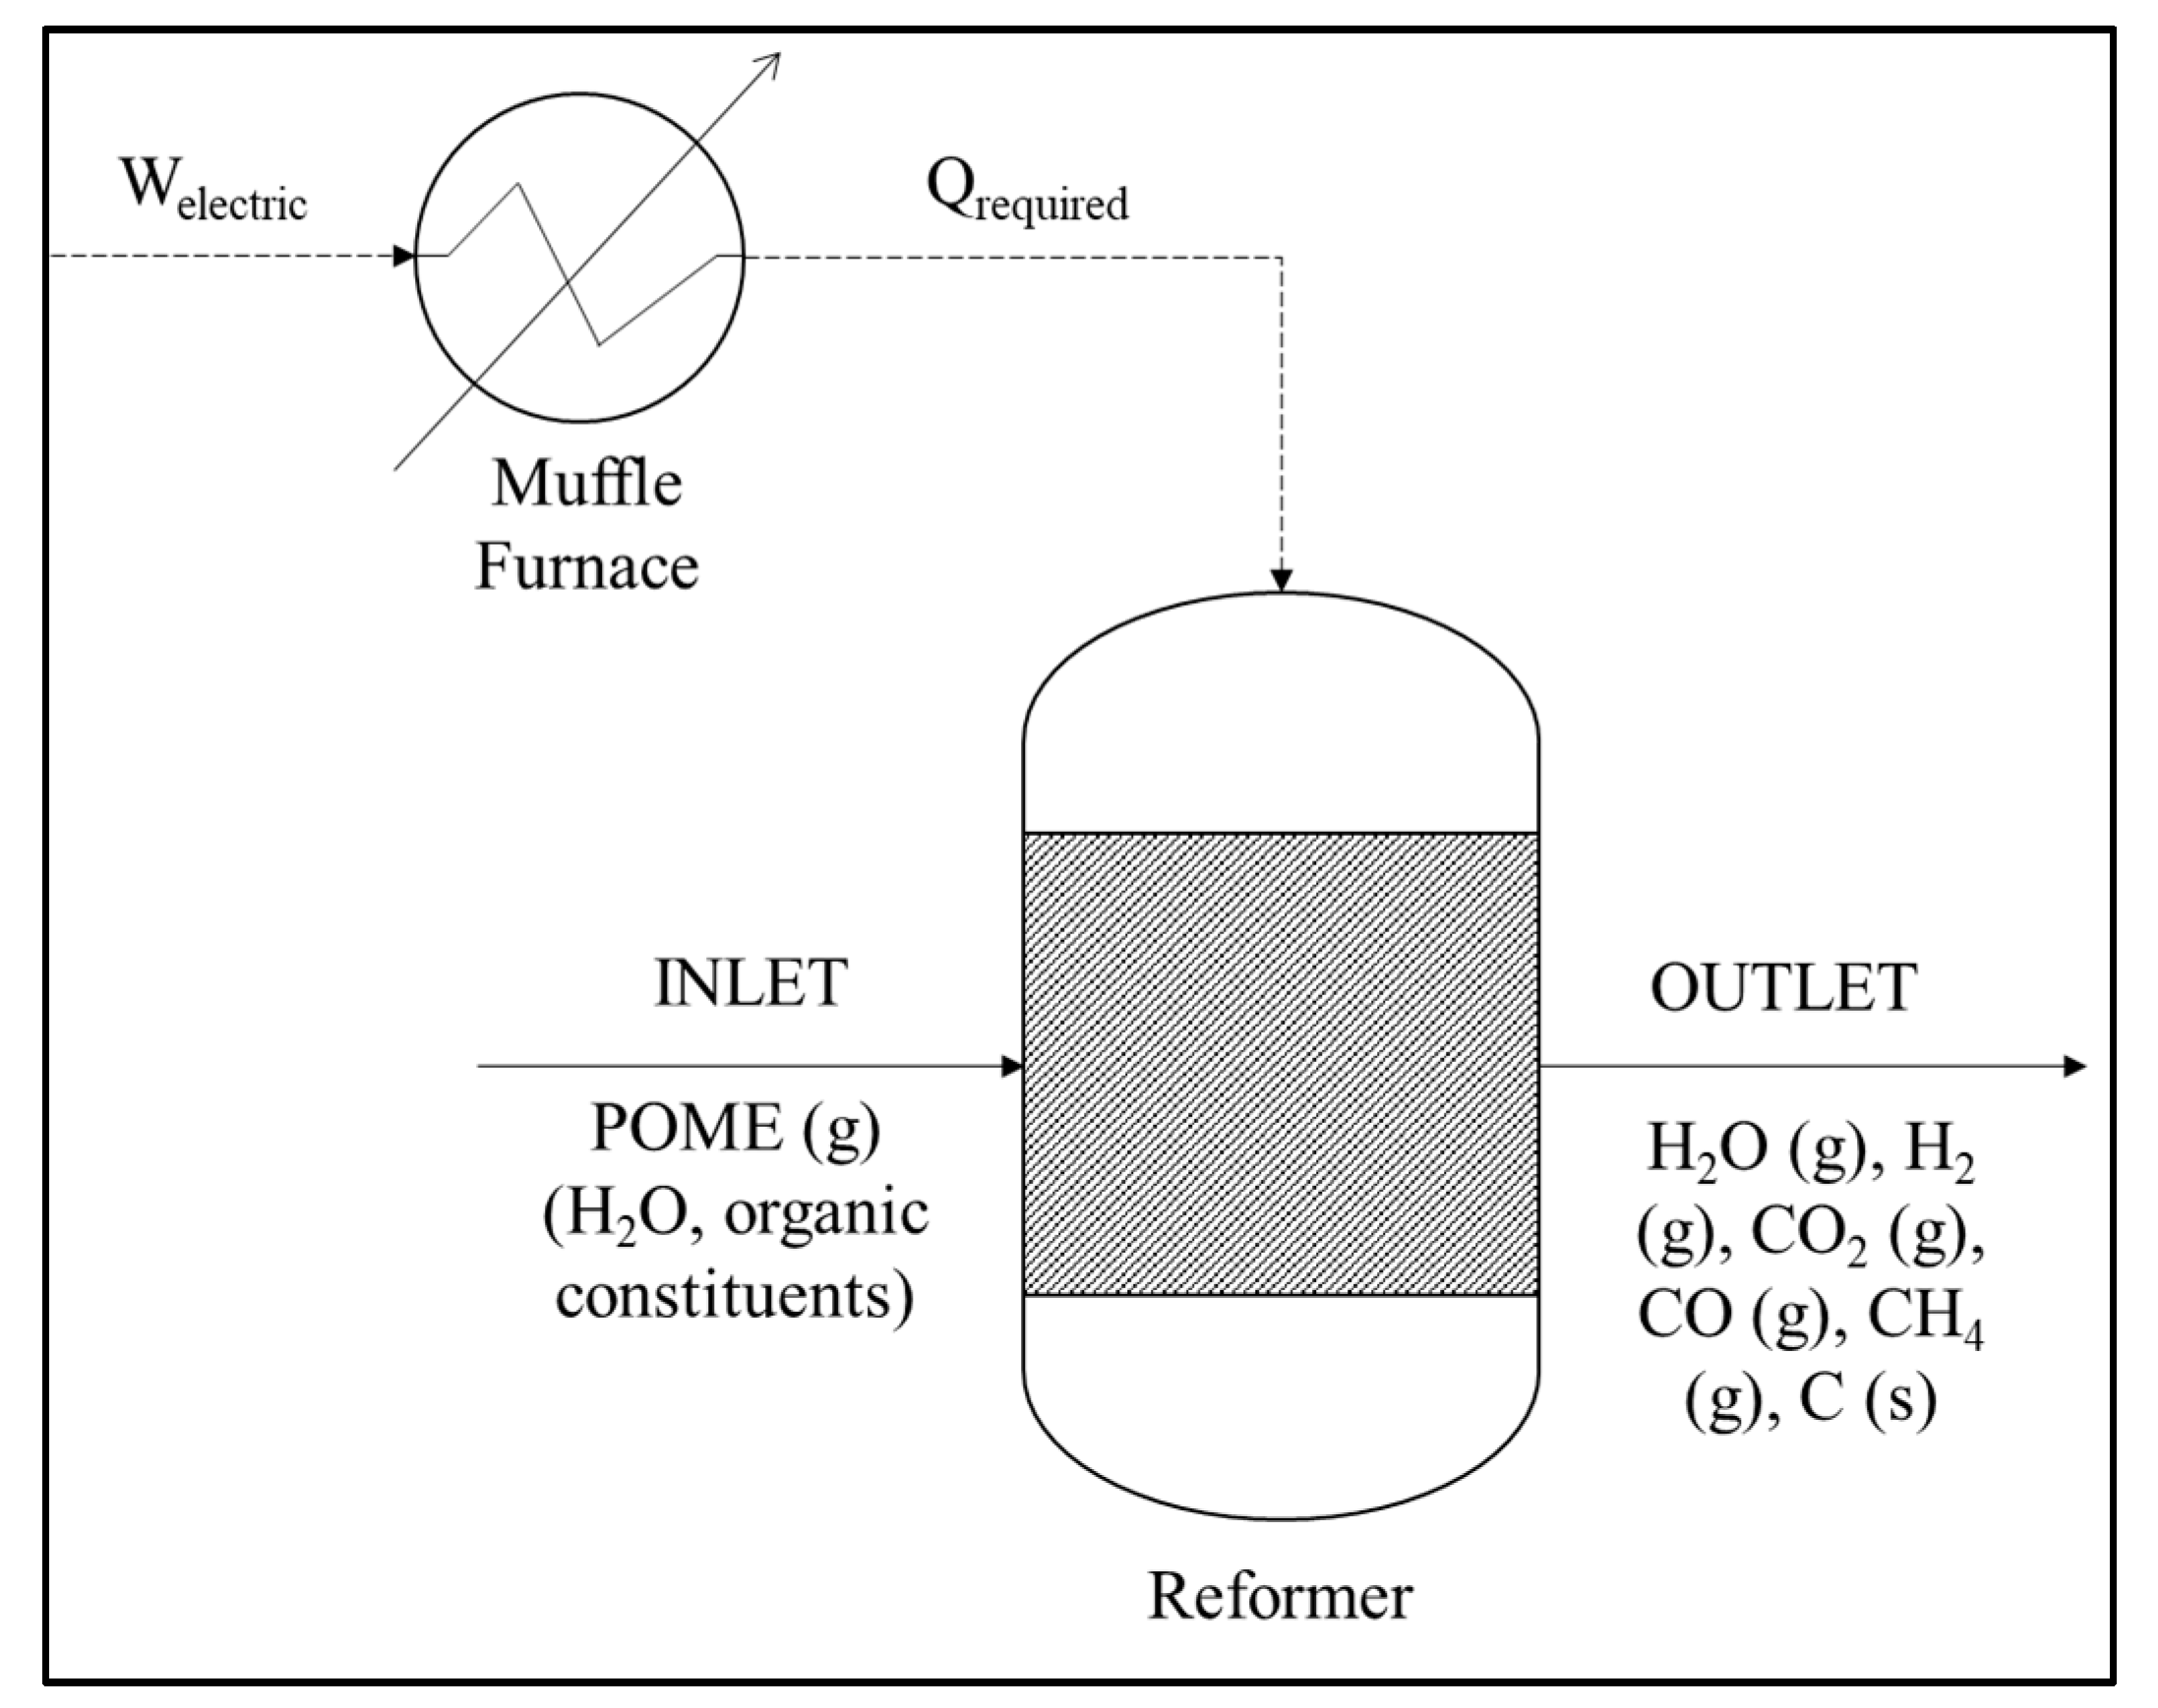
5.2. Thermochemical Treatment
5.3. Physiochemical Treatment
5.4. Integration Treatment
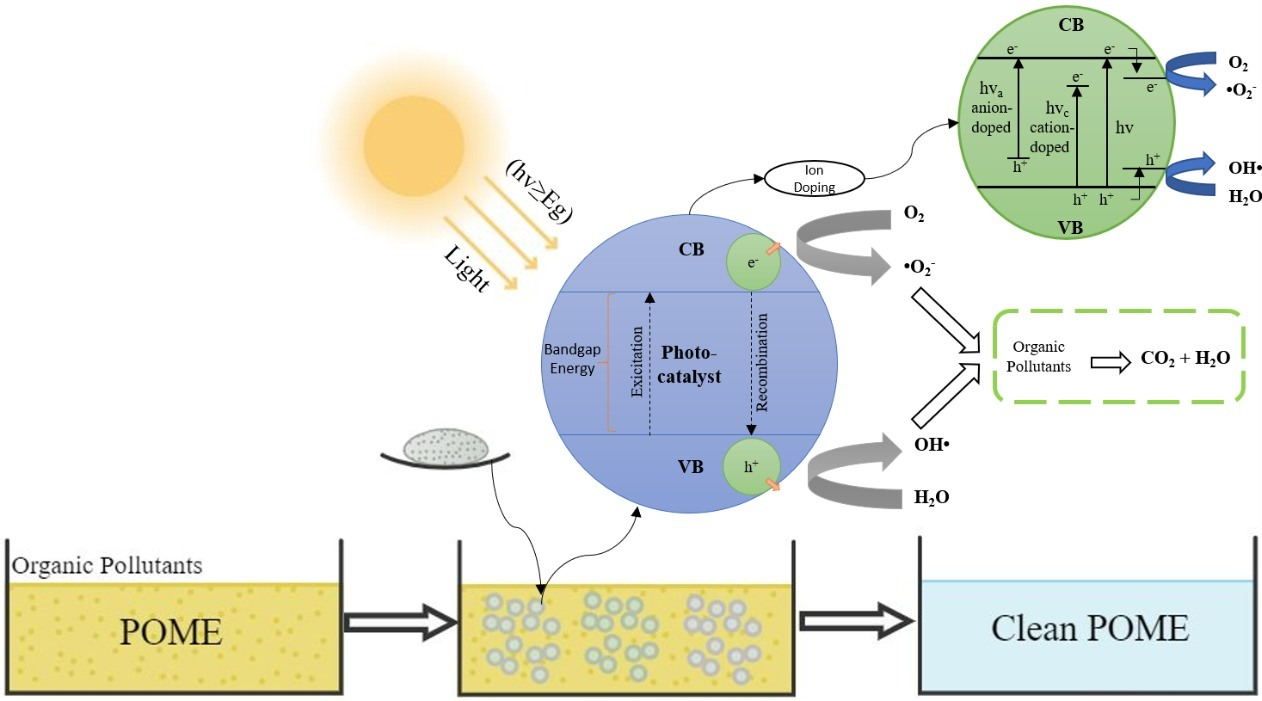
6. Photocatalytic Technology for POME Treatment
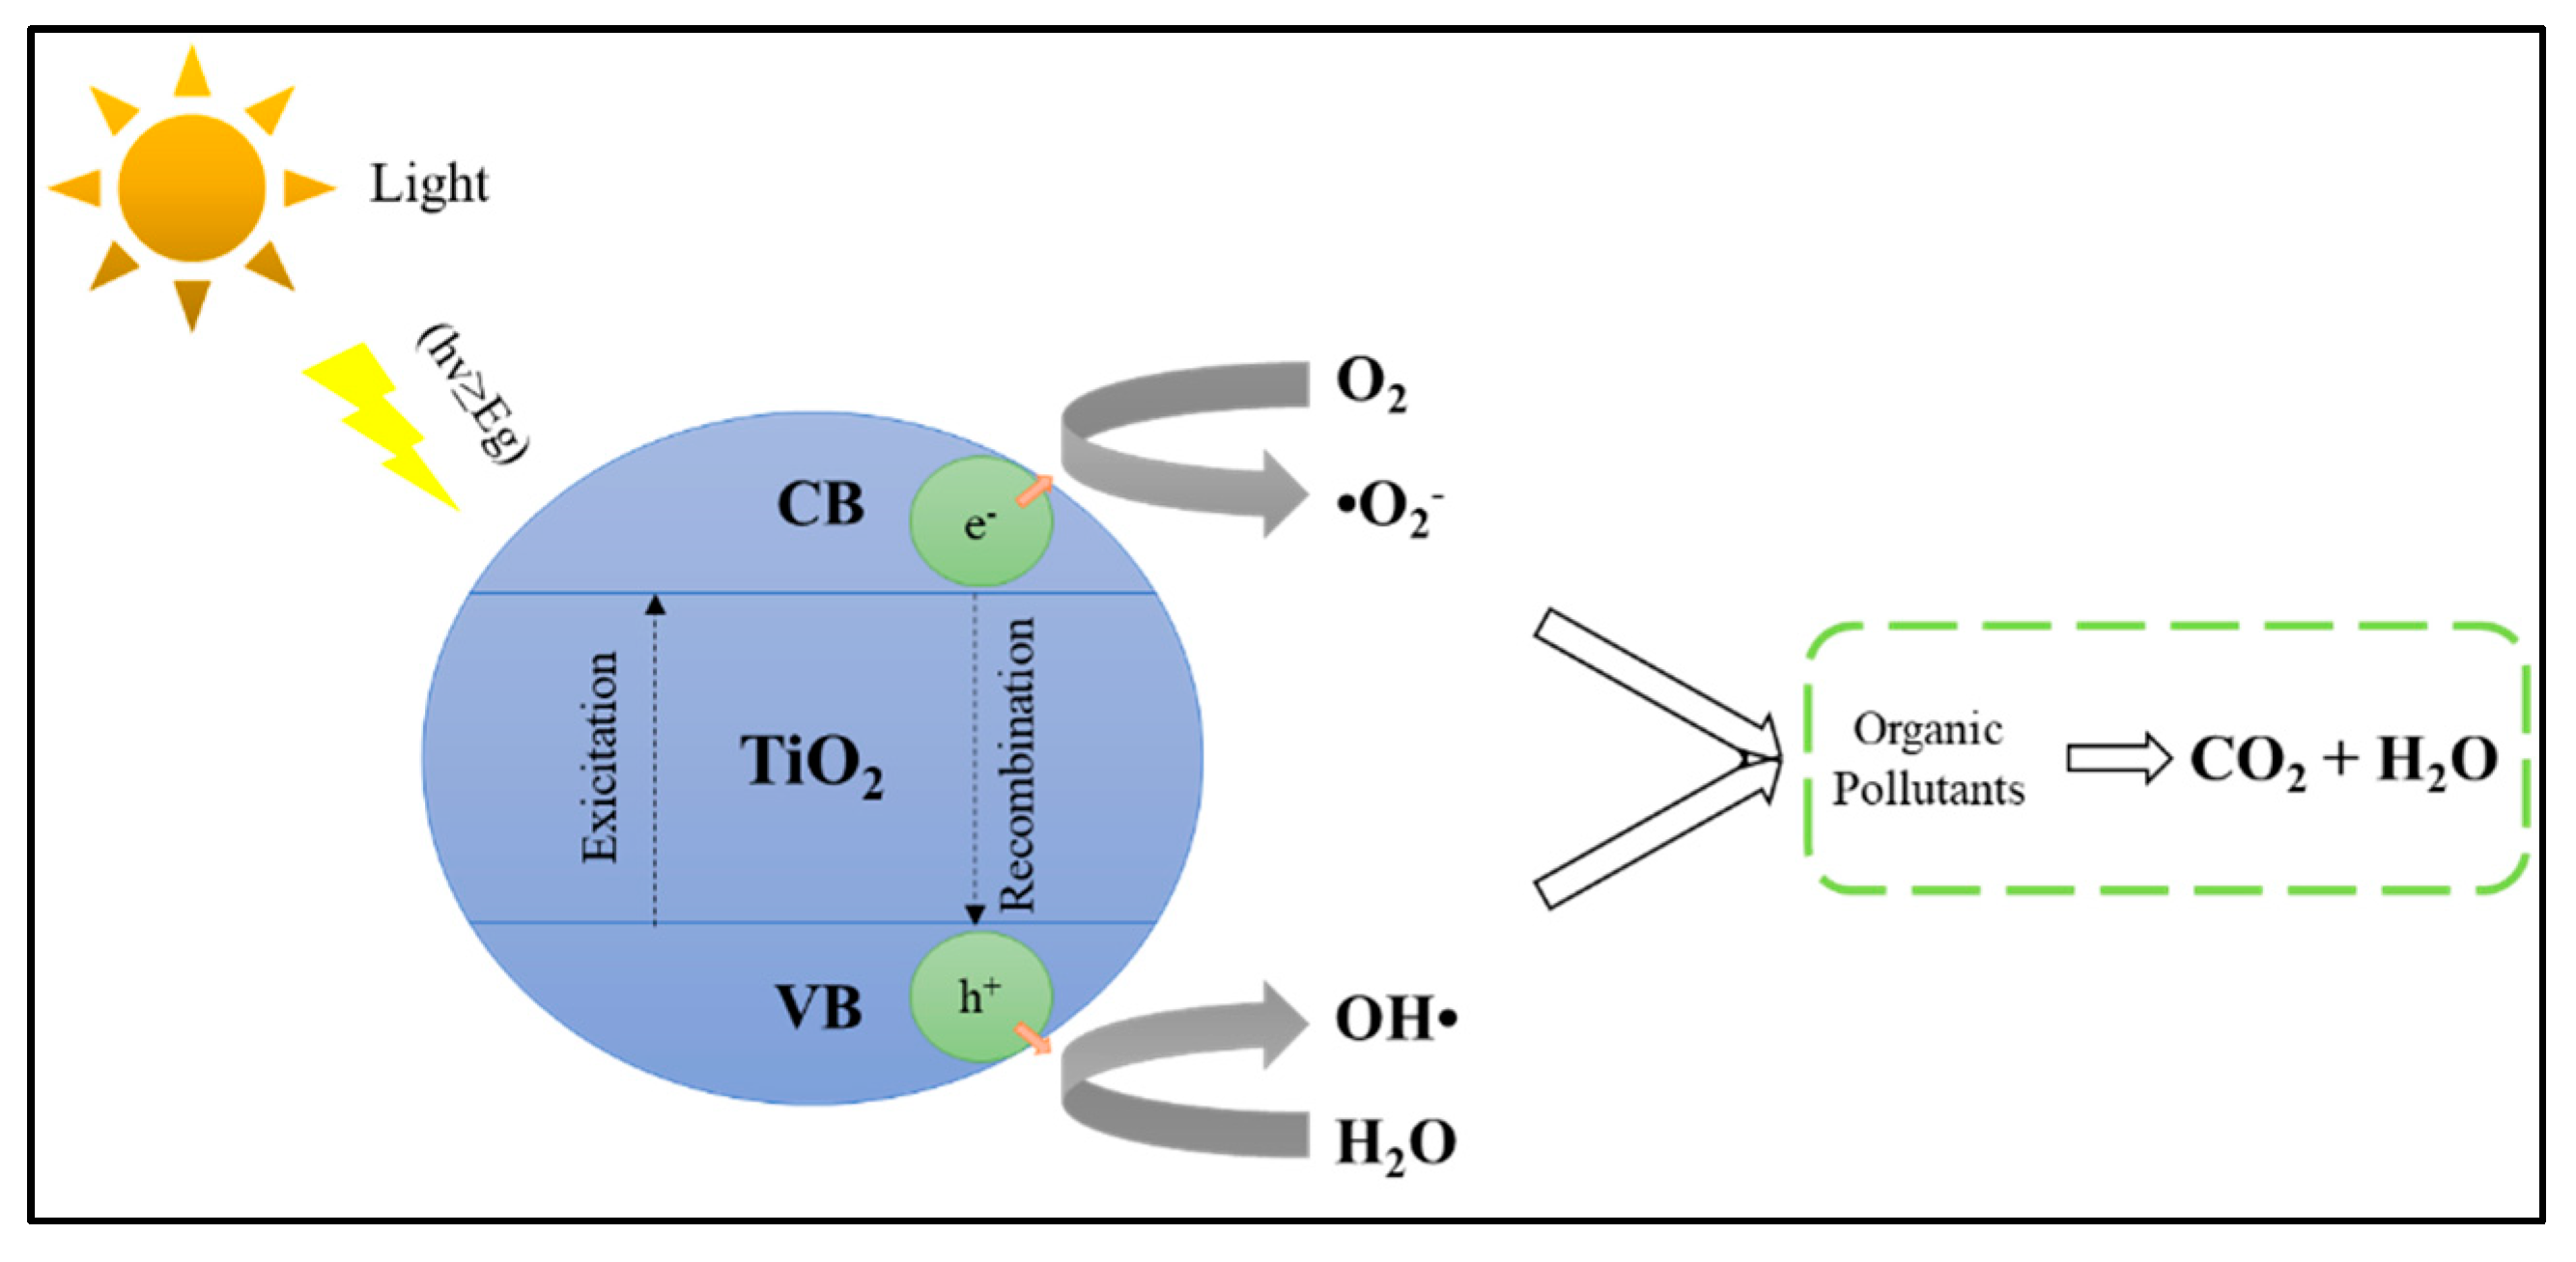
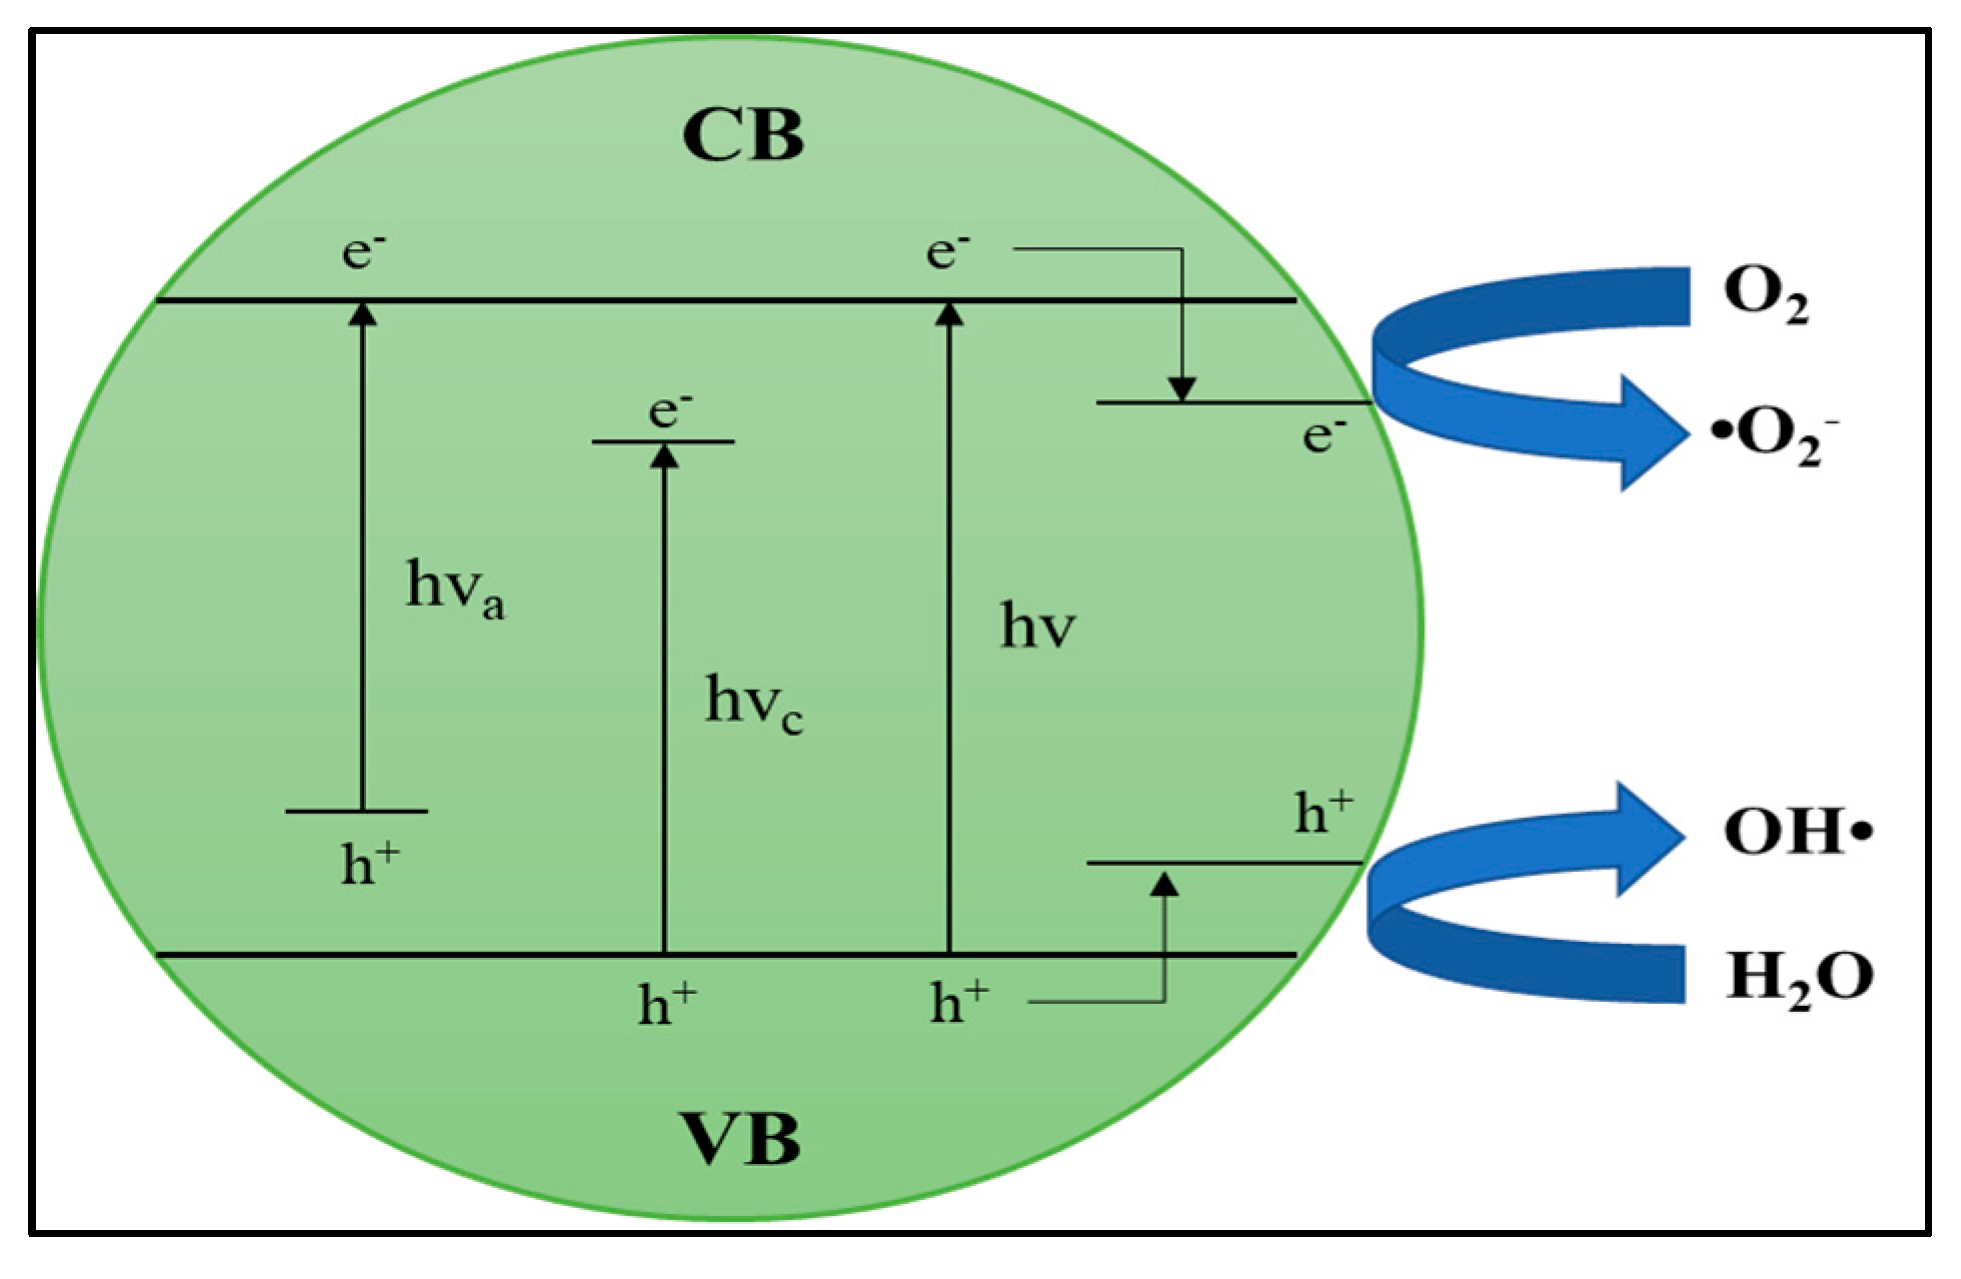
6.1. Mechanisms and Fundamentals of Photocatalytic Technology
6.2. Development of Photocatalytic Process for POME Treatment
6.2.1. Semiconductor Based Photocatalyst
TiO2 Photocatalyst
WO3 Photocatalyst
ZnO Photocatalyst
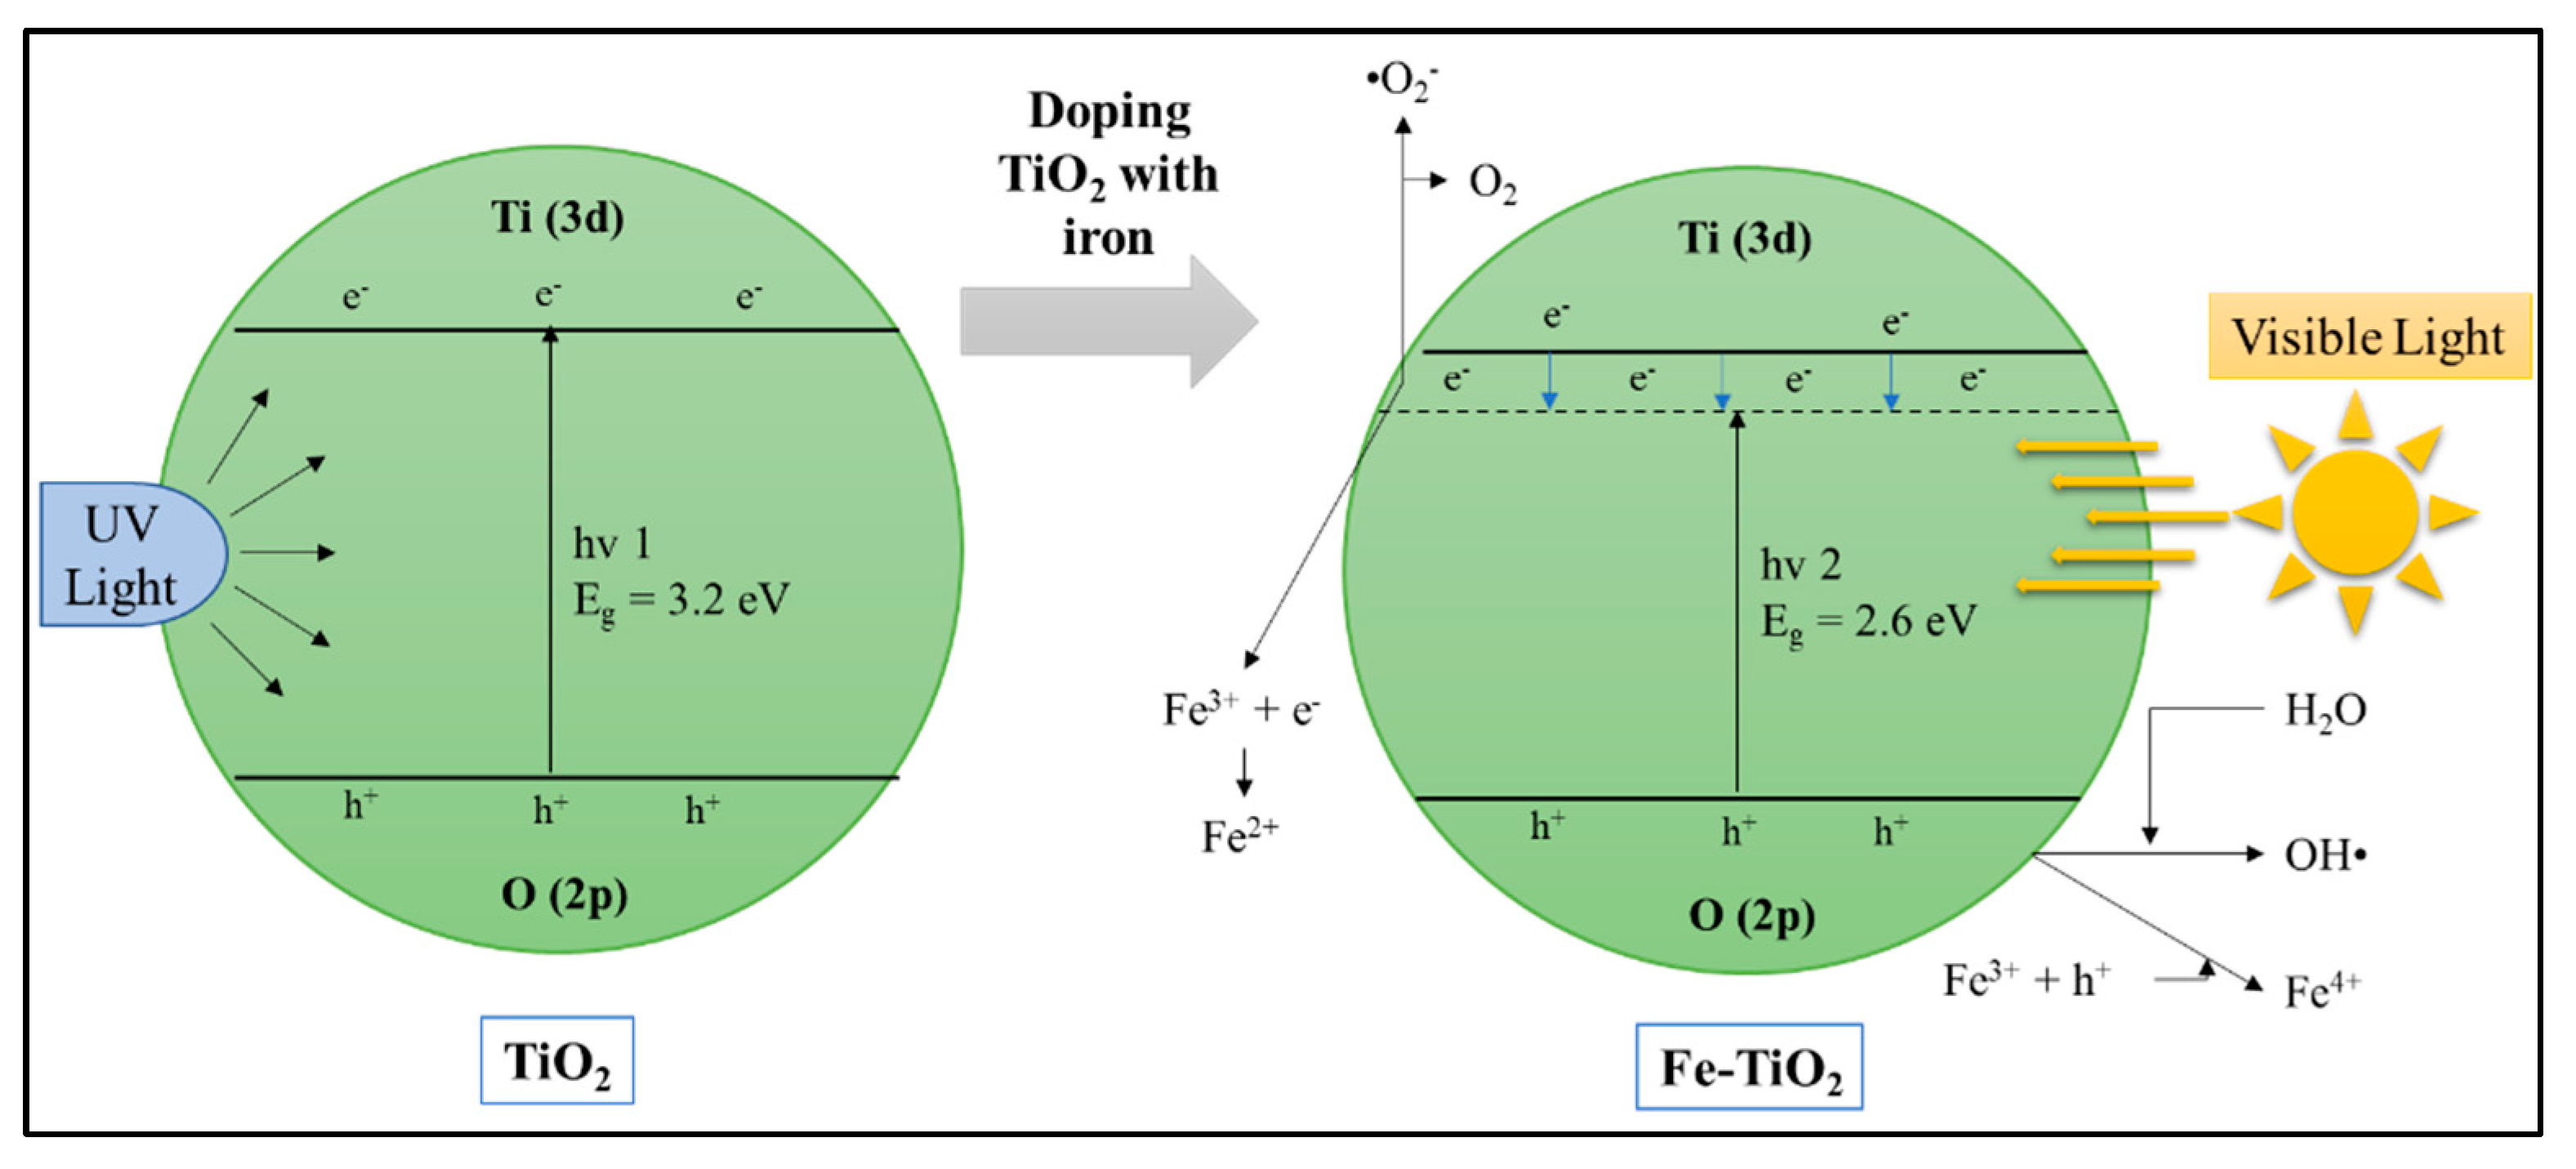
6.2.2. Modification and Doping of the Semiconductor Based Photocatalyst
Doping
Cation Dopants
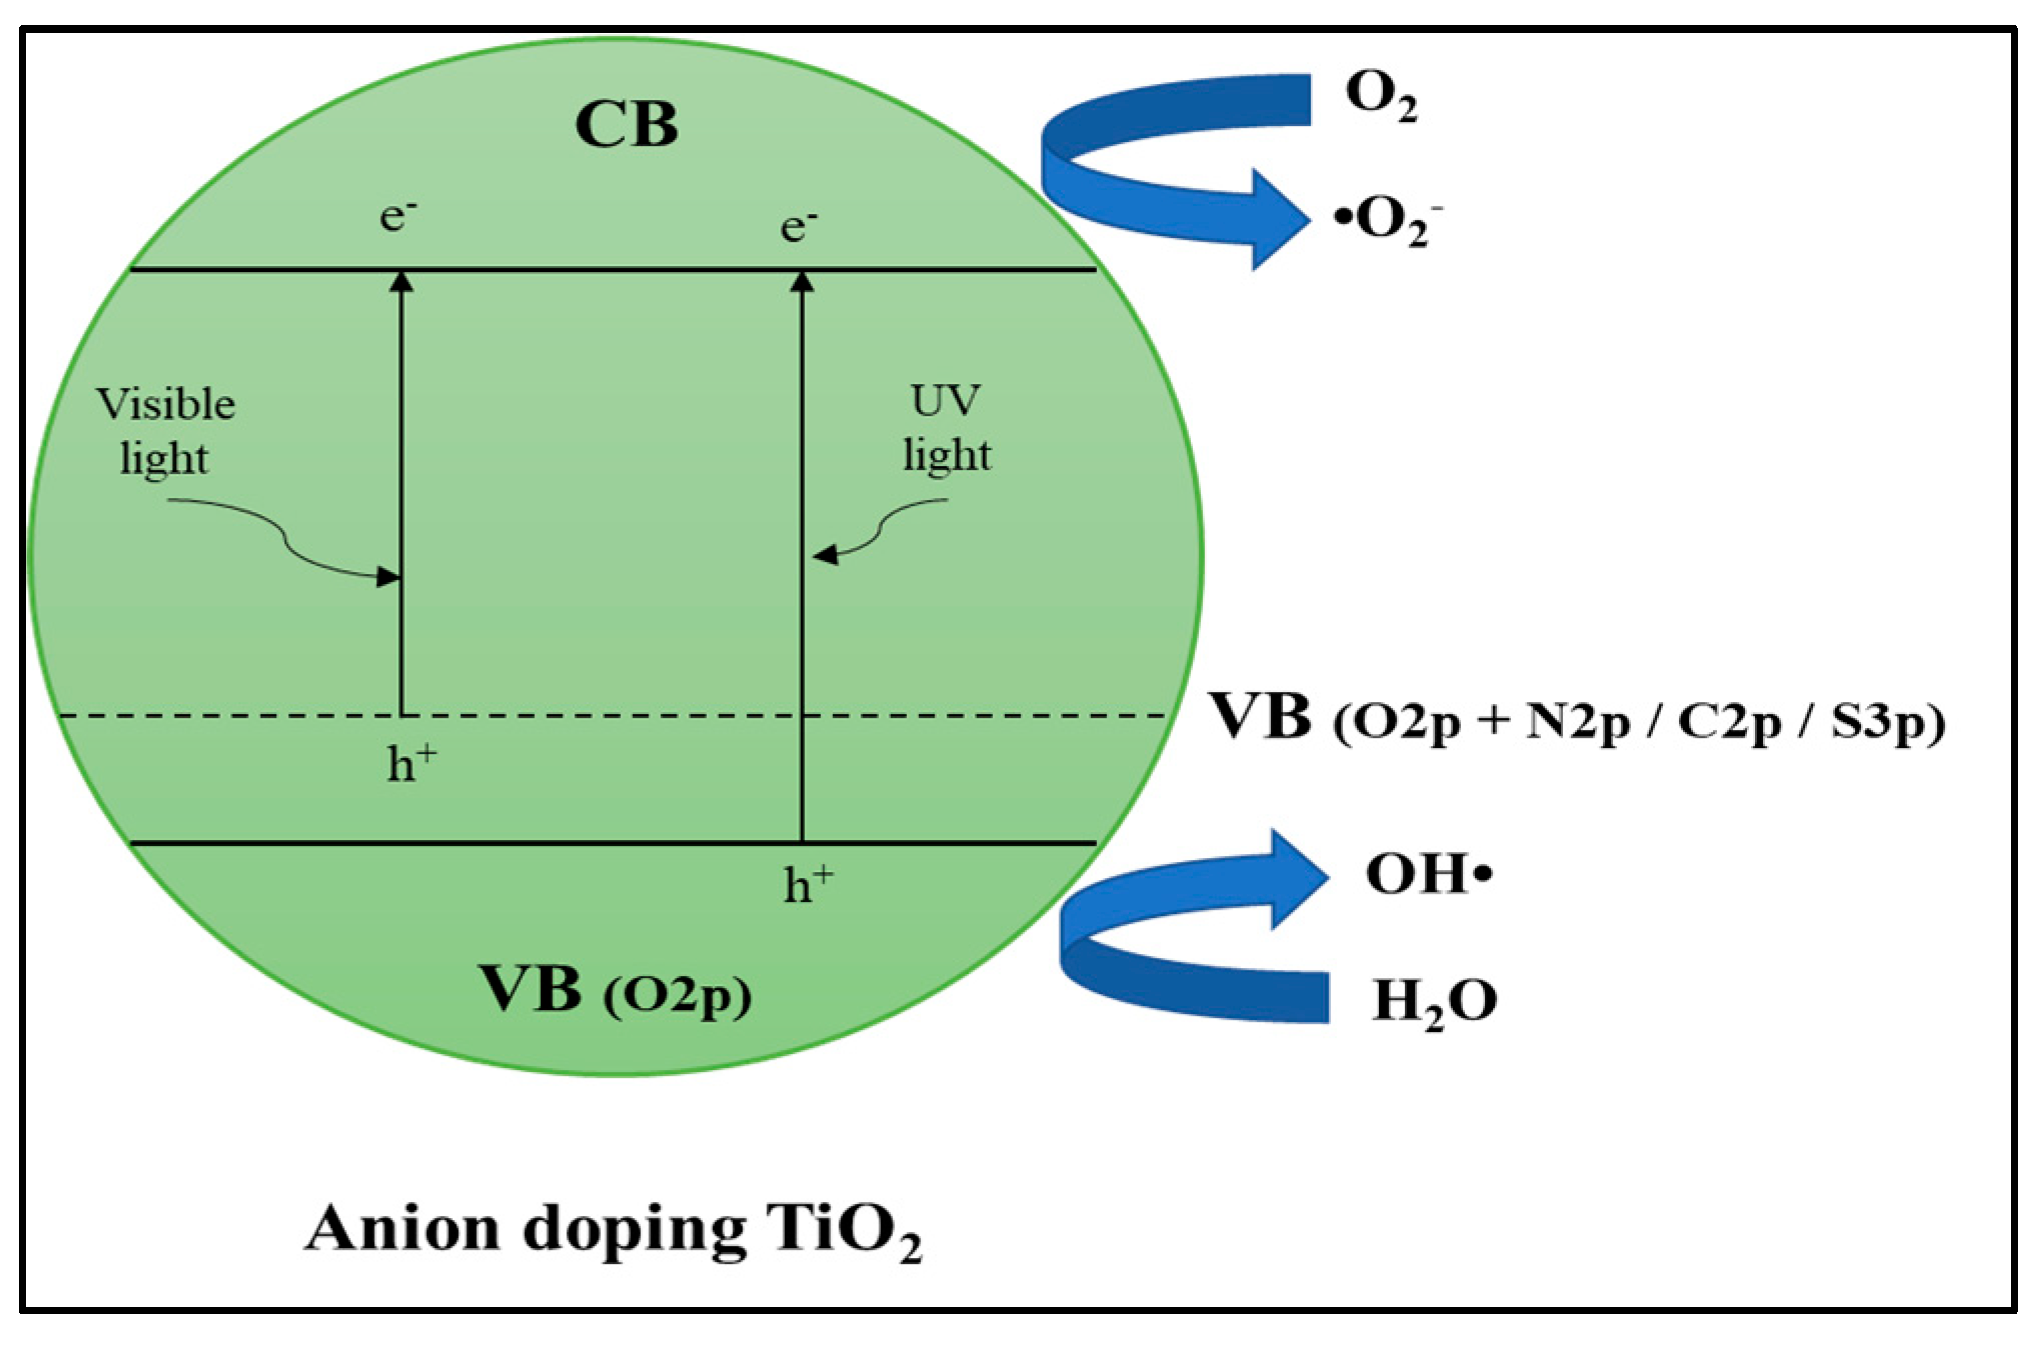
Anion Dopants
Anion–Anion Dopants
Cation–Cation Dopants
Cation–Anion Dopants
Other Semiconductors Dopants
6.3. Post-Processing Recovery of Photocatalyst for POME Treatment
7. Operational Parameters/Factors Affecting the Photocatalytic Degradation Process
7.1. Catalyst Loading
7.2. pH
7.3. Temperature
7.4. Size and Structure of the Photocatalyst
7.5. Dissolved Oxygen (DO)
7.6. Light Wavelength
7.7. Light Intensity
8. Kinetic of Photocatalytic POME Degradation
9. Conclusions and Future Perspective
Author Contributions
Funding
Institutional Review Board Statement
Informed Consent Statement
Data Availability Statement
Acknowledgments
Conflicts of Interest
References
- BPS-Statistics Indonesia. Environment Statistics of Indonesia; 0216-6224; BPS-Statistics Indonesia: Jakarta, Indonesia, 2018; pp. 1–224. [Google Scholar]
- Directorate General of Estate Crops. Tree Crop Estate Statistics of Indonesia 2017–2019; Directorate General of Estate Crops: Jakarta, Indonesia, 2019; pp. 1–81. [Google Scholar]
- Hasanudin, U.; Sugiharto, R.; Haryanto, A.; Setiadi, T.; Fujie, K. Palm oil mill effluent treatment and utilization to ensure the sustainability of palm oil industries. Water Sci. Technol. 2015, 72, 1089–1095. [Google Scholar] [CrossRef]
- Awalludin, M.F.; Sulaiman, O.; Hashim, R.; Nadhari, W.N.A.W. An overview of the oil palm industry in Malaysia and its waste utilization through thermochemical conversion, specifically via liquefaction. Renew. Sustain. Energy Rev. 2015, 50, 1469–1484. [Google Scholar] [CrossRef]
- Thani, M.I.; Hussin, R.; Ibrahim, W.R.B.W.; Sulaiman, M.S. Industrial Processes and the Environment—Crude Palm Oil Industry; Department of Environment, Ministry of Science: Putrajaya, Malayzia, 1999; Volume 3, pp. 1–90.
- Alhaji, M.H.; Sanaullah, K.; Salleh, S.F.; Baini, R.; Lim, S.F.; Rigit, A.R.H.; Said, K.A.M.; Khan, A. Photo-oxidation of pre-treated palm oil mill Effluent using cylindrical column immobilized photoreactor. Process. Saf. Environ. Prot. 2018, 117, 180–189. [Google Scholar] [CrossRef]
- IndexMundi. Palm Oil Production by Country in 1000 MT—Country Rankings. Available online: https://www.indexmundi.com/agriculture/?commodity=palm-oil&graph=production (accessed on 20 January 2020).
- FAO. Republic of Indonesia Government Regulation on the Implementation of Environmental Protection and Management; 22/2021; FAO: Rome, Italy, 2014; pp. 1–483. [Google Scholar]
- Lee, Z.S.; Chin, S.Y.; Lim, J.W.; Witoon, T.; Cheng, C.K. Treatment technologies of palm oil mill effluent (POME) and olive mill wastewater (OMW): A brief review. Environ. Technol. Innov. 2019, 15, 100377. [Google Scholar] [CrossRef]
- Ng, K.H.; Yuan, L.S.; Cheng, C.K.; Chen, K.; Fang, C. TiO2 and ZnO photocatalytic treatment of palm oil mill effluent (POME) and feasibility of renewable energy generation: A short review. J. Clean. Prod. 2019, 233, 209–225. [Google Scholar] [CrossRef]
- Azmi, N.S.; Yunos, K.F.M. Wastewater Treatment of Palm Oil Mill Effluent (POME) by Ultrafiltration Membrane Separation Technique Coupled with Adsorption Treatment as Pre-treatment. Agric. Agric. Sci. Procedia 2014, 2, 257–264. [Google Scholar] [CrossRef]
- Poh, P.E.; Chong, M.F. Upflow anaerobic sludge blanket-hollow centered packed bed (UASB-HCPB) reactor for thermophilic palm oil mill effluent (POME) treatment. Biomass Bioenergy 2014, 67, 231–242. [Google Scholar] [CrossRef]
- Chan, Y.J.; Chong, M.F.; Law, C.L. Effects of Temperature on Aerobic Treatment of Anaerobically Digested Palm Oil Mill Effluent (POME). Ind. Eng. Chem. Res. 2010, 49, 7093–7101. [Google Scholar] [CrossRef]
- Wahi, R.; Chuah Abdullah, L.; Nourouzi-Mobarekeh, M.; Ngaini, Z.; Choong Shean Yaw, T. Utilization of esterified sago bark fibre waste for removal of oil from palm oil mill effluent. J. Environ. Chem. Eng. 2017, 5, 170–177. [Google Scholar] [CrossRef]
- Kaman, S.P.D.; Tan, I.A.W.; Lim, L.L.P. Palm oil mill effluent treatment using coconut shell—Based activated carbon: Adsorption equilibrium and isotherm. Matec Web Conf. 2017, 87, 03009. [Google Scholar] [CrossRef]
- Cheng, Y.W.; Lee, Z.S.; Chong, C.C.; Khan, M.R.; Cheng, C.K.; Ng, K.H.; Hossain, S.S. Hydrogen-rich syngas production via steam reforming of palm oil mill effluent (POME)—A thermodynamics analysis. Int. J. Hydrogen Energy 2019, 44, 20711–20724. [Google Scholar] [CrossRef]
- Ng, K.H.; Cheng, Y.W.; Lee, Z.S.; Khan, M.R.; Lam, S.S.; Cheng, C.K. Experimental evaluation and empirical modelling of palm oil mill effluent steam reforming. Int. J. Hydrogen Energy 2018, 43, 15784–15793. [Google Scholar] [CrossRef]
- Ng, K.H.; Cheng, Y.W.; Lee, Z.S.; Cheng, C.K. A study into syngas production from catalytic steam reforming of palm oil mill effluent (POME): A new treatment approach. Int. J. Hydrogen Energy 2019, 44, 20900–20913. [Google Scholar] [CrossRef]
- Andreozzi, R.; Caprio, V.; Insola, A.; Marotta, R. Advanced oxidation processes (AOP) for water purification and recovery. Catal. Today 1999, 53, 51–59. [Google Scholar] [CrossRef]
- Alhaji, M.H.; Sanaullah, K.; Lim, S.-F.; Khan, A.; Hipolito, C.N.; Abdullah, M.O.; Bhawani, S.A.; Jamil, T. Photocatalytic treatment technology for palm oil mill effluent (POME)—A review. Process. Saf. Environ. Prot. 2016, 102, 673–686. [Google Scholar] [CrossRef]
- Chang, H.T.; Wu, N.-M.; Zhu, F. A kinetic model for photocatalytic degradation of organic contaminants in a thin-film TiO2 catalyst. Water Res. 2000, 34, 407–416. [Google Scholar] [CrossRef]
- Yacob, S.; Shirai, Y.; Hassan, M.A.; Wakisaka, M.; Subash, S. Start-up operation of semi-commercial closed anaerobic digester for palm oil mill effluent treatment. Process. Biochem. 2006, 41, 962–964. [Google Scholar] [CrossRef]
- Prasertsan, S.; Prasertsan, P. Biomass residues from palm oil mills in Thailand: An overview on quantity and potential usage. Biomass Bioenergy 1996, 11, 387–395. [Google Scholar] [CrossRef]
- Wu, T.Y.; Mohammad, A.W.; Jahim, J.M.; Anuar, N. Pollution control technologies for the treatment of palm oil mill effluent (POME) through end-of-pipe processes. J. Environ. Manag. 2010, 91, 1467–1490. [Google Scholar] [CrossRef]
- Hassan, M.; Yacob, S.; Shirai, Y. Treatment of palm oil wastewaters. Handb. Ind. Hazard. Wastes Treat. 2004, 7, 719–736. [Google Scholar]
- Ng, W.J.; Goh, A.C.C.; Tay, J.H. Palm oil mill effluent (POME) treatment—An assessment of coagulants used to aid liquid-solid separation. Biol. Wastes 1987, 21, 237–248. [Google Scholar] [CrossRef]
- Setiadi, T.; Husaini; Djajadiningrat, A. Palm oil mill effluent treatment by anaerobic baffled reactors: Recycle effects and biokinetic parameters. Water Sci. Technol. 1996, 34, 59–66. [Google Scholar] [CrossRef]
- FAO. Decree of the State Minister of Population and the Environment: Effluent Quality Standards for Existing Operations; KEP-03/MENKLH/II/1991; FAO: Rome, Italy, 1991; pp. 1–25. [Google Scholar]
- FAO. Decree of the State Minister of Environmental Affairs: The Liquid Waste Quality Standard for Industrial Activities; KEP-51/MENLH/10/1995; FAO: Rome, Italy, 1995; pp. 1–49. [Google Scholar]
- Rahayu, A.S.; Yuwono, H.; Rahardjo, S.; Hokermin, S.; Paramita, V. Konversi POME Menjadi Biogas: Pengembangan Proyek di Indonesia. 2015. Available online: https://winrock.org/wp-content/uploads/2016/05/CIRCLE-Handbook-INDO-compressed.pdf (accessed on 9 February 2020).
- Perez, M.; Romero, L.I.; Sales, D. Organic Matter Degradation Kinetics in an Anaerobic Thermophilic Fluidised Bed Bioreactor. Anaerobe 2001, 7, 25–35. [Google Scholar] [CrossRef]
- Yacob, S.; Hassan, M.; Shirai, Y.; Wakisaka, M.; Subash, S. Baseline Study of Methane Emission from Anaerobic Ponds of Palm Oil Mill Effluent Treatment. Sci. Total Environ. 2006, 366, 187–196. [Google Scholar] [CrossRef]
- Poh, P.E.; Chong, M.F. Development of anaerobic digestion methods for palm oil mill effluent (POME) treatment. Bioresour. Technol. 2009, 100, 1–9. [Google Scholar] [CrossRef]
- Loh, S.K.; Lai, M.E.; Ngatiman, M.; Weng Soon, L.; Choo, Y.; Zhang, Z.; Salimon, J. Zero discharge treatment technology of palm oil mill effluent. J. Oil Palm Res. 2013, 25, 273–281. [Google Scholar]
- Choi, W.-H.; Shin, C.-H.; Son, S.-M.; Ghorpade, P.A.; Kim, J.-J.; Park, J.-Y. Anaerobic treatment of palm oil mill effluent using combined high-rate anaerobic reactors. Bioresour. Technol. 2013, 141, 138–144. [Google Scholar] [CrossRef]
- Tamrin, K.F.; Zahrim, A.Y. Determination of optimum polymeric coagulant in palm oil mill effluent coagulation using multiple-objective optimisation on the basis of ratio analysis (MOORA). Environ. Sci. Pollut. Res. 2017, 24, 15863–15869. [Google Scholar] [CrossRef] [PubMed]
- Fujihira, T.; Seo, S.; Yamaguchi, T.; Hatamoto, M.; Tanikawa, D. High-rate Anaerobic Treatment System for Solid/Lipid-rich Wastewater using Anaerobic Baffled Reactor with Scum Recovery. Bioresour. Technol. 2018, 263. [Google Scholar] [CrossRef] [PubMed]
- Hasanudin, U.; Haryanto, A. Palm oil mill effluent recycling system for sustainable palm oil industries. Asian J. Environ. Biotechnol. 2018, 2, 52–62. [Google Scholar]
- Ali Amat, N.A.; Tan, Y.H.; Lau, W.J.; Lai, G.S.; Ong, C.S.; Mokhtar, N.M.; Sani, N.A.A.; Ismail, A.F.; Goh, P.S.; Chong, K.C.; et al. Tackling colour issue of anaerobically-treated palm oil mill effluent using membrane technology. J. Water Process. Eng. 2015, 8, 221–226. [Google Scholar] [CrossRef]
- Bello, M.M.; Nourouzi, M.M.; Abdullah, L.C.; Choong, T.S.Y.; Koay, Y.S.; Keshani, S. POME is treated for removal of color from biologically treated POME in fixed bed column: Applying wavelet neural network (WNN). J. Hazard. Mater. 2013, 262, 106–113. [Google Scholar] [CrossRef]
- Mohammed, R.R.; Ketabchi, M.R.; McKay, G. Combined magnetic field and adsorption process for treatment of biologically treated palm oil mill effluent (POME). Chem. Eng. J. 2014, 243, 31–42. [Google Scholar] [CrossRef]
- Bhatia, S.; Othman, Z.; Ahmad, A.L. Pretreatment of palm oil mill effluent (POME) using Moringa oleifera seeds as natural coagulant. J. Hazard. Mater. 2007, 145, 120–126. [Google Scholar] [CrossRef]
- Poh, P.E.; Ong, W.Y.J.; Lau, E.V.; Chong, M.N. Investigation on micro-bubble flotation and coagulation for the treatment of anaerobically treated palm oil mill effluent (POME). J. Environ. Chem. Eng. 2014, 2, 1174–1181. [Google Scholar] [CrossRef]
- Cheng, C.K.; Rizauddin Derahman, M.; Khan, M.R. Evaluation of the photocatalytic degradation of pre-treated palm oil mill effluent (POME) over Pt-loaded titania. J. Environ. Chem. Eng. 2015, 3, 261–270. [Google Scholar] [CrossRef]
- Ng, K.H.; Lee, C.H.; Khan, M.R.; Cheng, C.K. Photocatalytic degradation of recalcitrant POME waste by using silver doped titania: Photokinetics and scavenging studies. Chem. Eng. J. 2016, 286, 282–290. [Google Scholar] [CrossRef]
- Vijayaraghavan, K.; Ahmad, D.; Ezani-Bin-Abdul-Aziz, M. Aerobic treatment of palm oil mill effluent. J. Environ. Manag. 2007, 82, 24–31. [Google Scholar] [CrossRef]
- Chan, Y.J.; Chong, M.F.; Law, C.L.; Hassell, D.G. A review on anaerobic–aerobic treatment of industrial and municipal wastewater. Chem. Eng. J. 2009, 155, 1–18. [Google Scholar] [CrossRef]
- Bello, M.M.; Abdul Raman, A.A. Trend and current practices of palm oil mill effluent polishing: Application of advanced oxidation processes and their future perspectives. J. Environ. Manag. 2017, 198, 170–182. [Google Scholar] [CrossRef] [PubMed]
- Iskandar, M.J.; Baharum, A.; Anuar, F.H.; Othaman, R. Palm oil industry in South East Asia and the effluent treatment technology—A review. Environ. Technol. Innov. 2018, 9, 169–185. [Google Scholar] [CrossRef]
- Loh, S.K.; Lai, M.E.; Ngatiman, M. Vegetative growth enhancement of organic fertilizer from anaerobically-treated palm oil mill effluent (POME) supplemented with chicken manure in food-energy-water nexus challenge. Food Bioprod. Process. 2019, 117, 95–104. [Google Scholar] [CrossRef]
- Borja, R.; Banks, C.J.; Sánchez, E. Anaerobic treatment of palm oil mill effluent in a two-stage up-flow anaerobic sludge blanket (UASB) system. J. Biotechnol. 1996, 45, 125–135. [Google Scholar] [CrossRef]
- Zhang, Y.; Yan, L.; Chi, L.; Long, X.; Mei, Z.; Zhang, Z. Startup and operation of anaerobic EGSB reactor treating palm oil mill effluent. J. Environ. Sci. 2008, 20, 658–663. [Google Scholar] [CrossRef]
- Chan, Y.J.; Chong, M.F.; Law, C.L. Biological treatment of anaerobically digested palm oil mill effluent (POME) using a Lab-Scale Sequencing Batch Reactor (SBR). J. Environ. Manag. 2010, 91, 1738–1746. [Google Scholar] [CrossRef] [PubMed]
- Najafpour, G.D.; Zinatizadeh, A.A.L.; Mohamed, A.R.; Hasnain Isa, M.; Nasrollahzadeh, H. High-rate anaerobic digestion of palm oil mill effluent in an upflow anaerobic sludge-fixed film bioreactor. Process. Biochem. 2006, 41, 370–379. [Google Scholar] [CrossRef]
- Najafpour, G.; Yieng, H.A.; Younesi, H.; Zinatizadeh, A. Effect of organic loading on performance of rotating biological contactors using Palm Oil Mill effluents. Process. Biochem. 2005, 40, 2879–2884. [Google Scholar] [CrossRef]
- Cheng, Y.W.; Ng, K.H.; Lam, S.S.; Lim, J.W.; Wongsakulphasatch, S.; Witoon, T.; Cheng, C.K. Syngas from catalytic steam reforming of palm oil mill effluent: An optimization study. Int. J. Hydrogen Energy 2019, 44, 9220–9236. [Google Scholar] [CrossRef]
- Aziz, M.; Kurniawan, T.; Oda, T.; Kashiwagi, T. Advanced power generation using biomass wastes from palm oil mills. Appl. Therm. Eng. 2017, 114, 1378–1386. [Google Scholar] [CrossRef]
- Shak, K.P.Y.; Wu, T.Y. Optimized use of alum together with unmodified Cassia obtusifolia seed gum as a coagulant aid in treatment of palm oil mill effluent under natural pH of wastewater. Ind. Crop. Prod. 2015, 76, 1169–1178. [Google Scholar] [CrossRef]
- Latif Ahmad, A.; Ismail, S.; Bhatia, S. Water recycling from palm oil mill effluent (POME) using membrane technology. Desalination 2003, 157, 87–95. [Google Scholar] [CrossRef]
- Zhang, Y.; Yan, L.; Qiao, X.; Chi, L.; Niu, X.; Mei, Z.; Zhang, Z. Integration of biological method and membrane technology in treating palm oil mill effluent. J. Environ. Sci. 2008, 20, 558–564. [Google Scholar] [CrossRef]
- Ahmad, A.L.; Sumathi, S.; Hameed, B.H. Residual oil and suspended solid removal using natural adsorbents chitosan, bentonite and activated carbon: A comparative study. Chem. Eng. J. 2005, 108, 179–185. [Google Scholar] [CrossRef]
- Shavandi, M.A.; Haddadian, Z.; Ismail, M.H.S.; Abdullah, N.; Abidin, Z.Z. Removal of Fe(III), Mn(II) and Zn(II) from palm oil mill effluent (POME) by natural zeolite. J. Taiwan Inst. Chem. Eng. 2012, 43, 750–759. [Google Scholar] [CrossRef]
- Ahmad, A.L.; Sumathi, S.; Hameed, B.H. Adsorption of residue oil from palm oil mill effluent using powder and flake chitosan: Equilibrium and kinetic studies. Water Res. 2005, 39, 2483–2494. [Google Scholar] [CrossRef]
- Chou, S.; Huang, C.; Huang, Y.-H. Effect of Fe2+ on catalytic oxidation in a fluidized bed reactor. Chemosphere 1999, 39, 1997–2006. [Google Scholar] [CrossRef]
- Carra, I.; Sánchez Pérez, J.A.; Malato, S.; Autin, O.; Jefferson, B.; Jarvis, P. Performance of different advanced oxidation processes for tertiary wastewater treatment to remove the pesticide acetamiprid. J. Chem. Technol. Biotechnol. 2016, 91, 72–81. [Google Scholar] [CrossRef]
- Taha, M.R.; Ibrahim, A.H. Characterization of nano zero-valent iron (nZVI) and its application in sono-Fenton process to remove COD in palm oil mill effluent. J. Environ. Chem. Eng. 2014, 2, 1–8. [Google Scholar] [CrossRef]
- Kongnoo, A.; Suksaroj, T.; Intharapat, P.; Promtong, T.; Suksaroj, C. Decolorization and Organic Removal from Palm Oil Mill Effluent by Fenton’s Process. Environ. Eng. Sci. 2012, 29, 855–859. [Google Scholar] [CrossRef]
- Saeed, M.O.; Azizli, K.A.M.; Isa, M.H.; Ezechi, E.H. Treatment of POME using Fenton oxidation process: Removal efficiency, optimization, and acidity condition. Desalination Water Treat. 2016, 57, 23750–23759. [Google Scholar] [CrossRef]
- Chong, M.N.; Jin, B.; Chow, C.W.K.; Saint, C. Recent developments in photocatalytic water treatment technology: A review. Water Res. 2010, 44, 2997–3027. [Google Scholar] [CrossRef] [PubMed]
- Zheng, X.; Shen, Z.-P.; Shi, L.; Cheng, R.; Yuan, D.-H. Photocatalytic Membrane Reactors (PMRs) in Water Treatment: Configurations and Influencing Factors. Catalysts 2017, 7, 224. [Google Scholar] [CrossRef]
- Hamdy, M.S.; Saputera, W.H.; Groenen, E.J.; Mul, G. A novel TiO2 composite for photocatalytic wastewater treatment. J. Catal. 2014, 310, 75–83. [Google Scholar] [CrossRef]
- Saputera, W.H.; Scott, J.; Tahini, H.; Low, G.K.C.; Tan, X.; Smith, S.; Wang, D.-W.; Amal, R. Light, Catalyst, Activation: Boosting Catalytic Oxygen Activation Using a Light Pretreatment Approach. ACS Catal. 2017, 7, 3644–3653. [Google Scholar] [CrossRef]
- Borja, R.; Banks, C.J. Anaerobic digestion of palm oil mill effluent using an up-flow anaerobic sludge blanket reactor. Biomass Bioenergy 1994, 6, 381–389. [Google Scholar] [CrossRef]
- Mishra, P.; Thakur, S.; Singh, L.; Ab Wahid, Z.; Sakinah, M. Enhanced hydrogen production from palm oil mill effluent using two stage sequential dark and photo fermentation. Int. J. Hydrogen Energy 2016, 41, 18431–18440. [Google Scholar] [CrossRef]
- Scaife, D.E. Oxide semiconductors in photoelectrochemical conversion of solar energy. Sol. Energy 1980, 25, 41–54. [Google Scholar] [CrossRef]
- Koppenol, W.H.; Stanbury, D.M.; Bounds, P.L. Electrode potentials of partially reduced oxygen species, from dioxygen to water. Free Radic. Biol. Med. 2010, 49, 317–322. [Google Scholar] [CrossRef]
- Oliveira, C.; Alves, A.; Madeira, L.M. Treatment of water networks (waters and deposits) contaminated with chlorfenvinphos by oxidation with Fenton’s reagent. Chem. Eng. J. 2014, 241, 190–199. [Google Scholar] [CrossRef]
- Oller, I.; Malato, S.; Sánchez-Pérez, J.A. Combination of Advanced Oxidation Processes and biological treatments for wastewater decontamination—A review. Sci. Total Environ. 2011, 409, 4141–4166. [Google Scholar] [CrossRef]
- Schneider, J.; Matsuoka, M.; Takeuchi, M.; Zhang, J.; Horiuchi, Y.; Anpo, M.; Bahnemann, D.W. Understanding TiO2 Photocatalysis: Mechanisms and Materials. Chem. Rev. 2014, 114, 9919–9986. [Google Scholar] [CrossRef]
- Ong, C.B.; Ng, L.Y.; Mohammad, A.W. A review of ZnO nanoparticles as solar photocatalysts: Synthesis, mechanisms and applications. Renew. Sustain. Energy Rev. 2018, 81, 536–551. [Google Scholar] [CrossRef]
- Szilágyi, I.M.; Fórizs, B.; Rosseler, O.; Szegedi, Á.; Németh, P.; Király, P.; Tárkányi, G.; Vajna, B.; Varga-Josepovits, K.; László, K.; et al. WO3 photocatalysts: Influence of structure and composition. J. Catal. 2012, 294, 119–127. [Google Scholar] [CrossRef]
- Ma, R.; Zhang, S.; Wen, T.; Gu, P.; Li, L.; Zhao, G.; Niu, F.; Huang, Q.; Tang, Z.; Wang, X. A critical review on visible-light-response CeO2-based photocatalysts with enhanced photooxidation of organic pollutants. Catal. Today 2019, 335, 20–30. [Google Scholar] [CrossRef]
- Basahel, S.; Ali, T.; Mokhtar, M.; Katabathini, N. Influence of crystal structure of nanosized ZrO2 on photocatalytic degradation of methyl orange. Nanoscale Res. Lett. 2015, 10. [Google Scholar] [CrossRef]
- Herrmann, J.-M. Heterogeneous photocatalysis: Fundamentals and applications to the removal of various types of aqueous pollutants. Catal. Today 1999, 53, 115–129. [Google Scholar] [CrossRef]
- Saputera, W.H.; Mul, G.; Hamdy, M.S. Ti3+-containing titania: Synthesis tactics and photocatalytic performance. Catal. Today 2015, 246, 60–66. [Google Scholar] [CrossRef]
- Fu, W.; Yang, H.; Li, M.; Li, M.; Yang, N.; Zou, G. Anatase TiO2 nanolayer coating on cobalt ferrite nanoparticles for magnetic photocatalyst. Mater. Lett. 2005, 59, 3530–3534. [Google Scholar] [CrossRef]
- Watson, S.; Beydoun, D.; Amal, R. Synthesis of a novel magnetic photocatalyst by direct deposition of nanosized TiO2 crystals onto a magnetic core. J. Photochem. Photobiol. A Chem. 2002, 148, 303–313. [Google Scholar] [CrossRef]
- Xu, M.-W.; Bao, S.-J.; Zhang, X.-G. Enhanced photocatalytic activity of magnetic TiO2 photocatalyst by silver deposition. Mater. Lett. 2005, 59, 2194–2198. [Google Scholar] [CrossRef]
- Hendra Saputera, W.; Egiyawati, C.; Setyani-Putrie, A.; Fathoni Amri, A.; Rizkiana, J.; Sasongko, D. Titania Modified Silica from Sugarcane Bagasse Waste for Photocatalytic Wastewater Treatment. IOP Conf. Ser. Mater. Sci. Eng. 2021, 1143, 012073. [Google Scholar] [CrossRef]
- Xu, J.; Li, L.; Yan, Y.; Wang, H.; Wang, X.; Fu, X.; Li, G. Synthesis and photoluminescence of well-dispersible anatase TiO2 nanoparticles. J. Colloid Interface Sci. 2008, 318, 29–34. [Google Scholar] [CrossRef]
- Rodríguez-González, V.; Terashima, C.; Fujishima, A. Applications of photocatalytic titanium dioxide-based nanomaterials in sustainable agriculture. J. Photochem. Photobiol. C Photochem. Rev. 2019, 40, 49–67. [Google Scholar] [CrossRef]
- Luttrell, T.; Halpegamage, S.; Tao, J.; Kramer, A.; Sutter, E.; Batzill, M. Why is anatase a better photocatalyst than rutile?—Model studies on epitaxial TiO2 films. Sci. Rep. 2014, 4, 4043. [Google Scholar] [CrossRef] [PubMed]
- Zhu, T.; Gao, S.-P. The Stability, Electronic Structure, and Optical Property of TiO2 Polymorphs. J. Phys. Chem. C 2014, 118, 11385–11396. [Google Scholar] [CrossRef]
- Li, X.Z.; Li, F.B.; Yang, C.L.; Ge, W.K. Photocatalytic activity of WOx-TiO2 under visible light irradiation. J. Photochem. Photobiol. A Chem. 2001, 141, 209–217. [Google Scholar] [CrossRef]
- Pesci, F.M.; Wang, G.; Klug, D.R.; Li, Y.; Cowan, A.J. Efficient Suppression of Electron–Hole Recombination in Oxygen-Deficient Hydrogen-Treated TiO2 Nanowires for Photoelectrochemical Water Splitting. J. Phys. Chem. C 2013, 117, 25837–25844. [Google Scholar] [CrossRef] [PubMed]
- Nam, Y.; Lim, J.H.; Ko, K.C.; Lee, J.Y. Photocatalytic activity of TiO2 nanoparticles: A theoretical aspect. J. Mater. Chem. A 2019, 7, 13833–13859. [Google Scholar] [CrossRef]
- Zheng, H.; Ou, J.Z.; Strano, M.S.; Kaner, R.B.; Mitchell, A.; Kalantar-zadeh, K. Nanostructured Tungsten Oxide—Properties, Synthesis, and Applications. Adv. Funct. Mater. 2011, 21, 2175–2196. [Google Scholar] [CrossRef]
- Zhang, H.; Chen, G.; Bahnemann, D.W. Photoelectrocatalytic materials for environmental applications. J. Mater. Chem. 2009, 19, 5089–5121. [Google Scholar] [CrossRef]
- Monllor-Satoca, D.; Borja, L.; Rodes, A.; Gómez, R.; Salvador, P. Photoelectrochemical Behavior of Nanostructured WO3 Thin-Film Electrodes: The Oxidation of Formic Acid. Chemphyschem. A Eur. J. Chem. Phys. Phys. Chem. 2006, 7, 2540–2551. [Google Scholar] [CrossRef]
- Butler, M.A. Photoelectrolysis and physical properties of the semiconducting electrode WO2. J. Appl. Phys. 1977, 48, 1914–1920. [Google Scholar] [CrossRef]
- Yamazaki, S.; Yamate, T.; Adachi, K. Photocatalytic activity of aqueous WO3 sol for the degradation of Orange II and 4-chlorophenol. Appl. Catal. A Gen. 2013, 454, 30–36. [Google Scholar] [CrossRef]
- Fu, L.; Cai, W.; Wang, A.; Zheng, Y. Photocatalytic hydrogenation of nitrobenzene to aniline over tungsten oxide-silver nanowires. Mater. Lett. 2015, 142, 201–203. [Google Scholar] [CrossRef]
- Morales, W.; Cason, M.; Aina, O.; de Tacconi, N.R.; Rajeshwar, K. Combustion Synthesis and Characterization of Nanocrystalline WO3. J. Am. Chem. Soc. 2008, 130, 6318–6319. [Google Scholar] [CrossRef] [PubMed]
- Santato, C.; Odziemkowski, M.; Ulmann, M.; Augustynski, J. Crystallographically Oriented Mesoporous WO3 Films: Synthesis, Characterization, and Applications. J. Am. Chem. Soc. 2001, 123, 10639–10649. [Google Scholar] [CrossRef]
- Arutanti, O.; Nandiyanto, A.B.D.; Ogi, T.; Iskandar, F.; Kim, T.O.; Okuyama, K. Synthesis of composite WO3/TiO2 nanoparticles by flame-assisted spray pyrolysis and their photocatalytic activity. J. Alloy. Compd. 2014, 591, 121–126. [Google Scholar] [CrossRef]
- Cheng, Y.W.; Chang, Y.S.; Ng, K.H.; Wu, T.Y.; Cheng, C.K. Photocatalytic restoration of liquid effluent from oil palm agroindustry in Malaysia using tungsten oxides catalyst. J. Clean. Prod. 2017, 162, 205–219. [Google Scholar] [CrossRef]
- Gomez-Solís, C.; Ballesteros, J.C.; Torres-Martínez, L.M.; Juárez-Ramírez, I.; Díaz Torres, L.A.; Elvira Zarazua-Morin, M.; Lee, S.W. Rapid synthesis of ZnO nano-corncobs from Nital solution and its application in the photodegradation of methyl orange. J. Photochem. Photobiol. A Chem. 2015, 298, 49–54. [Google Scholar] [CrossRef]
- Lee, K.M.; Lai, C.W.; Ngai, K.S.; Juan, J.C. Recent developments of zinc oxide based photocatalyst in water treatment technology: A review. Water Res. 2016, 88, 428–448. [Google Scholar] [CrossRef]
- Schmidt-Mende, L.; MacManus-Driscoll, J.L. ZnO—Nanostructures, defects, and devices. Mater. Today 2007, 10, 40–48. [Google Scholar] [CrossRef]
- Chen, Y.; Bagnall, D.M.; Koh, H.-j.; Park, K.-t.; Hiraga, K.; Zhu, Z.; Yao, T. Plasma assisted molecular beam epitaxy of ZnO on c -plane sapphire: Growth and characterization. J. Appl. Phys. 1998, 84, 3912–3918. [Google Scholar] [CrossRef]
- Daneshvar, N.; Salari, D.; Khataee, A.R. Photocatalytic degradation of azo dye acid red 14 in water on ZnO as an alternative catalyst to TiO2. J. Photochem. Photobiol. A Chem. 2004, 162, 317–322. [Google Scholar] [CrossRef]
- Behnajady, M.A.; Modirshahla, N.; Hamzavi, R. Kinetic study on photocatalytic degradation of C.I. Acid Yellow 23 by ZnO photocatalyst. J. Hazard. Mater. 2006, 133, 226–232. [Google Scholar] [CrossRef]
- Ullah, R.; Dutta, J. Photocatalytic activities of ZnO nanoparticles synthesized by wet chemical techniques. In Proceedings of the 2006 International Conference on Emerging Technologies, Peshawar, Pakistan, 13–14 November 2006; pp. 353–357. [Google Scholar]
- Ng, K.H.; Khan, M.R.; Ng, Y.H.; Hossain, S.S.; Cheng, C.K. Restoration of liquid effluent from oil palm agroindustry in Malaysia using UV/TiO2 and UV/ZnO photocatalytic systems: A comparative study. J. Environ. Manag. 2017, 196, 674–680. [Google Scholar] [CrossRef]
- Tan, Y.I.H.; Goh, P.; Lai, G.S.; Lau, W.J.; Ismail, A. Treatment of Aerobic Treated Palm Oil Mill Effluent (AT-POME) by using TiO2 Photocatalytic Process. J. Teknol. 2014, 70. [Google Scholar] [CrossRef]
- Ng, K.; Deraman, M.; Ang, C.; Chong, S.; Kong, Z.; Khan, M.; Cheng, C. Phototreatment of Palm Oil Mill Effluent (POME) over Cu/TiO2 Photocatalyst. Bull. Chem. React. Eng. Catal. 2014, 9. [Google Scholar] [CrossRef]
- Haji Alhaji, M.; Sanaullah, K.; Fong Lim, S.; Ragai Henry Rigit, A.; Hamza, A.; Khan, A. Modeling and optimization of photocatalytic treatment of pre-treated palm oil mill effluent (POME) in a UV/TiO2 system using response surface methodology (RSM). Cogent Eng. 2017, 4, 1382980. [Google Scholar] [CrossRef]
- Ng, K.H.; Cheng, C.K. A novel photomineralization of POME over UV-responsive TiO2 photocatalyst: Kinetics of POME degradation and gaseous product formations. RSC Adv. 2015, 5, 53100–53110. [Google Scholar] [CrossRef]
- Ng, K.H.; Cheng, C.K. Photocatalytic degradation of palm oil mill effluent over ultraviolet-responsive titania: Successive assessments of significance factors and process optimization. J. Clean. Prod. 2017, 142, 2073–2083. [Google Scholar] [CrossRef]
- Kanakaraju, D.; Ahmad, N.L.B.; Sedik, N.B.M.; Long, S.G.H.; Guan, T.M.; Ying, C.L. Performance of solar photocatalysis and photo-fenton degradation of palm oil mill effluent. Malays. J. Anal. Sci. 2017, 21, 996–1007. [Google Scholar] [CrossRef]
- Cheng, C.K.; Deraman, M.R.; Ng, K.H.; Khan, M.R. Preparation of titania doped argentum photocatalyst and its photoactivity towards palm oil mill effluent degradation. J. Clean. Prod. 2016, 112, 1128–1135. [Google Scholar] [CrossRef]
- Charles, A.; Cheng, C.K. Photocatalytic treatment of palm oil mill effluent by visible light-active calcium ferrite: Effects of catalyst preparation technique. J. Environ. Manag. 2019, 234, 404–411. [Google Scholar] [CrossRef] [PubMed]
- Charles, A.; Khan, M.R.; Ng, K.H.; Wu, T.Y.; Lim, J.W.; Wongsakulphasatch, S.; Witoon, T.; Cheng, C.K. Facile synthesis of CaFe2O4 for visible light driven treatment of polluting palm oil mill effluent: Photokinetic and scavenging study. Sci. Total Environ. 2019, 661, 522–530. [Google Scholar] [CrossRef] [PubMed]
- Ng, K.H.; Cheng, C.K. Photo-polishing of POME into CH4-lean biogas over the UV-responsive ZnO photocatalyst. Chem. Eng. J. 2016, 300, 127–138. [Google Scholar] [CrossRef]
- Zainuri, N.Z.; Hairom, N.H.H.; Sidik, D.A.B.; Desa, A.L.; Misdan, N.; Yusof, N.; Mohammad, A.W. Palm oil mill secondary effluent (POMSE) treatment via photocatalysis process in presence of ZnO-PEG nanoparticles. J. Water Process. Eng. 2018, 26, 10–16. [Google Scholar] [CrossRef]
- Wong, K.-A.; Lam, S.-M.; Sin, J.-C. Wet chemically synthesized ZnO structures for photodegradation of pre-treated palm oil mill effluent and antibacterial activity. Ceram. Int. 2019, 45, 1868–1880. [Google Scholar] [CrossRef]
- Chin, Y.-H.; Sin, J.-C.; Lam, S.-M. A facile route for fabrication of hierarchical porous Nb2O5/ZnO composites with enhanced photocatalytic degradation of palm oil mill effluent. Mater. Lett. 2018, 216, 8–11. [Google Scholar] [CrossRef]
- Madhusudan Reddy, K.; Manorama, S.V.; Ramachandra Reddy, A. Bandgap studies on anatase titanium dioxide nanoparticles. Mater. Chem. Phys. 2003, 78, 239–245. [Google Scholar] [CrossRef]
- Ahadi, S.; Moalej, N.S.; Sheibani, S. Characteristics and photocatalytic behavior of Fe and Cu doped TiO2 prepared by combined sol-gel and mechanical alloying. Solid State Sci. 2019, 96, 105975. [Google Scholar] [CrossRef]
- Sadanandam, G.; Lalitha, K.; Kumari, V.D.; Shankar, M.V.; Subrahmanyam, M. Cobalt doped TiO2: A stable and efficient photocatalyst for continuous hydrogen production from glycerol: Water mixtures under solar light irradiation. Int. J. Hydrogen Energy 2013, 38, 9655–9664. [Google Scholar] [CrossRef]
- Barmeh, A.; Nilforoushan, M.R.; Otroj, S. Wetting and photocatalytic properties of Ni-doped TiO2 coating on glazed ceramic tiles under visible light. Thin Solid Film. 2018, 666, 137–142. [Google Scholar] [CrossRef]
- Binas, V.; Stefanopoulos, V.; Kiriakidis, G.; Papagiannakopoulos, P. Photocatalytic oxidation of gaseous benzene, toluene and xylene under UV and visible irradiation over Mn-doped TiO2 nanoparticles. J. Mater. 2019, 5, 56–65. [Google Scholar] [CrossRef]
- Sanchez-Dominguez, M.; Morales-Mendoza, G.; Rodriguez-Vargas, M.J.; Ibarra-Malo, C.C.; Rodriguez-Rodriguez, A.A.; Vela-Gonzalez, A.V.; Perez-Garcia, S.A.; Gomez, R. Synthesis of Zn-doped TiO2 nanoparticles by the novel oil-in-water (O/W) microemulsion method and their use for the photocatalytic degradation of phenol. J. Environ. Chem. Eng. 2015, 3, 3037–3047. [Google Scholar] [CrossRef]
- Teh, C.M.; Mohamed, A.R. Roles of titanium dioxide and ion-doped titanium dioxide on photocatalytic degradation of organic pollutants (phenolic compounds and dyes) in aqueous solutions: A review. J. Alloys Compd. 2011, 509, 1648–1660. [Google Scholar] [CrossRef]
- Abdullah, H.; Khan, M.M.R.; Ong, H.R.; Yaakob, Z. Modified TiO2 photocatalyst for CO2 photocatalytic reduction: An overview. J. CO2 Util. 2017, 22, 15–32. [Google Scholar] [CrossRef]
- Zhu, J.; Chen, F.; Zhang, J.; Chen, H.; Anpo, M. Fe3+-TiO2 photocatalysts prepared by combining sol–gel method with hydrothermal treatment and their characterization. J. Photochem. Photobiol. A Chem. 2006, 180, 196–204. [Google Scholar] [CrossRef]
- Zhou, F.; Song, H.; Wang, H.; Komarneni, S.; Yan, C. N-doped TiO2/sepiolite nanocomposites with enhanced visible-light catalysis: Role of N precursors. Appl. Clay Sci. 2018, 166, 9–17. [Google Scholar] [CrossRef]
- Jo, W.-K.; Kang, H.-J. Aluminum sheet-based S-doped TiO2 for photocatalytic decomposition of toxic organic vapors. Chin. J. Catal. 2014, 35, 1189–1195. [Google Scholar] [CrossRef]
- Matos, J.; Ocares-Riquelme, J.; Poon, P.S.; Montaña, R.; García, X.; Campos, K.; Hernández-Garrido, J.C.; Titirici, M.M. C-doped anatase TiO2: Adsorption kinetics and photocatalytic degradation of methylene blue and phenol, and correlations with DFT estimations. J. Colloid Interface Sci. 2019, 547, 14–29. [Google Scholar] [CrossRef]
- Zhang, C.; Liu, Y.; Zhou, J.; Jin, W.; Chen, W. Tunability of photo-catalytic selectivity of B-doped anatase TiO2 microspheres in the visible light. Dye. Pigment. 2018, 156, 213–218. [Google Scholar] [CrossRef]
- Pambudi, A.B.; Kurniawati, R.; Iryani, A.; Hartanto, D. Effect of calcination temperature in the synthesis of carbon doped TiO2 without external carbon source. AIP Conf. Proc. 2018, 2049, 020074. [Google Scholar] [CrossRef]
- Kalantari, K.; Kalbasi, M.; Sohrabi, M.; Royaee, S.J. Synthesis and characterization of N-doped TiO2 nanoparticles and their application in photocatalytic oxidation of dibenzothiophene under visible light. Ceram. Int. 2016, 42, 14834–14842. [Google Scholar] [CrossRef]
- Ananpattarachai, J.; Kajitvichyanukul, P.; Seraphin, S. Visible light absorption ability and photocatalytic oxidation activity of various interstitial N-doped TiO2 prepared from different nitrogen dopants. J. Hazard. Mater. 2009, 168, 253–261. [Google Scholar] [CrossRef] [PubMed]
- Zhang, J.; Wu, Y.; Xing, M.; Leghari, S.A.K.; Sajjad, S. Development of modified N doped TiO2 photocatalyst with metals, nonmetals and metal oxides. Energy Environ. Sci. 2010, 3, 715–726. [Google Scholar] [CrossRef]
- Cong, Y.; Chen, F.; Zhang, J.; Anpo, M. Carbon and Nitrogen-Codoped TiO2 with High Visible Light Photocatalytic Activity. Chem. Lett. Chem. Lett. 2006, 35, 800–801. [Google Scholar] [CrossRef]
- Komai, Y.; Okitsu, K.; Nishimura, R.; Ohtsu, N.; Miyamoto, G.; Furuhara, T.; Semboshi, S.; Mizukoshi, Y.; Masahashi, N. Visible light response of nitrogen and sulfur co-doped TiO2 photocatalysts fabricated by anodic oxidation. Catal. Today 2011, 164, 399–403. [Google Scholar] [CrossRef]
- Wu, Y.; Xing, M.; Zhang, J. Gel-hydrothermal synthesis of carbon and boron co-doped TiO2 and evaluating its photocatalytic activity. J. Hazard. Mater. 2011, 192, 368–373. [Google Scholar] [CrossRef] [PubMed]
- Sun, T.; Fan, J.; Liu, E.; Liu, L.; Wang, Y.; Dai, H.; Yang, Y.; Hou, W.; Hu, X.; Jiang, Z. Fe and Ni co-doped TiO2 nanoparticles prepared by alcohol-thermal method: Application in hydrogen evolution by water splitting under visible light irradiation. Powder Technol. 2012, 228, 210–218. [Google Scholar] [CrossRef]
- Talat-Mehrabad, J.; Khosravi, M.; Modirshahla, N.; Behnajady, M.A. Synthesis, characterization, and photocatalytic activity of co-doped Ag–, Mg–TiO2-P25 by photodeposition and impregnation methods. Desalination Water Treat. 2016, 57, 10451–10461. [Google Scholar] [CrossRef]
- Quan, F.; Hu, Y.; Zhang, X.; Wei, C. Simple preparation of Mn-N-codoped TiO2 photocatalyst and the enhanced photocatalytic activity under visible light irradiation. Appl. Surf. Sci. 2014, 320, 120–127. [Google Scholar] [CrossRef]
- Jaiswal, R.; Patel, N.; Kothari, D.C.; Miotello, A. Improved visible light photocatalytic activity of TiO2 co-doped with Vanadium and Nitrogen. Appl. Catal. B Environ. 2012, 126, 47–54. [Google Scholar] [CrossRef]
- Wei, H.; Wu, Y.; Lun, N.; Zhao, F. Preparation and photocatalysis of TiO2 nanoparticles co-doped with nitrogen and lanthanum. J. Mater. Sci. 2004, 39, 1305–1308. [Google Scholar] [CrossRef]
- Gaikwad, P.N.; Hankare, P.P.; Wandre, T.M.; Garadkar, K.M.; Sasikala, R. Photocatalytic performance of magnetically separable Fe, N co-doped TiO2-cobalt ferrite nanocomposite. Mater. Sci. Eng. B 2016, 205, 40–45. [Google Scholar] [CrossRef]
- Zhao, Y.F.; Li, C.; Lu, S.; Liu, R.X.; Hu, J.Y.; Gong, Y.Y.; Niu, L.Y. Electronic, optical and photocatalytic behavior of Mn, N doped and co-doped TiO2: Experiment and simulation. J. Solid State Chem. 2016, 235, 160–168. [Google Scholar] [CrossRef]
- Bessekhouad, Y.; Robert, D.; Weber, J.V. Bi2S3/TiO2 and CdS/TiO2 heterojunctions as an available configuration for photocatalytic degradation of organic pollutant. J. Photochem. Photobiol. A Chem. 2004, 163, 569–580. [Google Scholar] [CrossRef]
- Karimzadeh, S.; Bahrami, K. Role of L-cysteine and CdS as promoted agents in photocatalytic activity of TiO2 nanoparticles. J. Environ. Chem. Eng. 2019, 7, 103454. [Google Scholar] [CrossRef]
- Boumaza, S.; Bellal, B.; Boudjemaa, A.; Trari, M. Photodegradation of orange G by the hetero-junction x%Bi2S3/TiO2 under solar light. Sol. Energy 2016, 139, 444–451. [Google Scholar] [CrossRef]
- Khan, R.; Kim, T.-J. Preparation and application of visible-light-responsive Ni-doped and SnO2-coupled TiO2 nanocomposite photocatalysts. J. Hazard. Mater. 2009, 163, 1179–1184. [Google Scholar] [CrossRef]
- Kaviyarasan, K.; Vinoth, V.; Sivasankar, T.; Asiri, A.M.; Wu, J.J.; Anandan, S. Photocatalytic and photoelectrocatalytic performance of sonochemically synthesized Cu2O@TiO2 heterojunction nanocomposites. Ultrason. Sonochem. 2019, 51, 223–229. [Google Scholar] [CrossRef] [PubMed]
- Ziarati-Saravani, A.; Nadimi, M.; Aroon, M.A.; Ebrahimian Pirbazari, A. Magnetic TiO2/NiFe2O4/reduced graphene oxide nanocomposite as a recyclable photocatalyst for photocatalytic removal of methylene blue under visible light. J. Alloys Compd. 2019, 803, 291–306. [Google Scholar] [CrossRef]
- Hafeez, H.Y.; Lakhera, S.K.; Narayanan, N.; Harish, S.; Hayakawa, Y.; Lee, B.-K.; Neppolian, B. Environmentally Sustainable Synthesis of a CoFe2O4–TiO2/rGO Ternary Photocatalyst: A Highly Efficient and Stable Photocatalyst for High Production of Hydrogen (Solar Fuel). ACS Omega 2019, 4, 880–891. [Google Scholar] [CrossRef]
- Chowdhury, M.; Kapinga, S.; Cummings, F.; Fester, V. Co3O4/TiO2 hetero-structure for methyl orange dye degradation. Water Sci. Technol. 2018, 79, 947–957. [Google Scholar] [CrossRef]
- Nasirian, M.; Bustillo-Lecompte, C.F.; Mehrvar, M. Photocatalytic efficiency of Fe2O3/TiO2 for the degradation of typical dyes in textile industries: Effects of calcination temperature and UV-assisted thermal synthesis. J. Environ. Manag. 2017, 196, 487–498. [Google Scholar] [CrossRef] [PubMed]
- Salamat, S.; Younesi, H.; Bahramifar, N. Synthesis of magnetic core–shell Fe3O4@TiO2 nanoparticles from electric arc furnace dust for photocatalytic degradation of steel mill wastewater. RSC Adv. 2017, 7, 19391–19405. [Google Scholar] [CrossRef]
- Choi, K.-J.; Hong, S. Preparation of TiO2 nanofibers immobilized on quartz substrate by electrospinning for photocatalytic degradation of ranitidine. Res. Chem. Intermed. 2011, 38. [Google Scholar] [CrossRef]
- Yao, S.; Li, J.; Shi, Z. Immobilization of TiO2 nanoparticles on activated carbon fiber and its photodegradation performance for organic pollutants. Particuology 2010, 8, 272–278. [Google Scholar] [CrossRef]
- Miranda-García, N.; Suárez, S.; Maldonado, M.I.; Malato, S.; Sánchez, B. Regeneration approaches for TiO2 immobilized photocatalyst used in the elimination of emerging contaminants in water. Catal. Today 2014, 230, 27–34. [Google Scholar] [CrossRef]
- Carp, O.; Huisman, C.L.; Reller, A. Photoinduced reactivity of titanium dioxide. Prog. Solid State Chem. 2004, 32, 33–177. [Google Scholar] [CrossRef]
- Wang, Y.; Zhang, X.; Liu, J.; Wang, Y.; Duan, D.; Fan, C. Facile regeneration and photocatalytic activity of CuO-modified silver bromide photocatalyst. Mater. Sci. Semicond. Process. 2015, 40, 613–620. [Google Scholar] [CrossRef]
- Kabra, K.; Chaudhary, R.; Sawhney, R.L. Treatment of Hazardous Organic and Inorganic Compounds through Aqueous-Phase Photocatalysis: A Review. Ind. Eng. Chem. Res. 2004, 43, 7683–7696. [Google Scholar] [CrossRef]
- Pan, X.; Zhang, N.; Fu, X.; Xu, Y.-J. Selective oxidation of benzyl alcohol over TiO2 nanosheets with exposed {001} facets: Catalyst deactivation and regeneration. Appl. Catal. A Gen. 2013, 453, 181–187. [Google Scholar] [CrossRef]
- Kagaya, S.; Shimizu, K.; Arai, R.; Hasegawa, K. Separation of titanium dioxide photocatalyst in its aqueous suspensions by coagulation with basic aluminium chloride. Water Res. 1999, 33, 1753–1755. [Google Scholar] [CrossRef]
- Divakaran, R.; Pillai, V.N.S. Mechanism of kaolinite and titanium dioxide flocculation using chitosan—Assistance by fulvic acids? Water Res. 2004, 38, 2135–2143. [Google Scholar] [CrossRef]
- Wang, H.T.; Ye, Y.Y.; Qi, J.; Li, F.T.; Tang, Y.L. Removal of titanium dioxide nanoparticles by coagulation: Effects of coagulants, typical ions, alkalinity and natural organic matters. Water Sci. Technol. 2013, 68, 1137–1143. [Google Scholar] [CrossRef] [PubMed]
- Cui, P.; Chen, Y.; Chen, G. Degradation of Low Concentration Methyl Orange in Aqueous Solution through Sonophotocatalysis with Simultaneous Recovery of Photocatalyst by Ceramic Membrane Microfiltration. Ind. Eng. Chem. Res. 2011, 50, 3947–3954. [Google Scholar] [CrossRef]
- Gaya, U.I.; Abdullah, A.H. Heterogeneous photocatalytic degradation of organic contaminants over titanium dioxide: A review of fundamentals, progress and problems. J. Photochem. Photobiol. C Photochem. Rev. 2008, 9, 1–12. [Google Scholar] [CrossRef]
- Chong, M.N.; Lei, S.; Jin, B.; Saint, C.; Chow, C.W.K. Optimisation of an annular photoreactor process for degradation of Congo Red using a newly synthesized titania impregnated kaolinite nano-photocatalyst. Sep. Purif. Technol. 2009, 67, 355–363. [Google Scholar] [CrossRef]
- Khedr, T.M.; El-Sheikh, S.M.; Ismail, A.A.; Kowalska, E.; Bahnemann, D.W. Photodegradation of Microcystin-LR Using Visible Light-Activated C/N-co-Modified Mesoporous TiO₂ Photocatalyst. Materials 2019, 12, 1027. [Google Scholar] [CrossRef]
- Malato, S.; Fernández-Ibáñez, P.; Maldonado, M.I.; Blanco, J.; Gernjak, W. Decontamination and disinfection of water by solar photocatalysis: Recent overview and trends. Catal. Today 2009, 147, 1–59. [Google Scholar] [CrossRef]
- Saquib, M.; Muneer, M. Titanium dioxide mediated photocatalyzed degradation of a textile dye derivative, acid orange 8, in aqueous suspensions. Desalination 2003, 155, 255–263. [Google Scholar] [CrossRef]
- Ohno, T.; Sarukawa, K.; Tokieda, K.; Matsumura, M. Morphology of a TiO2 Photocatalyst (Degussa, P-25) Consisting of Anatase and Rutile Crystalline Phases. J. Catal. 2001, 203, 82–86. [Google Scholar] [CrossRef]
- Muggli, D.S.; Ding, L. Photocatalytic performance of sulfated TiO2 and Degussa P-25 TiO2 during oxidation of organics. Appl. Catal. B Environ. 2001, 32, 181–194. [Google Scholar] [CrossRef]
- Muneer, M.; Singh, H.K.; Bahnemann, D. Semiconductor-mediated photocatalysed degradation of two selected priority organic pollutants, benzidine and 1,2-diphenylhydrazine, in aqueous suspension. Chemosphere 2002, 49, 193–203. [Google Scholar] [CrossRef]
- Ma, Y.; Zhang, J.; Tian, B.; Chen, F.; Wang, L. Synthesis and characterization of thermally stable Sm,N co-doped TiO2 with highly visible light activity. J. Hazard. Mater. 2010, 182, 386–393. [Google Scholar] [CrossRef] [PubMed]
- Monshi, A.; Foroughi, M.R.; Monshi, M. Modified Scherrer Equation to Estimate More Accurately Nano-Crystallite Size Using XRD. World J. Nano Sci. Eng. 2012, 2, 154–160. [Google Scholar] [CrossRef]
- Liang, H.-C.; Li, X.-Z.; Yang, Y.-H.; Sze, K.-H. Effects of dissolved oxygen, pH, and anions on the 2,3-dichlorophenol degradation by photocatalytic reaction with anodic TiO2 nanotube films. Chemosphere 2008, 73, 805–812. [Google Scholar] [CrossRef]
- Gerischer, H.; Heller, A. The role of oxygen in photooxidation of organic molecules on semiconductor particles. J. Phys. Chem. 1991, 95, 5261–5267. [Google Scholar] [CrossRef]
- Almquist, C.B.; Biswas, P. A mechanistic approach to modeling the effect of dissolved oxygen in photo-oxidation reactions on titanium dioxide in aqueous systems. Chem. Eng. Sci. 2001, 56, 3421–3430. [Google Scholar] [CrossRef]
- Bahnemann, D. Photocatalytic water treatment: Solar energy applications. Sol. Energy 2004, 77, 445–459. [Google Scholar] [CrossRef]
- Rincón, A.-G.; Pulgarin, C. Use of coaxial photocatalytic reactor (CAPHORE) in the TiO2 photo-assisted treatment of mixed E. coli and Bacillus sp. and bacterial community present in wastewater. Catal. Today 2005, 101, 331–344. [Google Scholar] [CrossRef]
- Fujishima, A.; Rao, T.N.; Tryk, D.A. Titanium dioxide photocatalysis. J. Photochem. Photobiol. C Photochem. Rev. 2000, 1, 1–21. [Google Scholar] [CrossRef]
- Ollis, D.F.; Pelizzetti, E.; Serpone, N. Photocatalyzed destruction of water contaminants. Environ. Sci. Technol. 1991, 25, 1522–1529. [Google Scholar] [CrossRef]
- Reutergådh, L.B.; Iangphasuk, M. Photocatalytic decolourization of reactive azo dye: A comparison between TiO2 and us photocatalysis. Chemosphere 1997, 35, 585–596. [Google Scholar] [CrossRef]


| Parameter | Thani et al. [5] | Setiadi et al. [27] | ||
|---|---|---|---|---|
| Mean | Range | Mean | Range | |
| pH * | 4.2 | 3.4–5.2 | 4.1 | 3.3–4.6 |
| Oil and Grease * | 6000 | 150–18,000 | - | - |
| BOD * | 25,000 | 10,000–44,000 | 21,280 | 8200–35,400 |
| COD * | 50,000 | 16,000–100,000 | 34,720 | 15,103–65,100 |
| Total Solids (TS) * | 40,500 | 11,500–79,000 | 46,185 | 16,580–94,106 |
| Suspended Solids (SS) * | 18,000 | 5000–54,000 | 21,170 | 1330–50,700 |
| Total Volatile Solid (TVS) * | 34,000 | 90,00–72,000 | - | - |
| Ammoniacal Nitrogen (AN) * | 35 | 4–80 | 13 | 2.5–50 |
| Total Nitrogen * | 750 | 80–1400 | 41 | 12–126 |
| Temperature (°C) | 90 | 80–100 | - | - |
| Year | 1991 | 1995 | 2014 | |||
|---|---|---|---|---|---|---|
| Parameter | Highest Level (mg/L) | The Highest Pollution Load (kg/ton) | Highest Level (mg/L) | The Highest Pollution Load (kg/ton) | Highest Level (mg/L) | The Highest Pollution Load (kg/ton) |
| BOD5 | 250 | 1.5 | 250 | 1.5 | 100 | 0.25 |
| COD | 500 | 3.0 | 500 | 3.0 | 350 | 0.88 |
| TSS | 300 | 1.8 | 300 | 1.8 | 250 | 0.63 |
| Oil and fat | 30 | 0.18 | 30 | 0.18 | 25 | 0.063 |
| Total Nitrogen (as N) | 20 | 0.12 | 20 | 0.12 | 50 | 0.125 |
| pH | 6–9 | - | 6.0–9.0 | 6.0–9.0 | ||
| Highest waste discharge | - | 6 m3 tons of raw material | 2.5 m3 per ton of CPO | |||
| Treatment Methods | Type of Technology | Details | COD Removal (%) | Advantages | Disadvantages | Ref. |
|---|---|---|---|---|---|---|
| Biological treatment | Anaerobic | Upflow Anaerobic Sludge Blanket (UASB) | 96 |
|
| [73] |
| Upflow Anaerobic Sludge Blanket-Hollow Centered Packed Bed (UASB-HCPB) | 97.5 |
|
| [12] | ||
| Upflow Anaerobic Sludge Fixed Film Reactor (UASFF) | 97 |
|
| [54] | ||
| Aerobic | Sequencing Batch Reactor (SBR) | 96 |
|
| [53] | |
| Rotating Biological Contactors (RBC) | 88 |
|
| [55] | ||
| Fermentation | Sequential two-stage | 93 |
|
| [74] | |
| Physical treatment | Membrane technology | UF and RO | 98.8 |
|
| [59] |
| Adsorption | Chitosan | Oil removal: 99 |
|
| [61,63] | |
| Activated carbon | 70 |
|
| [15] | ||
| Fenton-oxidation | Sono-Fenton | 80 |
|
| [66] | |
| Chemical treatment | Coagulation-flocculation | Seed gum | 48.2 |
|
| [58] |
| Thermo-chemical treatment | Steam reforming | Catalytic steam reforming | 99 |
|
| [17,18] |
| Integration treatment | Biological Membrane | EGSB-Membrane | 93 |
|
| [60] |
| Photocatalyst | Synthesis Method | Light Source | Degradation Rate | Catalyst Loading | Ref. |
|---|---|---|---|---|---|
| TiO2 nanoparticles (Degussa P25) | n.a. (Commercial) | UV B lamp | COD removal: 89% (5 h) TOD removal: 57% (5 h) Color reduction: 60% (5 h) | 0.1 g/L | [115] |
| Cu/TiO2 (Degussa P25) | Impregnation | UV lamp (1000 W) | COD removal: 27% (1 h); >40% (7 h) | 0.83 g/L (20 wt % Cu/TiO2) | [116] |
| TiO2 | Sol-gel | UV Fluorescent tube (20 W) | COD removal: 97% (42 min) BOD removal: 95% (42 min) Decolorization: 92% (42 min) | 0.01 g/L | [117] |
| TiO2 commercial | n.a. (Commercial) | UV lamp (100 W) | COD removal: 52% (4 h) COD removal: 78% (20 h) | 1.0 g/L | [118] |
| TiO2 commercial | n.a. (Commercial) | UV lamp (100 W) | COD removal: 55% (4 h) BOD removal: 44% (4 h) | 1.04 g/L | [119] |
| TiO2 | n.a. (Commercial) | UV lamp (100 W) | COD removal: 52% (4 h); 80% (22 h) | 1.0 g/L | [114] |
| ZnO | COD removal: 49% (4 h); 74% (22 h) | ||||
| TiO2 anatase | n.a. (Commercial) | Solar light | COD removal: 88% (5 h) | 0.1 g/L | [120] |
| Pt/TiO2 | Impregnation | UV lamp (100 W) | COD removal: 90% (8 h) | 1.0 g/L (0.5 wt % Pt/TiO2) | [44] |
| Xenon lamp (100 W) | COD removal: 11% (8 h) | ||||
| Ag/TiO2 | Impregnation | UV lamp (100 W) | COD removal: 85% (8 h) | 1.0 g/L (0.5 wt % Ag/TiO2) | [121] |
| Xenon lamp (100 W) | COD removal: 60% (8 h) | 1.0 g/L (0.5 wt % Ag/TiO2) | |||
| Ag/TiO2 | Impregnation | Visible lamp (250 W) | COD removal: 27% (8 h) | 1.5 g/L (0.5 wt % Ag/TiO2) | [45] |
| CaFe2O4 | Auto-combustion and coprecipitation | Xenon lamp (500 W) | COD removal: 56% (8 h) | 1.0 g/L | [122] |
| CaFe2O4 | Coprecipitation | Xenon lamp (500 W) | COD removal: 69% (8 h) | 0.75 g/L | [123] |
| WO3 commercial | n.a. (Commercial) | UV lamp (100 W) | COD removal: 51% (4 h); 85% (16 h) Decolorization: 96% (4 h); 98% (16 h) | 0.5 g/L | [106] |
| ZnO commercial | n.a. (Commercial) | Mercury lamp (100 W) | COD removal: 50% (4 h); 75% (22 h) | 1.0 g/L | [124] |
| ZnO-PEG | Precipitation | UV lamp (15 W) | COD removal: 94% Decolorization: 84% | 0.5 g/L | [125] |
| ZnO | Facile and surfactant-free reflux | Pen-ray UV-C (light intensity 5400 µW/cm2) | COD removal: 96% (2 h) | 1.0 g/L | [126] |
| ZnO commercial | n.a. (Commercial) | COD removal: 69% (2 h) | |||
| Nb2O5/ZnO | Surfactant-free chemical solution | UV lamp | COD removal: 92% (4 h) Decolorization: 100% (30 min) | 3 wt % Nb2O5/ZnO | [127] |
Publisher’s Note: MDPI stays neutral with regard to jurisdictional claims in published maps and institutional affiliations. |
© 2021 by the authors. Licensee MDPI, Basel, Switzerland. This article is an open access article distributed under the terms and conditions of the Creative Commons Attribution (CC BY) license (https://creativecommons.org/licenses/by/4.0/).
Share and Cite
Saputera, W.H.; Amri, A.F.; Daiyan, R.; Sasongko, D. Photocatalytic Technology for Palm Oil Mill Effluent (POME) Wastewater Treatment: Current Progress and Future Perspective. Materials 2021, 14, 2846. https://doi.org/10.3390/ma14112846
Saputera WH, Amri AF, Daiyan R, Sasongko D. Photocatalytic Technology for Palm Oil Mill Effluent (POME) Wastewater Treatment: Current Progress and Future Perspective. Materials. 2021; 14(11):2846. https://doi.org/10.3390/ma14112846
Chicago/Turabian StyleSaputera, Wibawa Hendra, Aryan Fathoni Amri, Rahman Daiyan, and Dwiwahju Sasongko. 2021. "Photocatalytic Technology for Palm Oil Mill Effluent (POME) Wastewater Treatment: Current Progress and Future Perspective" Materials 14, no. 11: 2846. https://doi.org/10.3390/ma14112846
APA StyleSaputera, W. H., Amri, A. F., Daiyan, R., & Sasongko, D. (2021). Photocatalytic Technology for Palm Oil Mill Effluent (POME) Wastewater Treatment: Current Progress and Future Perspective. Materials, 14(11), 2846. https://doi.org/10.3390/ma14112846