Abstract
Background: Traffic and industrial emissions are associated with increased pediatric asthma morbidity. However, few studies have examined the influence of city industrial zoning on pediatric asthma outcomes among minoritized communities with limited access to air monitoring. Methods: In this cross-sectional analysis of 39,974 school-aged students in Santa Ana, CA, we investigated the effect of proximity to areas zoned for industrial use on pediatric asthma prevalence, physical fitness, school attendance, and standardized test scores. Results: The study population was 80.6% Hispanic, with 88.2% qualifying for free/reduced lunch. Compared to students living more than 1 km away from industrial zones, those living within 0.5 km had greater odds of having asthma (adjusted OR 1.21, 95% CI 1.09 to 1.34, p < 0.001). Among children with asthma, those living between 0.5–1.0 km had greater odds of being overweight or obese (aOR 1.47, 95% CI 1.00, 2.15, p = 0.047). Industrial zone proximity was not significantly associated with worse fitness and academic outcomes for students with asthma. Conclusion: These findings suggest that industrial zone proximity is associated with increased pediatric asthma in a predominantly Latino community in Southern California.
Keywords:
asthma prevalence; obesity; children; pediatric; industrial zone; industry; zoning; Latinx; Latino; Hispanic 1. Introduction
Industrial zoning decisions, which are vital in shaping the visual and economic landscapes of cities, can have powerful impacts on human health, often in patterns that disproportionately harm minoritized groups [1]. Among the many different environmental disturbances caused by industrial activities, air pollution is especially insidious, and has been associated with severe health effects, including increased asthma prevalence and morbidity among children [2,3,4]. A growing body of evidence for pollution-related asthma morbidity comes from literature on traffic-related air pollution (TRAP) showing the significant effects of nitrogen oxides and particulate matter on the incidence of pediatric asthma [5,6,7,8,9,10,11,12,13]. One important finding emerging from TRAP studies is the delineation of minimum distances, ranging from 0.075 km to 0.5 km, within which home proximity to major roads and highways constitute a significant risk factor for asthma. Increased asthma morbidity, in turn, can have serious consequences on children’s health and quality of life, including lower physical fitness and increased school absenteeism [14,15,16,17,18,19,20,21,22,23]. Studies of academic outcomes have consistently demonstrated significant differences in absenteeism among children with and without asthma, and, in some cases, have demonstrated worsening standardized test scores as a result [19,20,21,22,23]. Children with asthma have also been found to have difficulties engaging in physical activity, and obesity and asthma are frequently observed as co-morbid conditions in pediatric populations [14,15,16,17,18].
Studying the effects of air pollution directly is limited by the availability of monitoring data, as air monitors are costly to maintain; thus, extant air monitoring data is often interpolated from sparse networks of stationary air monitors [24]. Indirect, distance–gradient approaches are used to characterize the health effects of proximity to an area of suspected harmful environmental exposures, which is valuable as an initial tool in describing environmental risk and identifying potential exposures of interest [25]. This is supported by studies of industrial zoning exposure on pediatric asthma that have found increased asthma prevalence, asthma symptoms, exacerbations, and healthcare encounters in relation to specific types of pollutants [26,27,28]. However, there remains a knowledge gap regarding the relationship between broader patterns of industrial zoning and pediatric asthma morbidity [29,30,31,32].
The city of Santa Ana, CA, is 78.2% Hispanic/Latino (among whom 70.1% report Mexican ancestry), has a lifetime pediatric asthma incidence of 13.8% versus the national average of around 11.4–11.6%, and contains 17 census tracts labeled “disadvantaged communities” by the State of California [33,34,35,36,37]. At present, real-time air pollutant levels for Santa Ana are estimated from readings of a single monitoring station over 10 miles away, in the city of Anaheim [38]. Although long-standing community concerns about children’s health and environmental exposures have led to the recent acquisition of resources to develop its community air monitoring network, this network, based on low-cost sensors, only measures fine particulate matter concentrations and cannot capture toxic emissions from industrial facilities. Questions and concerns remain about whether home and school distance to areas zoned for industrial use might be associated with pediatric health outcomes, even in the absence of neighborhood-level pollutant data [39].
The aim of this study was to examine relationships between industrial zone proximity and asthma prevalence, as well as the effects of industrial zone proximity on academic and health outcomes among children with asthma, using student records from the Santa Ana Unified School District (SAUSD).
2. Materials and Methods
The study was conducted according to the guidelines of the Declaration of Helsinki and approved by the Institutional Review Board of UC Irvine (protocol #2019-5117, approval 10 June 2019) and the SAUSD Research and Evaluation Department.
2.1. Sample Selection
K-12 student data were obtained on all SAUSD enrolled students for the 2018–2019 school year, including demographic information, student medical records, physical fitness test data, and standardized academic testing data. Of the 48,823 total student records from 63 schools, we excluded 2827 students who attended 12 non-traditional schools (head-start programs and remedial programs for adults) and 992 students who were enrolled for 159 days or fewer to ensure sufficient enrollment time to ascertain outcomes. Home and school addresses were geocoded using ArcGIS Pro TM (Redlands, CA). In total, 363 students for whom only a PO box home address was available (n = 239), whose residential address fell outside of Orange County (n = 87), or whose geocoding was of low accuracy (i.e., geocoding matching score < 85; n = 19), or otherwise not available (n = 18), were considered ineligible for geocoding home address and were excluded from the analysis [40,41]. We further excluded 4667 students due to missing data on key variables for analysis, yielding a final sample size of 39,974 (Figure 1).
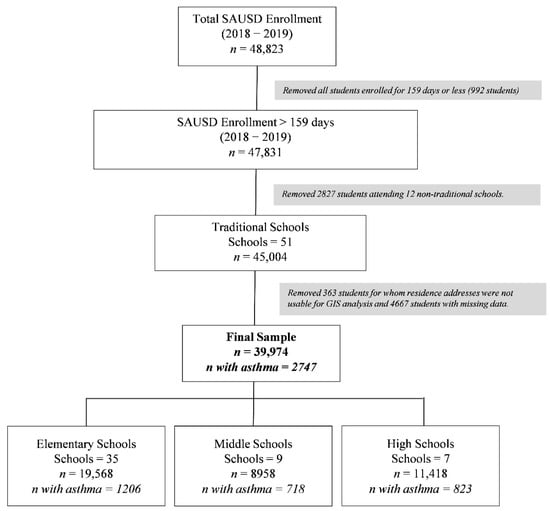
Figure 1.
Study sample selection. The final sample included 39,974 students at 51 schools.
2.2. Outcome Variables
Asthma diagnosis and medical or health appointment-related absences were extracted from SAUSD records for the 2018–2019 school year. Per SAUSD nursing staff, diagnoses are updated in the student’s health record at regular intervals, which may vary across schools. We defined asthma diagnosis as having an asthma diagnosis on school records, and/or evidence of albuterol or inhaler use at school, and/or evidence of an asthma-related event at school in their school medical record. Data on the number and type of student absences were imported from SAUSD records. Any type of absence linked to health needs, including absences coded as “health appointments,” “illness”, or “medical absence” was defined as a medically related absence.
Fitness outcomes were obtained from FITNESSGRAM physical fitness tests, which are administered to students in grade levels 5, 7, and 9 [42]. Of the 11,180 students in these grades, 10,996 (98%) had a documented physical fitness test score. Of the different tests assessed in FITNESSGRAM, the aerobic capacity assessment was used as an outcome measure given the known relationship between severe asthma and diminished aerobic capacity [43,44]. Students were classified as having a healthy or unhealthy aerobic fitness score using established FITNESSGRAM scoring cutoffs.
Height and weight were measured for all students and were used to calculate BMI percentile relative to the US pediatric population and adjusted for sex and age [45]. For this analysis, children with BMI equal to or greater than the 85th national percentile were classified as overweight/obese.
The statewide Smarter Balanced (SB) assessments for mathematics and English/language arts were available for n = 21,938 and 21,931 students, respectively, across grades 3–8 and 11. Details of the SB assessment are available through the California Department of Education. Briefly, the assessments are designed to test students’ knowledge levels based on statewide grade-level standards. Students were classified as having achieved or failed to meet their grade-level standard of knowledge [46].
2.3. Exposure Variables
Industrial zones were demarcated according to the City of Santa Ana Zoning Map, corresponding to areas zoned for either heavy or light industrial use [47]. Freeways included interstate and state highways. The shortest home or school distance in kilometers to the nearest freeway or boundary of an industrial zone polygon was then calculated using ArcGIS Pro. We combined home and school distances to calculate weighted composite distance variables by incorporating the proportion of time students stay at home or school using the formula: 0.21 × distance from school + 0.79 × distance from home, which corresponds roughly to 7 h × 5 days per week over the total number of hours in a week. We then categorized the distance variables roughly into tertiles, with the farthest group being treated as the reference category (distance to industrial zone: closest < 0.5 km, middle 0.5–1.0 km, farthest > 1.0 km; distance to freeway: closest < 1.5 km, middle 1.5–3.0 km, farthest > 3.0 km).
2.4. Analysis
Sample characteristics were examined using means and standard deviations (SD) for continuous measures, and frequencies and proportions for categorical measures and compared between students with asthma vs. without asthma using independent samples t-tests and chi-squared tests, respectively. To test the hypothesized relationships between industrial zone or freeway proximity and asthma, fitness, and academic outcomes, generalized linear regression models were fit on each outcome adjusted for demographic covariates, with logit link for binary outcomes (asthma diagnosis, overweight/obese vs. normal weight, failed aerobic fitness test, failed SB math test, and failed SB English test) and identity link for continuous outcomes (number of absences). Fitness and academic outcomes analyses were completed among students with asthma only. Effect estimates were expressed as adjusted odds ratios (aORs) or mean differences and 95% confidence intervals (CIs) for each outcome for each tertile closer to nearest industrial zone or freeway. Adjusted models included sex, age, self-reported Hispanic ethnicity, parents’ education (at least one parent completed high school), qualifying for free or reduced lunch, and zip code. Results were considered significant at a level of p < 0.05. All analyses were conducted using R statistical software, v4.1.1 (R Core Team (2020), Vienna, Austria.
3. Results
3.1. Sample Characteristics
The study sample included 39,974 students, among whom the mean age was 12.2 ± 3.6 years, 50.5% were male, 80.6% identified as Hispanic, 88.2% qualified for free or reduced lunch, and 47.7% reported that neither parent had completed high school (Table 1). Fifty percent of students were overweight or obese and the mean number of days absent was 5 ± 7.3 days. The prevalence of asthma diagnosis was 6.9% (n = 2747). Students with asthma were more likely than students without asthma to be male, overweight, and fail their aerobic test but not academic tests. Mean composite distances were 0.9 km to the nearest industrial zone and 2.2 km to the nearest freeway.

Table 1.
Sample characteristics.
3.2. Asthma
The odds of having an asthma diagnosis were 21% greater among the middle distance group vs. farthest distance group to industrial zone (aOR = 1.21, 95% CI 1.10–1.34, p < 0.001) and also 21% greater among the closest vs. farthest distance group to industrial zone (aOR = 1.21, 95% CI 1.09–1.34, p < 0.001; see Table 2 and Figure 2). Proximity to the nearest freeway was associated with 18% higher odds of asthma diagnosis when comparing the closest vs. farthest distance groups only (middle vs. farthest group: aOR = 1.03, 95% CI 0.92, 1.16, p = 0.555; closest vs. farthest group: aOR = 1.18, 95% CI 1.03, 1.35, p = 0.014; Table 2 and Figure 2).
Table 2.
Regression models of asthma and academic outcomes by distance to industrial zones and freeways.
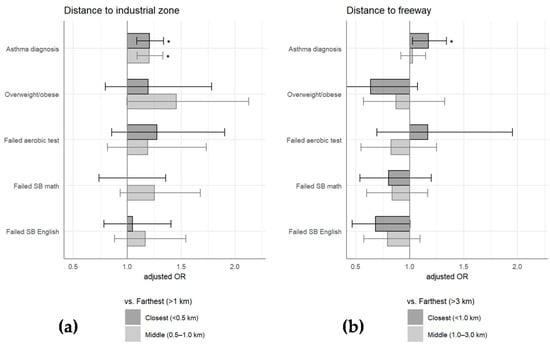
Figure 2.
Regression models for asthma and academic outcomes by distance to industrial zone and freeways. Adjusted odds ratios with 95% CI shown among closest distance group vs. farthest distance group (darker grey) and middle distance group vs. farthest distance group (lighter grey) for (a) industrial zones and (b) freeways. * with p < 0.05.
3.3. Obesity and Fitness Outcomes among Children with Asthma
Among students with asthma, an elevated risk of being overweight or obese was observed for those with moderate proximity (0.5–1.0 km) to industrial zones only (aOR 1.47, 95% CI 1.00 to 2.15, p = 0.047; Table 2 and Figure 2). The distance to the nearest freeway was not associated with a risk of obesity. Failure on the aerobic FITNESSGRAM test was not significantly associated with distance to industrial zones or the nearest freeway.
3.4. Academic Outcomes and Absences among Children with Asthma
A majority of students failed to achieve adequate scores (i.e., were scored as “needs improvement” or below) on the Smarter Balanced math and English tests. No significant associations were found between distance to industrial zone or freeway and failure of either Smarter Balanced math or English tests, which may be partly due to the high prevalence of failure. Likewise, distance to industrial zones and nearest freeway were not associated with total or health-related absences (see Table 2 and Figure 2).
4. Discussion
This study examined the effects of residential and school proximity to industrial zones and freeways on several health and academic outcomes among a sample of 39,974 K-12 students in the majority poor and Latinx city of Santa Ana, California, using readily available school records. As hypothesized, we found that increased proximity to industrial zones was associated with higher asthma prevalence when controlling for socioeconomic factors. The magnitude of this association was uniform for those with close and moderate proximity to industrial zones, defined as <1.0 km. Among children with asthma, industrial zone proximity was also associated with a greater likelihood of being overweight or obese, although this finding was only significant for those with moderate proximity. However, we observed no significant association between industrial zone proximity and school absences or standardized test scores. Proximity to freeways was associated with increased asthma prevalence among those in the closest category, but not associated with any of the other health or academic outcomes.
This study was conceived in collaboration with residents of Santa Ana, CA and SAUSD stakeholders in response to longstanding concerns about a possible relationship between industrial zoning and pediatric asthma incidence. A major strength of this study was its cost-effective use of available school district records, which contain standardized academic and fitness records as well as school absences and health records in relation to industrial zone/freeway proximities. Using the simple distance–gradient method of exposure analysis, our industrial zone findings support the results of prior studies that showed the deleterious effects of myriad industrial activities on asthma outcomes [25,26,27,28,48]. In particular, our analysis found increased asthma risk for children within 1 km of industrial zones, which is consistent with prior risk zones identified for proximity to chipboard industries (<2 km) and industrial parks (<5 km) [28,48]. Others using distance–gradient modeling have also found decreased lung function, increased ED visit rates, increased and hospitalizations related to proximity to industrial sources (petrochemical plants, wood processing industries), which was not available in our dataset [26,28]. We also observed an increased risk of overweight/obesity with industrial zone proximity, which corroborates previous findings suggesting worsening metabolic outcomes for children exposed to industrial pollution [49].
In contrast to prior studies linking traffic-related air pollution with worse asthma health, we found weak evidence for the effects of proximity to freeways on asthma risk, and no significant evidence for a link between freeway exposure and obesity, aerobic fitness, or academic outcomes among children with asthma. This is potentially explained by our tertile cut-points for freeway distance (<1.5 km, 1.5–3.0 km, >3.0 km); these are unlikely to adequately capture freeway pollutants, which have been shown to disperse to background levels at a distance of 200–2000 m, depending on meteorological conditions [50,51]. These cut-points were chosen based on the distribution of distance to freeways in this sample, but sensitivity analyses using alternative cut-points did not substantially alter the results (data not shown). Taken together, industrial zone and freeway exposure results suggest a patterning of health risk around industrial zoning and further study of possible factors/mechanisms, including increased air pollution, industry-associated traffic and/or noise, pollution from intermediate “trunk roads”, and other household and neighborhood-level factors that may affect asthma risk [52].
Consistent with previous studies, we found that our students with asthma had higher mean numbers of days of total and medically related absences compared to their peers [19,20,21,22,23]. However, we did not find any significant differences in academic outcomes between children with and without asthma or related to proximity to industrial zones among the students with asthma; however, there was a high rate of failure on both the standardized math and English tests among the student population. Overall, the data are mixed for academic outcomes related to asthma; some studies report no differences in academic outcomes despite differences in absenteeism among students with asthma, while other have demonstrated associations between asthma and worsening standardized test outcomes [19,20,21,22,23]. Differences in asthma diagnosis or severity as well as the demographic and socioeconomic characteristics of the various student populations may be contributing factors.
Among children with asthma, our finding of a possible increased risk of obesity for children at medium and close distances to areas of industrial zoning supports previous studies suggesting that exposure to unmeasured, industry-associated chemical obesogens, may play an important role in obesity disparities [53]. The combination of both asthma and obesity may increase susceptibility to pollutant exposure [54]. Additionally, children living closest to industrial areas may face other neighborhood risk factors, such as limited health care access, decreased access to green spaces, lower neighborhood walkability, and diminished availability of healthy food options [55,56]. Though we controlled for parents’ education and neighborhood effects with zip code, we did not have direct measures of socioeconomic status. Likewise, 10% of students were dropped from this analysis due to missing data; thus, it is possible that some selection bias may have influenced our results. We found that students who remained in the analysis were on average older and more likely to have asthma; however, sensitivity analyses replicating our models using the full sample did not yield different results (Table S1).
The present study expands upon the distance–gradient method of exposure analysis, a simple and frequently used technique in environmental health research, using information exclusively obtained from school district records [57]. A principal limitation of this study was a lack of direct air quality measures as well as in-home exposures, such as smoking, cleaning products, pets, molds, etc. [27]. As demonstrated by Bergstra et al., the addition of this information, together with distance-based analysis, can allow for a significantly more robust and conclusive analysis about the effects of industry on pediatric respiratory health [27]. However, the distance–gradient method of exposure analysis has the important advantage of being accessible to historically under-resourced communities that may not be able to afford extensive data collection devices or field campaigns. This approach allows us to focus on multiple factors (e.g., air pollution, lack of green space, noise) combined with zoning effects, in contrast to a single measure of an exposure variable. In addition, the results on the zoning effects may have direct implications for zoning policy changes in the city.
Future studies could build upon our results using similar cost-effective research approaches, e.g., testing distance–gradient exposure models on school districts with similar baseline characteristics, to examine whether industrial zone proximity can successfully predict asthma or other health risks even in the absence of point source information. Such models could be expanded to include the effect of possible asthma-protective factors, such as green space [55]. Future studies could also leverage the longitudinal school records to observe changes in asthma incidence and severity over time. Resource-intensive approaches, including the deployment of high-resolution air monitoring technology, the measurement of additional physiologic outcomes through pulmonary function testing, and expanded surveys to measure in-home exposures, could subsequently be employed to elucidate the specific modifiable risk factors that mediate the effects of industrial zone proximity on the observed pediatric health risks.
5. Conclusions
Our findings suggest that industrial zone proximity is associated with increased pediatric asthma in a predominantly poor and Latinx community in Southern California. We utilized a simplified approach to environmental risk factor identification, in which industrial zones are seen not just as potential sources of air pollution, but as dynamic entities with effects on population health that can be quantified and managed, even in the absence of sophisticated and expensive sampling equipment. At a local level, these results provide important context for the intersection of city zoning policy and children’s asthma health, which may be immediately valuable to local environmental justice groups, school district health staff, and city policymakers. Future studies could examine the possible protective effects of green space and/or other recreational areas on asthma and weight-related outcomes. Lastly, the use of school district records was possible through our collaborations with the local school district and highlights how schools/communities and universities can collaborate to study the intersection between pediatric health, environmental exposures, and academic outcomes.
Supplementary Materials
The following supporting information can be downloaded at: https://www.mdpi.com/article/10.3390/ijerph19084820/s1, Table S1: Sensitivity analysis among full sample.
Author Contributions
Conceptualization, K.M. and K.D.L.; Methodology, K.M., J.W., A.M.P., K.D.L.; Formal Analysis, K.M.; Resources, K.D.L.; Writing—Original Draft Preparation, K.M.; Writing—Review & Editing, K.M., A.M.P., J.W., J.B. and K.D.L.; Funding Acquisition, K.D.L. All authors have read and agreed to the published version of the manuscript.
Funding
The project described was supported by the National Center for Research Resources and the National Center for Advancing Translational Sciences, National Institutes of Health, through Grant UL1 TR001414.
Institutional Review Board Statement
The study was conducted according to the guidelines of the Declaration of Helsinki and approved by the Institutional Review Board of UC Irvine (protocol code 2019–5117 and date of approval 10 June 2019) and the SAUSD Research and Evaluation Department.
Informed Consent Statement
Patient consent was waived due to de-identified school records.
Data Availability Statement
Not applicable.
Acknowledgments
We would like to thank the Santa Ana Unified School District for their collaboration with this project.
Conflicts of Interest
K.D.L. was an employee of the University of California, Irvine, during the concept, data collection, and development of this publication. K.D.L. is currently an employee of Novartis Pharma. The rest of the authors declare that they have no relevant conflict of interest.
References
- Maantay, J. Zoning law, health, and environmental justice: What’s the connection? J. Law Med. Ethics 2002, 30, 572–593. [Google Scholar] [CrossRef] [PubMed]
- Anderson, M.L. As the Wind Blows: The Effects of Long-Term Exposure to Air Pollution on Mortality. J. Eur. Econ. Assoc. 2020, 18, 1886–1927. [Google Scholar] [CrossRef] [PubMed]
- Tiotiu, A.I.; Novakova, P.; Nedeva, D.; Chong-Neto, H.J.; Novakova, S.; Steiropoulos, P.; Kowal, K. Impact of air pollution on asthma outcomes. Int. J. Environ. Res. Public Health 2020, 17, 6212. [Google Scholar] [CrossRef] [PubMed]
- Landrigan, P.J.; Fuller, R.; Fisher, S.; Suk, W.A.; Sly, P.; Chiles, T.C.; Bose-O’Reilly, S. Pollution and children’s health. Sci. Total Environ. 2019, 650, 2389–2394. [Google Scholar] [CrossRef] [PubMed]
- Khreis, H.; Kelly, C.; Tate, J.; Parslow, R.; Lucas, K.; Nieuwenhuijsen, M. Exposure to traffic-related air pollution and risk of development of childhood asthma: A systematic review and meta-analysis. Environ. Int. 2017, 100, 1–31. [Google Scholar] [CrossRef] [Green Version]
- Bettiol, A.; Gelain, E.; Milanesio, E.; Asta, F.; Rusconi, F. The first 1000 days of life: Traffic-related air pollution and development of wheezing and asthma in childhood. A systematic review of birth cohort studies. Environ. Health 2021, 20, 46. [Google Scholar] [CrossRef] [PubMed]
- Perez, L.; Declercq, C.; Inĩguez, C.; Aguilera, I.; Badaloni, C.; Ballester, F.; Bouland, C.; Chanel, O.; Cirarda, F.B.; Forastiere, F.; et al. Chronic burden of near-roadway traffic pollution in 10 European cities (APHEKOM network). Eur. Respir. J. 2013, 42, 594–605. [Google Scholar] [CrossRef] [Green Version]
- Tetreault, L.F.; Doucet, M.; Gamache, P.; Fournier, M.; Brand, A.; Kosatsky, T.; Smargiassi, A. Childhood exposure to ambient air pollutants and the onset of asthma: An administrative cohort study in Québec. Environ. Health Perspect. 2016, 124, 1276–1282. [Google Scholar] [CrossRef] [Green Version]
- Lee, Y.J.; Rabinovitch, N. Relationship between traffic-related air pollution particle exposure and asthma exacerbations: Association or causation? Ann. Allergy Asthma Immunol. 2018, 120, 458–460. [Google Scholar] [CrossRef]
- Künzli, N.; Perez, L.; Lurmann, F.; Hricko, A.; Penfold, B.; McConnell, R. An attributable risk model for exposures assumed to cause both chronic disease and its exacerbations. Epidemiology 2008, 19, 179–185. [Google Scholar] [CrossRef]
- McConnell, R.; Berhane, K.; Yao, L.; Jerrett, M.; Lurmann, F.; Gilliland, F.; Künzli, N.; Gauderman, J.; Avol, E.D.; Thomas, D.; et al. Traffic, susceptibility, and childhood asthma. Environ. Health Perspect. 2006, 114, 766–772. [Google Scholar] [CrossRef] [PubMed] [Green Version]
- Perez, L.; Lurmann, F.; Wilson, J.; Pastor, M.; Brandt, S.J.; Künzli, N.; McConnell, R. Near-roadway pollution and childhood asthma: Implications for developing “win-win” compact urban development and clean vehicle strategies. Environ. Health Perspect. 2012, 120, 1619–1626. [Google Scholar] [CrossRef] [PubMed] [Green Version]
- Health Effects Institute. Panel on the Health Effects. Traffic-Related Air Pollution: A Critical Review of the Literature on Emissions, Exposure, and Health Effects; A Special Report of the HEI Panel on the Health Effects of Traffic-Related Air Pollution—Executive Summary; Health Effects Institute: Boston, MA, USA, 2010; Available online: www.healtheffects.org (accessed on 13 April 2021).
- Clark, C.J.; Cochrane, L.M. Physical activity and asthma. Curr. Opin. Pulm. Med. 1999, 5, 68–75. [Google Scholar] [CrossRef] [PubMed]
- Avallone, K.M.; McLeish, A.C. Asthma and Aerobic Exercise: A Review of the Empirical Literature. J. Asthma 2013, 50, 109–116. [Google Scholar] [CrossRef]
- Glazebrook, C.; McPherson, A.C.; Macdonald, I.A.; Swift, J.A.; Ramsay, C.; Newbould, R.; Smyth, A. Asthma as a barrier to children’s physical activity: Implications for body mass index and mental health. Pediatrics 2006, 118, 2443–2449. [Google Scholar] [CrossRef]
- Côté, A.; Turmel, J.; Boulet, L.P. Exercise and Asthma. Semin. Respir. Crit. Care Med. 2018, 39, 19–28. [Google Scholar] [CrossRef] [Green Version]
- Black, M.H.; Smith, N.; Porter, A.H.; Jacobsen, S.J.; Koebnick, C. Higher prevalence of obesity among children with asthma. Obesity 2012, 20, 1041–1047. [Google Scholar] [CrossRef] [Green Version]
- Moonie, S.; Sterling, D.A.; Figgs, L.W.; Castro, M. The relationship between school absence, academic performance, and asthma status. J. Sch. Health 2008, 78, 140–148. [Google Scholar] [CrossRef]
- Moonie, S.A.; Sterling, D.A.; Figgs, L.; Castro, M. Asthma Status and Severity Affects Missed School Days. J. Sch. Health 2006, 76, 18–24. [Google Scholar] [CrossRef]
- Moonie, S.; Cross, C.L.; Guillermo, C.J.; Gupta, T. Grade retention risk among children with asthma and other chronic health conditions in a large urban school district. Postgrad. Med. 2010, 122, 110–115. [Google Scholar] [CrossRef]
- Silverstein, M.D.; Mair, J.E.; Katusic, S.K.; Wollan, P.C.; O’Connell, E.J.; Yunginger, J.W. School attendance and school performance: A population-based study of children with asthma. J. Pediatrics 2001, 139, 278–283. [Google Scholar] [CrossRef] [PubMed]
- Kohen, D.E. Asthma and School Functioning. Health Rep. 2010, 21, 35. [Google Scholar] [PubMed]
- Kumar, P.; Morawska, L.; Martani, C.; Biskos, G.; Neophytou, M.; Di Sabatino, S.; Bell, M.; Norford, L.; Britter, R. The rise of low-cost sensing for managing air pollution in cities. Environ. Int. 2015, 75, 199–205. [Google Scholar] [CrossRef] [PubMed] [Green Version]
- Svechkina, A.; Portnov, B.A. A new approach to spatial identification of potential health hazards associated with childhood asthma. Sci. Total Environ. 2017, 595, 413–424. [Google Scholar] [CrossRef]
- Wichmann, F.A.; Müller, A.; Busi, L.E.; Cianni, N.; Massolo, L.; Schlink, U.; Porta, A.; Sly, P.D. Increased asthma and respiratory symptoms in children exposed to petrochemical pollution. J. Allergy Clin. Immunol. 2009, 123, 632–638. [Google Scholar] [CrossRef]
- Bergstra, A.D.; Brunekreef, B.; Burdorf, A. The effect of industry-related air pollution on lung function and respiratory symptoms in school children. Environ. Health 2018, 17, 30. [Google Scholar] [CrossRef] [Green Version]
- De Marco, R.; Marcon, A.; Rava, M.; Cazzoletti, L.; Pironi, V.; Silocchi, C.; Ricci, P. Proximity to chipboard industries increases the risk of respiratory and irritation symptoms in children: The Viadana study. Sci. Total Environ. 2010, 408, 511–517. [Google Scholar] [CrossRef]
- Ebisu, K.; Holford, T.R.; Belanger, K.D.; Leaderer, B.P.; Bell, M.L. Urban land-use and respiratory symptoms in infants. Environ. Res. 2011, 111, 677–684. [Google Scholar] [CrossRef] [Green Version]
- Son, J.Y.; Kim, H.; Bell, M.L. Does urban land-use increase risk of asthma symptoms? Environ. Res. 2015, 142, 309–318. [Google Scholar] [CrossRef]
- Alcock, I.; White, M.; Cherrie, M.; Wheeler, B.; Taylor, J.; McInnes, R.; Im Kampe, E.O.; Vardoulakis, S.; Sarran, C.; Soyiri, I.; et al. Land cover and air pollution are associated with asthma hospitalisations: A cross-sectional study. Environ. Int. 2017, 109, 29–41. [Google Scholar] [CrossRef]
- Maantay, J. Asthma and air pollution in the Bronx: Methodological and data considerations in using GIS for environmental justice and health research. Health Place 2007, 13, 32–56. [Google Scholar] [CrossRef] [PubMed]
- The City of Santa Ana. “Facts and Figures.” Updated 08/2020. Available online: https://www.santa-ana.org/library/services/facts-and-figures (accessed on 12 December 2020).
- California Health Information Survey. 2018. Available online: https://askchisne.ucla.edu/ask/_layouts/ne/Dashboard.aspx#/ (accessed on 5 October 2021).
- National Health Interview Survey. 2018. Available online: https://www.cdc.gov/asthma/nhis/ (accessed on 5 October 2021).
- The City of Santa Ana. “Environmental Justice Background and Analysis for the General Plan Update”. July 2020. Available online: https://www.santa-ana.org/sites/default/files/pb/general-plan/documents/EJ_%20Backgrnd_Analysis_July2020.pdf (accessed on 12 December 2020).
- U.S. Census Bureau. Hispanic or Latino Origin by Specific Origin American Community Survey 5-Year Estimates. 2016–2020. Available online: https://censusreporter.org (accessed on 8 February 2021).
- South Coast Air Quality Management District. Current AQI. Available online: https://scaqmd-online.maps.arcgis.com/apps/webappviewer/index.html?id=3d51b5d2fc8d42d9af8c04f3c00f88d3 (accessed on 7 April 2021).
- José Rea inspired a community action group that sees local monitoring as the key to cleaner air. Orange County Register. Available online: https://www.ocregister.com/2021/03/28/jose-rea-inspired-a-community-action-group-that-sees-local-monitoring-as-the-key-to-cleaner-air/?fbclid=IwAR0Vc1hAbob1D2U79kXUJqm0OYhR9y3Chj1ONM_CSVDmdhEYDhlV6Fa76S4 (accessed on 9 April 2021).
- Duncan, D.T.; Castro, M.C.; Blossom, J.C.; Bennett, G.G.; Gortmaker, S.L. Evaluation of the positional difference between two common geocoding methods. Geospat. Health 2011, 5, 265–273. [Google Scholar] [CrossRef] [PubMed] [Green Version]
- ArcGIS Pro. Tips for improving geocoding quality—ArcGIS Pro|Documentation. Available online: https://pro.arcgis.com/en/pro-app/latest/help/data/geocoding/tips-for-improving-geocoding-quality.htm (accessed on 4 October 2021).
- Plowman, S.A.; Meredith, M.D. FITNESSGRAM®/ACTIVITYGRAM® Reference Guide (4th Edition). Available online: https://www.cooperinstitute.org/vault/2440/web/files/662.pdf (accessed on 21 April 2021).
- Villa, F.; Castro, A.P.B.M.; Pastorino, A.C.; Santarém, J.M.; Martins, M.A.; Jacob, C.M.A.; Carvalho, C.R. Aerobic capacity and skeletal muscle function in children with asthma. Arch. Dis. Child. 2011, 96, 554–559. [Google Scholar] [CrossRef] [PubMed] [Green Version]
- CDC “Children’s BMI Tool for Schools”. Available online: https://www.cdc.gov/healthyweight/assessing/bmi/childrens_bmi/tool_for_schools.html (accessed on 12 December 2020).
- Furtado, P.R.; Maciel, Á.C.C.; Barbosa, R.R.T.; da Silva, A.A.M.; de Freitas, D.A.; de Mendonça, K.M.P.P. Association between quality of life, severity of asthma, sleep disorders and exercise capacity in children with asthma: A cross-sectional study. Braz. J. Phys. Ther. 2019, 23, 12–18. [Google Scholar] [CrossRef] [PubMed]
- Smarter Balanced Assessment System—Testing (CA Dept of Education). Available online: https://www.cde.ca.gov/ta/tg/sa/ (accessed on 21 April 2021).
- City of Santa Ana. Available online: https://www.santa-ana.org/pb/planning-division/zoning-documents (accessed on 11 November 2020).
- Alwahaibi, A.; Zeka, A. Respiratory and allergic health effects in a young population in proximity of a major industrial park in Oman. J. Epidemiol. Community Health 2015, 70, 174–180. [Google Scholar] [CrossRef] [PubMed] [Green Version]
- Bansal, E.; Placidi, D.; Carver, S.; Renzetti, S.; Giorgino, A.; Cagna, G.; Zoni, S.; Fedrighi, C.; Montemurro, M.; Oppini, M.; et al. Metabolic Outcomes in Southern Italian Preadolescents Residing Near an Industrial Complex: The Role of Residential Location and Socioeconomic Status. Int. J. Environ. Res. Public Health 2019, 16, 2036. [Google Scholar] [CrossRef] [Green Version]
- Zhu, Y.F.; Hinds, W.C.; Kim, S.; Shen, S.; Sioutas, C. Study of ultrafine particles near a major highway with heavy-duty diesel traffic. Atmos. Environ. 2002, 36, 4323–4335. [Google Scholar] [CrossRef]
- Hu, S.S.; Fruin, S.; Kozawa, K.; Mara, S.; Paulson, S.E.; Winer, A.M. A wide area of air pollutant impact downwind of a freeway during pre-sunrise hours. Atmos. Environ. 2009, 43, 2541–2549. [Google Scholar] [CrossRef] [Green Version]
- Shima, M.; Nitta, Y.; Adachi, M. Traffic-related air pollution and respiratory symptoms in children living along trunk roads in Chiba Prefecture, Japan. J. Epidemiol. 2003, 13, 108–119. [Google Scholar] [CrossRef] [Green Version]
- Heindel, J.J.; Blumberg, B. Environmental Obesogens: Mechanisms and Controversies. Annu. Rev. Pharmacol. Toxicol. 2019, 59, 89–106. [Google Scholar] [CrossRef]
- Lu, K.D.; Breysse, P.N.; Diette, G.B.; Curtin-Brosnan, J.; Aloe, C.; D’Ann, L.W.; Peng, R.D.; McCormack, M.C.; Matsui, E.C. Being overweight increases susceptibility to indoor pollutants among urban children with asthma. J. Allergy Clin. Immunol. 2013, 131, 1017. [Google Scholar] [CrossRef] [PubMed] [Green Version]
- Jia, P.; Cao, X.; Yang, H.; Dai, S.; He, P.; Huang, G.; Wu, T.; Wang, Y. Green space access in the neighbourhood and childhood obesity. Obes. Rev. 2021, 22, e13100. [Google Scholar] [CrossRef] [PubMed]
- Sanders, T.; Feng, X.; Fahey, P.P.; Lonsdale, C.; Astell-Burt, T. Greener neighbourhoods, slimmer children Evidence from 4423 participants aged 6 to 13 years in the Longitudinal Study of Australian children. Int. J. Obes. 2015, 39, 1224–1229. [Google Scholar] [CrossRef] [PubMed]
- Huang, Y.-L.; Batterman, S. Residence Location as a Measure of Environmental Exposure: A Review of Air Pollution Epidemiology Studies. J. Expo. Anal. Environ. Epidemiol. 2000, 10, 66–85. [Google Scholar] [CrossRef] [Green Version]
Publisher’s Note: MDPI stays neutral with regard to jurisdictional claims in published maps and institutional affiliations. |
© 2022 by the authors. Licensee MDPI, Basel, Switzerland. This article is an open access article distributed under the terms and conditions of the Creative Commons Attribution (CC BY) license (https://creativecommons.org/licenses/by/4.0/).