Abstract
Wood-polymer composites are increasingly produced through fused deposition modeling (FDM)—an additive manufacturing technique. The versatility of this technology has attracted several industries to print complex shapes and structures. This underscores the importance of studying the mechanical properties of the FDM parts, specifically, their elastic properties. A numerical homogenization methodology is introduced in the present study, focusing on the fundamental aspect of the elastic properties. Investigations were carried out on the influence of various parameters like wood volume fraction, aspect ratio, and internal porosity. The numerical results were validated using analytical models and experimental data. The comparison showed a satisfactory agreement with experimental data, where the relative error did not exceed 10%, leading to a strong conclusion about the validity and effectiveness of the proposed approach.
1. Introduction
In the past few decades, research and engineering interests have been shifting from traditional monolithic materials to fiber-reinforced polymer (FRP) composites [1]. Indeed, FRP composites are one of the new generations of engineered composites that are typically made of fibers embedded in a polymeric matrix. For many years, synthetic fibers have been used as raw materials to produce FRP composites. However, their production requires a significant amount of energy and the use of non-renewable resources [2]. In this context, developing new materials made from renewable resources and biodegradable materials is a major scientific challenge.
Recently, natural fibers such as flax, wood, and bamboo fibers have attracted significant interest for use as reinforcement in polymer composites [3]. This interest is mainly due to their biodegradability, high-performance profile, lightweight, and low cost. But despite their many benefits, one of the drawbacks that limit their use is the difficulty of manufacturing them. Accordingly, research has focused on developing processing technology, and additive manufacturing, which is becoming increasingly popular, could solve this problem.
Additive manufacturing, otherwise known as 3D printing, makes three-dimensional objects from computer-aided design (CAD) software [4]. Unlike subtractive manufacturing, the generation of the 3D object is achieved using additive processes, where the object is created by laying down successive layers of material until the entire object is printed. As a result, 3D printing produces complex shapes faster than ever before and with less material [5]. Fused deposition modeling (FDM) is one of the widely used 3D printing techniques due to its simplicity, reliability, affordability, and material availability. The most well-known FDM materials are thermoplastics like acrylonitrile-butadiene-styrene (ABS), polylactic acid (PLA), and polypropylene (PP) [6].
FDM shows great potential in printing natural fiber-reinforced polymer (NFRP) composites, making them more attractive than other materials. For example, the major automotive companies have used them in door panels, seat backs, and door trim [7]. The biomedical [8], furniture [9], packaging [10], and naval industries [11] are also beginning to incorporate these materials into their products. However, before using FDM products in equipment, it is necessary to know their mechanical properties. The prediction of these properties and how various factors can affect them, including fiber/matrix weight percentage, fiber shape, and fiber orientation, is a serious challenge to using such products in applications where durability and reliability are crucial.
For this purpose, many studies have been performed on the mechanical properties of 3D-printed NFRP composites, especially on their tensile properties. Estakhrianhaghighi et al. [12] found that the printed parts with 2.5 wt% wood-fiber experienced an increase in tensile strength that was 9% higher than the pure PLA. Tarrés et al. [13] developed a thermomechanical pulp (TMP) fiber/bio-polyethylene composite using FDM and found that the TMP fibers facilitated the 3D printing and correspondingly enhanced the tensile strength of the composite. Kariz et al. [14] reported that adding beech wood particles to the PLA matrix increased the number of pores, which decreased the tensile strength. Other mechanical properties have also been studied in previous research. For example, Badouard et al. [15] reported that incorporating short flax fibers into the PLA matrix typically reduced the flexural strength, because the void content in the composite increased with the addition of fibers. However, short natural fibers showed good performance in some respects, such as the storage modulus and thermal properties [16,17]. Continuous fibers were also employed in the FDM process for fabricating high-strength parts. For instance, Depuydt et al. [18] found that samples reinforced with continuous bamboo fibers exhibited the best performance of the parts they printed, with an increase in stiffness of 215%, whereas the use of dust-like fractions showed very small improvements. Duigou et al. [19] investigated the effect of fiber orientation, and demonstrated that all samples containing flax fibers oriented along the x-axis, exhibited much better longitudinal properties than those found with discontinuous natural fiber printed composites while their weakest point was their transverse properties. Similarly, Naik et al. [20] demonstrated that specimens with a unidirectional 0° fiber angle had the highest impact strength, while those with a unidirectional 90° fiber angle had the lowest impact strength. Other authors focused on additional properties, including compression [21], fatigue [22], and fiber pull-out properties [23].
Unfortunately, the analysis of the mechanical behavior of 3D-printed NFRP composites is most often done using experimental tests, and these tests are often very numerous and expensive. One way to get around this problem is to use modeling and simulation tools. Micromechanical homogenization has proven to be an efficient way for the mechanical modeling of composite structures, and this makes it possible to predict the properties of composite materials from the known properties of their constituents. The first work to implement the homogenization techniques in the area of mechanical modeling of 3D-printed FRP composites was conducted by Van der Klift et al. [24]. Naranjo-Lozada et al. [25] and Chabaud et al. [26] followed the same path. Polyzos et al. [27] proposed a multi-scale analytic homogenization model to approximate the structure’s effective properties. More recently, Ezzaraa et al. [28] predicted the effects of microstructural properties on the mechanical behavior of 3D-printed wood-PLA composite using analytical homogenization. However, all these models are analytical and do not take into account the real geometry of the microstructures. In contrast, numerical homogenization simulated the properties of any type of composite more accurately and is a reliable method for studying heterogeneous materials [29].
Numerical modeling of 3D-printed NFRP composites is still in its infancy, underscoring the need for more research. In this context, Polyzos et al. [30] developed a numerical multi-scale approach to determine the elastic properties of 3D-printed materials with continuous fibers. The results obtained with ABAQUS software were compared to analytical models and experimental data, and a good correlation was found. Dutra et al. [31] studied the tensile and compression properties of such composites using the asymptotic homogenization technique. They observed that the uncertainty in the Young’s modulus of the nylon matrix prevented accurate prediction and suggested the use of modulus values greater than 3 GPa for better prediction. Zhang et al. [32] carried out an FEA to generate the direction of the principal stress for a 3D-printed composite reinforced with curved and unidirectional fibers. They demonstrated that the placement of curved fibers followed the principal stress direction, thus improving the mechanical properties of the composite parts. Somireddy et al. [33] conducted a numerical analysis of the mesostructure of the FDM-printed part to find out the strain energy and then the effective elastic properties. The calculated properties were employed as an input into the classical laminate theory, which helped to estimate the effective properties of the whole laminate structure. Tian et al. [34] employed the representative volume element (RVE) model to predict the mechanical behavior of a 3D-printed composite of a metal-bonded diamond wheel application. Wang et al. [35] conducted a study using the averaging technique to predict the fiber orientation of short fiber reinforced composite. However, the study focused only on numerical modeling without validating the results through experimental tests or other methods.
Very few studies have investigated the microscopic internal pores of FDM parts. For example, Hou et al. [36] carried out a FEA simulation in ABAQUS to investigate the relationship between fiber content and void content using micromechanical models. They found that the void content increased with the increase in the fiber volume fraction, which seriously affected the stiffness and strength properties of the parts. Cuan-Urquizo et al. [37] used FEA, rule of mixtures, and experimental data to study the effective properties of the printed part with the presence of voids. They showed that the errors between micromechanics and simulations were negligible (less than 10%). Park and Rosen [38] quantified the effects of the FDM process on the Young’s modulus of unreinforced lattice structures. They concluded that the models are more accurate when considering internal voids.
Based on the above literature review, a limited amount of relevant work has been reported on the microstructure effects of 3D-printed NFRP composites. The complex geometries, the significant porosity level, and inadequate information about the constituent’s properties are three basic limits that delay understanding of FDM parts’ mechanical behavior. The present manuscript, thus, was developed in this context to address the fundamental difficulties and present practical means of evaluating the elastic properties of 3D-printed wood-PLA composite. Numerical homogenization is implemented to study the effects of microstructure-like fiber content, fiber shape, and internal porosity. The RVE concept is incorporated to accurately and effectively represent the model geometry.
2. Materials and Methods
The specimens used in this study were produced with filaments of different wood content with a diameter of 0.237 mm and one commercial filament made of pure PLA (PrimaValue®) [14]. In the filament fabrication process, the wood particles were first obtained from beech wood (Fagus sylvatica L.) through milling and sieving [39]. The matrix was PLA Ingeo 2003D (NatureWorks, Blair, NE, USA) in granulated form. Secondly, the wood particles and granules were dried to less than 1% moisture content in a laboratory dryer before preparing the mixtures. Finally, they were compounded, pelletized, and then extruded using a single-screw filament Noztek-pro extruder (Noztek, Shoreham, UK) to produce the filament [14]. The filament thickness varied between 1.45 mm and 1.75 mm, but it was fixed at 1.75 mm.
The wood-PLA composite filaments were printed as test samples with a Zortrax M200 3D printer (Zortrax, Poland). The printer was based on the FDM technology, and it had a nozzle with a 0.4 mm diameter and a temperature of 230 °C. The FDM printer had three main parts: an extrusion nozzle, a pulling system, and a build platform. Figure 1 presents a schematic of the FDM system layout and the working principle. The process begins with unwinding the filament and supplying it to the extrusion nozzle through the pulling system. The nozzle melts the filament and extrudes it on the build platform. The nozzle and the build platform are guided by motors, following a predetermined path defined by the CAD file. The extrusion nozzle places the first layer on the platform before it is vertically moved in preparation for the next layer. The cycle is repeated until the entire object is printed.
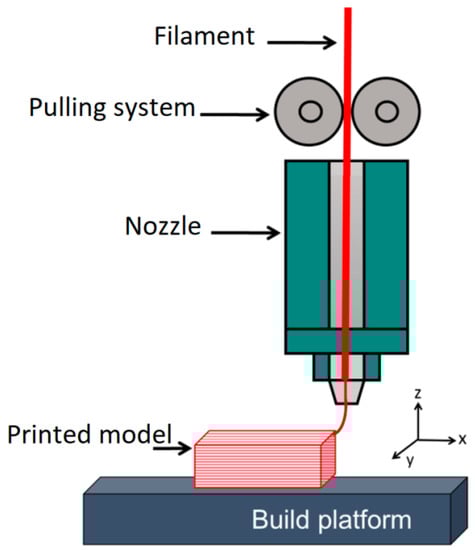
Figure 1.
Schematic representation of the FDM process [40].
The tensile strength of the specimens was performed on a universal testing machine (Zwick-Roel Z005). The speed during the test was 10 mm/min. The elastic modulus was determined from the slope of the line fitted to the region of the stress–strain curve where stress was proportional to strain (measured by an extensometer mounted to the sample). Five specimens were prepared from each wood content (10%, 20%, 30%, 40%, and 50%) and the mean values were calculated to obtain the tensile modulus.
3. Numerical Homogenization-Based Finite Element Analysis
3.1. Basic Procedure
The grand challenge in homogenization involves identifying the relationships that bridge the micro-scale to the macro-scale. Homogenization methods typically aim to use an equivalent homogeneous material (EHM) (called effective material) at the macroscopic level to describe the behavior of the composite material at the microscopic level. The properties of the EHM are extracted from the geometric and physical details of the microstructure. The relations between the physical quantities of the two scales make it possible to predict the effective properties of the composite material. In practice, these relations are established on a representative volume element (RVE) equivalent to EHM from a mechanical point of view. This means that their overall responses are the same for any mechanical load.
The RVE can be defined as a volume that is sufficiently large to be statistically representative of the composite and sufficiently small to effectively include all the microstructural heterogeneities that occur in the composite [41]. Assuming the existence of such a volume, the effective behavior of the composite material is defined as the relations between the averaged micro-fields. Figure 2 illustrates the homogenization process. Let us now look at each step of the numerical homogenization technique in some detail.
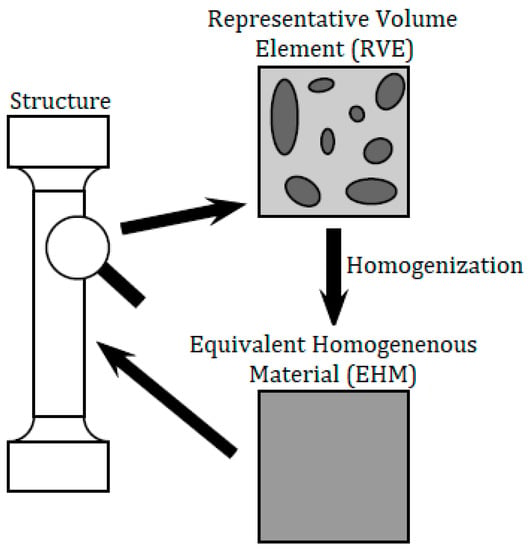
Figure 2.
Illustration of the homogenization technique.
3.1.1. Representative Volume Element
The printed part can be considered as a periodic array of RVEs. Thus, modeling one RVE rather than the entire part is sufficient for the finite element analysis (FEA). Furthermore, FEA is even more suitable when a periodic microstructure is assumed, leading to an important reduction in computational costs. The RVE is modeled as a continuum cube with 100% infill density, which means that no separation between the deposited filaments is assumed. Thus, the effect of build orientation on the elastic properties of the printed parts as well as the effect of raster angle is not taken into consideration.
For the automatic generation of the RVE, a random sequential adsorption algorithm (RSA) [42] was used. The algorithm is based on adding particles one after the other by checking that each new particle does not intersect with the already accepted particles. If an intersection is found, the generated particle is then rejected and a new particle is generated. Again, this particle is tested for its possible intersection with the others until the desired volume fraction is reached. The volume fraction of the spherical particles in the RVE can be obtained from Equation (1):
where n, r, and L are the number of particles, the particles’ radius, and the cube’s side length, respectively. In order to maintain the periodicity of the microstructure in the RVE, special care should be taken for particles that cut the faces of the cube. The common solution is to split the corresponding particles into an appropriate number of parts and copy the divided parts to the opposite sides of the cube. The number of parts that need to be split can be obtained via the following expression:
where k is the number of faces intersected by the particle, and g is the number of particles that need to be added. In order to achieve better results, an adequate finite element discretization needs to be performed where three conditions must be met. The first is that the distance between the center of the ith particle and all the previous accepted particles must exceed a minimum value (2.07r). Secondly, if the ith particle cuts any of the RVE faces, the distances between the corresponding particle and the particles near the opposite face need to be verified (0.1r), because the microstructure of the RVE is periodic. Finally, the particle should not be very close to the RVE faces to prevent the presence of distorted finite elements during meshing.
After using all the model strategies described above, an example of the RVE with spherical particles is illustrated in a transparent sketch in Figure 3a.
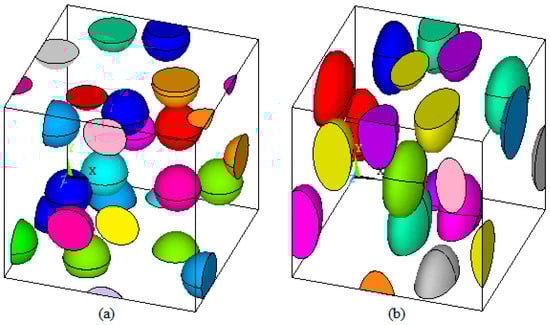
Figure 3.
Example of RVE models for different types of particles: (a) sphere, (b) ellipsoid.
3.1.2. Boundary Conditions
Applying adequate boundary conditions on periodic RVE is one of the biggest problems in the FEA. Several boundary conditions might apply, which also influence the prediction of effective properties, and the commonly used ones are the minimal kinematic boundary condition, periodic boundary condition, and linear displacement boundary condition [43]. Periodic boundary conditions are widely favored [44], and are adopted in this work. These assume that each RVE in the composite has the same deformation mode and there is no overlap or separation between adjacent RVEs. The displacement field on the boundary of the RVE (∂V) can be expressed as:
where u(x) denotes the displacement field, is the applied strain, and is the periodic part of the displacement components on the boundary surfaces and is dependent on the applied strain. Unfortunately, the displacement field in the form of Equation (3) cannot be directly applied to the boundaries, since the term is generally unknown. For any RVEs, its boundary surfaces must always appear in parallel pairs (Figure 4). The displacements on a pair of parallel opposite surfaces can be written as:
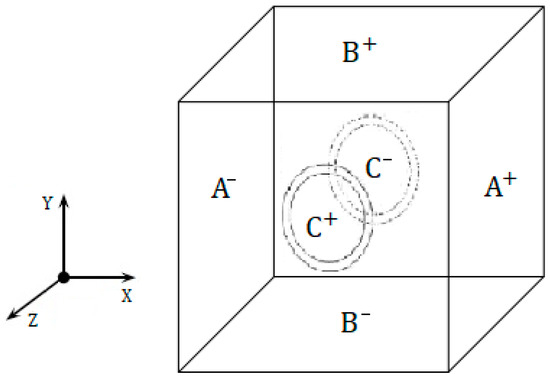
Figure 4.
Notation of the RVE surfaces.
Note that k+ and k− identify the kth pair of two parallel opposite surfaces of the RVE. Due to the periodicity, the term is the same at the two surfaces. Therefore, the difference between the above two equations gives:
As the term is constant for each pair of two opposite surfaces, it is easier to apply this equation in the finite element procedure instead of applying Equation (3).
The applied strain on the boundary using Equation (6) results in a complex state of strain inside the RVE. However, the volume average of the strain in the RVE equals the applied strain, i.e.,
Note that ⟨.⟩ indicates a volume average, while the superscript indicates an applied strain. Moreover, V denotes the volume of the RVE. For homogeneous and elastic composite materials, the relationship between average stress and strain is given by:
are the components of the effective stiffness tensor where they are determined by choosing a unit value of the applied strain and then calculating the stress field , whose average gives the required components of the tensor as:
The integral (9) is calculated over each finite element using the Gauss–Legendre quadrature. ANSYS simulation software can compute the average stress and volume, element by element, and, to enable ANSYS to find the average stress, the element table features are used. First, the element volume and stress must be added to the table. Then, a new quantity is created by multiplying the element volume with the corresponding stress values. This quantity is then summed over the elements in the mesh and divided by the total volume of the elements to provide the average stress.
The constitutive relation given in Equation (9) can also be expressed in matrix form as described in Equation (10).
The components of the effective stiffness tensor are obtained by the assumed symmetry. Since the particles are distributed randomly, the RVE will result in isotropic properties, where only two independent constants are needed to describe its elastic behavior: the effective Young’s modulus and the effective Poisson’s ratio. Consequently, Equation (10) will have the following form:
The relations between the effective elastic modulus and stiffness constants can be written as:
3.1.3. Finite Element Simulation
All the finite element calculations were done using ANSYS within the frame of the small displacements theory. The program was written in APDL (ANSYS Programming Design Language), which was carried out by the software and made the handling much easier. For simplification, the contact between wood particles and the PLA matrix was assumed to be perfect. Moreover, both of them were isotropic and followed a linear elastic behavior. Their elastic properties are listed in Table 1. Three-dimensional structural solid element SOLID186 was used to determine the effective properties. The element was defined by 20 nodes with three degrees of freedom per node: translations in the nodal x, y, and z directions.

Table 1.
Elastic properties of wood [39] and PLA [14].
All the RVEs are meshed with a free mesh through tetrahedral elements because of the difficulty in applying a structured mesh on random microstructures. The maximum element and node number used to mesh each model was approximately 65,000 elements and 105,000 nodes. For example, a meshed RVE with 22 particles is shown in Figure 5, where the number of elements and nodes used were 55,985 and 81,883, respectively. Moreover, to apply periodic boundary conditions, the opposite surfaces of the RVE must have the same mesh. Therefore, three surfaces were first meshed after the mesh configurations were copied to the opposite surfaces. Then, the final mesh was created based on the pre-meshed surfaces.
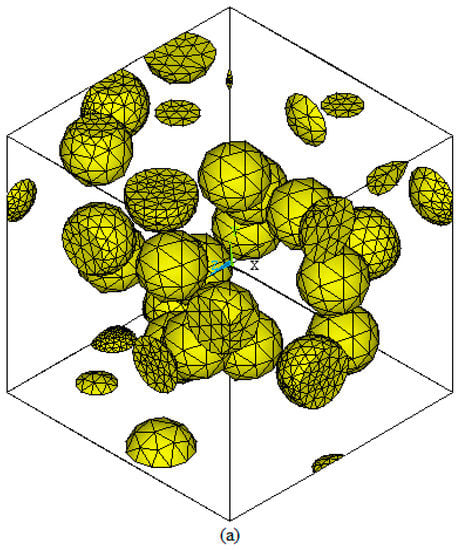
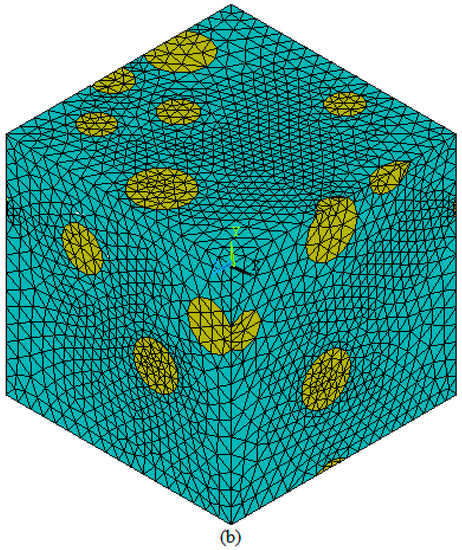
Figure 5.
(a) Meshed particles only. (b) Meshed RVE.
4. Results and Discussion
4.1. Effect of RVE Size
One of the most important aspects in implementing a finite element program is defining the RVE size. Fixing this characteristic is not easy, since the volume must be smaller than the minimum size required to ensure accurate results. Numerical homogenization can help in finding the critical size of the RVE. Figure 6 shows the evolution of the effective Young’s modulus of the RVE as a function of its size. The results were obtained at 30% of wood content. The legend “ERROR” represented with vertical bars indicates the relative error between the predicted Young’s modulus and the mean value of Young’s modulus of the different RVE side lengths. It was found that when the error was around 4.7%, but by increasing the side length the error dropped significantly and the predicted results converged satisfactorily. For example, for the error was 1.6%. From these results, it could be concluded that it was sufficient to use the side length of the RVE as .
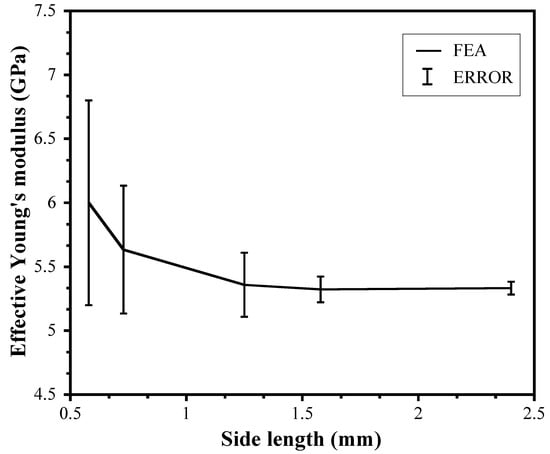
Figure 6.
Variation of the effective Young’s modulus with change in RVE side length.
4.2. Effect of Random Particle Distribution
To investigate the effect of particle distribution on the effective elastic properties, four RVEs with different particle distributions were simulated and generated for each wood volume fraction (5%, 15%, and 25%). The predicted elastic modulus of four RVEs corresponding to different particle volume fractions are shown in Figure 7. It can be seen that the random distribution of particles has no obvious influence on the elastic properties, where a little scatter was observed. Indeed, the maximum deviation between the four RVEs was found to be 1%, 0.54%, and 1.57% for 5%, 15%, and 25% of the wood volume fraction, respectively.
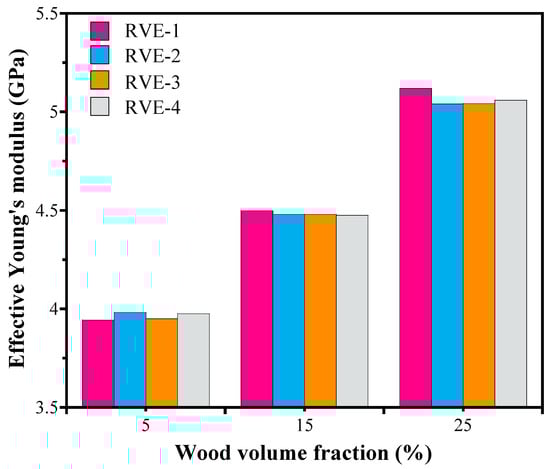
Figure 7.
Variation of the effective Young’s modulus of four RVEs corresponding to different wood volume fraction (5%, 15%, and 25%).
4.3. Effect of Wood Volume Fraction
The effective Young’s modulus was evaluated for different wood volume fractions ranging from 10% up to 30%. To guarantee the validity of our numerical model, a comparison with various analytical models—the dilute model (DIL), self-consistent model (SC), differential model (DF), Mori-Tanaka model (MT), Hashin–Shtrikman upper bound (HS+), Hashin–Shtrikman lower bound (HS−) and Voigt and Reuss bounds—was carried out. Readers interested in a complete demonstration of the analytical models might refer to [28]. As seen in Figure 8a, the addition of wood particles in the PLA matrix engendered an increase in the equivalent Young’s modulus, which led to improved mechanical properties of the 3D samples. This was expected since the elastic modulus of wood (14.31 GPa) was higher than the commercial PLA (3.72 GPa). Thus, the addition of wood should increase the elastic modulus of the samples. For example, when the wood content increased from 5% to 30% the Young’s modulus was enhanced by 35% using the FEA. In addition, the results showed a good agreement among the calculations of the various analytic models and FEA for a small volume fraction (). As the volume fraction increases, however, the results deviate from each other, where the relative error between the Young’s modulus was predicted by the DIL, SC, DIF, MT models, and the FEA was 5.04%, 3.38%, 1.63%, and 0.19%, respectively. Therefore, the MT model and FEA give quite similar results. Finally, all calculations are performed with volume fractions up to 30%. Indeed, the RSA algorithm was valid with volume fractions less than or equal to 32%; beyond this ratio it was impossible to perfectly allocate all the particles in the RVE model. Figure 8b has been plotted for greater clarity.
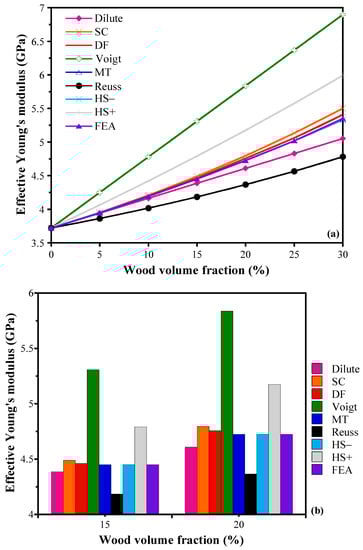
Figure 8.
Comparison of analytic micromechanical models and FEA—(a) effective Young’s modulus, (b) bar graph with effective Young’s modulus for 15% and 20% of wood volume fraction.
4.4. Effect of Wood Shape
The reinforcement shape is another essential parameter for the final properties of the 3D-printed composite. Typical particle shapes range from thin needle-shaped to penny-shaped. A property known as the aspect ratio is essential for describing reinforcements, where it is defined as the ratio of the largest to the smallest dimension. Figure 9 illustrates an ellipsoidal particle of dimension ( whose aspect ratio μ is given by:
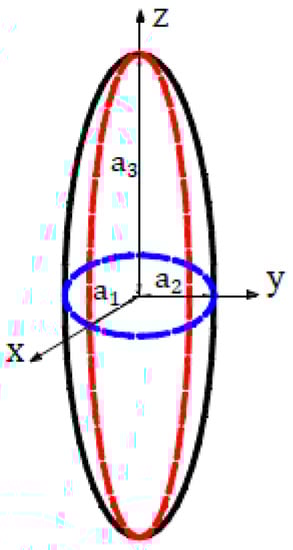
Figure 9.
Schematic illustration of an ellipsoidal particle.
The elastic properties were calculated as a function of the wood volume fraction and for different aspect ratios ranging from 0.2 to 10. The particles were considered aligned parallel to each other and to the y-z plane (Figure 3b). The main results are shown in Figure 10.
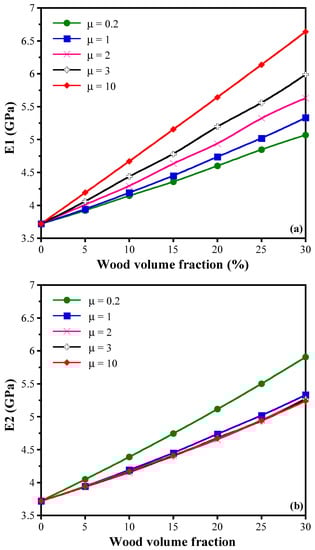
Figure 10.
Variation of the effective Young’s modulus with change in aspect ratio—(a) longitudinal modulus, (b) transversal modulus.
It was found that the composite material was transversally isotropic in the case of ellipsoidal particles and isotropic in the case of spherical particles. For clarity, the effective stiffness tensors computed with 20% wood content and for three shapes are presented by Equations (15)–(17). Additionally, it is noted that the increase in the particles’ aspect ratio engendered an increase in the longitudinal Young’s modulus (along the x-axis), while a decrease in the transverse Young’s modulus (along the y and z-axis) was determined. Indeed, for 30 wt% of wood content, varied by 30.98% when the aspect ratio increased from 0.2 to 10. Therefore, these results highlighted the importance of the reinforcement shape on the macroscopic behavior of the 3D-printed WPC.
- Case of elongated particles ():
- Case of spherical particles ():
- Case of needle-shaped particles ():
4.5. Effect of Porosity
Porosity is a common issue encountered in FDM composites, especially in fiber-reinforced polymer composites. Generally, the term porosity refers to the voids caused by the fabrication process, giving rise to a potential reduction in the mechanical properties of the final product. The voids’ size, shape, and spatial distribution are three key characteristics of porosity in a part. In this section, the effects of the pore size and rate on the elastic properties of the FDM specimens were investigated. The obtained results were compared with those in an experimental research paper [14].
The experimental study shows that the 3D-printed part created from pure PLA had no voids. But by adding wood content, the samples became more porous and had visible clusters of wood particles, which decreased the composite’s elastic modulus and tensile strength. The digital camera and microscope were employed to capture images of the edges of 3D-printed parts and filaments (Figure 11). The pores are presented by dark spots and are formed during the printing process. Indeed, with higher wood content in the filaments, nozzle clogging occurs, leading to uneven material flow and poorly printed parts. There were also slight differences in the filament diameter, which changed the amount of material extruded into the printed parts.
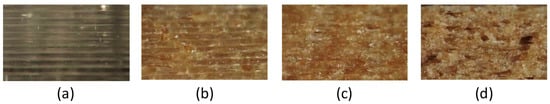
Figure 11.
Appearance of the 3D printed part at 40x magnification and with wood content: (a) 0%, (b) 10%, (c) 20%, and (d) 30% [14].
In order to examine the pore size and rate, predefined upper and lower pore diameter limits were set. Indeed, not all the pores were the same: there were big and little pores. Two pore diameter ranges were examined: the full range (from 0.09 to 0.43 mm) and the small range (below 0.2 mm). All the pores had spherical morphologies and were uniformly and randomly positioned inside the composite. An example of an RVE with 15 particles and 10 pores in the full range is shown in Figure 12a. Their distribution can also be observed in the transparent sketch in Figure 12b.
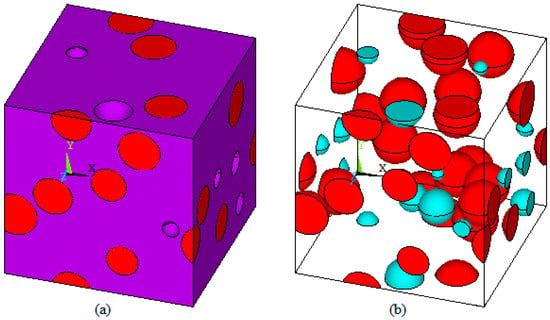
Figure 12.
Example of random dispersion of wood (red particles) and voids (blue pores) inside the RVE—(a) solid model, (b) transparent model.
For different wood volume fractions, the main results of Young’s modulus are given in Table 2 using the pore diameters in the full and small ranges. It was observed that the estimated Young’s modulus using pore diameters in the small range was slightly higher than the ones using the full range. In fact, the maximum relative difference between them was 2.19% for 7 wt% of porosity and 20 wt% of wood content. Furthermore, the results showed that the predicted Young’s modulus had a significant variation with changes in porosity and decreases with the increase of porosity. For example, it decreased by 9.37% when the porosity increased from 2 wt% to 7 wt% for 10 wt% of wood content. Finally, the FEA results had a good agreement with the experimental data in predicting the elastic modulus of the 3D-printed parts, where the relative error did not exceed 10%.
Table 2.
Predicted Young’s modulus for the two-pore diameter ranges.
5. Conclusions
A numerical homogenization technique based on FEA was investigated to predict the elastic properties of 3D-printed wood-PLA composites, aiming to establish the basis of comprehensive numerical modeling of 3D-printed structures. Based on the results, this study proposes an efficient and practical tool to deal numerically with the effects of microstructure and the internal porosity, which were the major challenges in simulating the 3D-printed composite.
It was concluded that the elastic properties of the composite depended mainly on the wood volume fraction, where the Young’s modulus was enhanced by adding wood particles. A comparison between the FEA results and the analytic results revealed that our predictions were almost equivalent to those of the Mori–Tanaka model, suggesting that numerical homogenization could be used as an alternative to analytical models. In addition, it was found that the particle shape significantly influenced the anisotropy of the composite, where an increase in aspect ratio engendered an increase in the longitudinal Young’s modulus and a decrease in the transverse Young’s modulus. Finally, it was found that the porosity rate negatively impacted the elastic properties, whereas the pore size had a slight effect on them. Moreover, good agreement was achieved between the numerical results and experimental data, where the relative error did not exceed 10%.
To conclude, the numerical homogenization technique effectively examines the overall responses of a composite material manufactured through FDM. This kind of strategy could be beneficial in various industries because it allows the prediction of the elastic behavior of a given part without causing any harm to it, and, thus, the application of composites fabricated with FDM can extend to structural applications.
Author Contributions
Conceptualization, N.A. and S.B.; methodology, N.A., I.E. and S.B.; software, I.E.; validation, S.B., N.A. and I.E.; investigation, S.B. and I.E.; resources, N.A. and M.K.K.; writing—original draft preparation, I.E. and M.A.; writing—review and editing, N.A., M.K.K., M.L. and I.A.; visualization, J.B., A.B.; supervision, S.B., M.L., A.B. and J.B. All authors have read and agreed to the published version of the manuscript.
Funding
This study was supported by STSM COST FP1407 and Slovenian Research Agency for financial support within the P4-0015 program.
Data Availability Statement
The data included in this study are available upon request from the corresponding author.
Acknowledgments
The authors would like to thank Mirko Kariz for preparing the test samples.
Conflicts of Interest
No potential conflict of interest was reported by the authors.
References
- Lau, A.K.-T.; Cheung, K.H.Y. 1-Natural fiber-reinforced polymer-based composites. In Natural Fiber-Reinforced Biodegradable and Bioresorbable Polymer Composites; Woodhead Publishing: Sawston, UK, 2017; pp. 1–18. [Google Scholar] [CrossRef]
- Muthu, S.S. 1-Introduction to sustainability and the textile supply chain and its environmental impact. In Assessing the Environmental Impact of Textiles and the Clothing Supply Chain, 2nd ed.; Woodhead Publishing: Sawston, UK, 2020; pp. 1–32. [Google Scholar] [CrossRef]
- Sahayaraj, A.F.; Muthukrishnan, M.; Ramesh, M. Experimental investigation on physical, mechanical, and thermal properties of jute and hemp fibers reinforced hybrid polylactic acid composites. Polym. Compos. 2022, 43, 2854–2863. [Google Scholar] [CrossRef]
- Kern, J. Additive Manufacturing. In The Digital Transformation of Logistics; Wiley-Blackwell: New York, NY, USA, 2021; pp. 41–60. [Google Scholar] [CrossRef]
- Abouelmajd, M.; Bahlaoui, A.; Arroub, I.; Zemzami, M.; Hmina, N.; Lagache, M.; Belhouideg, S. Experimental analysis and optimization of mechanical properties of FDM-processed polylactic acid using Taguchi design of experiment. Int. J. Simul. Multidiscip. Des. Optim. 2021, 12, 30. [Google Scholar] [CrossRef]
- Wang, X.; Jiang, M.; Zhou, Z.W.; Gou, J.H.; Hui, D. 3D printing of polymer matrix composites: A review and prospective. Compos. Part B Eng. 2017, 110, 442–458. [Google Scholar] [CrossRef]
- Velu, R.; Raspall, F.; Singamneni, S. Chapter 8-3D printing technologies and composite materials for structural applications. In Green Composites for Automotive Applications; Woodhead Publishing: Sawston, UK, 2019; pp. 171–196. [Google Scholar] [CrossRef]
- Calì, M.; Pascoletti, G.; Gaeta, M.; Milazzo, G.; Ambu, R. A New Generation of Bio-Composite Thermoplastic Filaments for a More Sustainable Design of Parts Manufactured by FDM. Appl. Sci. 2020, 10, 5852. [Google Scholar] [CrossRef]
- Pringle, A.M.; Rudnicki, M.; Pearce, J.M. Wood Furniture Waste-Based Recycled 3-D Printing Filament. For. Prod. J. 2017, 68, 86–95. [Google Scholar] [CrossRef]
- Sharma, V.; Roozbahani, H.; Alizadeh, M.; Handroos, H. 3D Printing of Plant-Derived Compounds and a Proposed Nozzle Design for the More Effective 3D FDM Printing. IEEE Access 2021, 9, 57107–57119. [Google Scholar] [CrossRef]
- Gardner, D.; Anderson, J.; Tekinalp, H.; Ozcan, S.; Sauerbier, P. Lignocellulosic-filled polymer feedstocks for large scale additive manufacturing of low cost composites. In Proceedings of the Internaional Forest Products Congress, Trabzon, Turkey, 26–29 September 2018; pp. 26–29. [Google Scholar]
- Estakhrianhaghighi, E.; Mirabolghasemi, A.; Zhang, Y.; Lessard, L.; Akbarzadeh, A. 3D-Printed Wood-Fiber Reinforced Architected Cellular Composites. Adv. Eng. Mater. 2020, 22, 2000565. [Google Scholar] [CrossRef]
- Tarrés, Q.; Melbø, J.; Delgado-Aguilar, M.; Espinach, F.; Mutjé, P.; Chinga-Carrasco, G. Bio-polyethylene reinforced with thermomechanical pulp fibers: Mechanical and micromechanical characterization and its application in 3D-printing by fused deposition modelling. Compos. Part B Eng. 2018, 153, 70–77. [Google Scholar] [CrossRef]
- Kariz, M.; Sernek, M.; Obućina, M.; Kuzman, M.K. Effect of wood content in FDM filament on properties of 3D printed parts. Mater. Today Commun. 2018, 14, 135–140. [Google Scholar] [CrossRef]
- Badouard, C.; Traon, F.; Denoual, C.; Mayer-Laigle, C.; Paës, G.; Bourmaud, A. Exploring mechanical properties of fully compostable flax reinforced composite filaments for 3D printing applications. Ind. Crop. Prod. 2019, 135, 246–250. [Google Scholar] [CrossRef]
- Coppola, B.; Garofalo, E.; Di Maio, L.; Scarfato, P.; Incarnato, L. Investigation on the use of PLA/hemp composites for the fused deposition modelling (FDM) 3D printing. AIP Conf. Proc. 2018, 1981, 020086. [Google Scholar] [CrossRef]
- Wang, C.; Smith, L.M.; Zhang, W.; Li, M.; Wang, G.; Shi, S.Q.; Cheng, H.; Zhang, S. Reinforcement of Polylactic Acid for Fused Deposition Modeling Process with Nano Particles Treated Bamboo Powder. Polymers 2019, 11, 1146. [Google Scholar] [CrossRef] [PubMed]
- Depuydt, D.; Balthazar, M.; Hendrickx, K.; Six, W.; Ferraris, E.; Desplentere, F.; Ivens, J.; Van Vuure, A.W. Production and characterization of bamboo and flax fiber reinforced polylactic acid filaments for fused deposition modeling (FDM). Polym. Compos. 2018, 40, 1951–1963. [Google Scholar] [CrossRef]
- Le Duigou, A.; Barbé, A.; Guillou, E.; Castro, M. 3D printing of continuous flax fibre reinforced biocomposites for structural applications. Mater. Des. 2019, 180, 107884. [Google Scholar] [CrossRef]
- Naik, M.; Thakur, D.; Chandel, S.; Salunkhe, S. Experimental investigations on thermal, flame retardant, and impact properties of additively manufactured continuous FRPC. Polym. Compos. 2022, 43, 2941–2951. [Google Scholar] [CrossRef]
- Singh, R.; Kumar, R.; Singh, M.; Preet, P. On compressive and morphological features of 3D printed almond skin powder reinforced PLA matrix. Mater. Res. Express 2019, 7, 025311. [Google Scholar] [CrossRef]
- Travieso-Rodriguez, J.A.; Zandi, M.D.; Jerez-Mesa, R.; Lluma-Fuentes, J. Fatigue behavior of PLA-wood composite manufactured by fused filament fabrication. J. Mater. Res. Technol. 2020, 9, 8507–8516. [Google Scholar] [CrossRef]
- Kumar, S.; Singh, R.; Singh, T.P.; Batish, A. On flexural and pull out properties of 3D printed PLA based hybrid composite matrix. Mater. Res. Express 2020, 7, 015330. [Google Scholar] [CrossRef]
- Van Der Klift, F.; Koga, Y.; Todoroki, A.; Ueda, M.; Hirano, Y.; Matsuzaki, R. 3D Printing of Continuous Carbon Fibre Reinforced Thermo-Plastic (CFRTP) Tensile Test Specimens. Open J. Compos. Mater. 2016, 06, 18–27. [Google Scholar] [CrossRef]
- Naranjo-Lozada, J.; Ahuett-Garza, H.; Orta-Castañón, P.; Verbeeten, W.M.; Sáiz-González, D. Tensile properties and failure behavior of chopped and continuous carbon fiber composites produced by additive manufacturing. Addit. Manuf. 2019, 26, 227–241. [Google Scholar] [CrossRef]
- Chabaud, G.; Castro, M.; Denoual, C.; Le Duigou, A. Hygromechanical properties of 3D printed continuous carbon and glass fibre reinforced polyamide composite for outdoor structural applications. Addit. Manuf. 2019, 26, 94–105. [Google Scholar] [CrossRef]
- Polyzos, E.; Katalagarianakis, A.; Van Hemelrijck, D.; Pyl, L. A multi-scale analytical methodology for the prediction of mechanical properties of 3D-printed materials with continuous fibres. Addit. Manuf. 2020, 36, 101394. [Google Scholar] [CrossRef]
- Ezzaraa, I.; Ayrilmis, N.; Kuzman, M.K.; Belhouideg, S.; Bengourram, J. Micromechanical models for predicting the mechanical properties of 3D-printed wood/PLA composite materials: A comparison with experimental data. Mech. Adv. Mater. Struct. 2021, 1–13. [Google Scholar] [CrossRef]
- Zhou, X.-Y.; Gosling, P.; Pearce, C.; Ullah, Z.; Kaczmarczyk, L. Perturbation-based stochastic multi-scale computational homogenization method for woven textile composites. Int. J. Solids Struct. 2016, 80, 368–380. [Google Scholar] [CrossRef]
- Polyzos, E.; Van Hemelrijck, D.; Pyl, L. Numerical modelling of the elastic properties of 3D-printed specimens of thermoplastic matrix reinforced with continuous fibres. Compos. Part B Eng. 2021, 211, 108671. [Google Scholar] [CrossRef]
- Dutra, T.A.; Ferreira, R.T.L.; Resende, H.B.; Guimarães, A. Mechanical characterization and asymptotic homogenization of 3D-printed continuous carbon fiber-reinforced thermoplastic. J. Braz. Soc. Mech. Sci. Eng. 2019, 41, 1–15. [Google Scholar] [CrossRef]
- Zhang, H.; Yang, D.; Sheng, Y. Performance-driven 3D printing of continuous curved carbon fibre reinforced polymer composites: A preliminary numerical study. Compos. Part B Eng. 2018, 151, 256–264. [Google Scholar] [CrossRef]
- Somireddy, M.; Czekanski, A. Mechanical Characterization of Additively Manufactured Parts by FE Modeling of Mesostructure. J. Manuf. Mater. Process. 2017, 1, 18. [Google Scholar] [CrossRef]
- Tian, C.; Li, X.; Chen, Z.; Guo, G.; Wang, L.; Rong, Y. Study on formability, mechanical property and finite element modeling of 3D-printed composite for metal-bonded diamond grinding wheel application. J. Manuf. Process. 2020, 54, 38–47. [Google Scholar] [CrossRef]
- Wang, Z.; Smith, D.E. Rheology Effects on Predicted Fiber Orientation and Elastic Properties in Large Scale Polymer Composite Additive Manufacturing. J. Compos. Sci. 2018, 2, 10. [Google Scholar] [CrossRef]
- Hou, Z.; Tian, X.; Zheng, Z.; Zhang, J.; Zhe, L.; Li, D.; Malakhov, A.V.; Polilov, A.N. A constitutive model for 3D printed continuous fiber reinforced composite structures with variable fiber content. Compos. Part B Eng. 2020, 189, 107893. [Google Scholar] [CrossRef]
- Cuan-Urquizo, A.B.E. Micromechanics of additively manufactured structures: Computational and laboratory experiments. In Proceedings of the XXIV Congreso Internacional Anual de la SOMIM, Campeche, Mexico, 21 September 2018; pp. 28–34. [Google Scholar]
- Park, S.-I.; Rosen, D.W. Quantifying effects of material extrusion additive manufacturing process on mechanical properties of lattice structures using as-fabricated voxel modeling. Addit. Manuf. 2016, 12, 265–273. [Google Scholar] [CrossRef]
- WOOD DATABASE, EUROPEAN BEECH. Available online: https://www.wood-database.com/european-beech/ (accessed on 29 December 2022).
- Shanmugam, V.; Das, O.; Babu, K.; Marimuthu, U.; Veerasimman, A.; Johnson, D.J.; Neisiany, R.E.; Hedenqvist, M.S.; Ramakrishna, S.; Berto, F. Fatigue behavior of FDM-3D printed polymers, polymeric composites and architected cellular materials. Int. J. Fatigue 2021, 143, 106007. [Google Scholar] [CrossRef]
- Kanit, T.; Forest, S.; Galliet, I.; Mounoury, V.; Jeulin, D. Determination of the size of the representative volume element for random composites: Statistical and numerical approach. Int. J. Solids Struct. 2003, 40, 3647–3679. [Google Scholar] [CrossRef]
- Pierard, O.; González, C.; Segurado, J.; Llorca, J.; Doghri, I. Micromechanics of elasto-plastic materials reinforced with ellipsoidal inclusions. Int. J. Solids Struct. 2007, 44, 6945–6962. [Google Scholar] [CrossRef]
- de Souza Neto, E.A.; Feijóo, R.A. Variational foundations of multi-scale constitutive models of solid: Small and large strain kinematical formulation. LNCC Res. Dev. Rep. 2006, 16, 1–53. [Google Scholar]
- Nguyen, V.-D.; Béchet, E.; Geuzaine, C.; Noels, L. Imposing periodic boundary condition on arbitrary meshes by polynomial interpolation. Comput. Mater. Sci. 2012, 55, 390–406. [Google Scholar] [CrossRef]


Disclaimer/Publisher’s Note: The statements, opinions and data contained in all publications are solely those of the individual author(s) and contributor(s) and not of MDPI and/or the editor(s). MDPI and/or the editor(s) disclaim responsibility for any injury to people or property resulting from any ideas, methods, instructions or products referred to in the content. |
© 2023 by the authors. Licensee MDPI, Basel, Switzerland. This article is an open access article distributed under the terms and conditions of the Creative Commons Attribution (CC BY) license (https://creativecommons.org/licenses/by/4.0/).