
Economic Viability and Engine Performance Evaluation of Biodiesel Derived from Desert Palm Date Seeds

1
Mechanical & Nuclear Engineering Department, University of Sharjah, Sharjah P.O. Box 27272, United Arab Emirates
2
Abu Dhabi National Energy Company (TAQA), Abu Dhabi Distribution Company (ADDC), Abu Dhabi P.O. Box 219, United Arab Emirates
*
Author to whom correspondence should be addressed.
Energies 2023, 16(3), 1513; https://doi.org/10.3390/en16031513
Submission received: 25 December 2022
/
Revised: 27 January 2023
/
Accepted: 28 January 2023
/
Published: 3 February 2023
Abstract
:Desert palm date seeds are a potential feedstock for biodiesel and biomass pellet production, particularly in the Middle East and Africa. A model was developed in this study based on optimal conditions for the production of biodiesel, and it was used to evaluate the financial viability of a small-scale biodiesel plant (1000 t/y) using economic performance metrics including net present value, rate of investment, and payback period. Biodiesel was then produced from date seed oil (DSO) and blended with petrol diesel to make four blends (B5, B10, B15, and B20). The technical performance of these blends was investigated using a test engine rig under differing operating conditions, including variations in load and rpm. The investment performance of the proposed biodiesel plant was very sensitive to the price of biomass pellets; the project was feasible only when this was 70% that of wood pellets or higher. The baseline diesel outperformed the biodiesel blends in terms of engine power, thermal efficiency, and fuel economy, with average decreases of 4.5%, 7.65%, and 9.84%, respectively, at full load for B20. However, the biodiesel blends outperformed the baseline diesel in exhaust gas temperature (EGT), with average drops of 29 and 46.7 °C at full load for B5 and B20, respectively. Our study clearly demonstrates that due to it being obtained from existing waste materials, having a cleaner but comparable performance, and its economic viability, date seed oil has excellent potential as a feedstock for biodiesel production.
1. Introduction
Fossil fuels have shaped the world energy system for over a century as the primary driver of the industrial revolution and subsequent economic, societal, and technological development [1]. From this perspective, fossil fuels were a powerful and positive enabler of global change. As a consequence, global oil demand is expected to reach almost 111.1 million barrels per day by 2040 [2]. However, fossil fuel consumption also produces negative environmental impacts, being the primary source of atmospheric pollution and greenhouse gases [3]. In addition, the oil that formed over long geological time periods is being rapidly depleted [4]; this may force the world to face a radical and unpredictable wave of change. Therefore, it is necessary to balance the urgent need to reduce global reliance on fossil fuels with their ongoing contribution to global economic development.
This challenge requires a smooth transition to renewable, sustainable, and low-carbon energy resources. For example, biodiesel fuel is receiving extensive consideration as a sustainable biobased fuel produced from diverse, renewable feedstocks including crops and recycled materials [5,6,7]. Biodiesel is compatible with existing CI engines, fuel distribution infrastructure, and production facilities. Its energy content is ~90% of petroleum-based diesel fuel, while its lubricant and solvent characteristics and zero-sulfur content enhance engine performance and life span [8]. Biodiesel also provides a higher net energy balance and better emission properties than fossil fuels [9].
Nevertheless, several technical, social, and environmental hurdles need to be addressed before designing any winning strategy for biodiesel implementation. For example, serious concerns about where, how, and from which feedstock biodiesel is produced must be addressed. Improper feedstock production or sourcing can result in adverse impacts such as desertification, lower biodiversity, land use change, water resource scarcity, higher food prices, and altered carbon/energy balances. Land-use changes and reduced biodiversity in particular, may even cause greenhouse gas emissions far higher than the savings achieved by biodiesel utilization. For example, Indonesia and Malaysia are currently deforesting large tracts of land to grow palm trees for palm oil that can be used as a biodiesel feedstock. This practice causes severe environmental impacts and undermines the overall carbon balance [8].
Therefore, the production capacity of first-generation biodiesel (produced directly from food crops) is limited by a threshold, beyond which food supply and biodiversity are threatened. In contrast, second-generation biodiesel (produced from non-food resources, including forestry and agricultural products, industrial residues, and waste products) has emerged as a promising energy source [10]. For example, more than 30% of global food production is lost along the supply chain, most of which ends up in landfills or incinerators [11], but such food waste (having already fulfilled its primary purpose) has clear potential as a feedstock for biodiesel extraction. Examples of food waste appropriate for biodiesel feedstock include coffee waste [12], waste cooking oil [13], and date seeds [14].
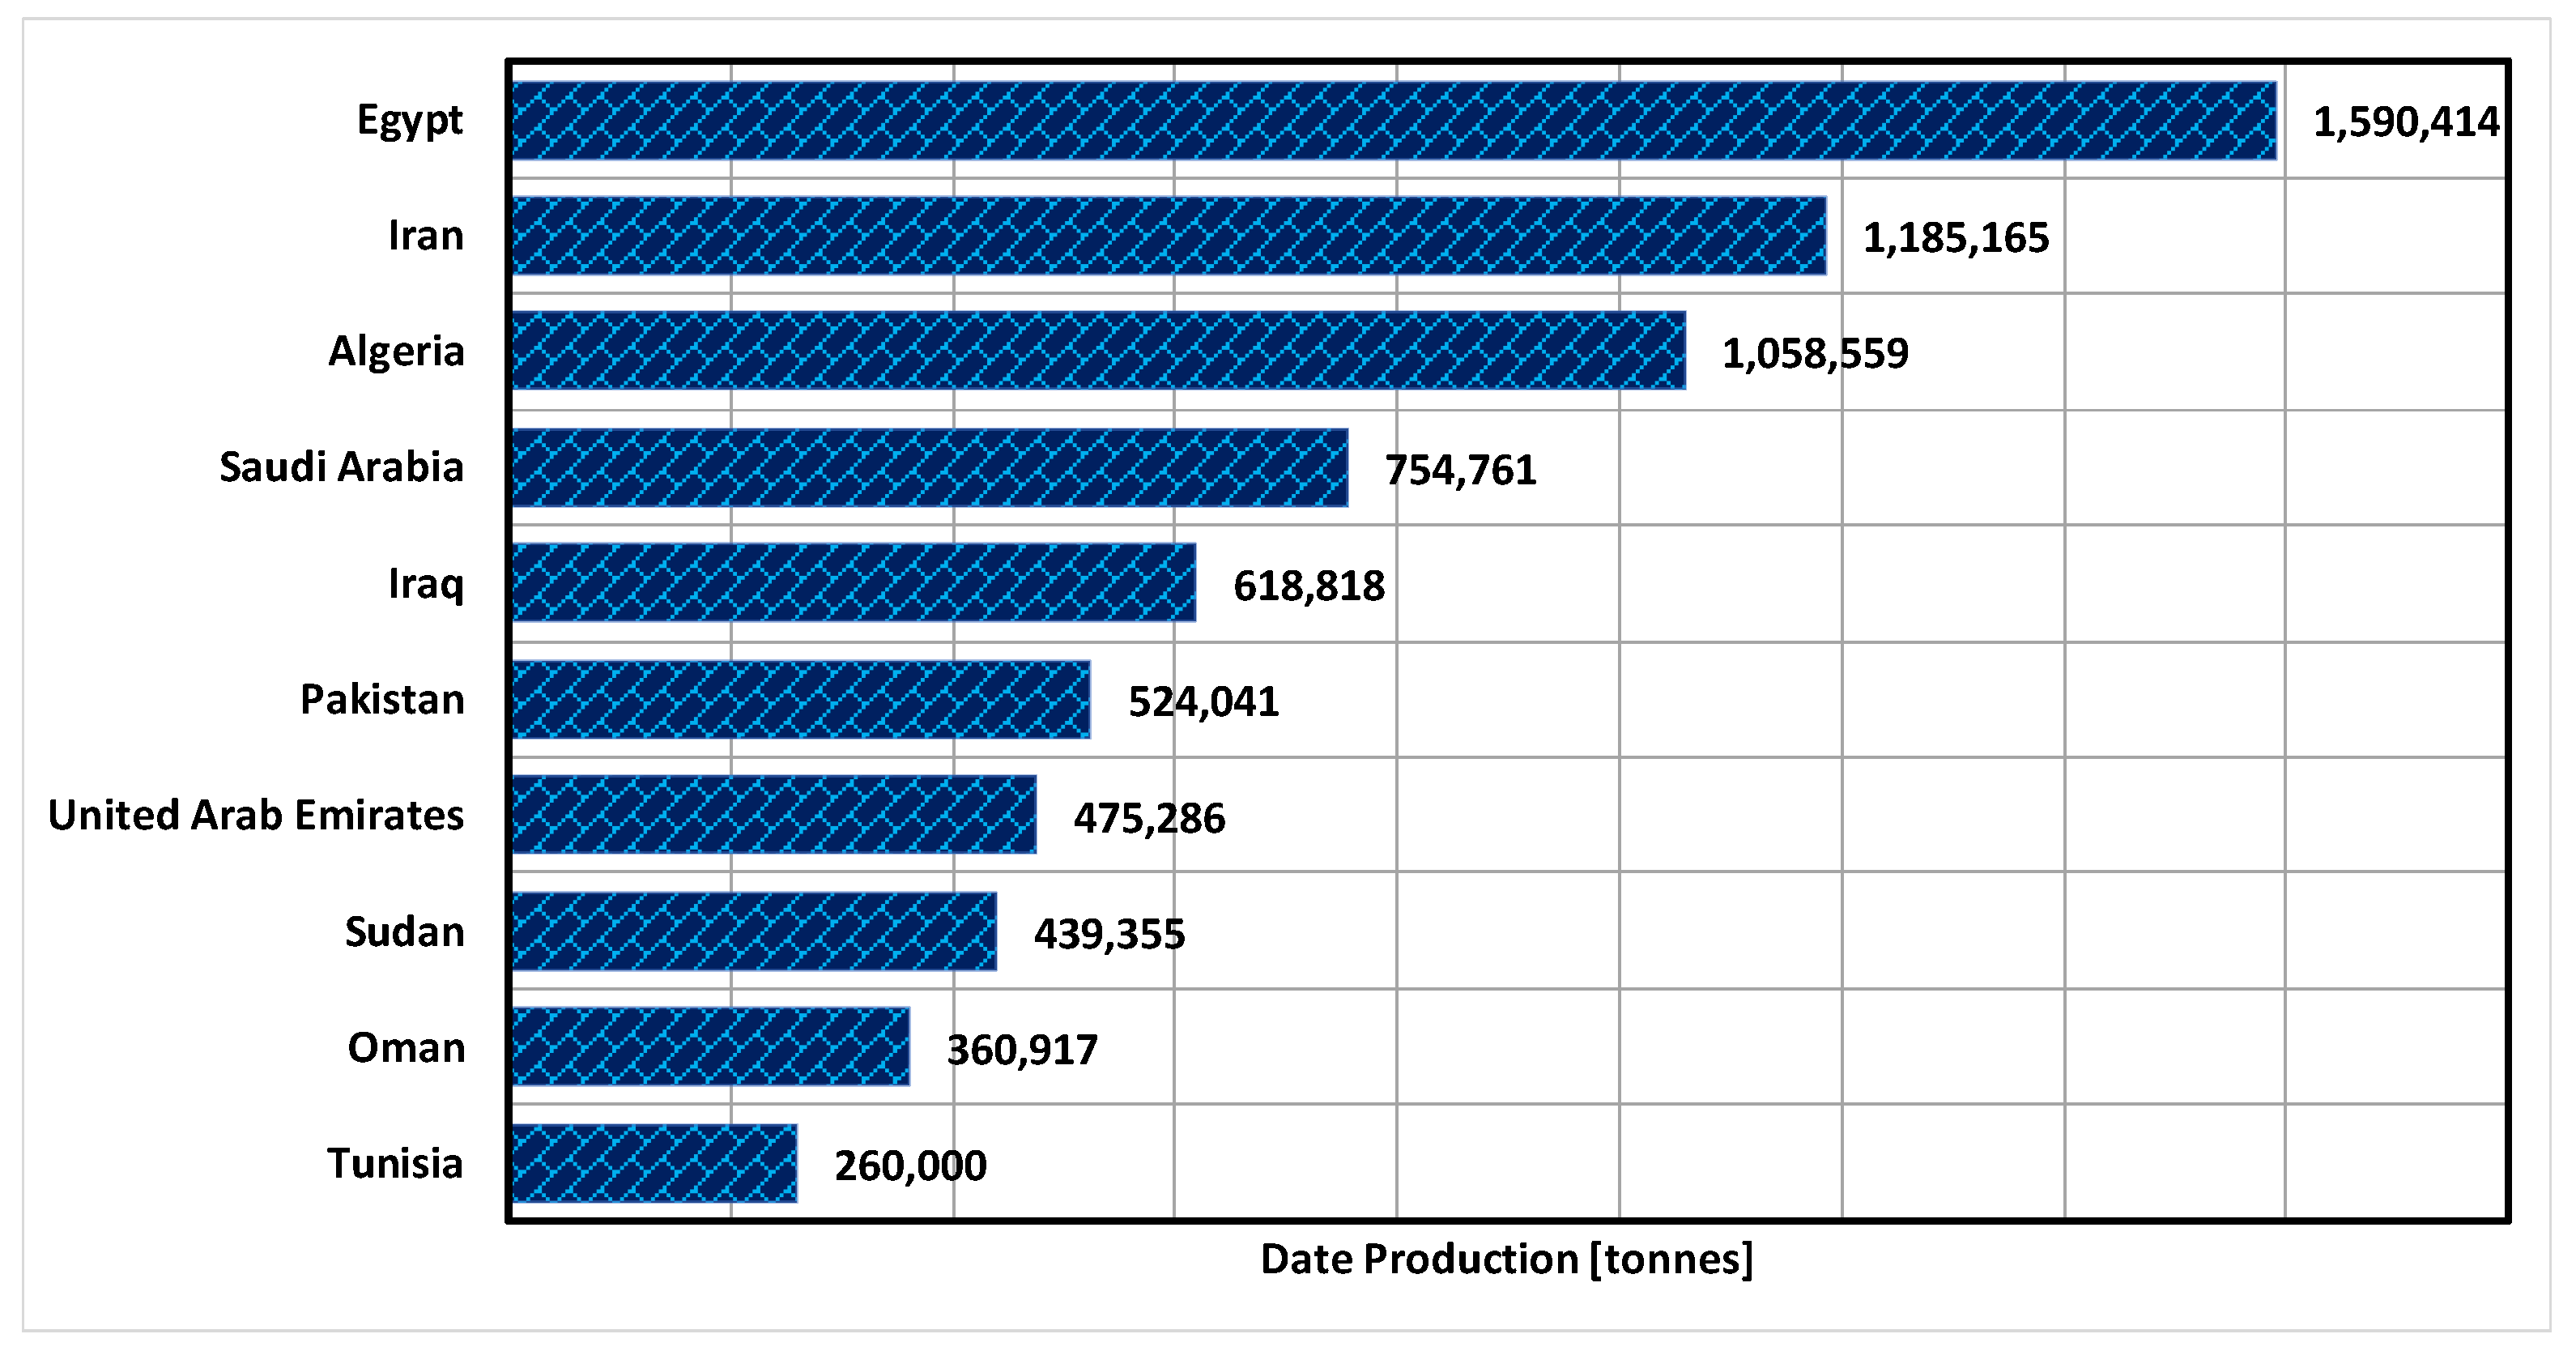
The date is the pitted fruit of the desert palm tree. Date seeds represent an average 15% of the date fruit’s mass [15] and contain 10% oil on average [16]. Global date fruit production has increased from 1.85 million t in 1961 to 8.16 million t in 2017, with ten countries represented almost 89% of the total world production in 2017, all in the Middle East or Africa (Figure 1) [17]. A rough estimation based on these numbers suggests that 1.22 million t of date seed are produced annually, which could supply 122,490 t of DSO. Theoretically, 122,490 t of biodiesel could thus be extracted annually from this resource, a significant amount when compared with the 38,700 t produced throughout the Middle East and Africa in 2015 [18].
However, DSO biodiesel production, like any other second-generation biodiesel, faces significant technical difficulties and is still an immature technology. One or more decades might be required for full development, making extensive research essential in the near future if this vision is to become a reality, especially as DSO biodiesel is a newly suggested feedstock with only a few relevant studies thus far [14,19,20,21,22]. The major goals in those studies were augmenting DSO extraction and optimizing biodiesel production. To these goals, the affecting factors and the production process chain were characterized and described clearly. The conditions associated with optimum DSO extraction and biodiesel production have been determined (Table 1), but little attention has been paid to ensuring the conformity of DSO biodiesel specifications with the relevant international standards (such as ASTM D6751 and ISO EN14214). Moreover, DSO has not been tested in diesel engines to assess its performance and tailpipe emissions.
In contrast, an extensive literature has investigated the performance and tailpipe emissions of engines powered by other biodiesels, covering a wide spectrum of engine operating conditions and diversified biodiesel feedstocks. Xue et al. [23] reviewed 162 articles and summarized their findings relevant to engine performance and exhaust emissions. More than 70% emphasized drops in power and torque for engines powered by biodiesel rather than petrol diesel, likely due to the reduced heating value of biodiesel fuel. Likewise, 87% found that engines powered by biodiesel consumed more fuel than their petrol diesel counterparts, with a consensus that this lowered fuel economy was caused by lower energy content in biodiesel, forcing the engine to burn more fuel to achieve the required load and torque.
The current and future ratios of global petrol diesel, and biodiesel production (28.5:1 in 2017, expected to converge to 17:1 in 2040 [2]) suggest that biodiesel will not become a viable alternative to petrol diesel in the near future. This gap can be attributed to two factors: finite amounts of appropriate feedstocks and the well-established petrochemical industry. Given this situation, it is highly important to consider every possible feedstock, particularly untapped waste streams that could be a potential source of energy (such as DSO). This is a promising strategy to meet the future needs for sustainable biofuel without compromising resources and the environment for future generations.
This study examines the economic feasibility and technical performance of desert date seeds as a potential feedstock for biodiesel production. Under optimized extraction conditions described in previous research, we produced biodiesel fuel, followed by analyzing engine performance metrics such as BP, BTE, BSFC, and EGT for CI diesel engines powered by four DSO biodiesel blends (B5, B10, B15, and B20).
2. Materials and Methods
2.1. Process Modeling
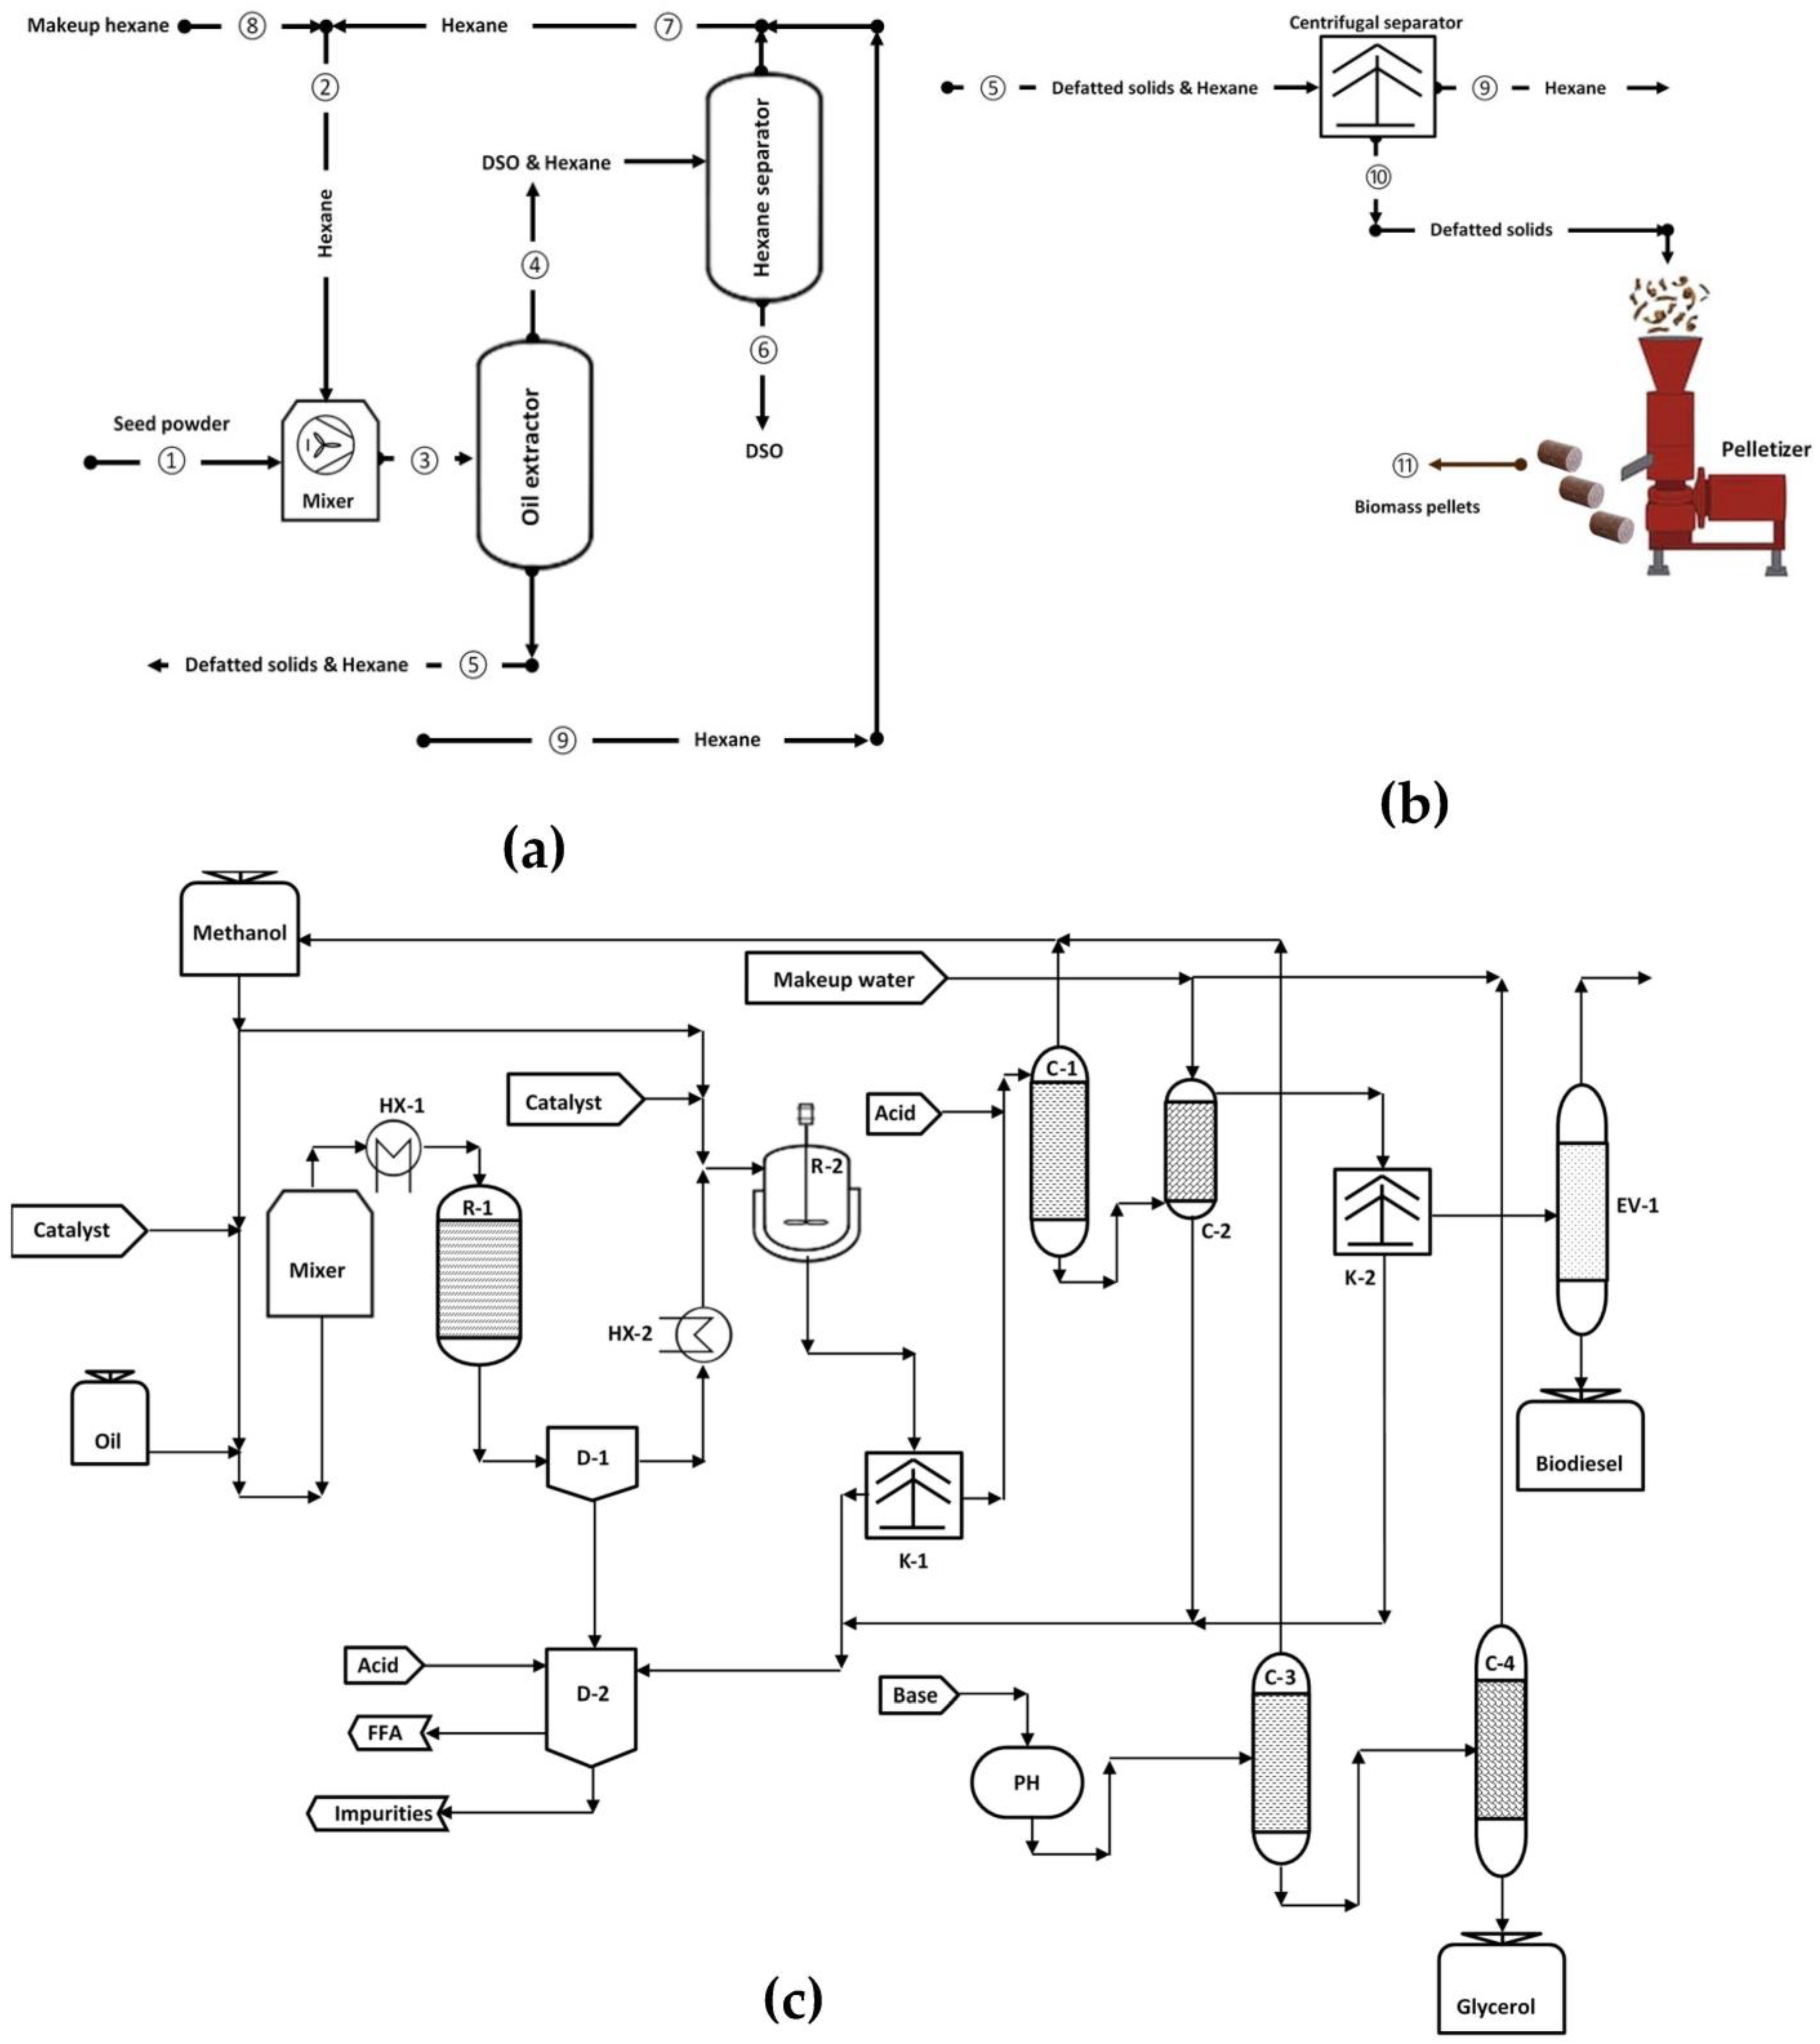
We assessed the economic feasibility of a DSO biodiesel plant by simulating the production process using Honeywell’s UniSim Design modelling software (Honeywell Process Solutions Company, Morris Plains, NJ, USA) [24], defining materials, energy consumption, and equipment capacity for a production capacity of 1000 t/y. This was selected based on the accessible amount of date seeds in the United Arab Emirates determined through contacts with the main date fruit producers. The entire production process consisted of three stages: oil extraction, date seed biomass pelletizing, and biodiesel production (all values presented here are estimates for producing 1 kg of DSO biodiesel).
Date seed oil (DSO) extraction (see numbered processes in Figure 2a) was applied under the optimum conditions defined in Table 1, using dried fine date seed powder supplied by date processers. In this process, the powder is blended with hexane (1) in a vessel before moving to the oil extractor, where oil is extracted by solvent. The resulting blend of DSO and solvent moves from the extractor (4) to the solvent separator, a vacuum tank that separates hexane at a temperature > 69 °C (the boiling point of hexane). The separated hexane (7) is mixed with a makeup stream (8) that compensates for the lost hexane (estimated at 1% of oil extracted [25]) before being returned to the extractor for renewed use.
The oil extractor also produces solid defatted date seeds (5), which contain hexane at an estimated 7.5 wt.% of the total mass of the extraction solvent [26]. These are supplied to the biomass pelletizing stage (numbered processes in Figure 2b). The solvent is removed via a centrifugal separator and sent back (9) to the mixer in the DSO extraction stage after being mixed with the stream that leaves the solvent separator (7). The centrifugal separator also concentrates the solids before sending them to the pelletizer (10), where they are agglomerated into biomass pellets (11).
The DSO biodiesel production stage (Figure 2c [27]) can be separated into six divisions: refining (not shown), conversion to biodiesel, purification, alcohol (methanol) recovery, recovery of glycerol, and the treatment process for the wastewater (not shown). As in the extraction stage, we applied the optimum conditions defined in Table 1. In this process, methanol and purified DSO are supplied to a static blending device along with the catalyst (NaOH). The blending process is needed to achieve a homogeneous reaction. A conversion extent of 90% is achieved as a result of the esterification process in the reactor (R-1). Using a single-phase decanting process (D-1), an intermediate glycerol elimination process lasting one hour is then achieved. As a result of this step, monoglyceride content is reduced, thereby enhancing phase separation in subsequent processes. The glycerol that leaves the stream with methanol and catalyst is fed to the second decanter (D-2). After the methanol and catalyst have been recompensated, the biodiesel-rich stream is sent to the transesterification reactor (R-2), where a 95% conversion level is achieved. Afterwards, the remaining glycerol is centrifuged (K-1) for phase separation. The biodiesel is then neutralized using phosphoric acid (H₃PO₄) and sent to the methanol separation column (C-1), where 90% of the excess methanol is freed and then recirculated to the esterification/transesterification division. The biodiesel is then purified with warm water in the column (C-2) (a countercurrent column) to vigorously remove trace soap, alcohol, and the remaining glycerol. The second centrifuge (K-2) and the vacuum evaporator (EV-1) are incorporated to reduce water levels in the biodiesel to below the limits decided by standards (0.05 vol.%).
These processes recover glycerol that is collected in a decanter (D-2) where it is neutralized with acid in order to neutralize the alkaline catalyst that is associated with it. At the top of the glycerol, the soap is transformed into fatty acids, which are collected and returned to the esterification process. Following pH adjustment, crude glycerol is supplied to a distillation column (C-3) (working under vacuum) in which a 50% solution of glycerol and water is produced. As a result of the next evaporation column (C-4) (working under vacuum), the concentration rises to 85%.
2.2. Cost Evaluation
To evaluate the feasibility of a newly constructed DSO biodiesel production plant, we estimated the total capital cost (investment required, ) and the annual production cost () as described in the sections below.
2.2.1. Total Capital Cost
Total capital cost is composed of fixed capital cost () and working capital cost () [25]. is the amount required to develop the infrastructure [26] and includes direct costs () such as initial construction expenses () and equipment () and indirect costs () such as design and engineering ( = ), contractor fees ( = ), and contingency allowance ( = ) to account for unforeseen situations (such as labor disputes, design modifications, or weather delays). Therefore, the fixed capital cost is = + = .
The CDC values were estimated using the Detailed Factorial Lang Method, which defines the contribution of each item by multiplying CPE by a suitable factor (fi) that was derived according to similar processes based on historical economic records [28] . The factor fi depends on the nature of the process; we considered a value of () [27,29] for DSO biodiesel production with a fluid–solid conversion process. The base cost of any equipment was defined as , where is the cost at a reference condition of pressure and materials and is a correction factor that accounts for any deviation from that reference condition [30]. The base prices of the equipment () were based on 2003 data and were therefore adjusted using the Chemical Engineering Plant Index for January 2019 (619.2) using US dollars ($). Equipment prices were also adjusted using prices presented on the Matches website (https://www.matche.com) (accessed on 23 August 2019). is the expenditure required to start up the plant and begin earning revenue from production; a typical figure for petrochemical plants is 10% of [29].
2.2.2. Annual Production Cost
The is made up of prime (direct) production cost () and overhead (indirect) cost (). The includes raw materials, labor, utilities, and other factors. One major challenge facing biodiesel production is the need for substantial amounts of water. For example, the production of 1 L of soybean biodiesel requires 84 L of water [31]. However, more than 95% of that water is required in the cultivation stage, which is not applicable for date seed feedstock because this is a by-product stream. Only a small fraction of the total water consumed is used during actual biodiesel processing: on average, the process of converting refined oil into biodiesel consumes 2 L of water per 1 L of biodiesel produced [32]. In addition, biodiesel processing consumes thermal and electrical energy, which have been valued at 440 kWhth (kWh of thermal energy) [33] and 60 kWhe (kWh of electrical energy) [34], respectively, per ton of biodiesel produced.
The proposed DS biodiesel facility is capable of producing 10,227 t of biomass pellets annually, which have value as a combustible fuel on the global energy market and can help promote a transition toward decarbonized fuels. In this context, global production of wood pellets reached 36.1 million t in 2016 [35]. However, many challenges face this endeavor and serious effort will need to be devoted to promoting this solid fuel. For example, the impact on air quality of such pellets’ combustion needs to be defined and their market value has not been determined. We initially estimated the DSPP as $175/t (70% of WPP) considering the apparent similarity between the two products, producing an estimated parallel revenue of $1,789,672. Similarly, the glycerol by-product could provide another income stream of $52,500.
In order to make proper investment decisions regarding the proposed DSO biodiesel plant and assess its viability, we conducted an economic analysis considering various parameters. The annual net cash flow for any year () is pivotal for profitability evaluations (such as net present value and discounted cash flow of return); this was estimated as the net annual profit () minus the total annual expense (). The cumulative net cash flow (CNCF) at the end of the plant’s lifetime (set as 15 years) was calculated by compiling all values over time as . However, the annual income should not be expected to remain constant and the value of money changes over time. Revenue obtained earlier is worth more than that gained later, due to factors such as compound interest, investment potential, and inflation. This was considered in the cash flow by defining the net present worth (NPW) as , where p is the discount rate or earning that could be achieved if the money is invested at present. Then, the net present value (NPV) was defined as the sum of all over the plant’s lifetime discounted to present: .
The return on investment (ROI) was also used to assess the efficiency of investment in the proposed biodiesel plant, defined as: , where L is the plant’s lifetime (y). The payback time (PBT) was also considered as an indicator for economic performance; this calculates the time from startup until is totally recovered (the break-even point). All aforesaid economic metrics were initially estimated according to a DSPP of $175/t, although the accuracy of this estimate had not yet been determined. Therefore, we conducted a sensitivity analysis for these estimates considering different DSPP values.
2.3. Biodiesel Production
Our biodiesel production test used powder obtained from a local date producer. DSO was extracted using the Soxhlet extraction system (B-811-BUCHI) and subjected to hydration and centrifugation processes to eliminate the gums generated from the oil [36]. Next, the DSO underwent a treatment (by phosphoric acid) to bring the elevated extents of Mg, Ca, and P down to levels set by the standard (ASTM D6751). The DSO was then converted to biodiesel by the transesterification reaction in the pilot biodiesel production plant (UPB/EV-Elettronica Veneta) (Figure 3). The resulting biodiesel was then purified, its properties characterized, and its conformance with the ASTM D6751 standard confirmed.
2.4. Experimental Test Rig
The performance tests used a single cylinder, four stroke, air cooled compression ignition engine originally designed for petrol diesel (Table 2, Figure 4). This was a naturally aspirated engine that did not include a turbocharger, supercharger, or exhaust gas recirculation system. The fuel injection system was driven by a diaphragm pump housed in the crankcase and operated by a camshaft via tappets. The fuel injectors were located close to the center of the combustion chamber with the nozzle ends projecting 0.25 cm from the cylinder head. The engine had a hemispherical bowl-in-piston combustion chamber design. Air was inducted to the engine via a plenum chamber with an orifice plate at the inlet; this had a differential pressure transducer to measure engine inlet air flow. This configuration was necessary for measuring air flow rate because of the pulsating air flow pattern caused by the reciprocating nature of the piston movement; the plenum chamber damped such pulsations. Engine fuel consumption rate was measured by a burette connected to the fuel line between the engine and fuel tank. The fuel injection timing was maintained unchanged and according to the original manufacturer’s settings.
The engine was fitted with an automotive alternator modified to serve as a dynamometer. This was a star-connected 12-pole fitted with a 3-phase bridge rectification circuit to control the field excitation circuit. The maximum continuous speed of the alternator was 15,000 rpm, rated at 45 amperes to 6000 rpm. An air-cooled resistive load bank was used to dissipate the alternator-rectified direct current output. The brake power was determined by measuring the electric output of the alternator. The brake thermal efficiency is determined from the BP, the fuel lower heating value (LHV), and fuel mass flow rate () as
The brake specific fuel consumption is determined and BP as
The engine was connected to the dynamometer (alternator) by a toothed belt and pulleys whose ratio set the dynamometer speed at 1.6 times that of the engine. A proximity switch was equipped to determine engine rpm by detecting the teeth on the engine output pulley. An ammeter and voltmeter were mounted on the rig to indicate the output voltage and current dissipated in the load bank. The temperatures of engine lubrication oil, exhaust gas, and engine inlet air were measured using thermocouples. All sensed data were communicated to a PC by USB through a data acquisition system, with software presenting data for display in SI units.
The DSO biodiesel was blended with base diesel fuel at four different fractions: 5% (B5), 10% (B10), 15% (B15), and 20% (B20). These blends were selected because the diesel engine can be powered by these blends without major modifications. Each were tested in the engine test rig to examine the influence of biodiesel blends on engine performance metrics under different engine speeds and loads. The engine speed was varied in 200 rpm steps from 1600 to 3600 rpm. This is the normal operating speed of the engine. We considered three loads: 50%, 75%, and full load, since the engine is usually loaded within these limits.
We normalized the differences between performance parameters for benchmark diesel fuel and the biodiesel blends as follows:
where is the normalized difference of any parameter or quantity, is the DSO biodiesel value, and is the counterpart value of the base diesel fuel.
3. Results and Discussion
3.1. Profitability of the Proposed DSO Biodiesel Plant
Table 3, Table 4 and Table 5 summarize the estimated , , and , respectively, for the 1000 t/y DSO biodiesel production plant. The was relatively high ($5.29/kg of biodiesel), given that a typical 100 kt/y biodiesel plant requires a capital investment on the order of $1.0/kg, considering that the feedstock oil is delivered as a purified oil [37]. One reason for this was that the proposed plant was a complete project encapsulating all phases of the production chain including oil extraction, biodiesel production, and purification; the pelletizing operation also added cost. However, the major contributor was the relatively small capacity of the proposed plant: the lower the capacity, the higher the capital investment required per unit produced. For example. when the production capacity of biodiesel plants is increased by 3, 10, and 16.3 times, declines of 52%, 60%, and 77% in can be achieved [37]. However, the was comparatively low due to the low cost of the DSO feedstock.
The ROI was very sensitive to DSPP (Figure 5a). A pellet price of 40% WPP results in a negative ROI, under which the investment is clearly not feasible and loses money. A DSPP >70% WPP is required to achieve an ROI of >12% (the typical acceptable ratio). Based on the trends of cumulative NPW and PBT for varied DSPP over the plant’s lifetime, the benefits obtained from investment in the DSO biodiesel plant are oversensitive to DSPP and subject to drastic changes with variations in DSPP (Figure 5b). For example, when DSPP dropped from equal to WPS to 60% WPP, NPV decreased from $22.77 million to $7.43 million and BPT was extended from 2 years to 7 years. These results suggest that investment in such a project is exposed to real risks with a clear likelihood of losses due to uncertain DSPP. One possible option would be to consider a plant that could be fed by additional waste feedstocks such as coffee waste and tallow.
3.2. Engine Performance
3.2.1. Brake Power
The biodiesel blends had lower BP values than baseline diesel for the entire speed range under all three engine loads; this became more pronounced with progressively higher biodiesel fractions (Figure 6). The most significant differences were evident at lower engine loads and higher speeds. The highest drop in BP (4.7%) for B5 occurred at 3000 rpm, compared with 9.2% for B20 at 3600 rpm (both under full load). The baseline diesel fuel was superior throughout, and none of the blends could produce peaks as high as the baseline. These results match those in previous research [44,45,46].
This pattern can be attributed to two reasons. First, the heating values (energy content) of the DSO biodiesel blends were lower than those of pure diesel. For example, the lower heating value of the DSO biodiesel was 6.7% less than that of the baseline diesel; burning the same amount of fuel with less energy content releases lower energy and power [47,48]. Second, the biodiesel blends had higher viscosity [44,49]. This results in poor fuel atomization, which affects droplet evaporation and combustion efficiency inversely, producing a decline in produced power. Furthermore, the more viscous biodiesel blends take longer to flow from the fuel tank to the engine, resulting in a slower response to speed and load demands. Some studies have reported an increase in BP with biodiesel combustion [50,51], arguing that enhanced fuel spray penetration was achieved by the higher viscosity. Surprisingly, one study found a 70% increase in BP with pure biodiesel compared with pure petrol diesel [52], while others [53,54] found insignificant power differences (less than 1.5%) between pure diesel and biodiesel blends.
BP values increased as engine speed increased for all tested fuels under all loads through 3600 rpm. BP can be considered as the useful shaft power after frictional power losses are deducted from indicated power (work rate done by combustion gases), or as the product of indicated power and mechanical efficiency (). As the engine runs faster, friction torque and increase linearly, while friction power increases quadratically. Therefore, BP tends to peak and then decrease while indicated power is still increasing. BP behaves similarly at partial load, but with decreased values. Under this condition, lower amounts of fuel are combusted, and less energy is released, while the flow is choked by reducing the throttle area and airflow is obstructed. Therefore, pumping losses (a significant fraction of friction power) are augmented as the flow is throttled, dropping the engine’s mechanical efficiency. The general trend of BP with engine speed and load was similar for baseline diesel and biodiesel blends, but there was an offset in the peak power occurrence, in agreement with [53,55].
3.2.2. Brake Thermal Efficiency
BTE is of great interest because it assesses the engine’s capability to convert chemically stored fuel energy into useful shaft work. The baseline diesel outperformed the biodiesel blends under all three loads and the full speed range (Figure 7). The baseline diesel achieved a maximum BTE of 39% at 3000 rpm under full load, while B20 was 9.5% lower under the same conditions. Higher biodiesel fractions consistently produced lower BTE and B20 had the worst performance throughout; this is in agreement with some existing literature [48,56,57]. Other studies showed no variations in power and efficiency with biodiesel fractions up to 30% [58], negligible differences [54], or even the opposite trend of enhancement in fuel conversion efficiency with increased biodiesel fraction [52,59,60].
One of the justifications that were presented here is the reduced friction power due to improved lubricity from added biodiesel [60]. However, biodiesel inclusion does not necessarily enhance engine lubricity; the inverse might be the case. Biodiesel volatility is poor, and its boiling range is narrow, resulting in longer paths for the injected spray. For example, one study showed that the liquid path was lengthened by approximately 20–30% over that of petrol diesel [61]. This may increase the cumulation of the blended fuel within engine lubricating oil [62], a condition that negatively influences lubricant function. Moreover, engine oil degradation is accelerated by the presence of biodiesel [63].
The greatest BTE differences from the baseline diesel for B5, B10, B15, and B20 were 5.2% at 3600 rpm and 100% load, 5.6% at 3600 rpm and 75% load, 8.7% at 1600 rpm and 50% load, and 12.3% at 3600 rpm and 100% load, respectively. At lower load (50%), BTE deteriorates because less fresh charge is inducted into the cylinder, producing less shaft work. Moreover, pumping losses are augmented because of the throttled flow, resulting in lower useful work on the engine shaft. At full load, BTE falls off because frictional losses increase as noted by [64,65]. That is, among the considered loads, the 75% load is the optimum for higher fuel conversion efficiency; a finding that agrees with [66]. BTE falling off for the biodiesel blends was lessened by 2% (relative to the baseline diesel) under the 75% load condition compared to the full and half load conditions.
The BTE profile with respect to engine speed was mainly time related. The optimum efficiency occurs around 3000 rpm; at higher speeds, the mechanical efficiency drops sharply because frictional losses increase when the contact rate of moving parts increases, while at lower speeds, time becomes adequate, and a larger portion of the useful energy is lost as heat to the engine coolant.
3.2.3. Brake Specific Fuel Consumption
BSFC is a comparative metric frequently used to measure how efficiently an engine is converting the fuel’s chemical energy into the desired output power (work per cycle). Accordingly, BSFC can be defined as the ratio of the fuel mass flow rate (g/h) consumed to provide one unit of BP (kW) and so BSFC is inversely related to BTE [67]. The definition of BTE is based on the premise that all available heat of combustion (fuel energy content) is liberated as useful work. However, this assumption is problematic because any heat engine, including the Carnot engine, will never be able to reduce heat transfer irreversibility to that extent [64]. Therefore, BSFC is preferred when evaluating engine efficiency because its definition involves fuel mass flow rate rather than fuel energy content and reducing BSFC is an important goal for engine performance.
The baseline diesel showed excellent performance with regard to BSFC, with lower consumption (desirable) at all speeds under all loads (Figure 8), in agreement with almost all relevant findings reported in the literature. Increasing the DSO biodiesel fraction in the blends tended to increase the BSFC as compensation for the reduced energy content of the biodiesel, as shown by most research. Many studies, such as [68,69], have reported that the percentage increase in biodiesel blend consumption matches the percentage decrease in energy content. However, in this study, the increase in BSFC did not match the reduction in fuel energy content, in agreement with [70,71].
For example, the increase in B20 consumption at 3000 rpm under full load was 12.46%, while the reduction in energy content was ~1.5%. One reason for this may be the higher density of the DSO biodiesel (~7.4% higher than the baseline diesel). As diesel fuel injectors dispense fuel on a volumetric basis, a greater mass of denser biodiesel will be injected [72]. A second reason may be the difference in distillation characteristics between the baseline and DSO biodiesels. Because of the higher boiling point of the DSO biodiesel, the spray penetrates deeper, and a greater portion of the biodiesel blend mass impinges on the cylinder wall. Then, due to the very brief time available for volatilization (especially at higher engine speeds), a certain amount of the fuel is merged with the lubricating oil over time. This results in a lower amount of power being produced for the increased mass of delivered fuel; that is, higher BSFC results. The B5 blend exhibited similar consumption to that of the baseline diesel, with an average increase of 1.55% for the entire engine speed and load range. A peak increase of 6.6% in B10 consumption was observed at 3600 rpm under 75% load. However, the BSFC increased by 10.7% and 15.6% for B15 and B20, respectively.
There is an optimum operational condition that accommodates the minimum targeted BSFC, made up of a set of influencing parameters (including engine speed and load). For all considered fuels and loads, minimum consumption was observed at 3000 rpm. Given that only three widely spaced loads were considered, the minimum consumption load likely lies between 75% and 100%, closer to the latter. Starting at the optimum condition, the BSFC increases if the condition deviates from the optimum in any direction; single-valued minimum BSFC is existent. Reducing engine speed at constant load increases BSFC because of the greater heat transfer losses per cycle; the residence time is a crucial factor in the heat exchange process. Friction decreases as well, increasing the mechanical efficiency, but this influence has less contribution.
At 75% load, decreasing the speed to 2000 rpm (from the optimum 3000 rpm) increases the diesel fuel consumption by 23%, but the B20 consumption by only 18.3%. Increasing speed at constant load increases fuel consumption, because the friction losses augment at higher speeds. The heat exchange rate reduces as well, increasing fuel conversion efficiency, but the effect of the friction dominates. At half load, increasing the speed to 3600 rpm increases the baseline diesel BSFC by 68%, compared to 41.4% for B10. Thus, increasing the speed worsens the scenario more than decreasing it, meaning that friction’s influence has more weight than heat transfer. Furthermore, the sensitivity of baseline diesel BSFC to changes in speed is higher than that of the biodiesel blends. On the other hand, consumption increases if load increases because the engine experiences an increased demand for torque while air flow is limited, enriching the air-fuel charge. Under richer conditions, some fuel is wasted because of the oxygen’s inability to release all fuel energy. Consumption also increases if the load decreases because the magnitudes of both pumping losses (and hence friction) and heat transfer increase. When the load was reduced from 100% to 50%, baseline diesel and B15 increased by 47% and 39%, respectively.
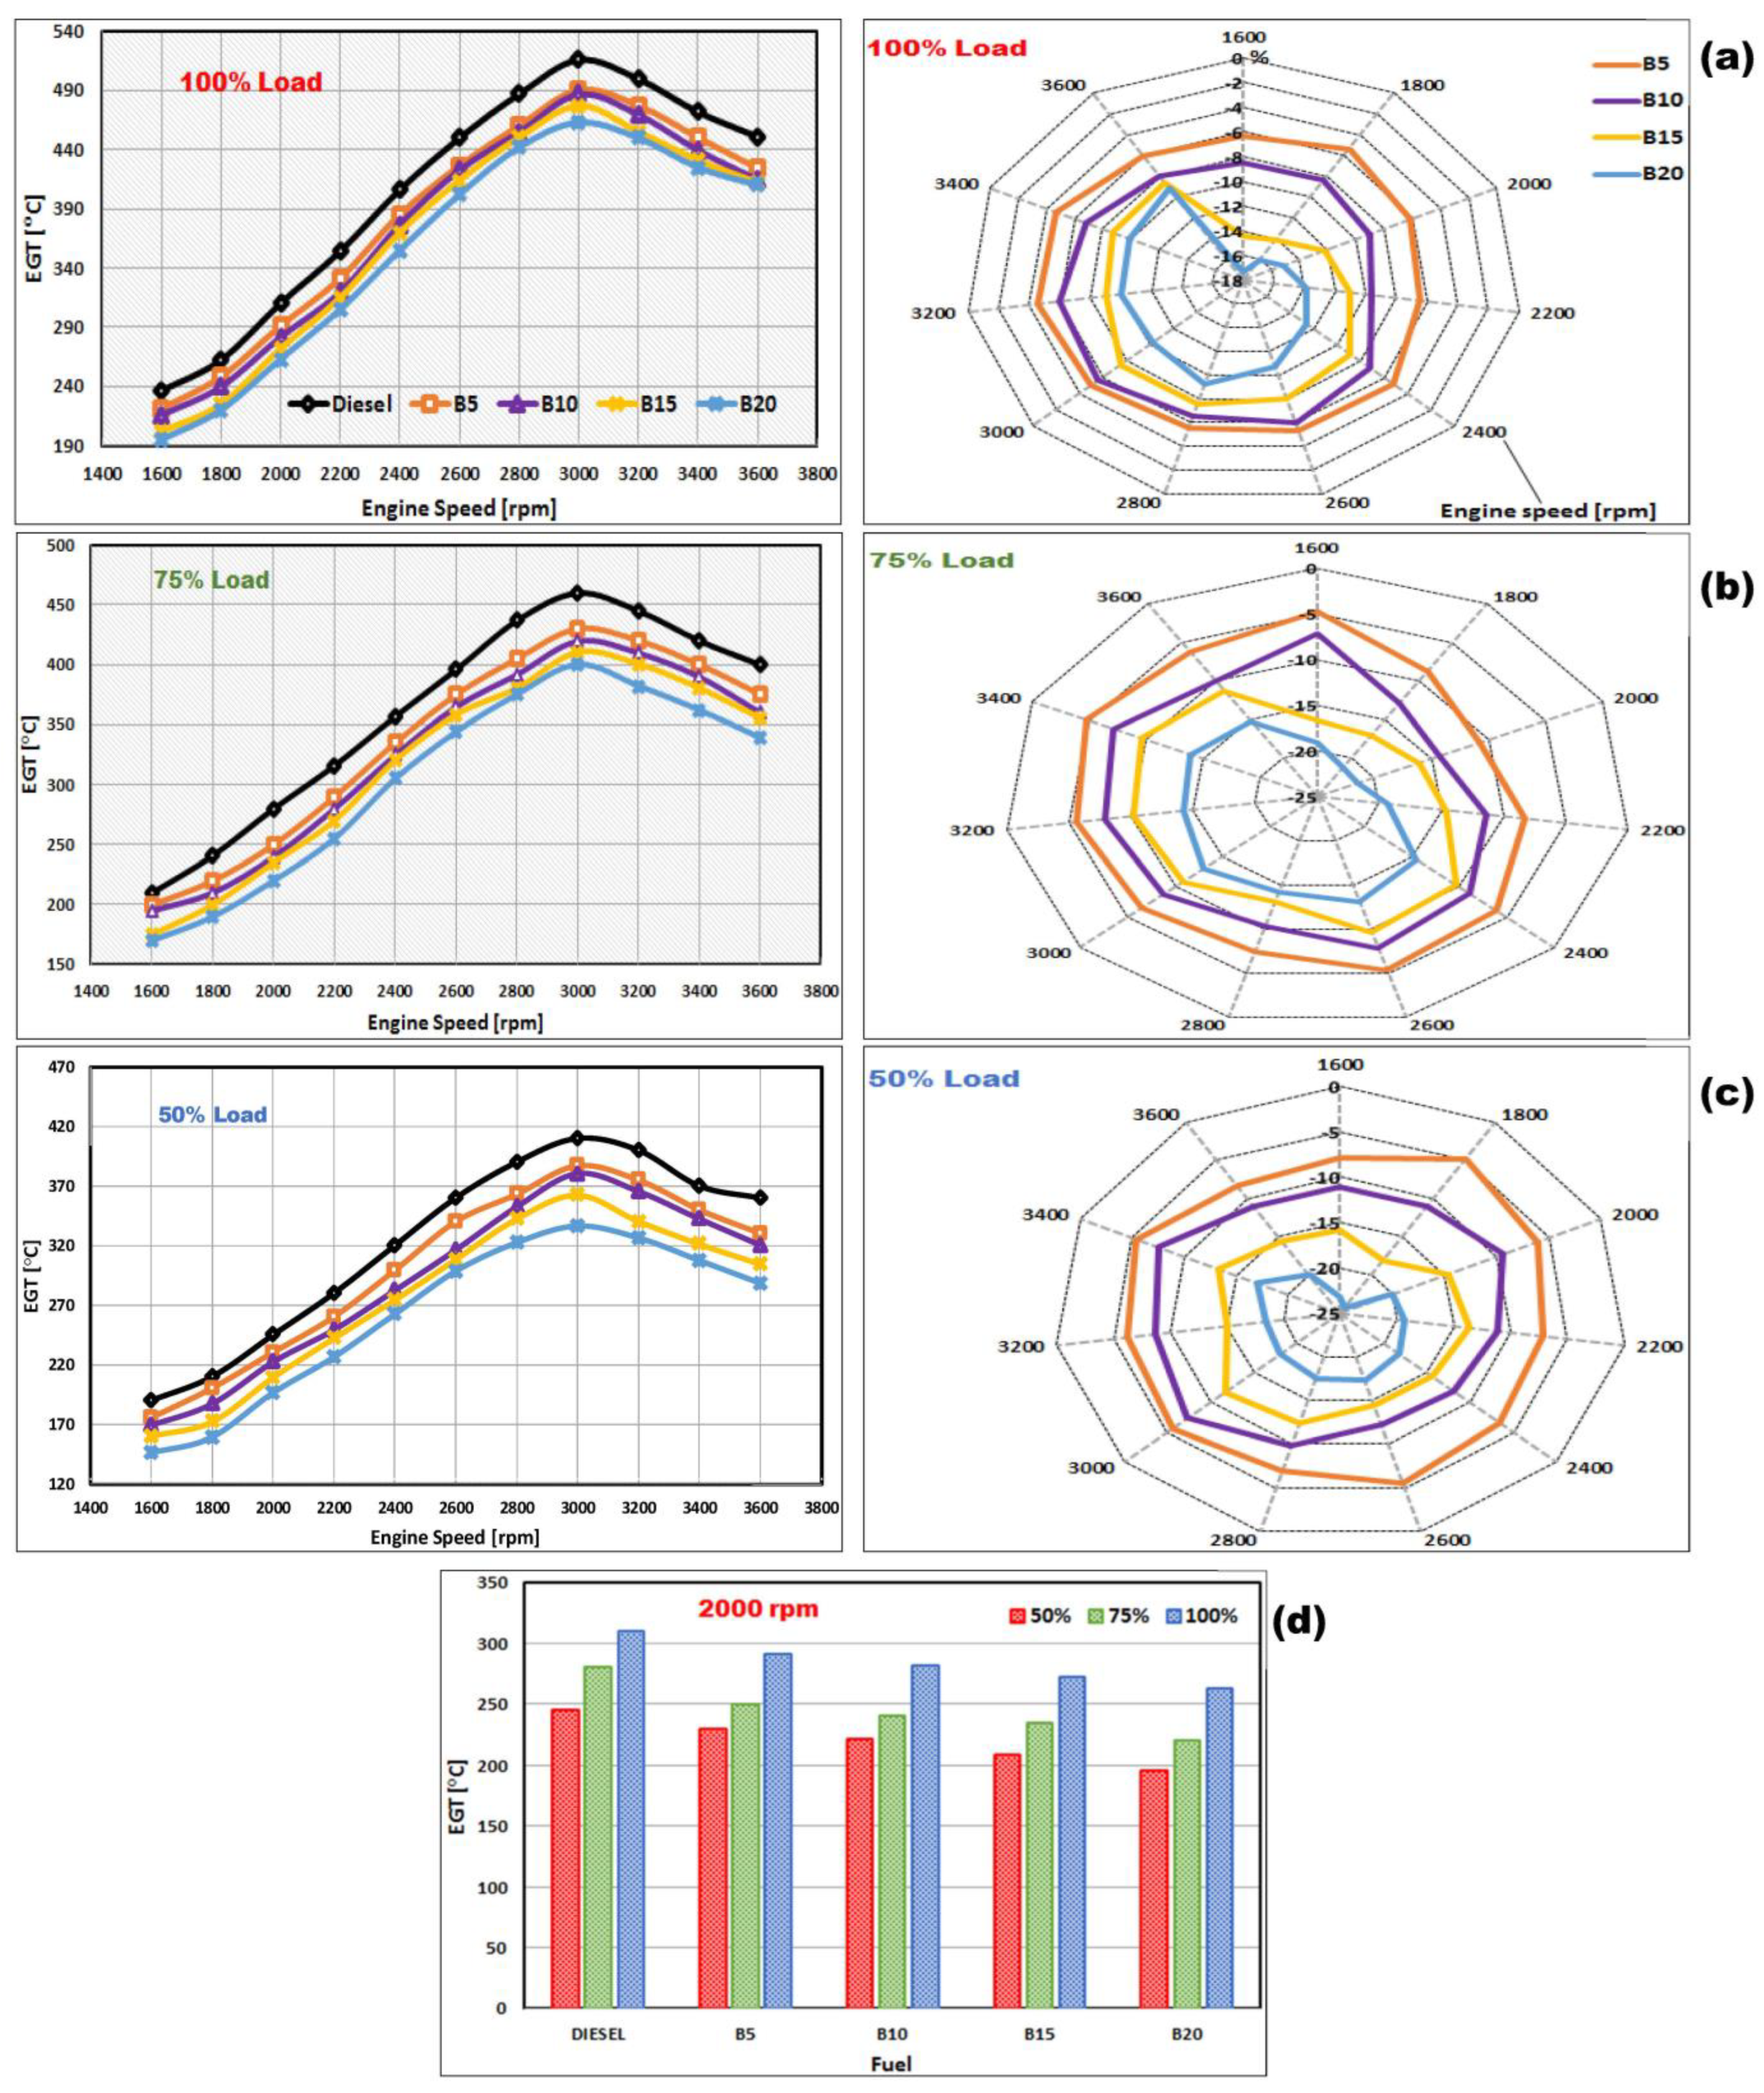
3.2.4. Exhaust Gas Temperature
EGT is another important engine performance metric. For example, an indicated thermal efficiency of 30% means that only 30% of the total energy liberated by the combustion is used to produce BP on the engine shaft and overcome friction losses, while the remaining 70% is dissipated as heat losses to the engine cooling medium and the exhaust gases. The less efficient an engine is, the more heat losses will be dissipated, and the higher the cooling medium and exhaust gas temperatures are. EGT also has a strong influence on engine emissions and systems such as turbochargers, catalytic converters, and particulate traps.
For all considered speeds and loads, higher fractions of DSO biodiesel produced lower EGTs (Figure 9). This trend is related to the lower heating value of the DSO biodiesel, which lowers the temperature in the combustion chamber and exhaust port. For example, a reduction of 74 °C was observed in EGT for B20 at 3200 rpm and 50% load. Significant variations occurred at 2800–3200 rpm: 32 °C at 75% load, 45 °C at 50% load, and 60 °C at 50% load for B5, B10, and B15, respectively. Similar trends and interpretations were also reported by [73], while a drop of 59 °C was observed with a B20 microalgae biodiesel blend [74].
Overall, EGT increases with increasing engine load and speed. At higher loads, more mass in the fuel–air charge is inducted and burned inside the cylinder, and thus more mass is expelled in the exhaust stroke at a higher temperature. At higher speeds, less time is available for heat transfer inside the cylinder and the exhaust port. Engine speed governs the time available for heat transfer, while engine load governs the exhaust gas mass flow rate; both are significant factors for EGT. Furthermore, increasing engine speed makes the mixture inside the cylinder richer because of the limited time for the intake stroke and the reduced volumetric efficiency.
Maximum exhaust gas values are seen under stoichiometric mixture conditions, and lower values are experienced under leaner or richer conditions, explaining the existence of peaks in the EGT profile at about 3000 rpm. Increasing or decreasing the speed leads to a richer or leaner mixture, respectively. CI engines have lower EGT than spark ignition engines because the former are designed to operate under lean conditions, and because of the higher expansion ratio during the expansion stroke [75].
Other variables associated with variations in EGT include air-fuel ratio, combustion chamber design, fuel CN, compression ratio, exhaust back pressure, and injection timing; the latter is most important for diesel engine performance and is tuned accordingly. If the injection timing is advanced in the compression stroke, a greater amount of combustion gases expands early in the expansion stroke, exerting more force on the downward moving piston. Hence, less of the energy is dissipated as heat, and the EGT is lower in the exhaust port. Therefore, it is not easy to assign an optimum EGT for engine design or operation; rather, its normal range should be considered as an indicator for normal operation and performance. If EGT is higher or lower than the normal range, this indicates that some engine operation parameter needs adjustment, such as injection timing or air–fuel ratio.
4. Conclusions
This study assesses the economic and technological potential for producing liquid fuel (biodiesel) and solid fuel (biomass pellets) from desert palm date seeds. We developed a detailed model framework for a 1000 t/y plant based on optimum production conditions defined in previous research and used this to simulate relevant processes and identify mass and energy flows in order to evaluate the economic viability of the proposed plant. Next, we produced actual biodiesel from date seed oil (again based on the optimum conditions) and tested four blends against pure baseline diesel in a test engine rig to assess performance under varying operating conditions including load and rpm. The following conclusions can be drawn:
- o
- Based on a DSPP of 70% WPP, the estimated values for NPV, PBT, and ROI were $6.42 million, 5 y, and 14.2%. As the price ratio dropped to 60%, these economic metrics fell sharply, and the investment became unfeasible.
- o
- The economic performance of investment in this project was very sensitive to variations in DSPP, resulting in serious investment risk. Possible solutions include introducing other waste streams (such as coffee waste and tallow) as parent feedstocks or scaling up the plant’s capacity to save on initial investment and use feedstock from neighboring countries.
- o
- BP, BTE, and BSFC values of the DSO biodiesel blends were comparable to those of the baseline diesel, although the latter was superior. On average, the reductions for these metrics at full load for B20 were 4.5%, 7.65%, and 9.84%, respectively. At half load, these reductions for B5 were 0.32%, 1%, and 1.44%, respectively.
- o
- DSO biodiesel blends outperformed the baseline diesel in EGT, with average EGT drops of 29 and 46.7 °C at full load for B5 and B20, respectively. At half load, EGT drops with averages of 10.1% and 14.4% for B10 and B15, respectively.
Our results demonstrate the real potential for considering DSO as a parent feedstock for biodiesel production in date-producing countries and provide useful information for investors or researchers interested in pursuing this renewable fuel. As future investigations, the authors recommend investigating the economic, environmental, and technical viabilities of blending date seed feed stock with other waste streams to produce second generation biodiesel.
Author Contributions
Conceptualization, M.K.; methodology, M.K. and F.M.A.; formal analysis, M.K. and F.M.A.; investigation, M.K. and F.M.A.; data curation, M.K. and F.M.A.; writing—original draft preparation, M.K.; writing—review and editing, M.K.; supervision, M.K.; funding acquisition, M.K. All authors have read and agreed to the published version of the manuscript.
Funding
This research was funded by the University of Sharjah, UAE [grant number V.C.R.G./R.1285/2017].
Data Availability Statement
The data presented in this study are available on request from the corresponding author.
Acknowledgments
The authors would like to express their gratitude to the following institutions, laboratories, and inspection bodies for their support of this project: University of Sharjah, Lootah Biofuels LLC (UAE), Bureau Veritas–Inspectorate (UAE), Materials Laboratory (UAE), GHP Testing & Calibration Laboratory (UAE), and Dubai Central Laboratory (Food and Environment Laboratory Section).
Conflicts of Interest
The authors declare no conflict of interest.
Nomenclature
| DSO | Date seed oil |
| EGT | Exhaust gas temperature |
| ASTM | American Society for Testing and Materials |
| BP | Brake power |
| BSFC | Brake specific fuel consumption |
| BTE | Brake thermal efficiency |
| CI | Compression ignition |
| ISO | International Organization for Standardization |
| EN | European norms |
| Total capital cost | |
| Annual production cost | |
| Fixed capital cost | |
| Working capital cost | |
| Direct costs | |
| Initial construction expenses | |
| Equipment costs | |
| Indirect costs | |
| Engineering expenses | |
| Contractor fees | |
| Contingency allowance | |
| The cost at a reference condition of pressure and materials | |
| Correction factor | |
| Expenditures required to start up the plant | |
| Direct production cost | |
| Indirect production cost | |
| DSPP | Date seed pelletized pellets |
| WPP | Wood pelletized pellets |
| Annual net cash flow at any year | |
| Net annual profit | |
| Total annual expense | |
| CNCF | Cumulative net cash flow |
| NPW | Net present worth |
| ROI | Return on investment |
| PBT | Payback time |
References
- Asokan, M.; Prabu, S.S.; Bade, P.K.K.; Nekkanti, V.M.; Gutta, S.S.G. Performance, combustion and emission characteristics of juliflora biodiesel fuelled DI diesel engine. Energy 2019, 173, 883–892. [Google Scholar] [CrossRef]
- Organization of the Petroleum Exporting Countries (OPEC); World Oil Outlook 2040: Vienna, Austria, 2017.
- Rajak, U.; Nashine, P.; Verma, T.N. Assessment of diesel engine performance using spirulina microalgae biodiesel. Energy 2018, 166, 1025–1036. [Google Scholar] [CrossRef]
- Rosha, P.; Mohapatra, S.K.; Mahla, S.K.; Cho, H.; Chauhan, B.S.; Dhir, A. Effect of compression ratio on combustion, performance, and emission characteristics of compression ignition engine fueled with palm (B20) biodiesel blend. Energy 2019, 178, 676–684. [Google Scholar] [CrossRef]
- Armin, M.; Gholinia, M. Comparative evaluation of energy, performance, and emission characteristics in dual-fuel (CH4/Diesel) heavy-duty engine with RCCI combustion mode. Results Eng. 2022, 16, 100766. [Google Scholar] [CrossRef]
- Madihi, R.; Pourfallah, M.; Gholinia, M.; Armin, M.; Ghadi, A. Thermofluids analysis of combustion, emissions, and energy in a biodiesel (C11H22O2)/natural gas heavy-duty engine with RCCI mode (Part II: Fuel injection time/Fuel injection rate). Int. J. Thermofluids 2022, 16, 100200. [Google Scholar] [CrossRef]
- Madihi, R.; Pourfallah, M.; Gholinia, M.; Armin, M.; Ghadi, A. Thermofluids analysis of combustion, emissions, and energy in a biodiesel (C11H22O2)/natural gas heavy-duty engine with RCCI mode (Part I: Single/two -stage injection). Int. J. Thermofluids 2022, 16, 100200. [Google Scholar] [CrossRef]
- Scheffran, J. The Global Demand for Biofuels: Technologies, Markets and Policies. In Biomass to Biofuels Strategies for Global Industries; Vertes, A.A., Qureshi, N., Blaschek, H.P., Yukawa, H., Eds.; Wiley: West Sussex, UK, 2010; pp. 27–54. [Google Scholar]
- Johnston, M.; Holloway, T. A Global Comparison of National Biodiesel Production Potentials. Environ. Sci. Technol. 2007, 41, 7967–7973. [Google Scholar] [CrossRef]
- Hughes, S.R.; Qureshi, N. Biofuel Demand Realization. In Biomass to Biofuels Strategies for Global Industries; Vertes, A.A., Qureshi, N., Blaschek, H.P., Yukawa, H., Eds.; Wiley: West Sussex, UK, 2010; pp. 55–70. [Google Scholar]
- Luque, R.; Lin, C.S.; Wilson, K.; Clark, J.H. Handbook of Biofuels Production: Processes and Technologies, 2nd ed.; Woodhead Publishing: Duxford, UK, 2016. [Google Scholar]
- Kamil, M.; Ramadan, K.M.; Awad, O.I.; Ibrahim, T.K.; Inayat, A.; Ma, X. Environmental impacts of biodiesel production from waste spent coffee grounds and its implementation in a compression ignition engine. Sci. Total. Environ. 2019, 675, 13–30. [Google Scholar] [CrossRef]
- Aboelazayem, O.; Gadalla, M.; Saha, B. Valorisation of high acid value waste cooking oil into biodiesel using supercritical methanolysis: Experimental assessment and statistical optimisation on typical Egyptian feedstock. Energy 2018, 162, 408–420. [Google Scholar] [CrossRef]
- Azeem, M.W.; Hanif, M.A.; Al-Sabahi, J.N.; Khan, A.A.; Naz, S.; Ijaz, A. Production of biodiesel from low priced, renewable and abundant date seed oil. Renew. Energy 2016, 86, 124–132. [Google Scholar] [CrossRef]
- Afiq, A.; Rahman, A.; Man, C. Date seed and date seed oil. Int. Food Res. J. 2013, 20, 2035–2043. [Google Scholar]
- Besbes, S.; Drira, L.; Blecker, C.; Deroanne, C.; Attia, H. Adding value to hard date (Phoenix dactylifera L.): Compositional, functional and sensory characteristics of date jam. Food Chem. 2009, 112, 406–411. [Google Scholar] [CrossRef]
- FAOSTAT. Statistical databases of the Food and Agriculture Organization of the United Nations. 2020. Available online: http://www.fao.org/faostat/en/#home (accessed on 17 December 2019).
- The British Petroleum Company, BP. BP Statistical Review of World Energy, June 2017. Available online: https://www.bp.com/content/dam/bp/en/corporate/pdf/energy-economics/statistical-review-2017/bp-statistical-review-of-world-energy-2017-full-report.pdf (accessed on 23 August 2018).
- Jamil, F.; Al-Muhtaseb, A.H.; Al-Haj, L.; Al-Hinai, M.A.; Hellier, P.; Rashid, U. Optimization of oil extraction from waste “Date pits” for biodiesel production. Energy Convers. Manag. 2016, 117, 264–272. [Google Scholar] [CrossRef]
- Al-Zuhair, S.; Taher, H.; Al Dhaheri, S.; Wajeeh, S.; Nour, M.; El-Najjar, E. Biodiesel Production from Oils Extracted from Date Pits. Green Sustain. Chem. 2017, 7, 48–56. [Google Scholar] [CrossRef]
- Akaagerger, S.M.; Giwa, S.O.; Ibrahim, M.G.A. Production of biodiesel from desert date seed oil. Int. J. ChemTech Res. 2016, 9, 453–463. [Google Scholar]
- Farooq, M.; Ramli, A.; Naeem, A.; Mahmood, T.; Ahmad, S.; Humayun, M.; Islam, M.G.U. Biodiesel production from date seed oil (Phoenix dactylifera L.) via egg shell derived heterogeneous catalyst. Chem. Eng. Res. Des. 2018, 132, 644–651. [Google Scholar] [CrossRef]
- Xue, J.; Grift, T.E.; Hansen, A.C. Effect of biodiesel on engine performances and emissions. Renew. Sustain. Energy Rev. 2011, 15, 1098–1116. [Google Scholar] [CrossRef]
- Honeywell International. UniSim Design: User Guide; Honeywell International: Rolle, Switzerland, 2017.
- Sheehan, J.; Camobreco, V.; Duffield, J.; Graboski, M.; Shapouri, H. Life Cycle Inventory of Biodiesel and Petroleum Diesel for Use in an Urban Bus; National Renewable Energy Laboratory: Golden, CO, USA, 1998. [Google Scholar]
- Giller, C.; Malkani, B.; Parasar, J. Coffee to Biofuels. University of Pennsylvania. 2017. Available online: http://repository.upenn.edu/cbe_sdr/94 (accessed on 27 November 2018).
- Dimian, A.C.; Bildea, C.S. Chemical Process Design: Computer-Aided Case Studies; Wiley-VCH Verlag GmbH & Co. KgaA: Weinheim, Germany, 2008. [Google Scholar]
- Turton, R.; Bailie, R.C.; Whiting, W.B.; Shaeiwitz, J.A.; Bhattacharyya, D. Analysis, Synthesis and Design of Chemical Processes, 4th ed.; Prentice Hall: Upper Saddle River, NJ, USA, 2012. [Google Scholar]
- Sinnott, R.K. Chemical Engineering: Chemical Engineering Design, 4th ed.; Coulson and Richardson’s Chemical Engieering Series; Elsevier Butterworth-Heinemann: Chennai, India, 2005. [Google Scholar]
- Peters, M.S.; Timmerhaus, K.D.; West, R.E. Plant Design and Economics for Chemical Engineers, 5th ed.; McGraw-Hill: New York, NY, USA, 2004. [Google Scholar]
- Hill, J.; Nelson, E.; Tilman, D.; Polasky, S.; Tiffany, D. Environmental, economic, and energetic costs and benefits of bio-diesel and ethanol biofuels. Proc. Natl. Acad. Sci. USA 1999, 96, 5903–5907. [Google Scholar]
- National Research Council. Water Implications of Biofuels Production in the United States; National Academies Press: Washington, DC, USA, 2008. [Google Scholar] [CrossRef]
- Skarlis, S.; Kondili, E.; Kaldellis, J. Small-scale biodiesel production economics: A case study focus on Crete Island. J. Clean. Prod. 2012, 20, 20–26. [Google Scholar] [CrossRef]
- Karmee, S.K.; Patria, R.D.; Lin, C.S.K. Techno-Economic Evaluation of Biodiesel Production from Waste Cooking Oil—A Case Study of Hong Kong. Int. J. Mol. Sci. 2015, 16, 4362–4371. [Google Scholar] [CrossRef]
- European Pellet Council. Pellet Market Overview; European Biomass Association: Brussels, Belgium, 2017. [Google Scholar]
- Bart, J.C.; Palmeri, N.; Cavallaro, S. Biodiesel Science and Technology: FROM Soil to Oil; Elsevier Science & Technology: Cornwall, UK, 2010. [Google Scholar]
- Duncan, J. Costs of Biodiesel Production; Energy Efficiency and Conservation Authority: Wellington, New Zealand, 2003. [Google Scholar]
- Methanex. Methanex Methanol Price Sheet. Available online: https://www.methanex.com/our-business/pricing (accessed on 21 February 2019).
- Qingdao Echemi Technology. Sodium Hydroxide Price Analysis. 2019. Available online: http://www.echemi.com/productsInformation/pd20150901041-caustic-soda-pearls.html (accessed on 20 February 2019).
- Apostolakou, A.; Kookos, I.; Marazioti, C.; Angelopoulos, K. Techno-economic analysis of a biodiesel production process from vegetable oils. Fuel Process. Technol. 2009, 90, 1023–1031. [Google Scholar] [CrossRef]
- Green, D.W.; Perry, R.H. Perry’s Chemical Engineers’ Handbook, 8th ed.; McGraw-Hill: New York, NY, USA, 2008. [Google Scholar]
- Sadhukhan, J.; Ng, K.S.; Hernandez, E.M. Biorefineries and Chemical Processes: Design, Intgration and Sustainability Analysis; John Wiley & Sons, Ltd.: West Sussex, UK, 2014. [Google Scholar]
- Towler, G.P.; Sinnott, R.K. Chemical Engineering Design: Principles, Practice, and Economics of Plant and Process Design, 2nd ed.; Butterworth-Heinemann: New York, NY, USA, 2013. [Google Scholar]
- Aydin, H.; Bayindir, H. Performance and emission analysis of cottonseed oil methyl ester in a diesel engine. Renew. Energy 2010, 35, 588–592. [Google Scholar] [CrossRef]
- Hazar, H. Effects of biodiesel on a low heat loss diesel engine. Renew. Energy 2009, 34, 1533–1537. [Google Scholar] [CrossRef]
- Ozsezen, A.N.; Canakci, M.; Turkcan, A.; Sayin, C. Performance and combustion characteristics of a DI diesel engine fueled with waste palm oil and canola oil methyl esters. Fuel 2009, 88, 629–636. [Google Scholar] [CrossRef]
- Carraretto, C.; Macor, A.; Mirandola, A.; Stoppato, A.; Tonon, S. Biodiesel as alternative fuel: Experimental analysis and energetic evaluations. Energy 2004, 29, 2195–2211. [Google Scholar] [CrossRef]
- Reyes, J.; Sepúlveda, M. PM-10 emissions and power of a Diesel engine fueled with crude and refined Biodiesel from salmon oil. Fuel 2006, 85, 1714–1719. [Google Scholar] [CrossRef]
- Utlu, Z.; Koçak, M.S. The effect of biodiesel fuel obtained from waste frying oil on direct injection diesel engine performance and exhaust emissions. Renew. Energy 2008, 33, 1936–1941. [Google Scholar] [CrossRef]
- Lin, B.-F.; Huang, J.-H.; Huang, D.-Y. Experimental study of the effects of vegetable oil methyl ester on DI diesel engine performance characteristics and pollutant emissions. Fuel 2009, 88, 1779–1785. [Google Scholar] [CrossRef]
- Öner, C.; Altun, Ş. Biodiesel production from inedible animal tallow and an experimental investigation of its use as alternative fuel in a direct injection diesel engine. Appl. Energy 2009, 86, 2114–2120. [Google Scholar] [CrossRef]
- Al-Widyan, M.I.; Tashtoush, G.; Abu-Qudais, M. Utilization of ethyl ester of waste vegetable oils as fuel in diesel engines. Fuel Process. Technol. 2002, 76, 91–103. [Google Scholar] [CrossRef]
- Qi, D.; Geng, L.; Chen, H.; Bian, Y.; Liu, J.; Ren, X. Combustion and performance evaluation of a diesel engine fueled with biodiesel produced from soybean crude oil. Renew. Energy 2009, 34, 2706–2713. [Google Scholar] [CrossRef]
- Lapuerta, M.; Herreros, J.M.; Lyons, L.L.; García-Contreras, R.; Briceño, Y. Effect of the alcohol type used in the production of waste cooking oil biodiesel on diesel performance and emissions. Fuel 2008, 87, 3161–3169. [Google Scholar] [CrossRef]
- Ghobadian, B.; Rahimi, H.; Nikbakht, A.; Najafi, G.; Yusaf, T. Diesel engine performance and exhaust emission analysis using waste cooking biodiesel fuel with an artificial neural network. Renew. Energy 2009, 34, 976–982. [Google Scholar] [CrossRef]
- Hull, A.; Golubkov, I.; Kronberg, B.; van Stam, J. Alternative Fuel for a Standard Diesel Engine. Int. J. Engine Res. 2006, 7, 51–63. [Google Scholar] [CrossRef]
- Meng, X.; Chen, G.; Wang, Y. Biodiesel production from waste cooking oil via alkali catalyst and its engine test. Fuel Process. Technol. 2008, 89, 851–857. [Google Scholar] [CrossRef]
- Pal, A.; Verma, A.; Kachhwaha, S.; Maji, S. Biodiesel production through hydrodynamic cavitation and performance testing. Renew. Energy 2010, 35, 619–624. [Google Scholar] [CrossRef]
- da Silva, F.N.; Prata, A.S.; Teixeira, J.R. Technical feasibility assessment of oleic sunflower methyl ester utilisation in Diesel bus engines. Energy Convers. Manag. 2003, 44, 2857–2878. [Google Scholar] [CrossRef]
- Ramadhas, A.; Muraleedharan, C.; Jayaraj, S. Performance and emission evaluation of a diesel engine fueled with methyl esters of rubber seed oil. Renew. Energy 2005, 30, 1789–1800. [Google Scholar] [CrossRef]
- Genzale, C.L.; Pickett, L.M.; Kook, S. Liquid Penetration of Diesel and Biodiesel Sprays at Late-Cycle Post-Injection Conditions. SAE Int. J. Engines 2010, 3, 479–495. [Google Scholar] [CrossRef]
- He, X.; Williams, A.; Christensen, E.; Burton, J.; McCormick, R. Biodiesel Impact on Engine Lubricant Dilution During Active Regeneration of Aftertreatment Systems. SAE Int. J. Fuels Lubr. 2011, 4, 158–178. [Google Scholar] [CrossRef]
- Campbell, M.G.; Martin, E.P. Substrate Selection for a Diesel Catalyst. SAE Trans. 1995, 104, 725–731. [Google Scholar] [CrossRef]
- Pradhan, P.; Raheman, H.; Padhee, D. Combustion and performance of a diesel engine with preheated Jatropha curcas oil using waste heat from exhaust gas. Fuel 2014, 115, 527–533. [Google Scholar] [CrossRef]
- Raheman, H.; Phadatare, A. Diesel engine emissions and performance from blends of karanja methyl ester and diesel. Biomass- Bioenergy 2004, 27, 393–397. [Google Scholar] [CrossRef]
- Arbab, M.; Masjuki, H.; Varman, M.; Kalam, M.; Imtenan, S.; Sajjad, H. Experimental Investigation of Optimum Blend Ratio of Jatropha, Palm and Coconut Based Biodiesel to Improve Fuel Properties, Engine Performance and Emission Characteristics; SAE Technical Paper. 2013. Available online: https://saemobilus.sae.org/content/2013-01-2675/ (accessed on 24 December 2022).
- Ferguson, C.R.; Kirkpatrick, A.T. Internal Combustion Engines: Applied Thermosciences, 3rd ed.; John Wiley & Sons: Hoboken, NJ, USA, 2016. [Google Scholar]
- Haşimoğlu, C.; Ciniviz, M.; Özsert, I.; Içingür, Y.; Parlak, A.; Salman, M.S. Performance characteristics of a low heat rejection diesel engine operating with biodiesel. Renew. Energy 2008, 33, 1709–1715. [Google Scholar] [CrossRef]
- Armas, O.; Yehliu, K.; Boehman, A.L. Effect of alternative fuels on exhaust emissions during diesel engine operation with matched combustion phasing. Fuel 2010, 89, 438–456. [Google Scholar] [CrossRef]
- Labeckas, G.; Slavinskas, S. The effect of rapeseed oil methyl ester on direct injection Diesel engine performance and exhaust emissions. Energy Convers. Manag. 2006, 47, 1954–1967. [Google Scholar] [CrossRef]
- Haas, M.J.; Scott, K.M.; Alleman, T.L.; McCormick, R.L. Engine Performance of Biodiesel Fuel Prepared from Soybean Soapstock: A High Quality Renewable Fuel Produced from a Waste Feedstock. Energy Fuels 2001, 15, 1207–1212. [Google Scholar] [CrossRef]
- Luján, J.; Bermúdez, V.; Tormos, B.; Pla, B. Comparative analysis of a DI diesel engine fuelled with biodiesel blends during the European MVEG-A cycle: Performance and emissions (II). Biomass Bioenergy 2009, 33, 948–956. [Google Scholar] [CrossRef]
- Özener, O.; Yüksek, L.; Ergenç, A.T.; Özkan, M. Effects of soybean biodiesel on a DI diesel engine performance, emission and combustion characteristics. Fuel 2014, 115, 875–883. [Google Scholar] [CrossRef]
- Al-Lwayzy, S.H.; Yusaf, T. Chlorella protothecoides Microalgae as an Alternative Fuel for Tractor Diesel Engines. Energies 2013, 6, 766–783. [Google Scholar] [CrossRef] [Green Version]
- Heywood, J. Internal Combustion Engine Fundamentals, 2nd ed.; McGraw-Hill Education: New York, NY, USA, 2018. [Google Scholar]
Figure 1.
Top ten global date fruit producers in 2017 [17].
Figure 1.
Top ten global date fruit producers in 2017 [17].

Figure 2.
Flow chart of relevant processes for DSO biodiesel production plant: (a) oil extraction, (b) biomass pellet production, and (c) biodiesel production [27].
Figure 2.
Flow chart of relevant processes for DSO biodiesel production plant: (a) oil extraction, (b) biomass pellet production, and (c) biodiesel production [27].

Figure 3.
The pilot plant (UPB/EV-Elettronica Veneta) used in biodiesel production.
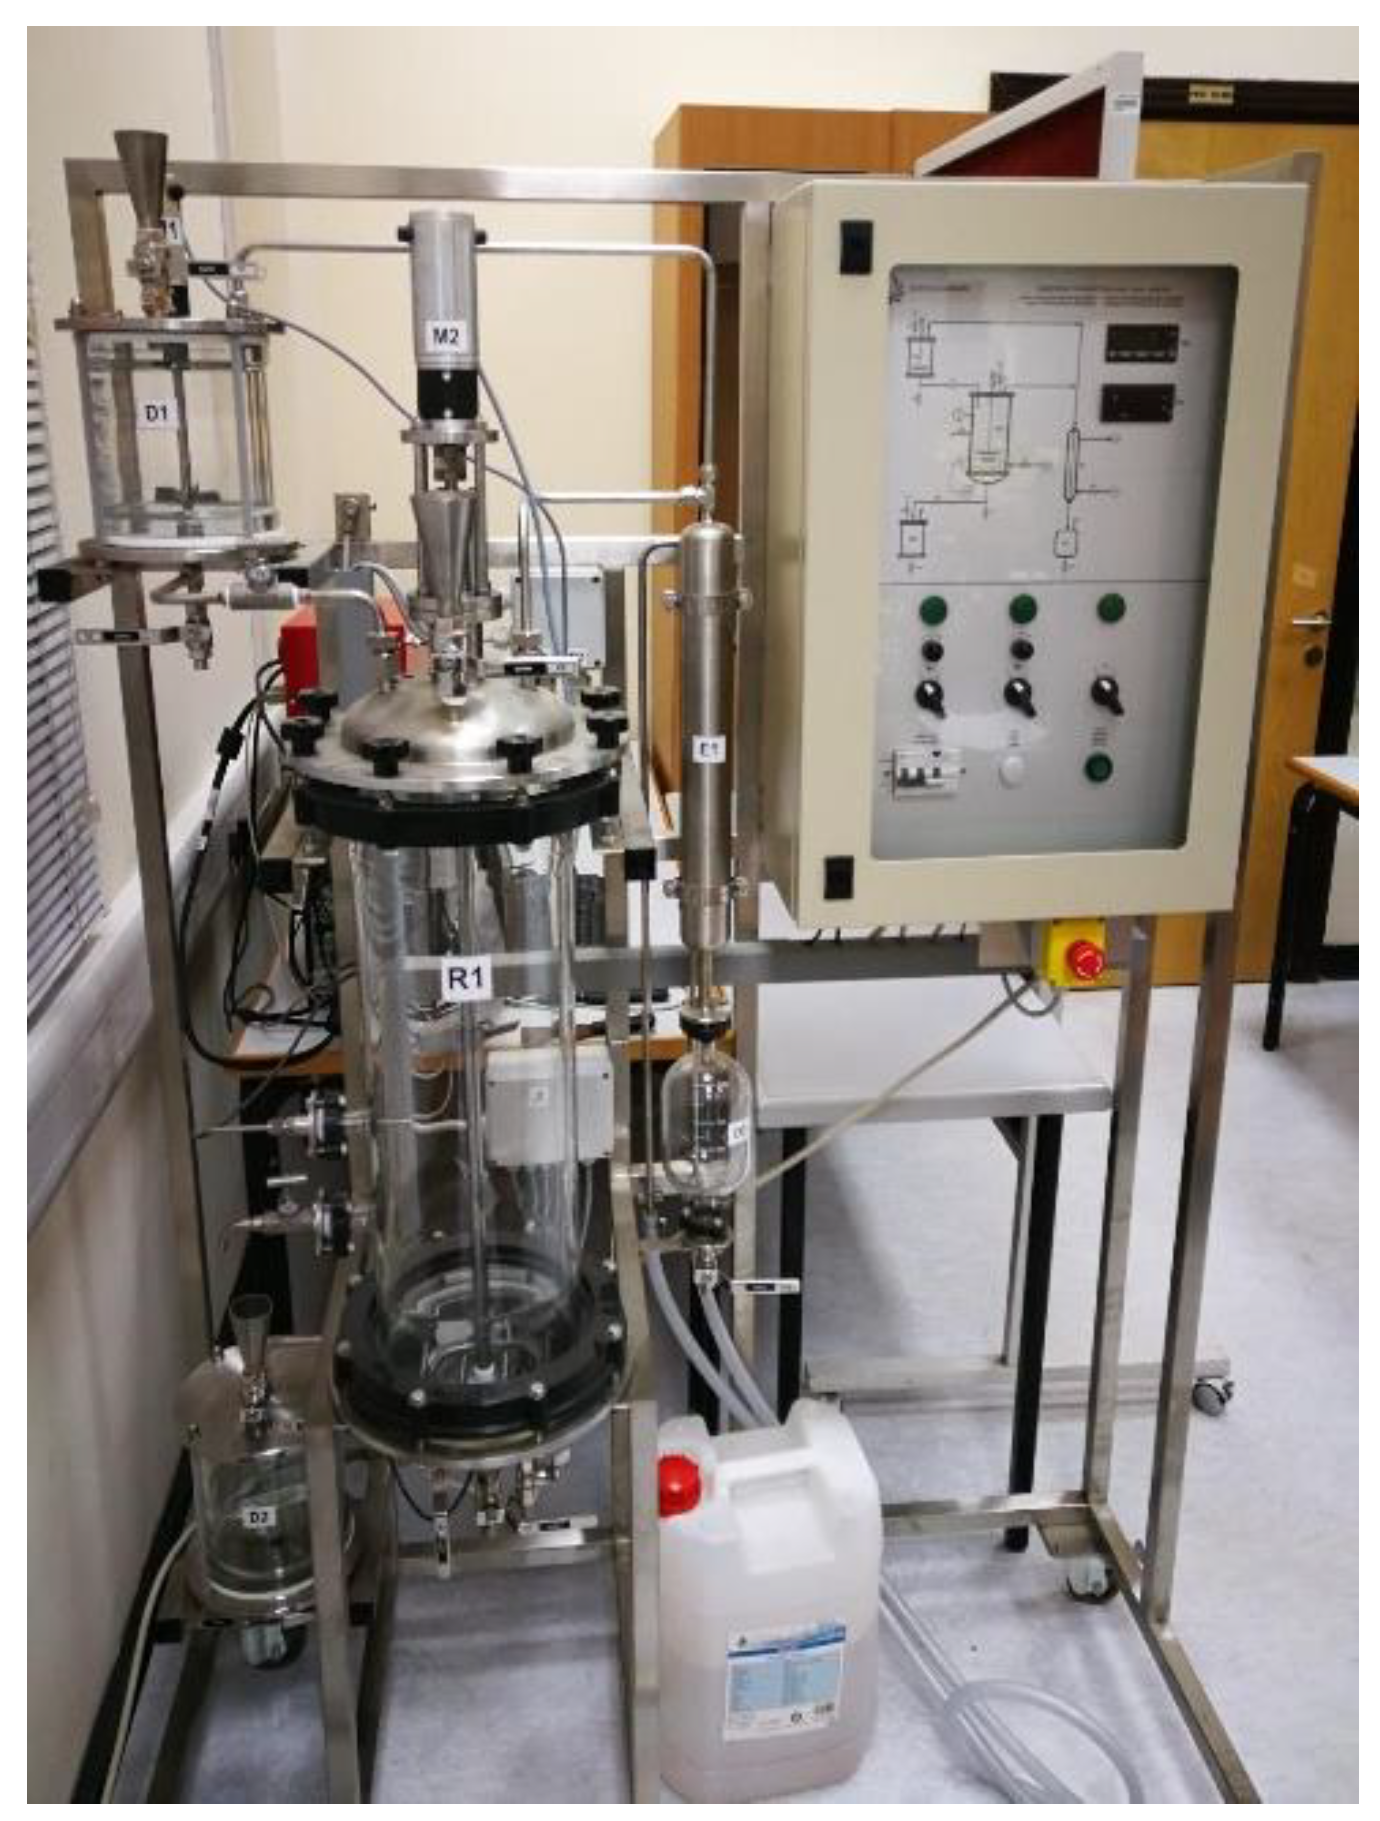
Figure 4.
Engine test rig.
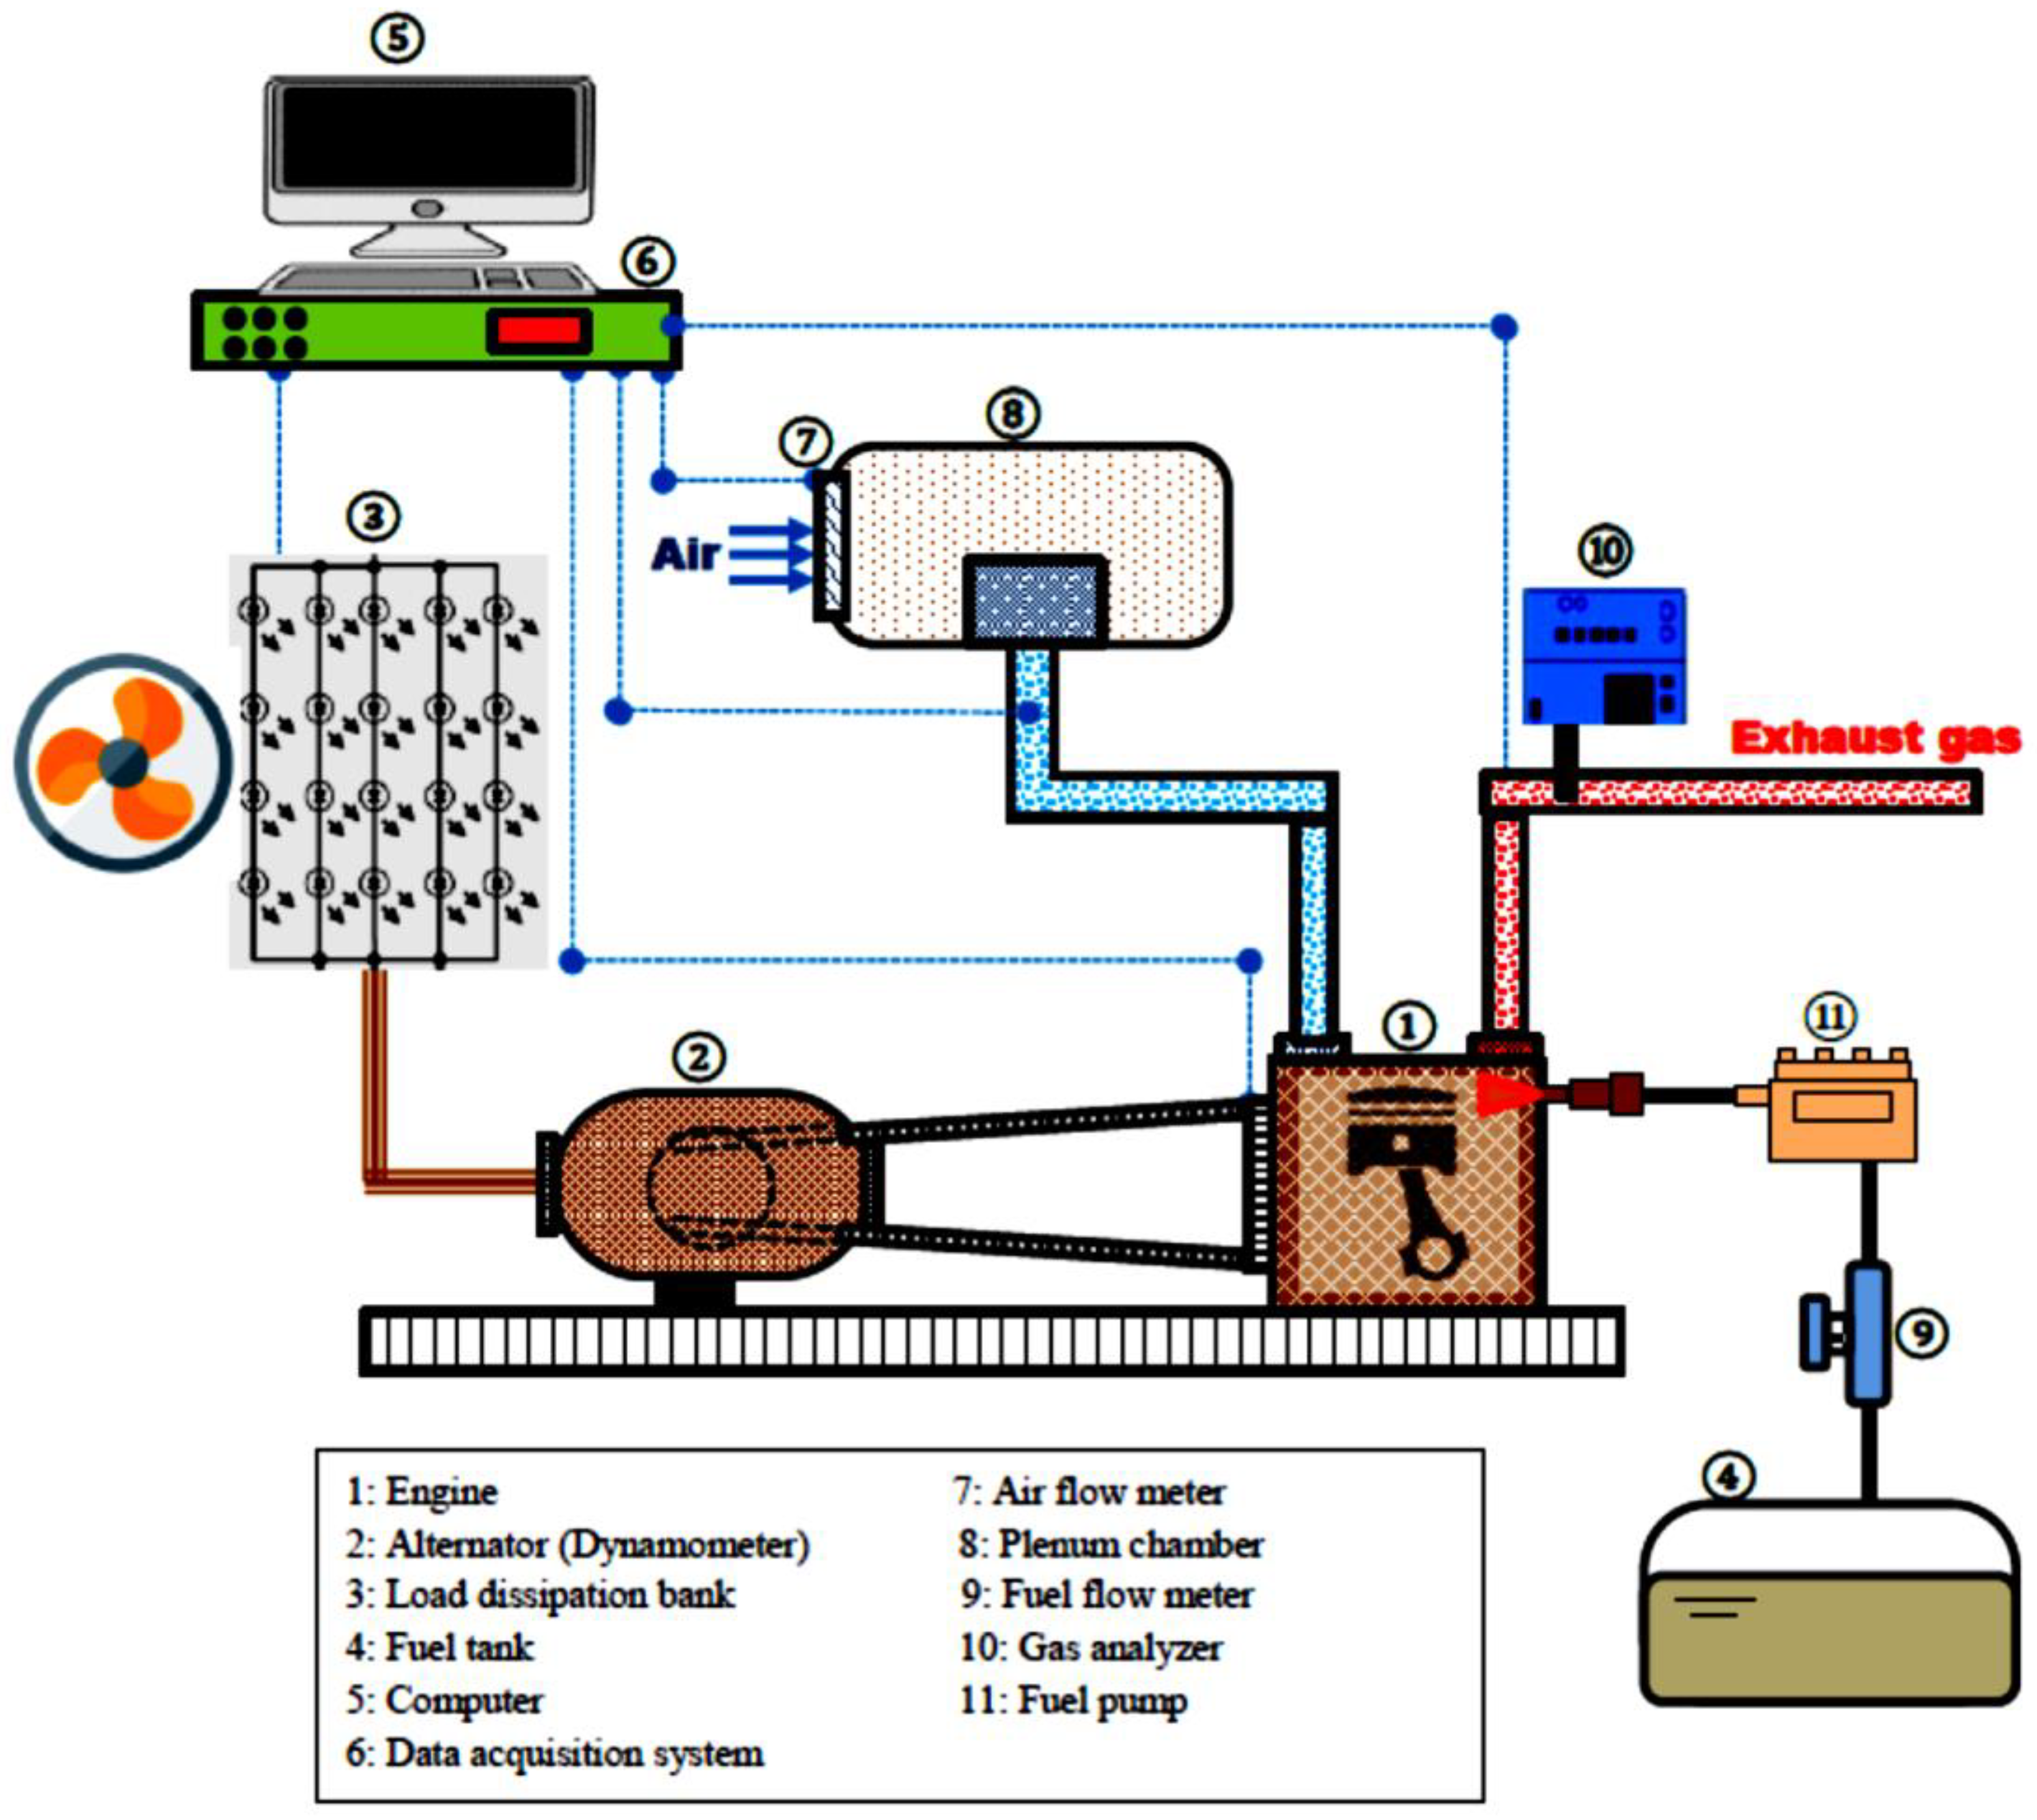
Figure 5.
Economic performance analysis of the 1000 t/y DSO biodiesel plant by: (a) ROI vs. DSPP as % WPP (blue lines mark 0 and the acceptable 12% level) and (b) PBT and NPV by plant lifetime for four DSPP values.
Figure 5.
Economic performance analysis of the 1000 t/y DSO biodiesel plant by: (a) ROI vs. DSPP as % WPP (blue lines mark 0 and the acceptable 12% level) and (b) PBT and NPV by plant lifetime for four DSPP values.
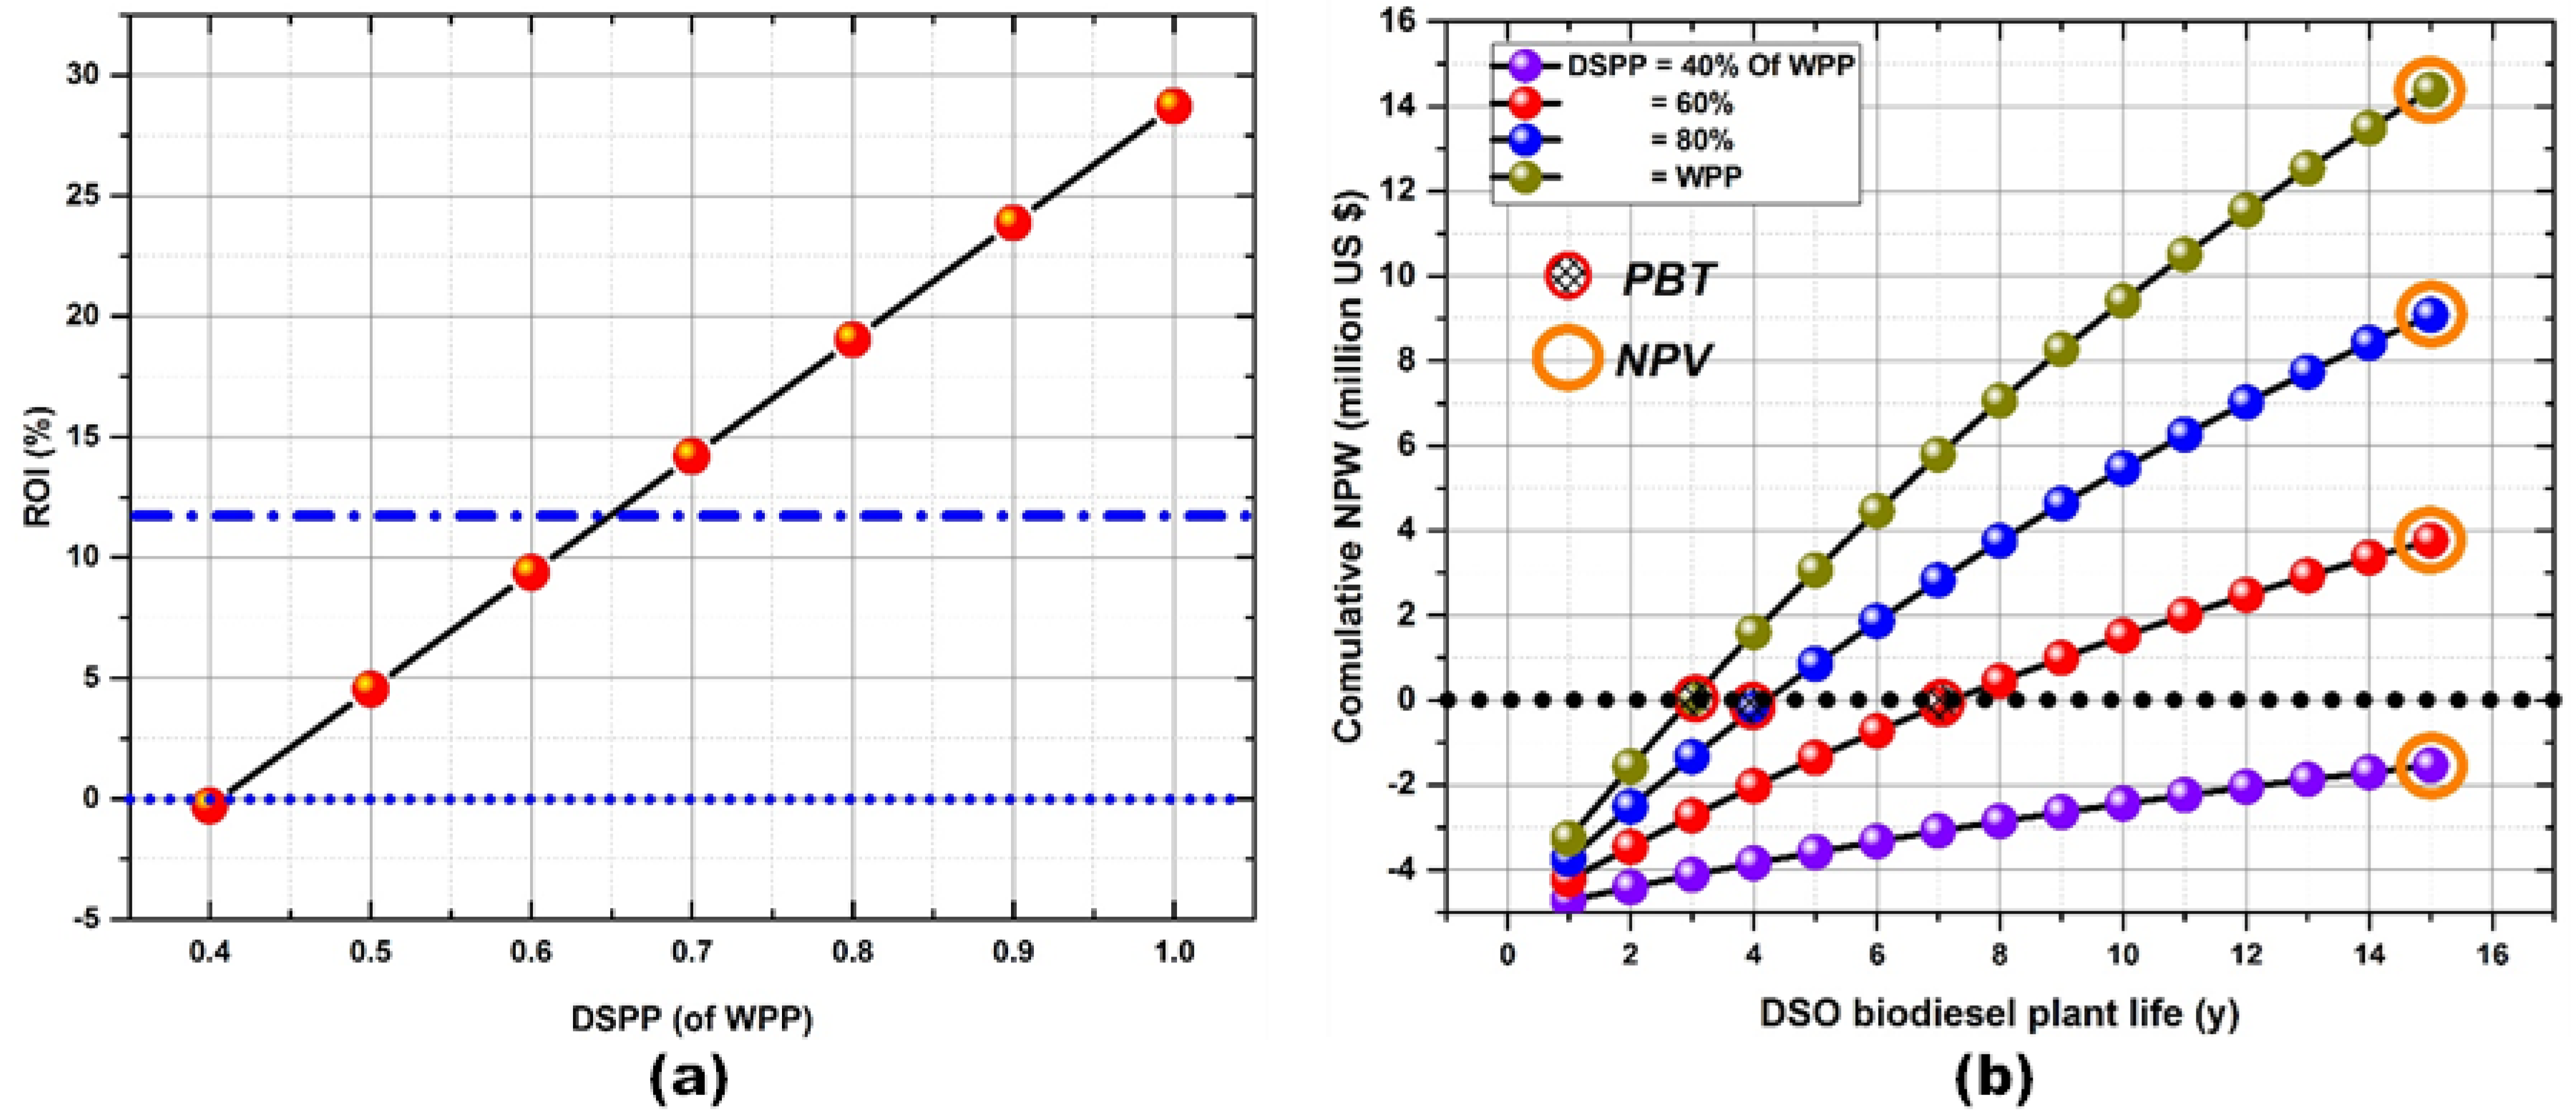
Figure 6.
Brake power variation with engine speed, presented as trends (left) and normalized value contours (right) for: (a) 100% load, (b) 75% load, and (c) 50% load; (d) compares all fuels and loads at 2000 rpm.
Figure 6.
Brake power variation with engine speed, presented as trends (left) and normalized value contours (right) for: (a) 100% load, (b) 75% load, and (c) 50% load; (d) compares all fuels and loads at 2000 rpm.

Figure 7.
Brake thermal efficiency variation with engine speed, presented as trends (left) and normalized value contours (right) for (a) 100% load, (b) 75% load, and (c) 50% load; (d) compares all fuels and loads at 2000 rpm.
Figure 7.
Brake thermal efficiency variation with engine speed, presented as trends (left) and normalized value contours (right) for (a) 100% load, (b) 75% load, and (c) 50% load; (d) compares all fuels and loads at 2000 rpm.
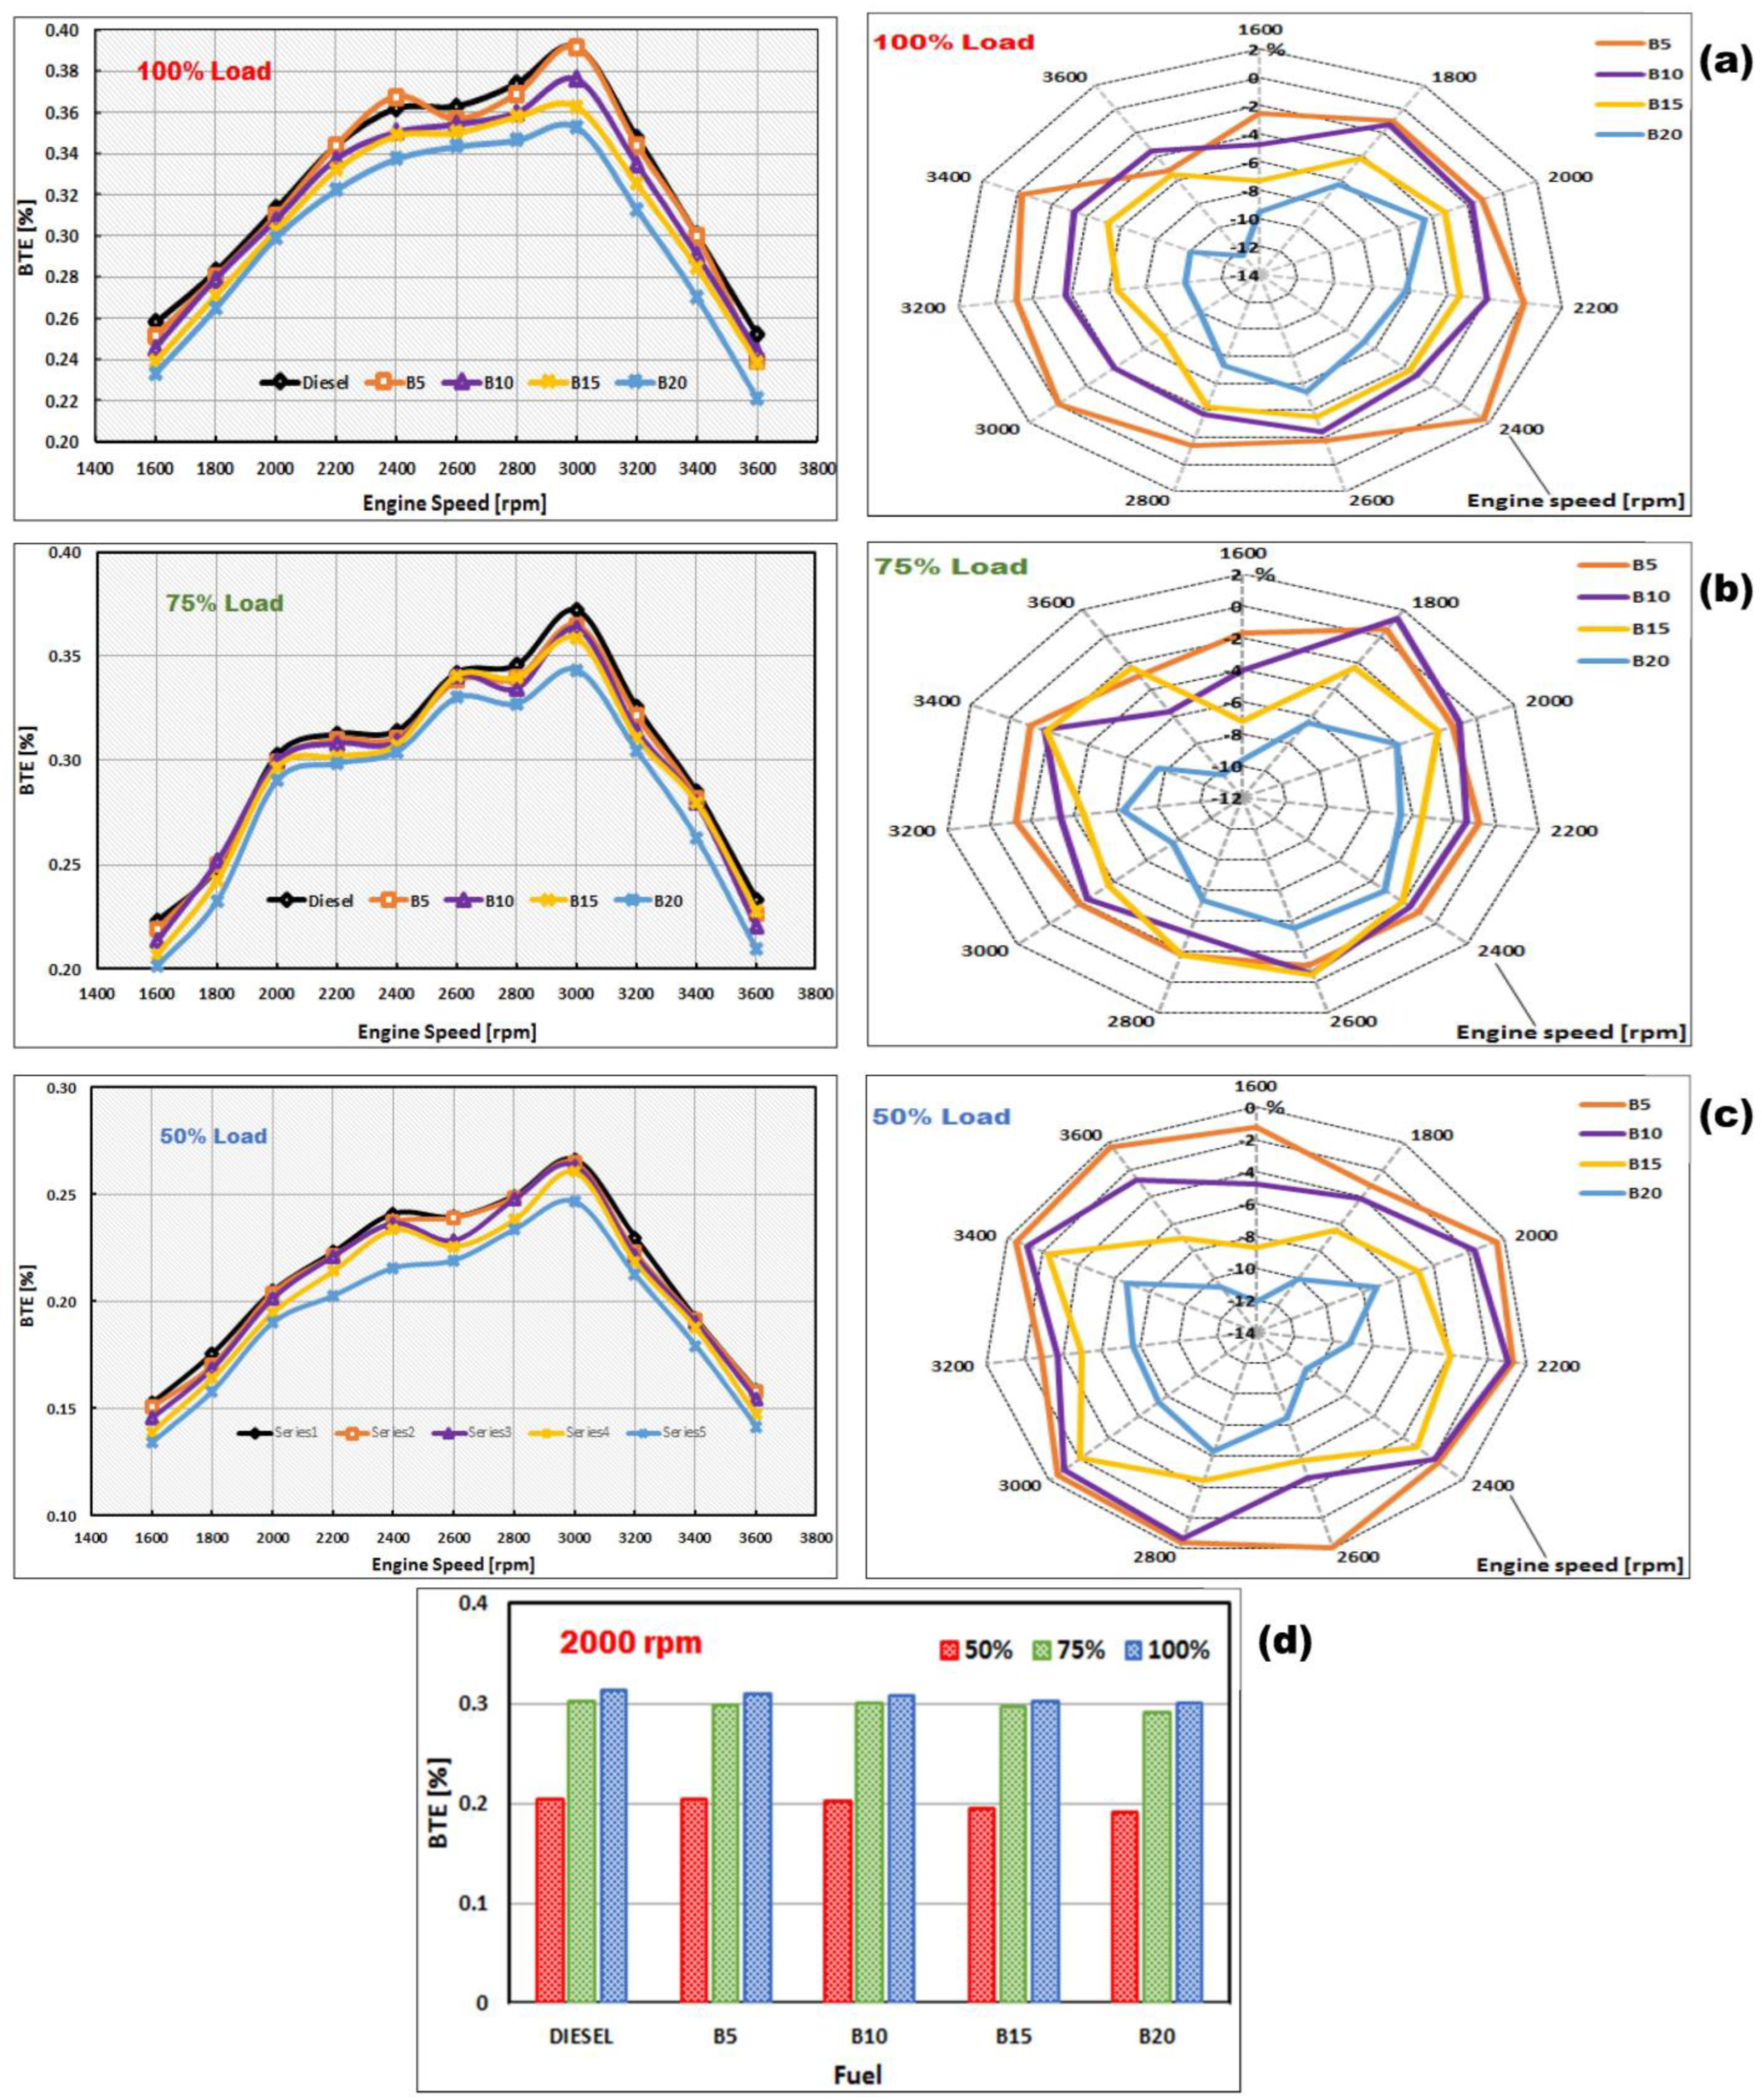
Figure 8.
Brake specific fuel consumption variation with engine speed, presented as trends (left) and normalized value contours (right) for (a) 100% load, (b) 75% load, and (c) 50% load; (d) compares all fuels and loads at 2000 rpm.
Figure 8.
Brake specific fuel consumption variation with engine speed, presented as trends (left) and normalized value contours (right) for (a) 100% load, (b) 75% load, and (c) 50% load; (d) compares all fuels and loads at 2000 rpm.
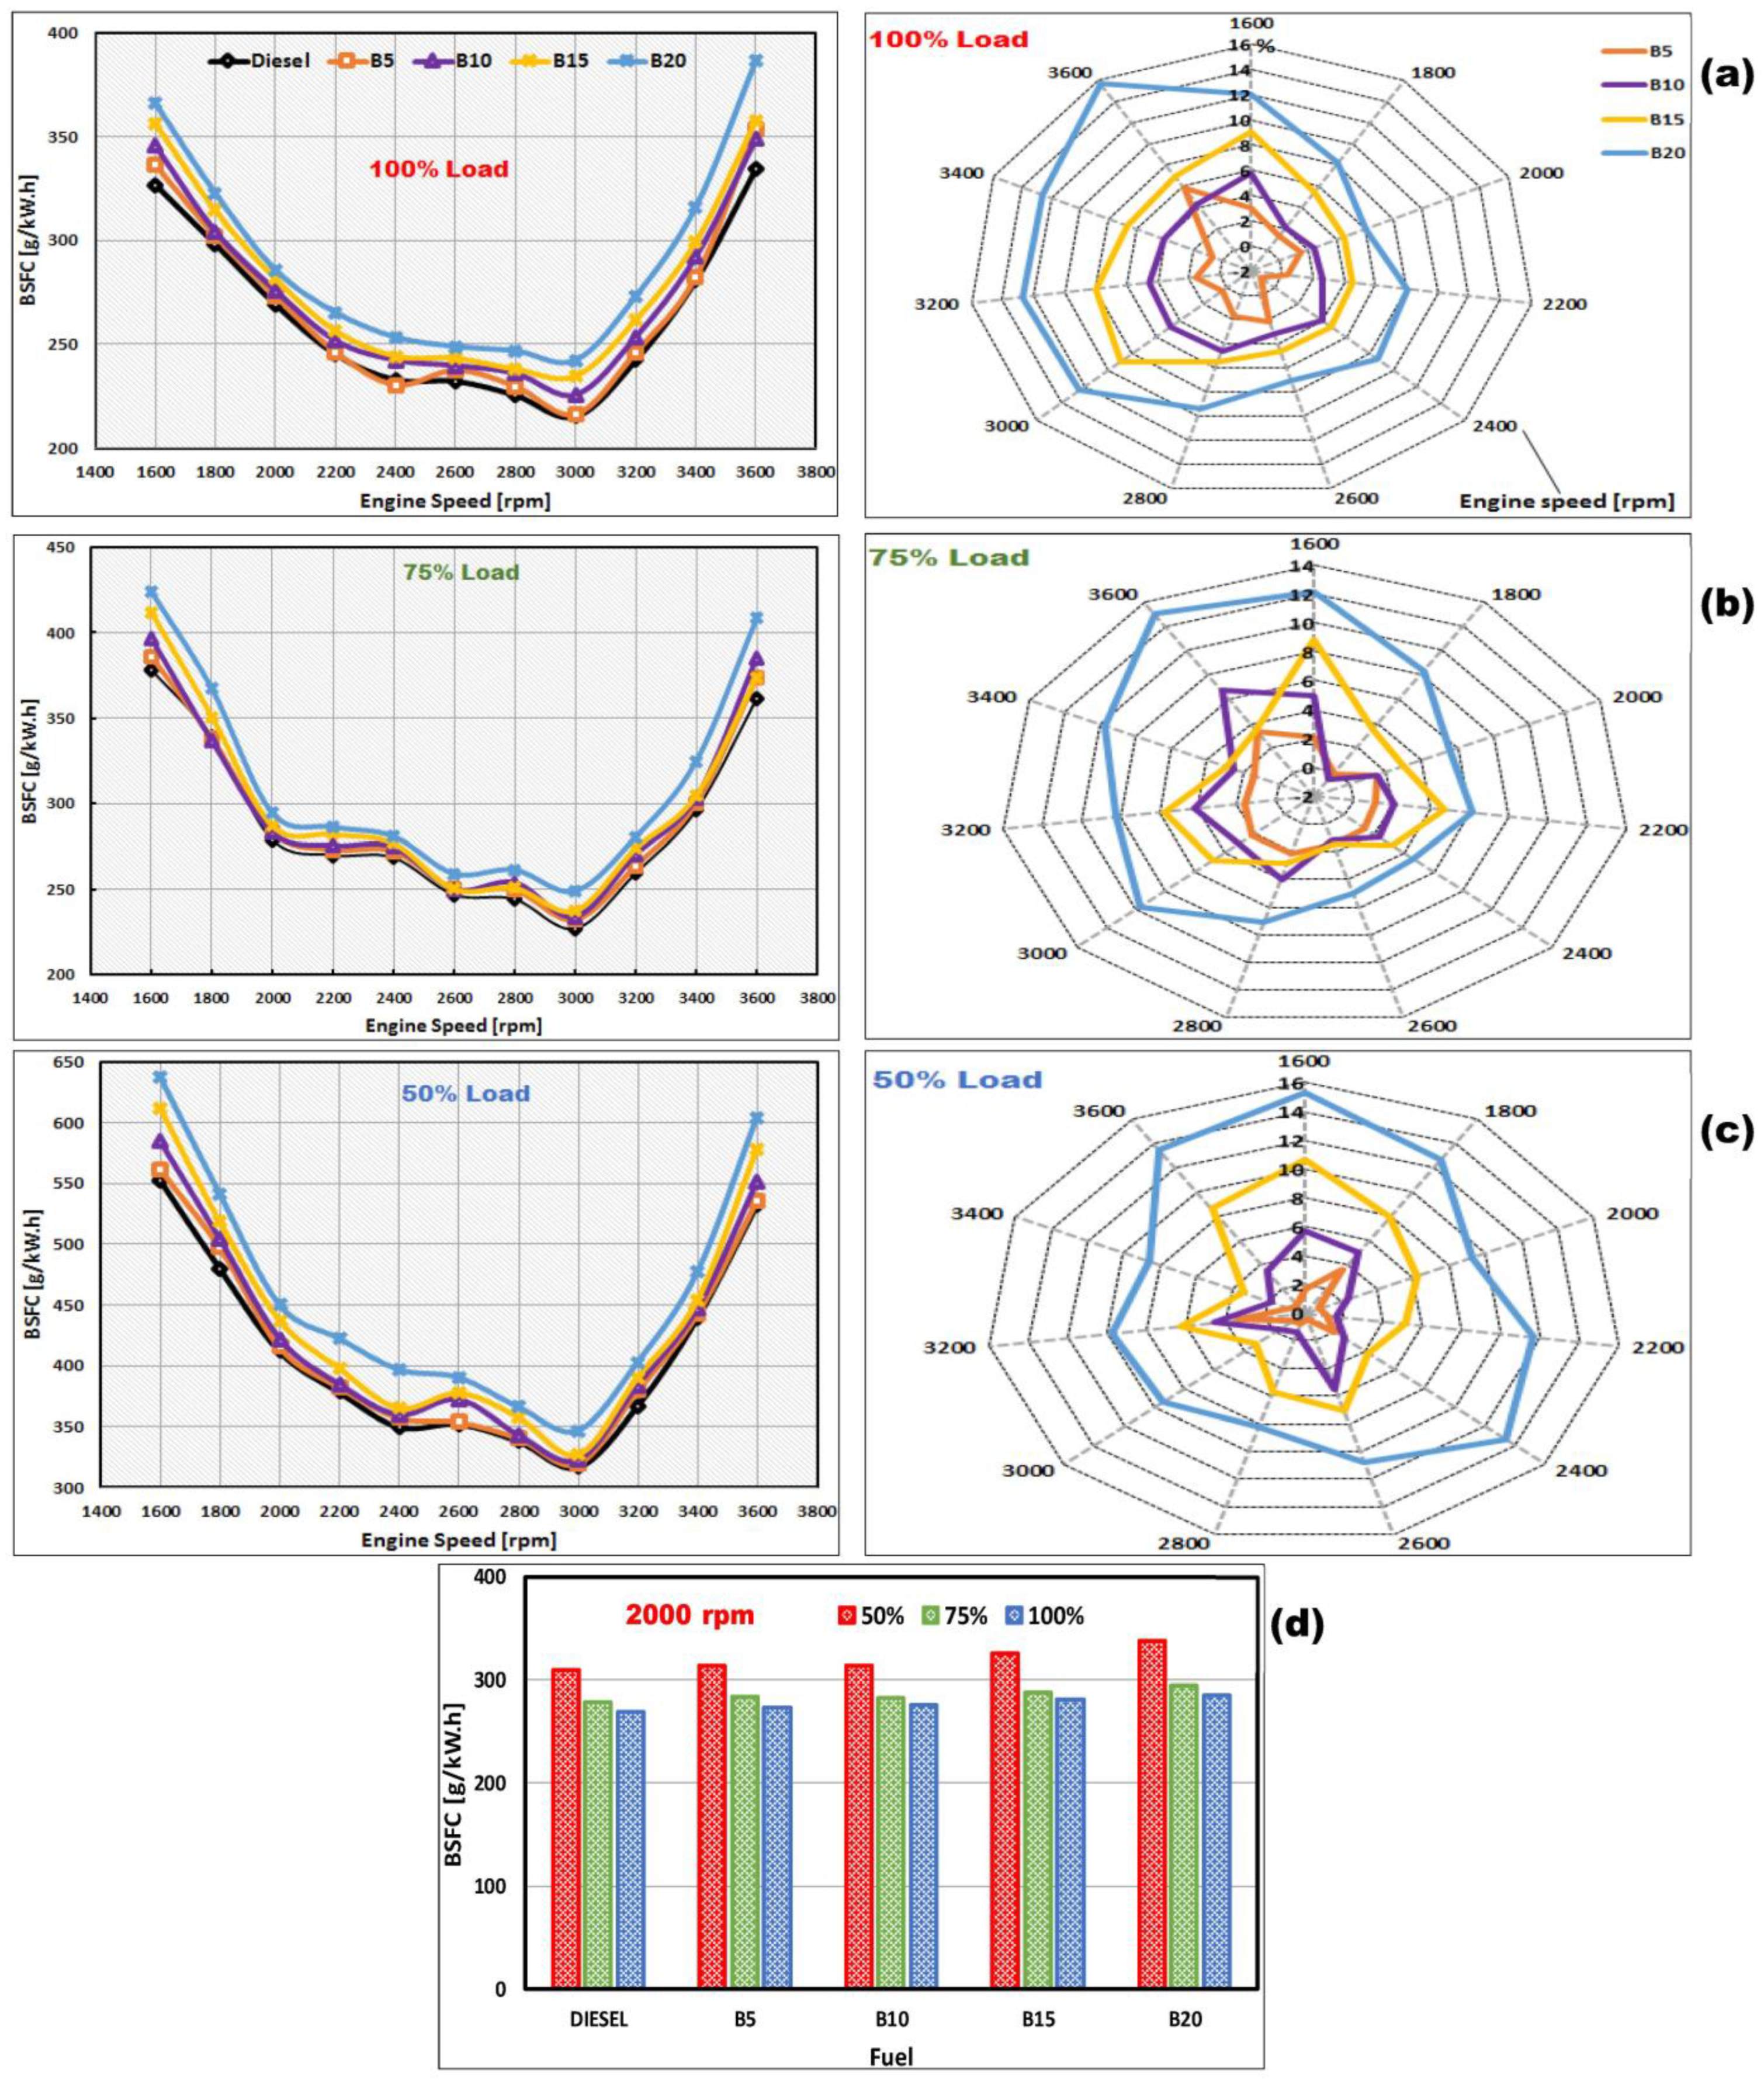
Figure 9.
Exhaust gas temperature variation with engine speed, presented as trends (left) and normalized value contours (right) for (a) 100% load, (b) 75% load, and (c) 50% load; (d) compares all fuels and loads at 2000 rpm.
Figure 9.
Exhaust gas temperature variation with engine speed, presented as trends (left) and normalized value contours (right) for (a) 100% load, (b) 75% load, and (c) 50% load; (d) compares all fuels and loads at 2000 rpm.

Table 1.
Optimum conditions for DSO extraction and DSO biodiesel production.
| Condition/Parameter/Material | Optimum Selection |
|---|---|
| DSO extraction | |
| Method | Solvent extraction (Soxhlet extraction) |
| Solvent | Hexane |
| Temperature (°C) | 60 |
| Time (h) | 4 |
| Solvent:seed ratio (wt./wt.) | 6 |
| Biodiesel production | |
| Alcohol | Methanol |
| Alcohol:DSO molar ratio | 9:1 |
| Catalyst | NaOH |
| Catalyst mass fraction (wt.%) | 1 |
| Time (h) | 1.5 |
| Temperature (○C) | 55 |
Table 2.
Engine test rig specifications.
| Specifications | Unit | Description/Value |
|---|---|---|
| Engine | Lombardini 15-LD-225 | |
| Bore | [mm] | 69 |
| Stroke | [mm] | 60 |
| Displacement volume | [L] | 0.224 |
| Compression ratio | 21 | |
| Power @ 3600 rpm | [kW] | 3.5 |
| Torque @ 2400 rpm | [N·m] | 10.4 |
| Intake valve opens at | degrees BTDC | 6 |
| Intake valve closes | degrees ABDC | |
| Exhaust valve opens | degrees BBDC | |
| Exhaust valve closes | degrees ATDC |
Table 3.
Total capital cost ( ) of a 1000 t/y DSO biodiesel production plant.
| Item | Cost ($) |
|---|---|
| 3,700,000 | |
| 1,110,000 | |
| 4,810,000 | |
| 481,000 | |
| 5,291,000 |
Table 4.
Direct production cost ( ) of a 1000 t/y DSO biodiesel production plant.
| Item | Unit | Unit Cost ($) | Annual Amount | Annual Cost ($) | Remarks |
|---|---|---|---|---|---|
| DFPDS (Parent feedstock) | t | 70 | 11,363 | 795,410 | Price provided by UAE date producers |
| Alcohol (Methanol, CH3OH) | t | 345 | 170.45 | 58,803 | [38] |
| Catalyst (Sodium hydroxide) | t | 600 | 17 | 10,226 | [39] |
| Water | t | 2 | 2000 | 4000 | [34], cost according to UAE tariff |
| Wastewater treatment | t | 2 | 2000 | 4000 | Cost according to UAE tariff |
| Electricity | kWhe | 0.11 | 60,000 | 6600 | [31], cost according to UAE tariff |
| Thermal energy | kWhth | 0.01 | 440,000 | 4400 | [30], cost according to UAE tariff |
| Operating labor | No. | 18,000 | 5 | 90,000 | Based on 5 employees and UAE labor wages |
| Multifarious items | - | - | - | 5550 | 10% of maintenance; maintenance is 5% of [40]. |
| $978,990 | |||||
Table 5.
Indirect production cost ( ) of a 1000 t/y DSO biodiesel production plant.
| Item | Annual Cost ($) | Remarks |
|---|---|---|
| Laboratories and quality control | 18,000 | 20% of operating labor [41] |
| Operating labor supervision | 18,000 | 20% of operating labor [42] |
| Plant overhead | 45,000 | 50% of operating labor [42] |
| Maintenance | 55,500 | 5% of [40] |
| Capital charges | 111,000 | 10% of [42] |
| Property insurance | 48,100 | 1% of [43] |
| Property taxes | 96,200 | 2% of [41] |
| Royalties | 48,100 | 1% of [28] |
| Research and development | 48,950 | 5% of [42] |
| Selling and marketing costs | 48,950 | 5% of [43] |
| General and administrative costs | 99,450 | 65% of (Operating labor + supervision + overhead) [43] |
| $637,250 | ||
| $1,616,240 |
Disclaimer/Publisher’s Note: The statements, opinions and data contained in all publications are solely those of the individual author(s) and contributor(s) and not of MDPI and/or the editor(s). MDPI and/or the editor(s) disclaim responsibility for any injury to people or property resulting from any ideas, methods, instructions or products referred to in the content. |
© 2023 by the authors. Licensee MDPI, Basel, Switzerland. This article is an open access article distributed under the terms and conditions of the Creative Commons Attribution (CC BY) license (https://creativecommons.org/licenses/by/4.0/).
Share and Cite
MDPI and ACS Style
Kamil, M.; Almarashda, F.M. Economic Viability and Engine Performance Evaluation of Biodiesel Derived from Desert Palm Date Seeds. Energies 2023, 16, 1513. https://doi.org/10.3390/en16031513
AMA Style
Kamil M, Almarashda FM. Economic Viability and Engine Performance Evaluation of Biodiesel Derived from Desert Palm Date Seeds. Energies. 2023; 16(3):1513. https://doi.org/10.3390/en16031513
Chicago/Turabian StyleKamil, Mohammed, and Fatima M. Almarashda. 2023. "Economic Viability and Engine Performance Evaluation of Biodiesel Derived from Desert Palm Date Seeds" Energies 16, no. 3: 1513. https://doi.org/10.3390/en16031513
Note that from the first issue of 2016, this journal uses article numbers instead of page numbers. See further details here.