1. Introduction
Today, about 90% of the world’s freight transport is performed by ships. While the world’s transportation needs are forecasted to double the current level by the year 2050, shipping needs to reduce its contribution to greenhouse gas emissions to 50% of the levels in 2008 [
1].
To be able to reduce the fuel consumption and emissions of ships, it is crucial to be able to accurately predict the fuel consumption of existing and new ships, as well as the impact of operational and retrofitting measures, e.g., energy-saving devices, design changes or alternative propulsion. To achieve this and to reduce the risk for ship owners and operators when investing in new technology, sophisticated models are necessary that model each part and the interactions of the parts of a ship’s energy system. During the last decade, several of such models with different approaches became available.
The modeling of the performance of wind-assisted propulsion (WASP) especially requires sophisticated models that not only respect the forward thrust of the sails and propulsion devices but also model aero- and hydrodynamic interaction effects [
2,
3,
4,
5,
6]. Apart from the lift and drag forces of the sails, such models must predict the sail–sail interaction, the sail–hull interaction and the added resistances from the rudder and the drift of the hull due to the large side forces and yaw moments introduced from the sails. Early models employed maneuvering equations to model the drift and yaw moments of a ship hull, which later proved to be inaccurate, as shown in [
5]. CFD computations, on the other hand, might be accurate but require more resources, time and detailed information about the ship hull and are therefore not always applicable and perhaps not always necessary. Thus, it is crucial to identify the parameters with the most considerable influence on the accuracy of the prediction.
The empirical/analytical performance prediction model ShipCLEAN presented by [
7] is developed as a coupled model for performance prediction of ships with and without sails, respecting 4 degrees of freedom and the interaction of a ship’s energy system, e.g., the propeller–engine interaction. Its capability and accuracy in ship performance predictions have been validated for commercial ships with and without wind-assisted ship propulsion (WASP) devices. Models such as ShipCLEAN are of practical and academic value, as they can easily be used to compare WASP technologies for any commercial ship type, sailing route and ship sailing conditions determined by the analyst [
7,
8]. The ShipCLEAN model is used in this study to propose a design of a retrofitted RoPax vessel with Flettner rotors and showcase to what extent the ship’s energy consumption is reduced and what effect design changes or different WASP options have on the power savings. The study also includes a study of uncertainties introduced from modeling the important parameters of the aero- and hydrodynamics of a wind-assisted propelled ship, including the sail forces, drift forces and aerodynamic interaction effects. Additionally, a randomized variation is performed to estimate the achievable accuracy with a generic model such as ShipCLEAN, i.e., without using time-consuming CFD methods.
2. The Case Study Vessel and Operational Conditions
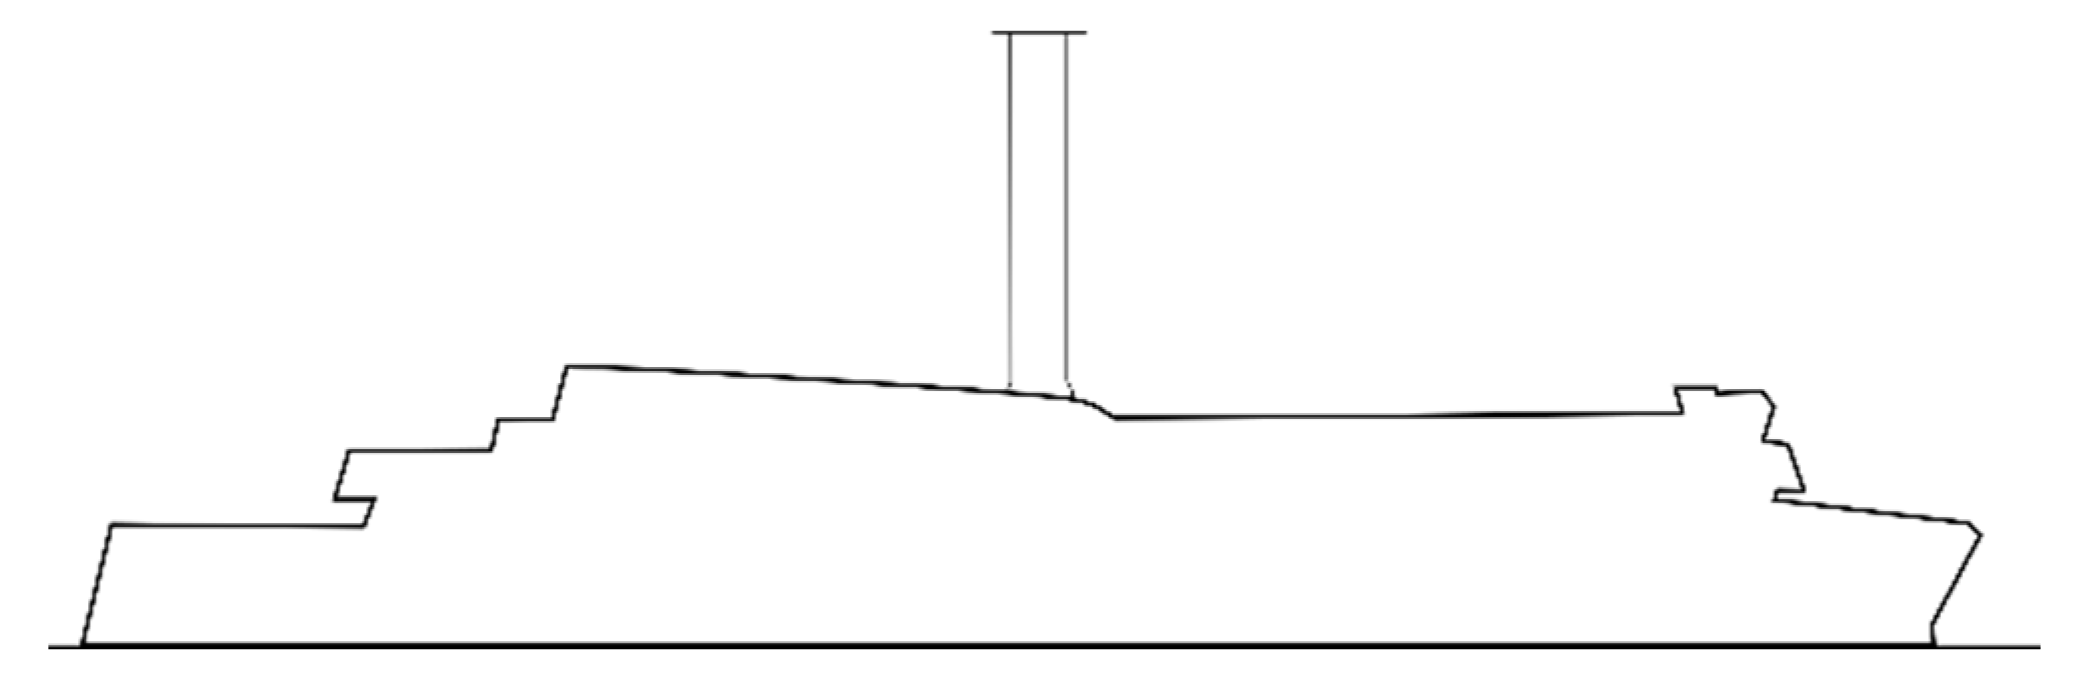
This study uses a RoPax ferry operating on a Baltic Sea route as an example. The main dimensions of the vessel are presented in
Table 1, and a sketch of the vessel including its currently installed Flettner Rotor (5 × 30 m) is presented in
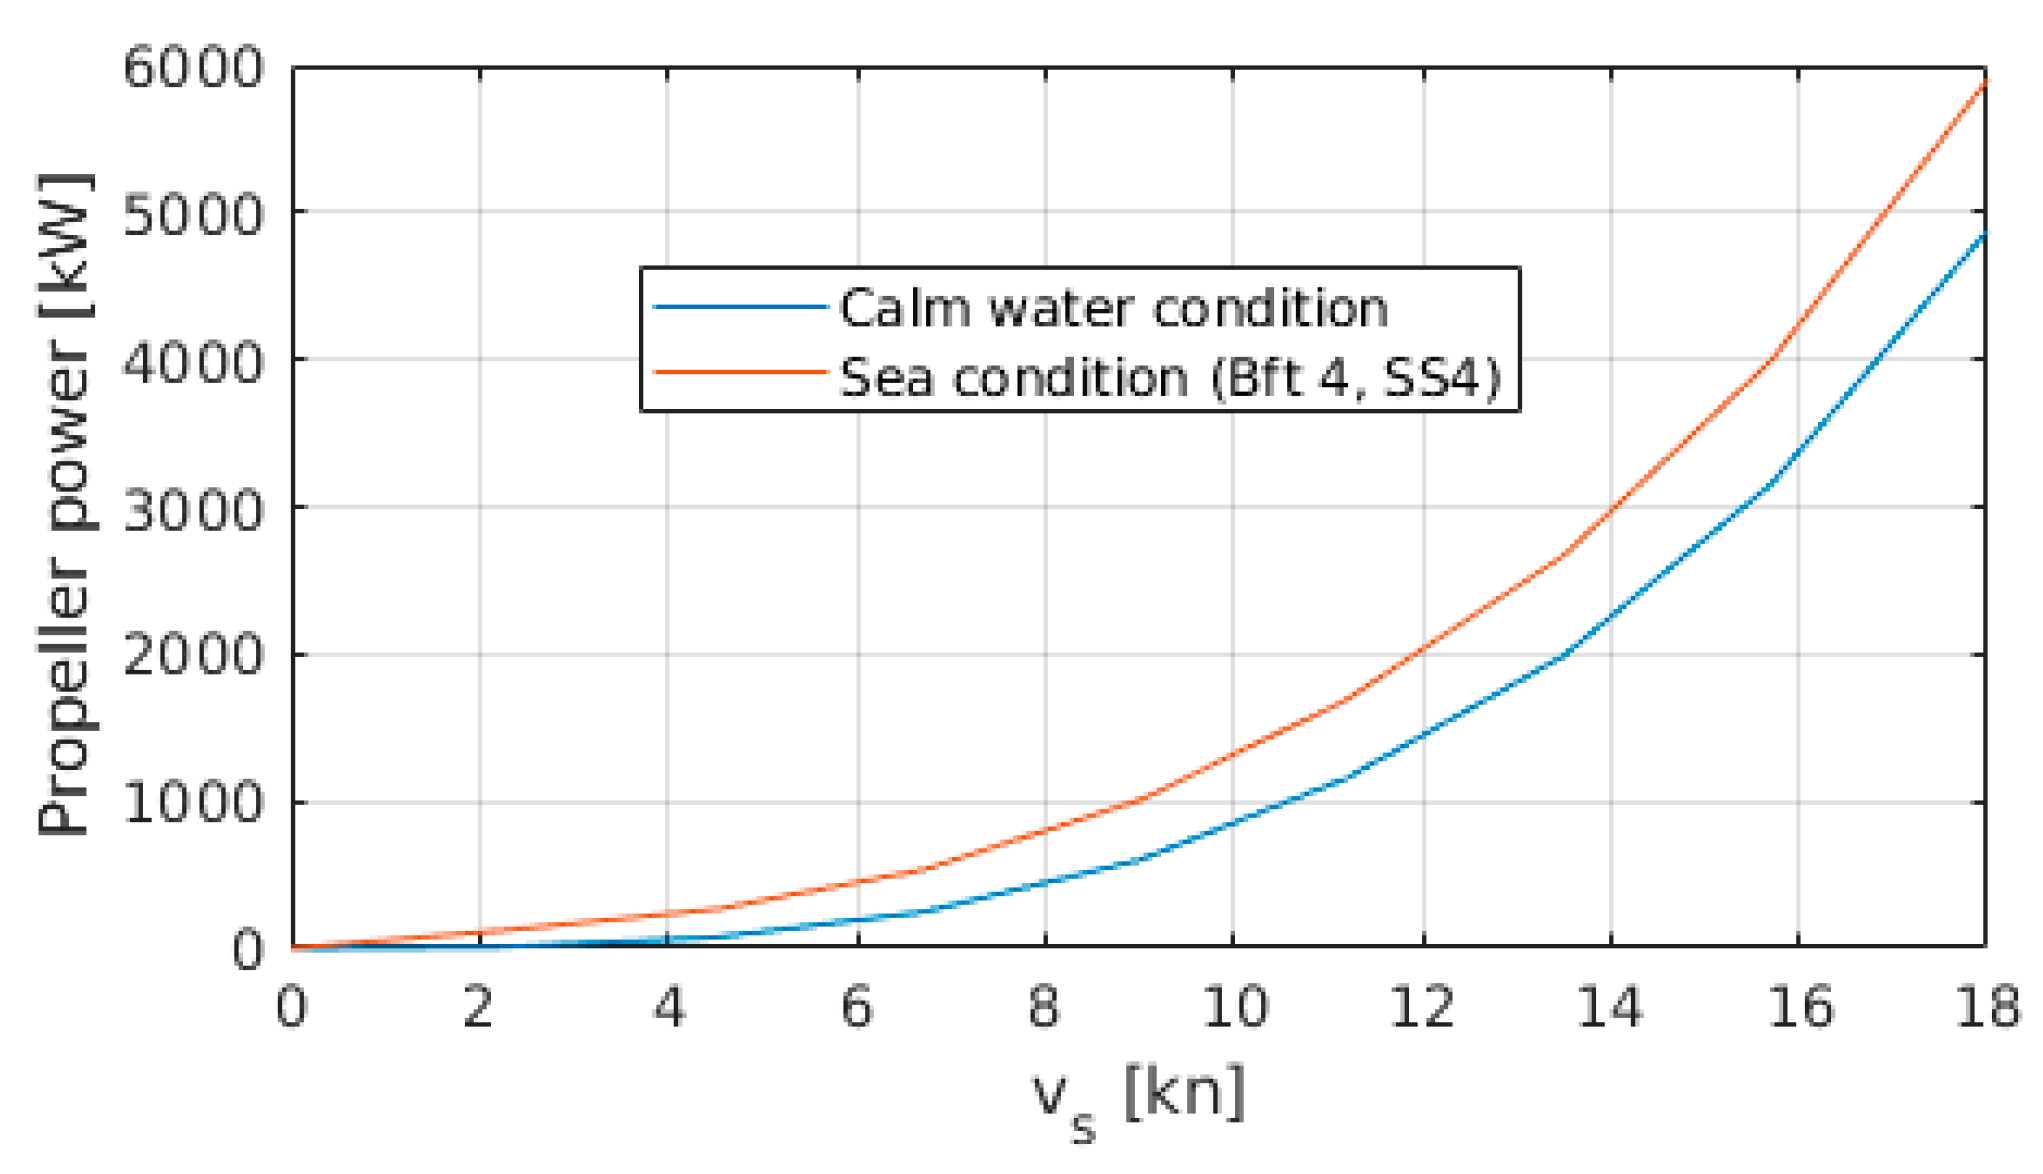
Figure 1. The results of the ShipCLEAN power prediction without sails are presented in
Figure 2.
The ferry operates on a 23 nm long route between Rostock (Germany) and Gedser (Denmark) with a course over ground of 165 deg (towards Rostock) and 345 deg (towards Gedser). The operational speed of the vessel is about 16 kn.
The objective is to accurately predict long-term savings and the impact of design changes on these savings. Thus, hindcast weather data for the actual area of operation are used to perform a long-term prediction using a statistical approach as described in [
5,
9]. In this approach, probability distribution functions of the wind strength and wind direction are used to build up weighting functions for the single points evaluated in a polar plot. In that way, the weighted sum of a low number of structured computations can represent the conditions in real operation with high accuracy, as shown in [
5].
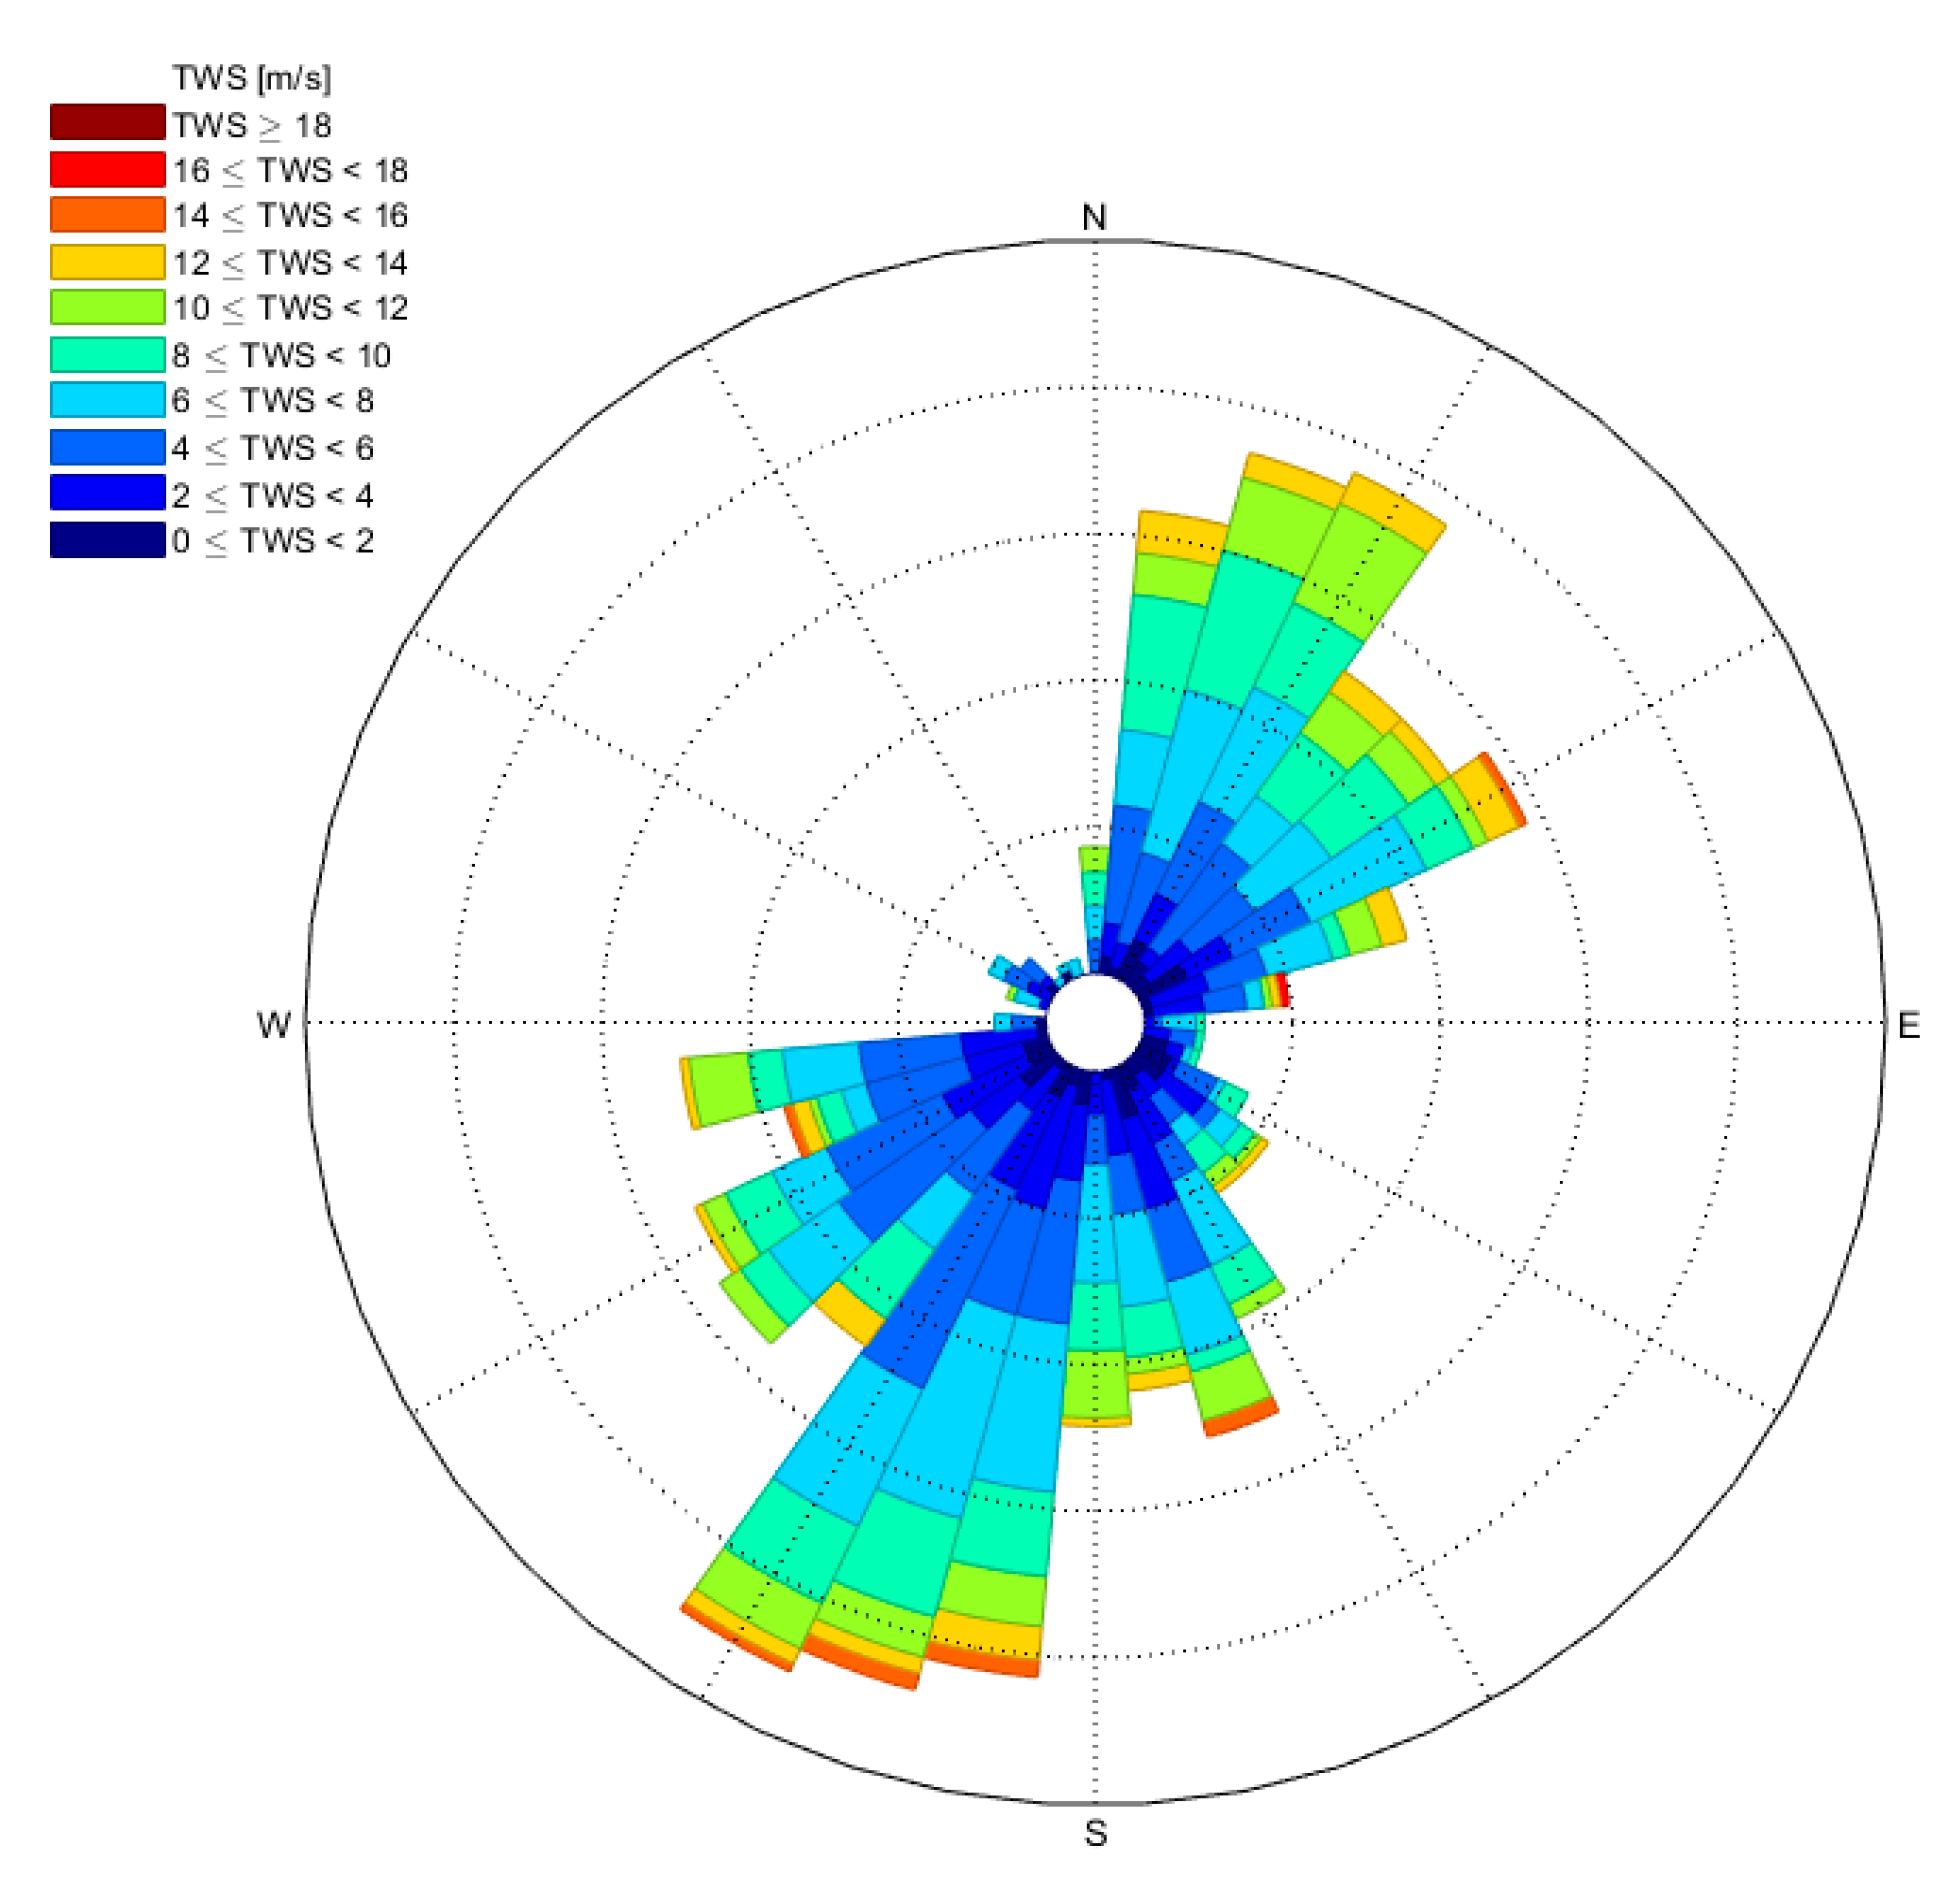
For this study, wind statistics along the route for three years (2016–2018) are used to construct the probability functions. The wind statistics are summarized in a wind scatter plot in
Figure 3. It shows that there are two dominating true wind directions, between 190 and 210 deg (southwest) and between 10 and 30 deg (northeast).
3. Performance Modeling—ShipCLEAN
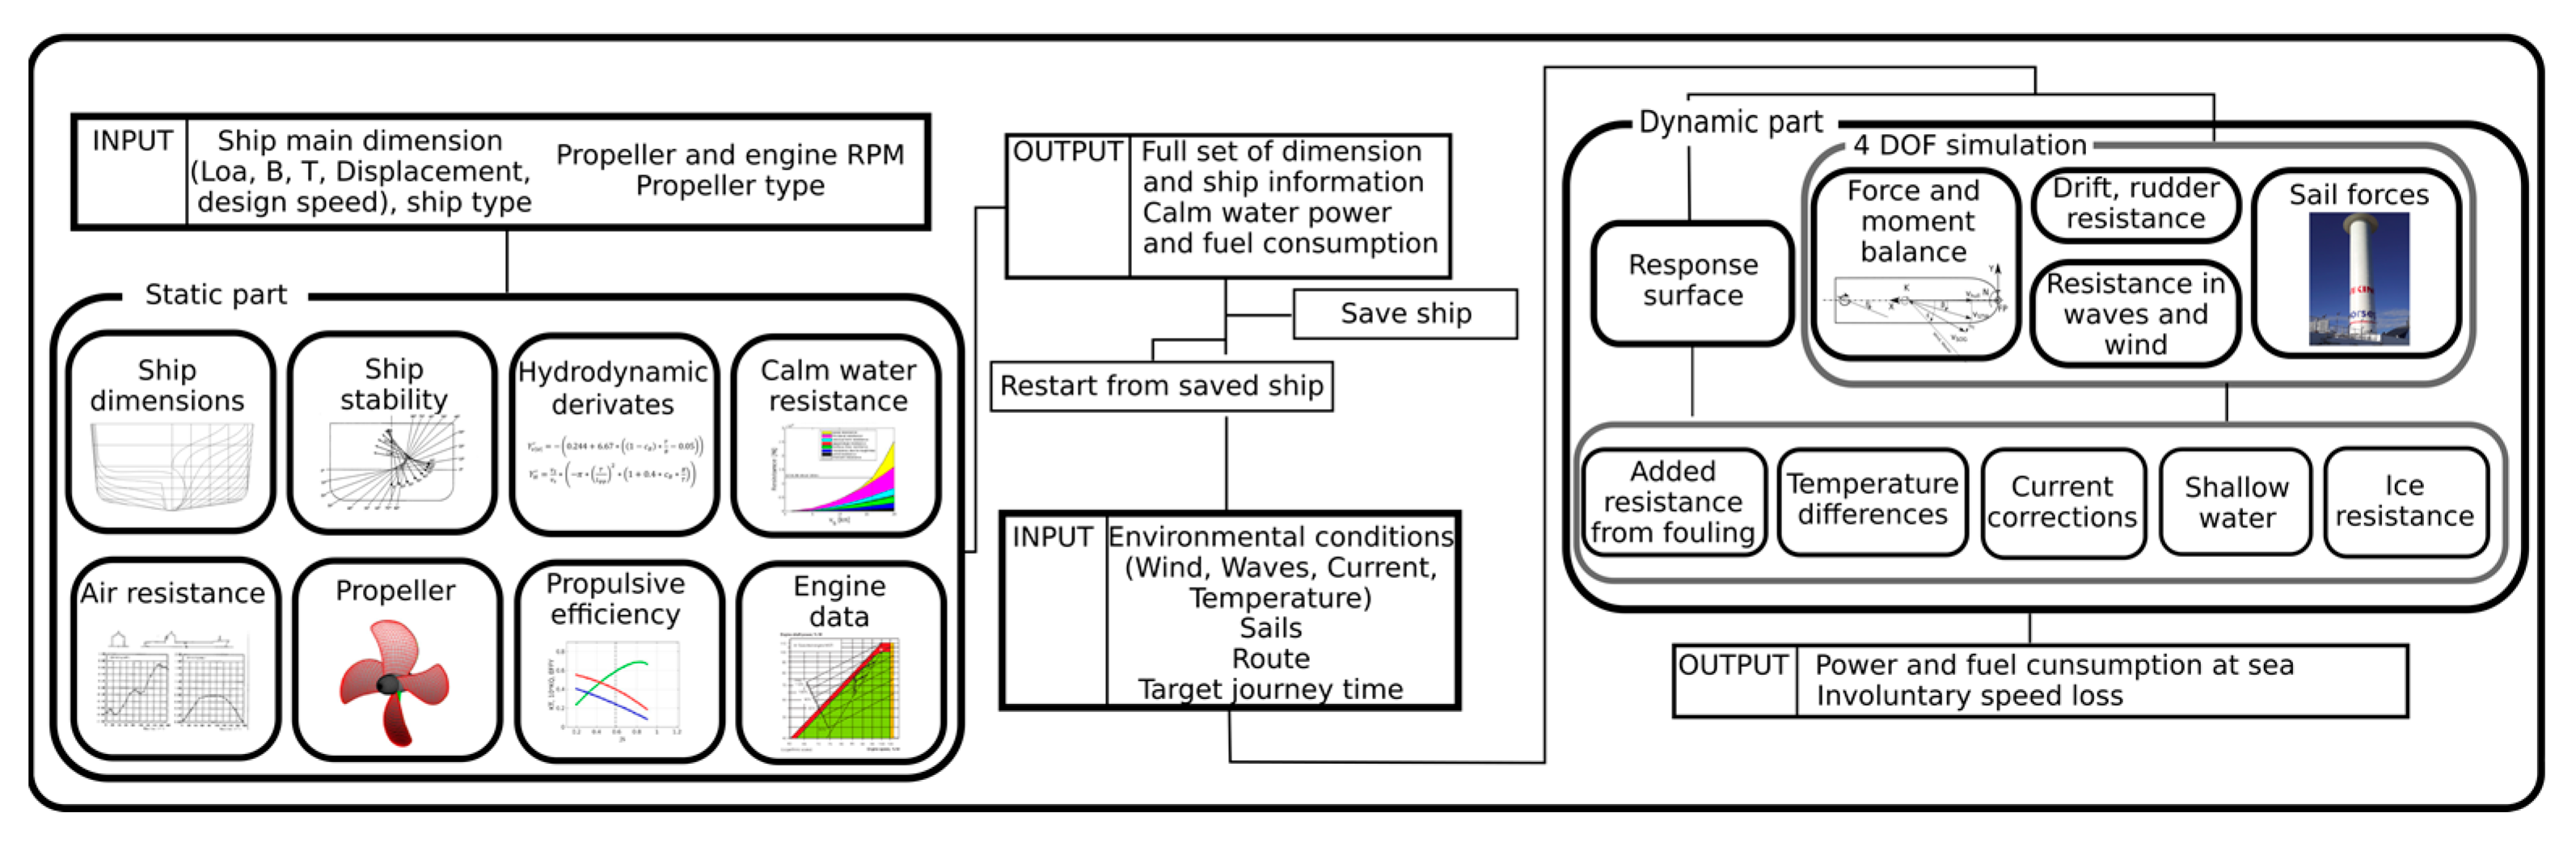
ShipCLEAN is a performance prediction model based purely on empirical and analytical methods, thus offering predictions with short computational time. During the development of ShipCLEAN, the focus was on reducing the number of required input parameters and reducing uncertainties, i.e., achieving the highest possible prediction accuracy with only the main properties of the ship as an input. The accuracy of the model without wind-assisted propulsion is assessed in [
10]. Since ShipCLEAN can be used for ships with and without wind-assisted propulsion as well as purely wind-propelled ships, in real-life conditions, the model includes methods to estimate the added resistances from waves, wind, ice and currents and includes a 4 degrees of freedom solver to respect the influences from the side forces and yaw moments of sails and to include the added resistances from the rudder and from drifting. Aerodynamic interactions are respected by modeling the induced speeds due to the circulation around the sails using a simplified Navier–Stokes equation. For ships with multiple sails, the induced velocities from each sail will influence the apparent wind angle and speed of each of the other sails. Further, the influence of the ship’s deck on the wind angle is modeled. More details about the model and the wind propulsion component are presented in [
4,
5] and discussed in
Section 5. An overview of the parts of ShipCLEAN is presented in
Figure 4.
4. Design and Performance
This section presents a performance analysis of the ship with one Flettner rotor as it is currently installed, as well as an analysis of design alterations to study possible design improvements.
4.1. Performance of the Installed WASP
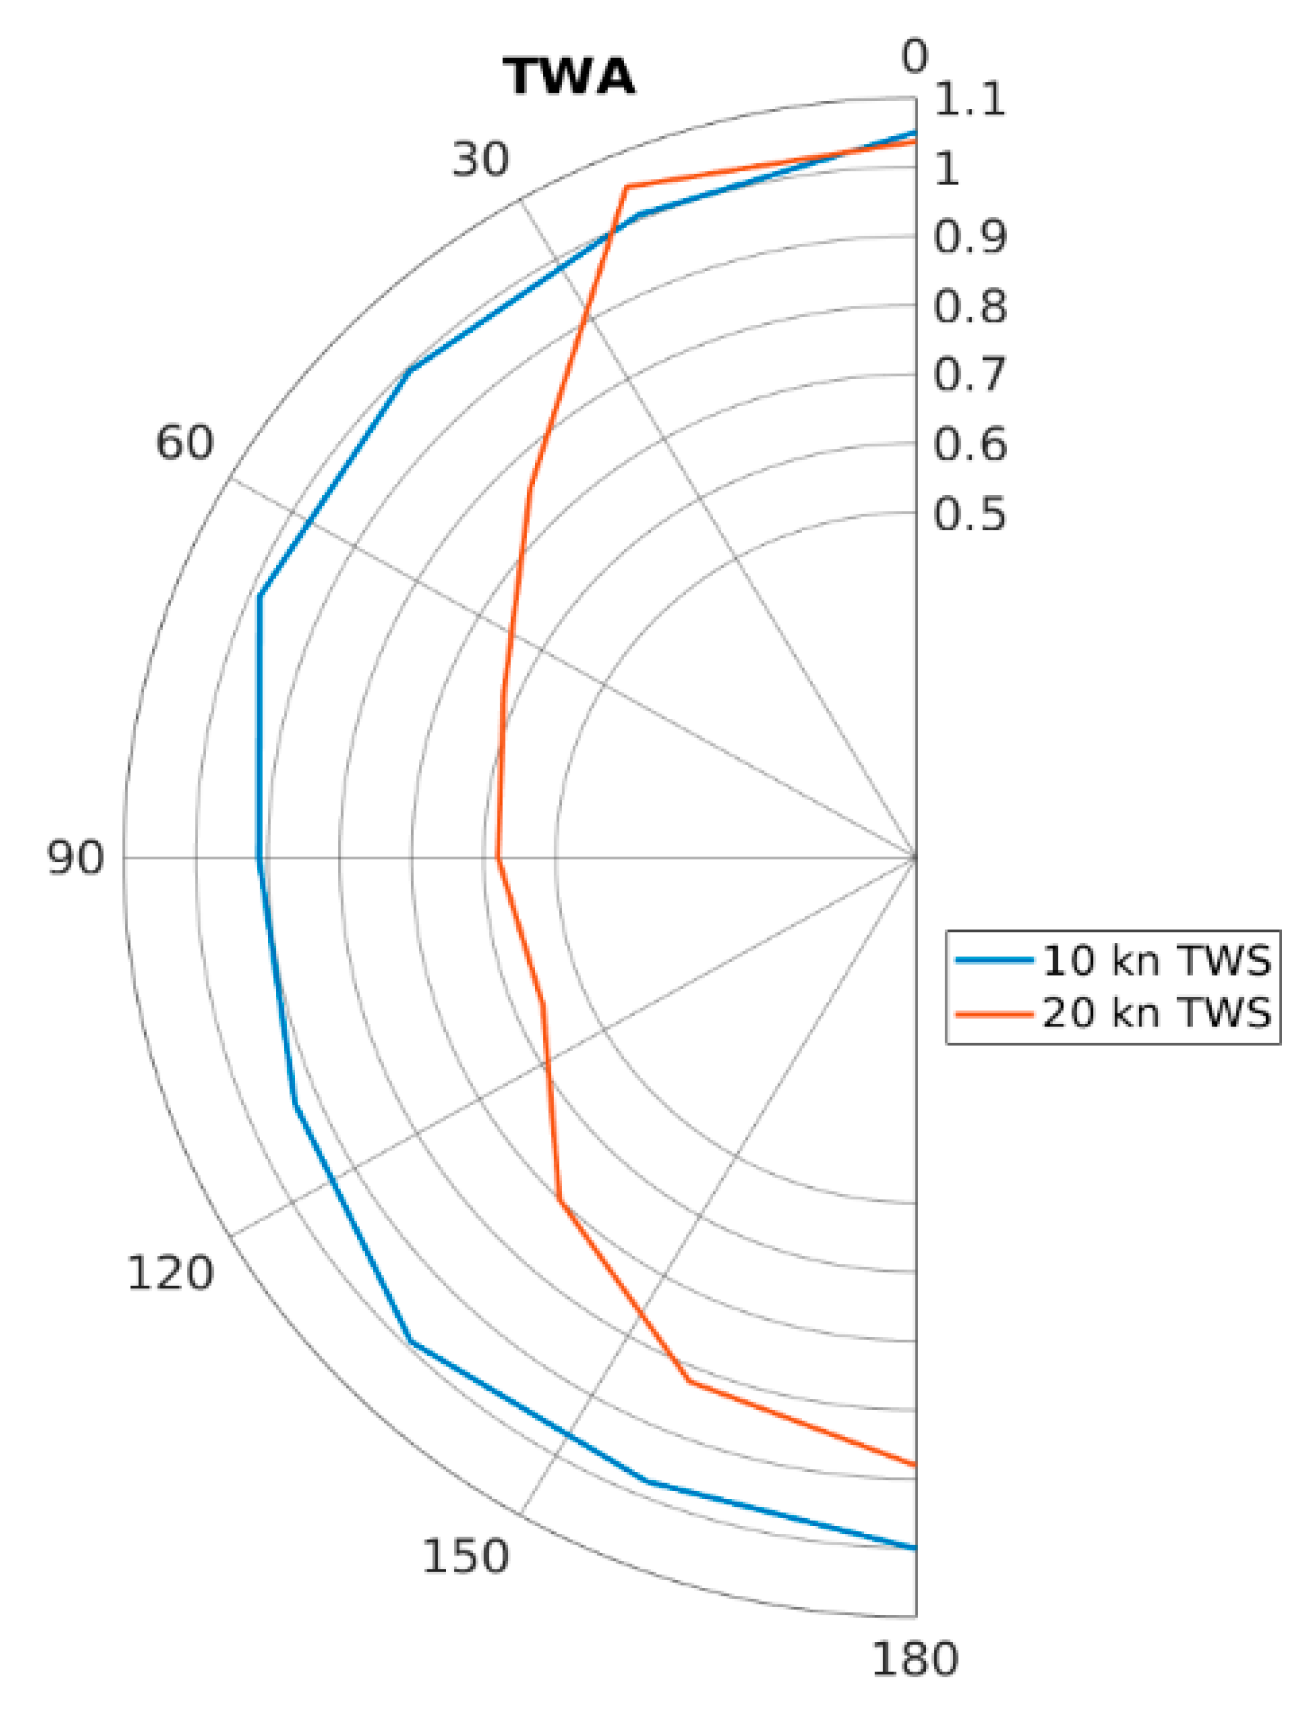
One 5 × 30 m Flettner rotor is currently installed at about midship on the ship. The Flettner rotor is 30 m heigh and 5 m in diameter with a 7.5 m disk at the top and can achieve a maximal rotational speed of 180 rpm. The weight of the whole installation, including foundation, is about 17 t [
11]. Compared to the ship’s displacement of almost 12,000 t, the sail weight is thus neglectable. Achievable propulsion power reductions in two different wind speeds (10 and 20 kn TWS) for a range of 0 to 180 deg TWA and a ship speed of 16 kn are presented in
Figure 5. In
Figure 5, the relative propulsion power reduction is presented, i.e., the propulsion power, P
D, of the ship with Flettner rotor over the power without. Fuel savings are difficult to predict for this ship due to a complicated hybrid propulsion system. In 10 kn TWS, the single Flettner rotor can save up to 10% of propulsion power, and in 20 kn TWS, this value increases to up to 40%. A small increase in propulsion power of less than 1% can be seen for head wind, which is due to the wind resistance of the rotor rotating at idle speed.
A long-term analysis using the weather statistics introduced above shows that the propulsion power is reduced by 13% on average when the ship is operating on its current route.
4.2. Design Variation
As a second step in the analysis of the performance of WASP systems in the case study ship, the design of the WASP system is altered.
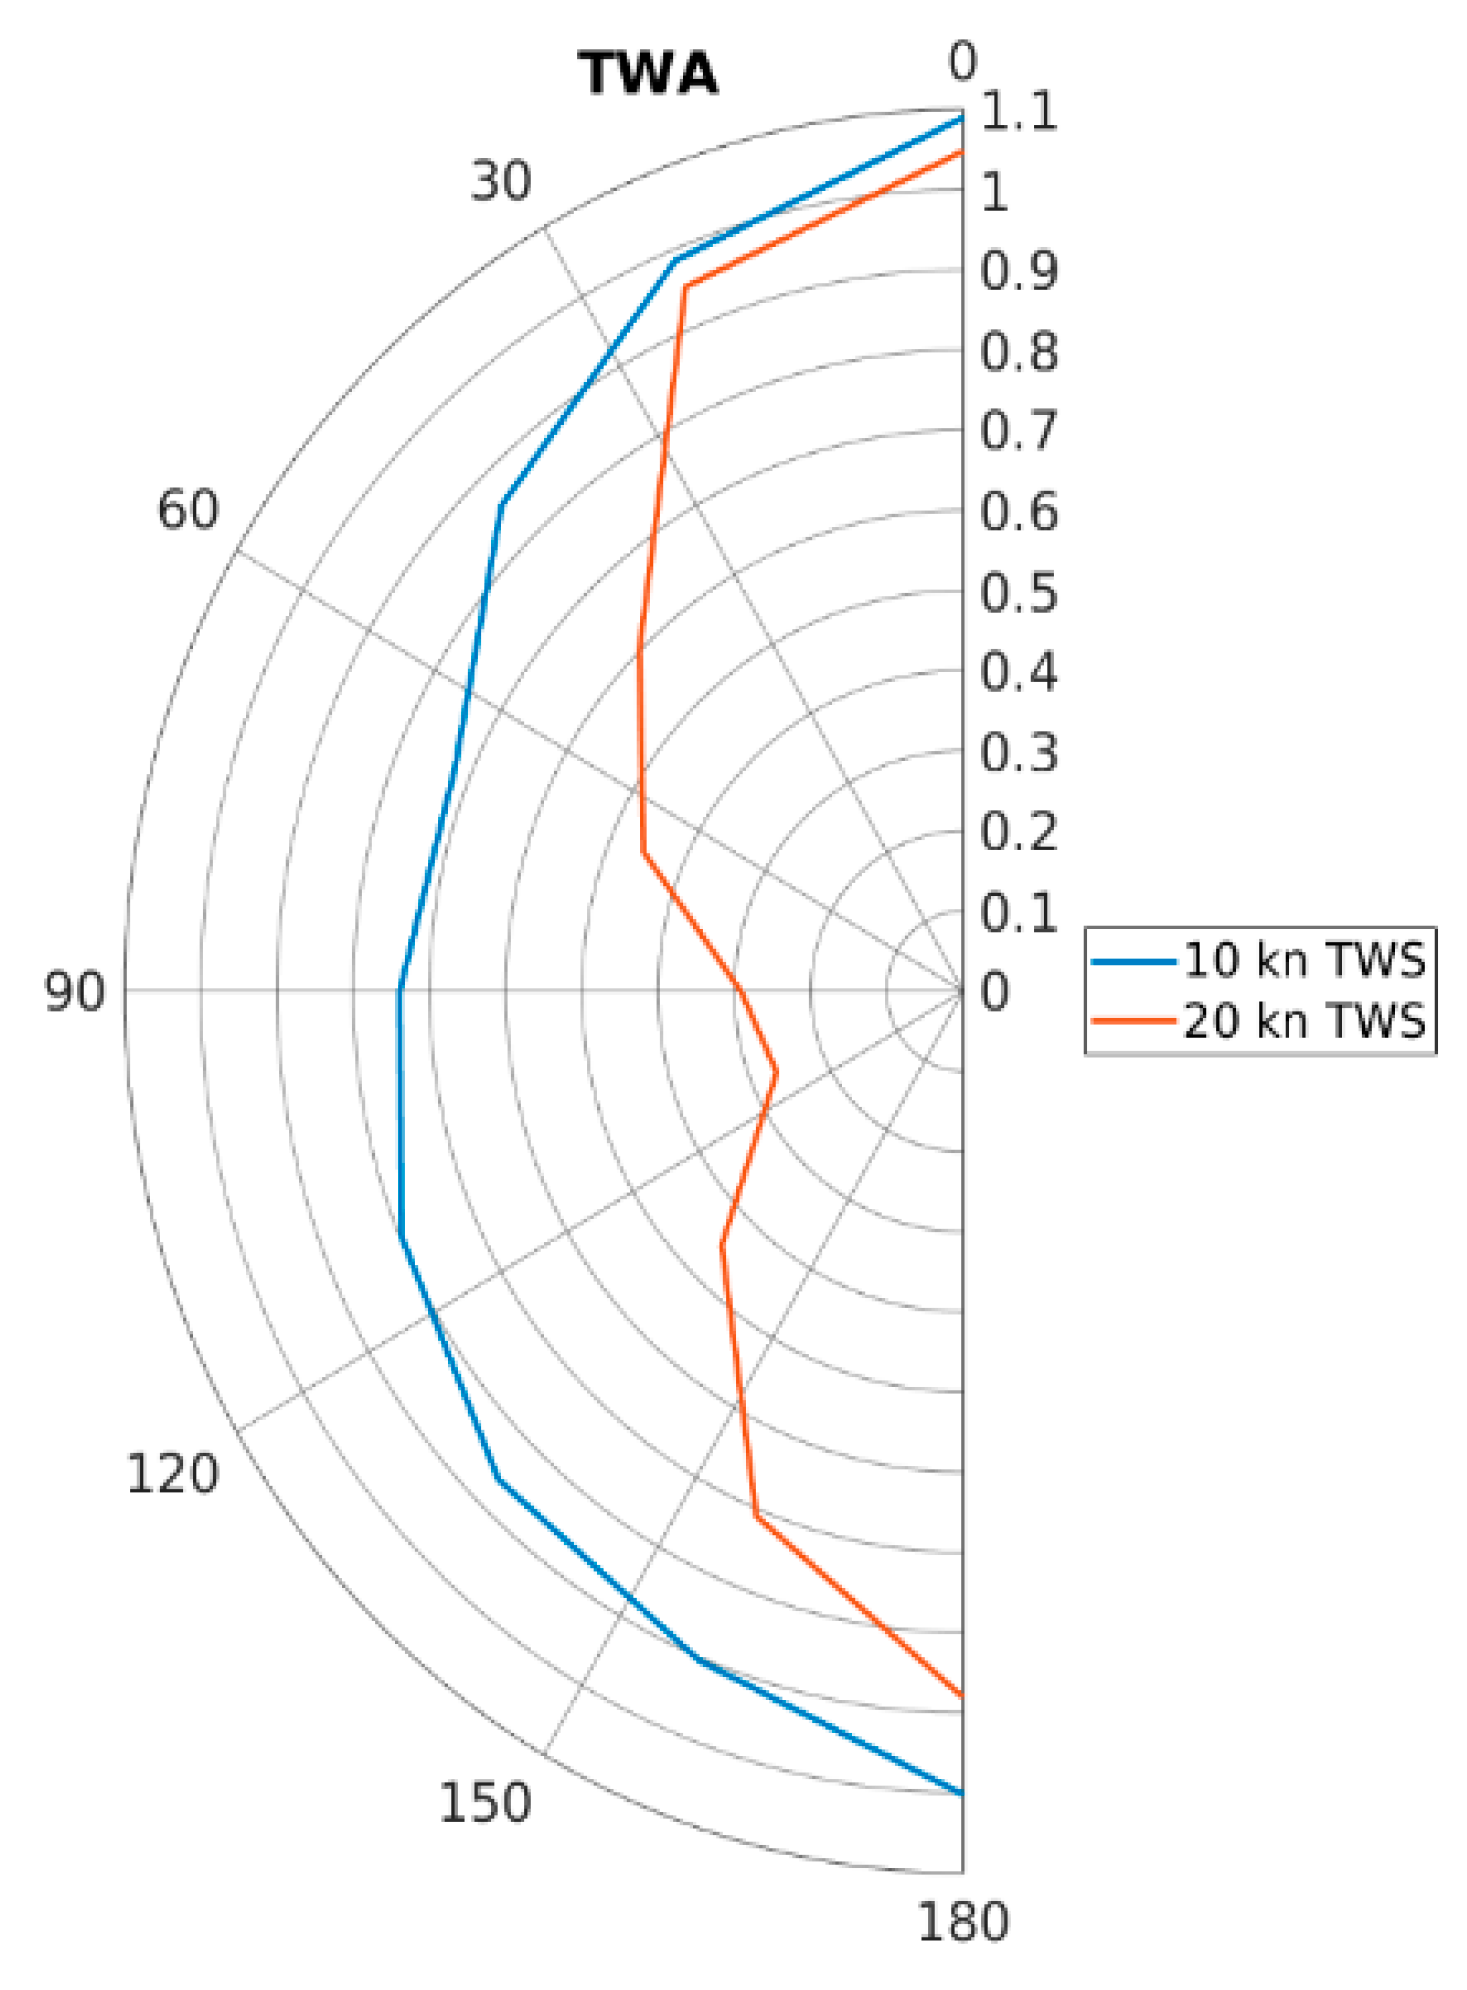
First, an additional 5 × 30 m Flettner rotor could be installed on the ship. The rotors are assumed to be positioned at 0.25 Lpp and 0.75 Lpp from FP. A polar plot like
Figure 5 but for the ship with two rotors is presented in
Figure 6. In 10 kn TWS, the maximum propulsion power reduction is increased to almost 30%, and in 20 kn TWS, a reduction of up to 70% seems possible. At 100 TWA, which was the optimum angle for the ship with one rotor, the power reduction is about 20% in 10 kn TWS. The long-term savings using two rotors are about doubled compared to the ship with one rotor and become about 27%. In total, the two-rotor ship is slightly more efficient than the one-rotor ship, i.e., the propulsion power is slightly more than twice as high. This effect is mainly due to the increased trimming possibilities, i.e., by varying the rpm of the sails, the optimal rudder angle can be achieved more often. With one rotor only, the total sail force can be controlled but not the longitudinal center of this sail force, as is the case for the ship with two rotors. It is noticeable in
Figure 6 that the performance in head wind conditions is increased.
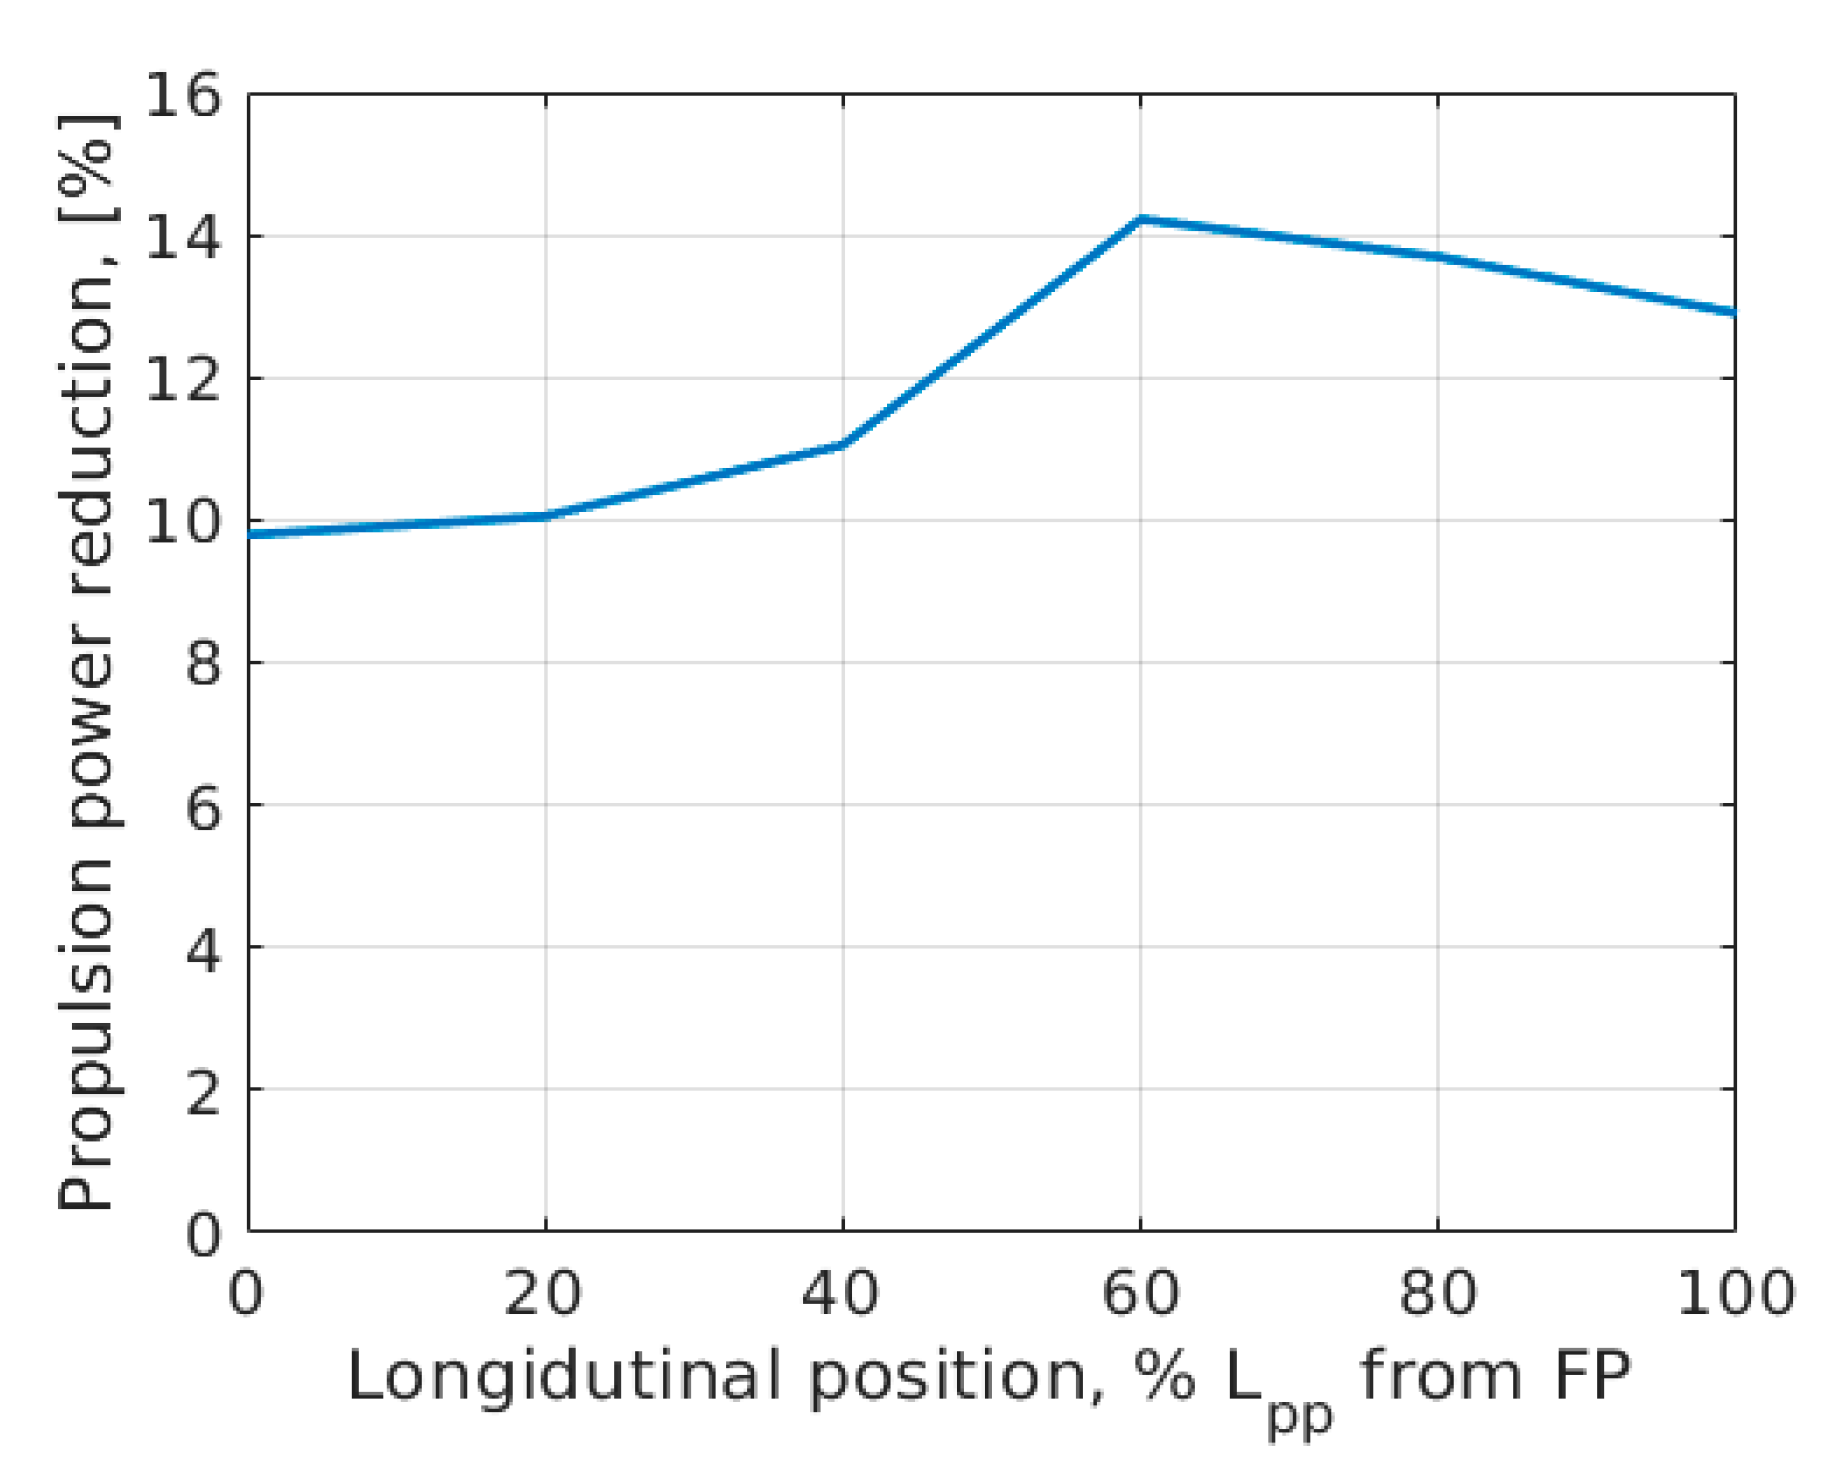
If an increase in the sail area (i.e., the number of sails) is not an option, one might research the longitudinal position of the sail.
Figure 7 presents the long-term average propeller thrust reduction of the RoPax ferry with the rotor placed at different positions along the ship. An optimal position would be at around 60% Lpp from FP for this ship.
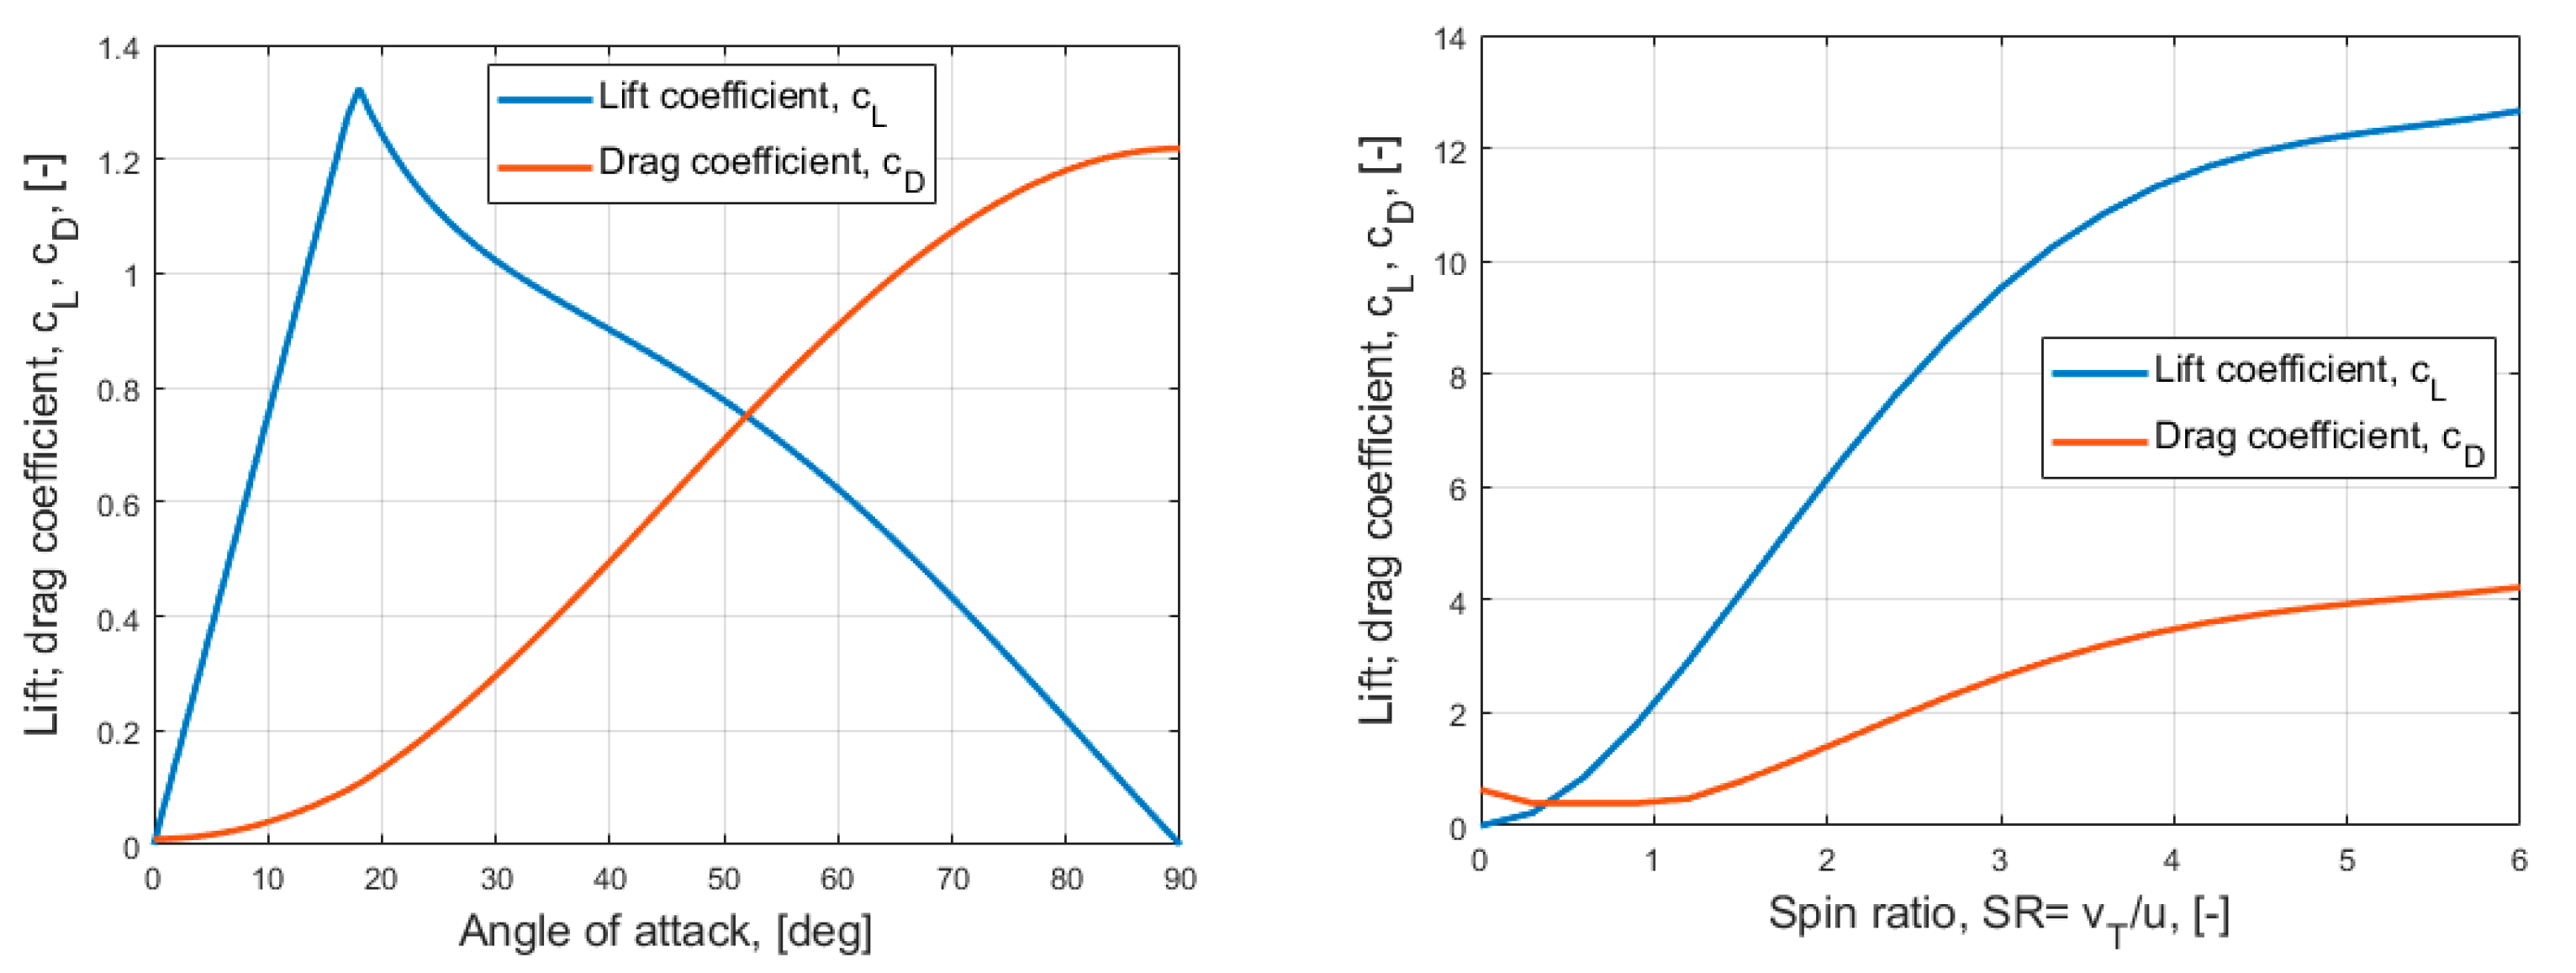
Apart from increasing the sail area and optimizing the sail position, different sail types could be installed and should be compared as well. However, different sail types have significantly different performance properties, making it difficult to compare them to each other.
Figure 8 presents a comparison of the lift and drag coefficients for wing sails and Flettner rotors. According to this, the Flettner rotor can deliver up to 10 times higher lift coefficients. With typical operational values, i.e., a spin ratio of 2–3, the lift coefficient is about 8 times higher than the maximum lift coefficient of the wing sail; however, the drag coefficient of the Flettner rotor is about 20 times higher compared to the wing sail. This means the Flettner rotor can create high lift and thrust forces at low sail areas but also creates much higher side forces than the wing sails.
Since sail properties are as different as shown in
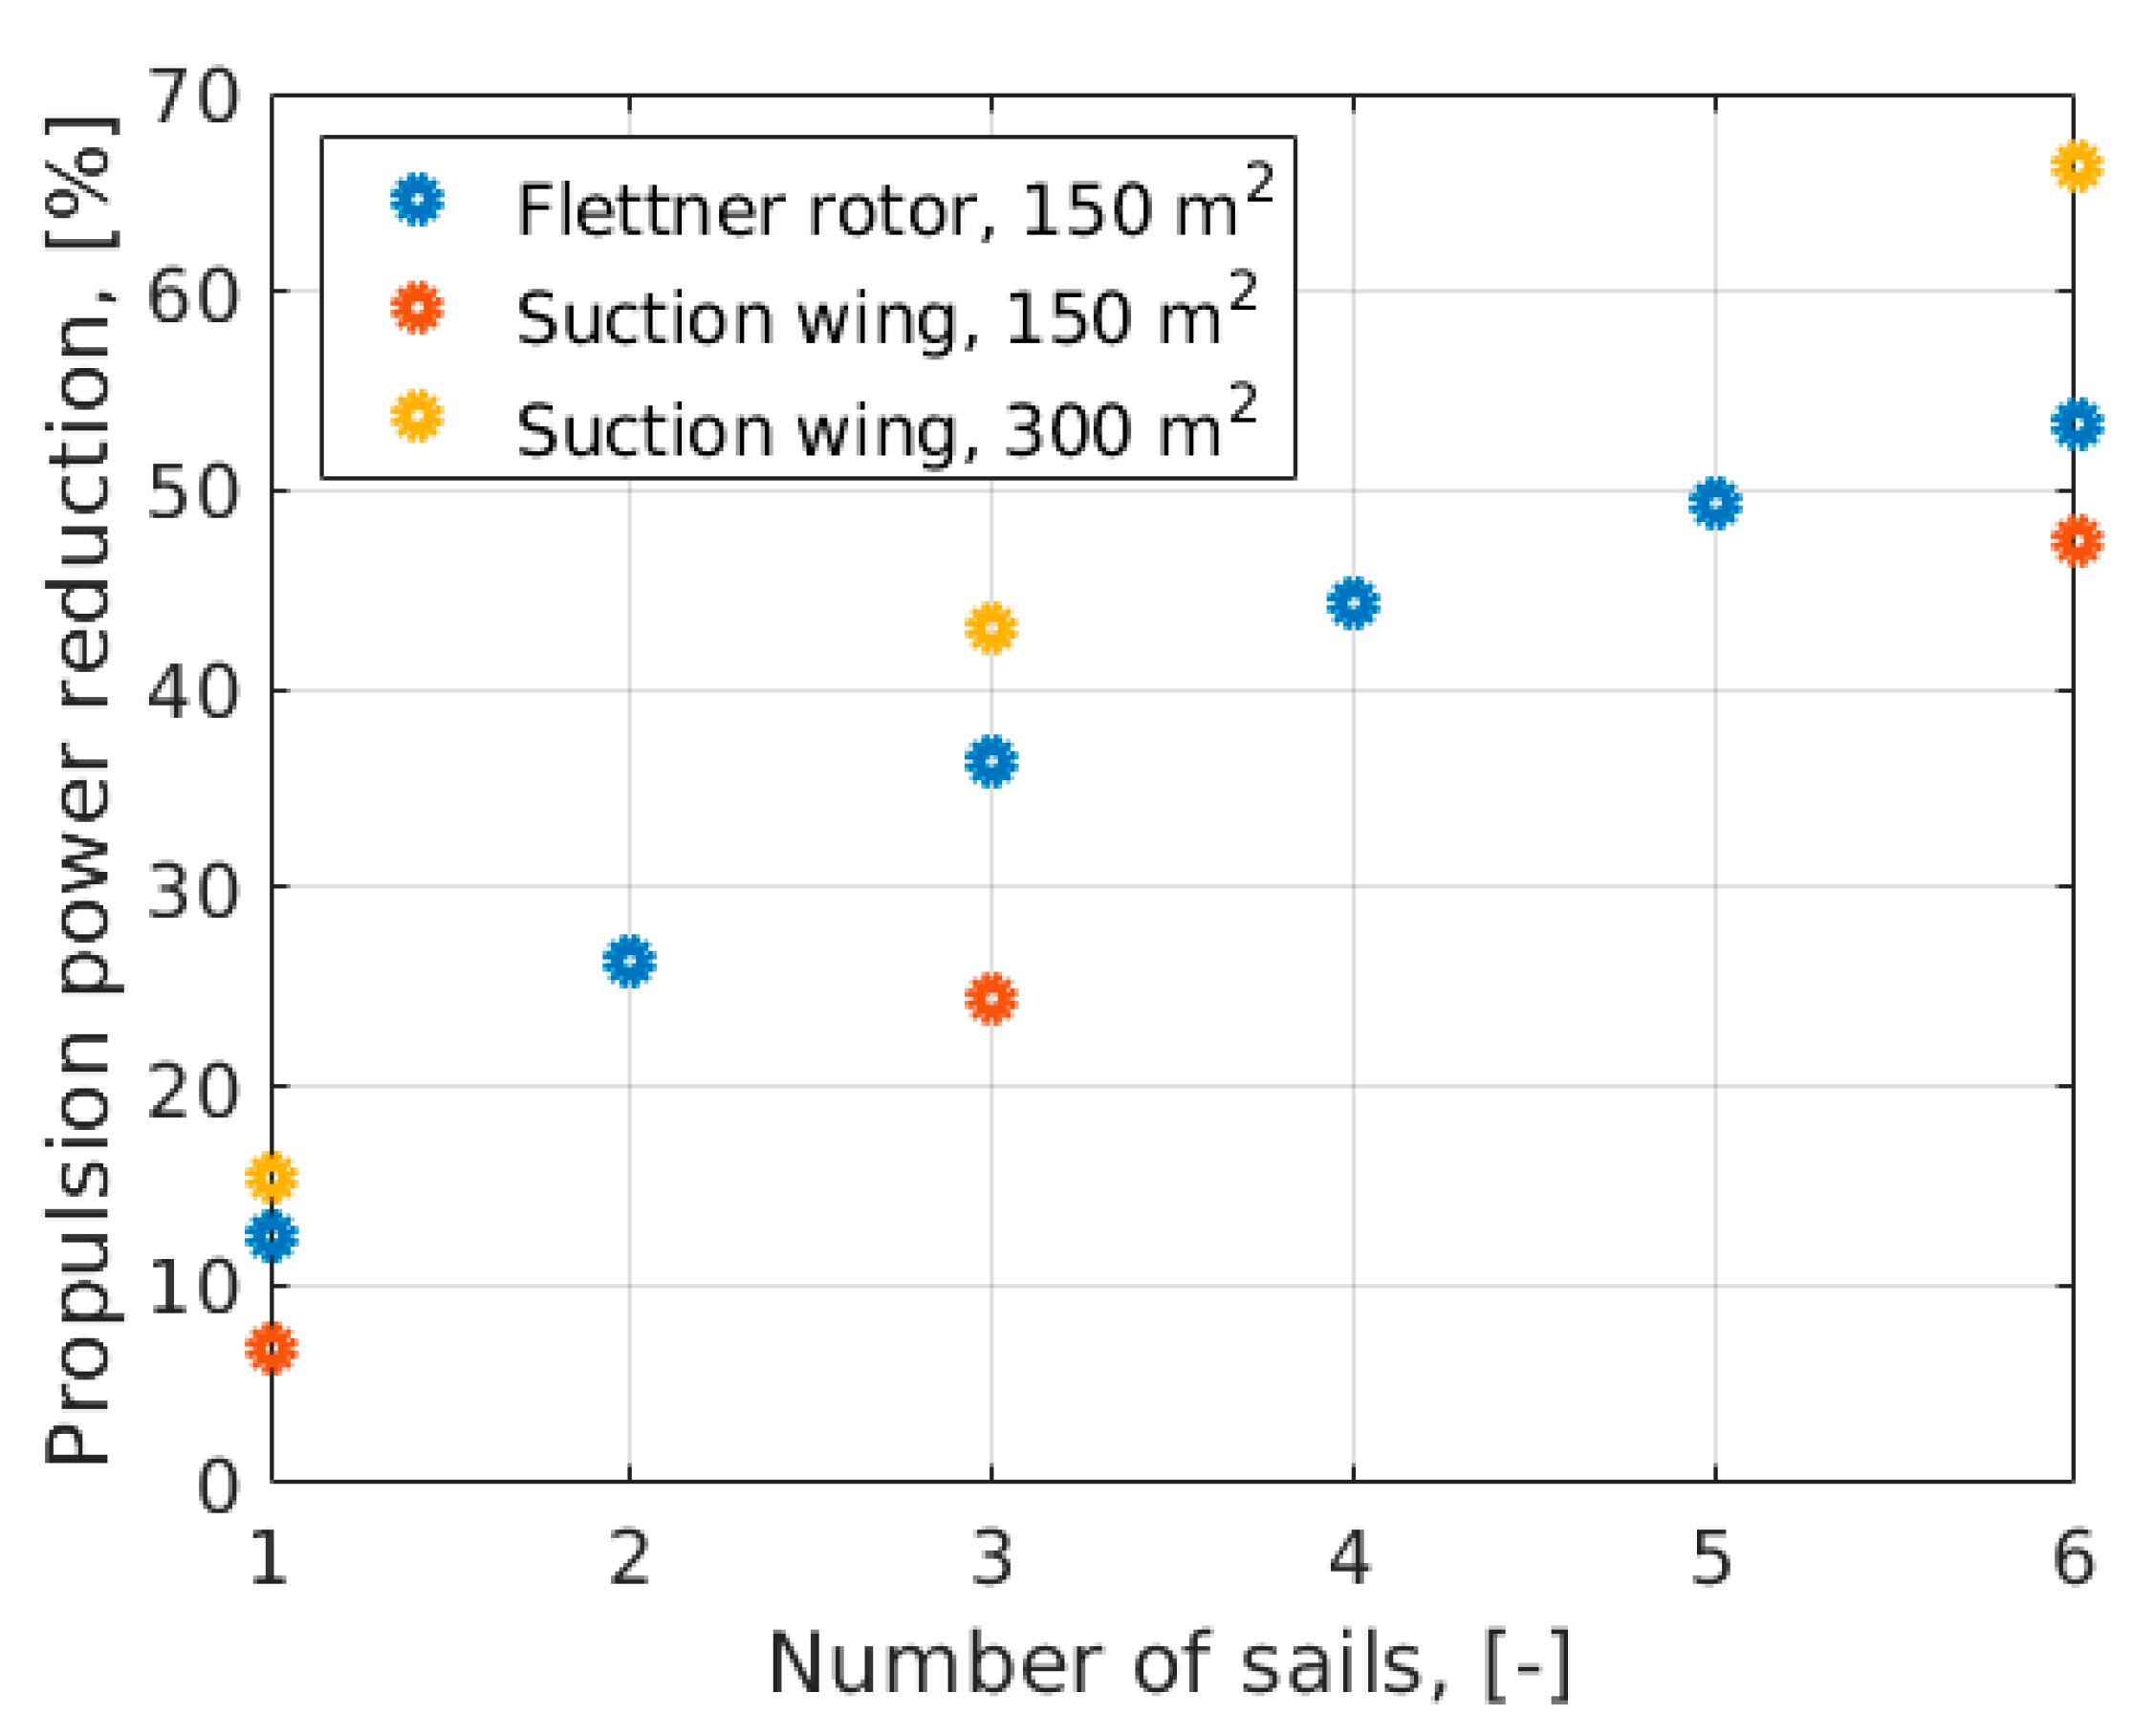
Figure 8, a comparison of different sail types must be performed using other measures than only the thrust figures or power savings for one single sail configuration. One example of comparison is presented in
Figure 9. Three different sail types, a 150 m
2 Flettner rotor, a 150 m
2 Suction wing and a 300 m
2 Suction wing, are installed on the example ship with different arrangements. The suction wing is a type of wing sail where the circulation is increased by active boundary layer suction at the suction side. The lift and drag curves follow a shape like the wing sail’s, but the sails deliver a higher lift coefficient, with only slightly worse lift-to-drag relations. Thus, the suction wing is somewhere between the wing sail and the Flettner rotor discussed above.
Figure 9 presents the difficulty of comparing sail types. If comparing the arrangement with only one sail, the 300 m
2 Suction wing is the best. However, increasing the number of sails of the other sail types naturally increases their performance. Thus, a comparison of one 300 m
2 suction sail and two 150 m
2 Flettner rotors will lead to the conclusion that the Flettner rotor is better. It must thus be concluded that the choice of sail type must be based on: (1) space and height limitations, (2) properties and route of the vessel and (3) costs, i.e., the return on investment time. One interesting effect in
Figure 9 must be noted. The propeller thrust reduction delivered by the Flettner rotors does not significantly increase when increasing the number of sails beyond four. Comparing an installation of six 150 m
2 Flettner rotors and six 150 m
2 Suction wings shows that thrust saving from the Flettner rotors is only slightly higher for this arrangement, while it is much higher for an arrangement of three sails for each type. This shows that, for large sail areas, i.e., highly wind-assisted or purely wind-powered ships, sail types with a high lift-to-drag relation are more suitable than those with high lift coefficients but a worse lift-to-drag relation.
5. Uncertainties
When predicting power savings from alternative propulsion and when modeling the performance of ships at sea, it is crucial to know the achievable accuracy and to know the main factors influencing the accuracy or the uncertainty, as it is referred to in this study. Uncertainties arise from serval sources that are not modeled accurately and do not represent real physics. A generic model, such as ShipCLEAN, relies on fast models and can be used with very little input. This has many advantages but also drawbacks. Quick, often empirical, methods do not represent real physics but often rely on statistics, thus increasing the uncertainties. A lack of detailed input often prohibits the use of more sophisticated methods and again increases the uncertainties, since the ship itself is not modeled entirely as it is in real life. For conventionally propelled ships, uncertainties are limited to the resistance, propeller efficiency and propulsive efficiency and are discussed in detail in [
10]. However, for wind-assisted propelled ships, more factors must be respected and analyzed due to the side forces and yaw moments introduced by the sails. Three groups of additional parameters must be modeled for a wind-assisted propelled or wind-propelled ship compared to a conventional propelled ship: (1) parameters of the hydrodynamic response of the ship to the side forces and yaw moments, i.e., lift and drag of the ship hull and rudder forces, (2) parameters to evaluate the sail performance and (3) parameters describing the aerodynamic interactions, i.e., the sail–sail and the sail–deck interaction. All parameters are summarized in
Table 2 and further discussed in
Section 5.1 through
Section 5.3.
Additionally, the sail trim significantly influences the performance of wind-assisted or wind-propeller ships. However, in this study it is assumed that the sails are always trimmed to the optimum, as is ensured in ShipCLEAN through a holistic trim optimization respecting the 4 degrees of freedom solution.
5.1. Hydrodynamic Response of the Ship
In response to the side forces of wind-assisted propulsion, the ship starts to drift to create an equivalent side force with its hull and rudder. Much like a wing (although with very small aspect ratio), the hull will create a lift and a drag force. In ShipCLEAN, the lift and drag force coefficients are estimated using a modified wing theory for small-aspect-ratio wings [
9,
12,
13,
14]. The method in ShipCLEAN does not respect hull design details, such as the form of the bow or the bilge radius, since it was not possible to include such details at the time of the development of the model [
9]. However, it is shown in [
3] that the lift, drag and center of the force are highly dependent on those design details. Thus, it must be assumed that uncertainties are comparably high, as is also discussed in [
9], where the method is compared to results from model tests. Since the center of the side force (CLR) is not estimated in the wing theory for small-aspect-ratio wings, the side force and yaw moment estimated using maneuvering equations [
15] are used. Uncertainties in the estimation of rudder forces are neglectable compared to those in the estimation of lift and drag forces of the hull.
5.2. Sail Forces
This study only researches the uncertainties when modeling Flettner rotors. In ShipCLEAN, the lift and drag coefficients for the Flettner rotors are derived from full-scale measurements [
5,
16] and validated against results from CFD and model tests [
2,
17,
18]. The results show very good agreement; thus, uncertainties are small for the sail forces.
5.3. Aerodynamic Interactions
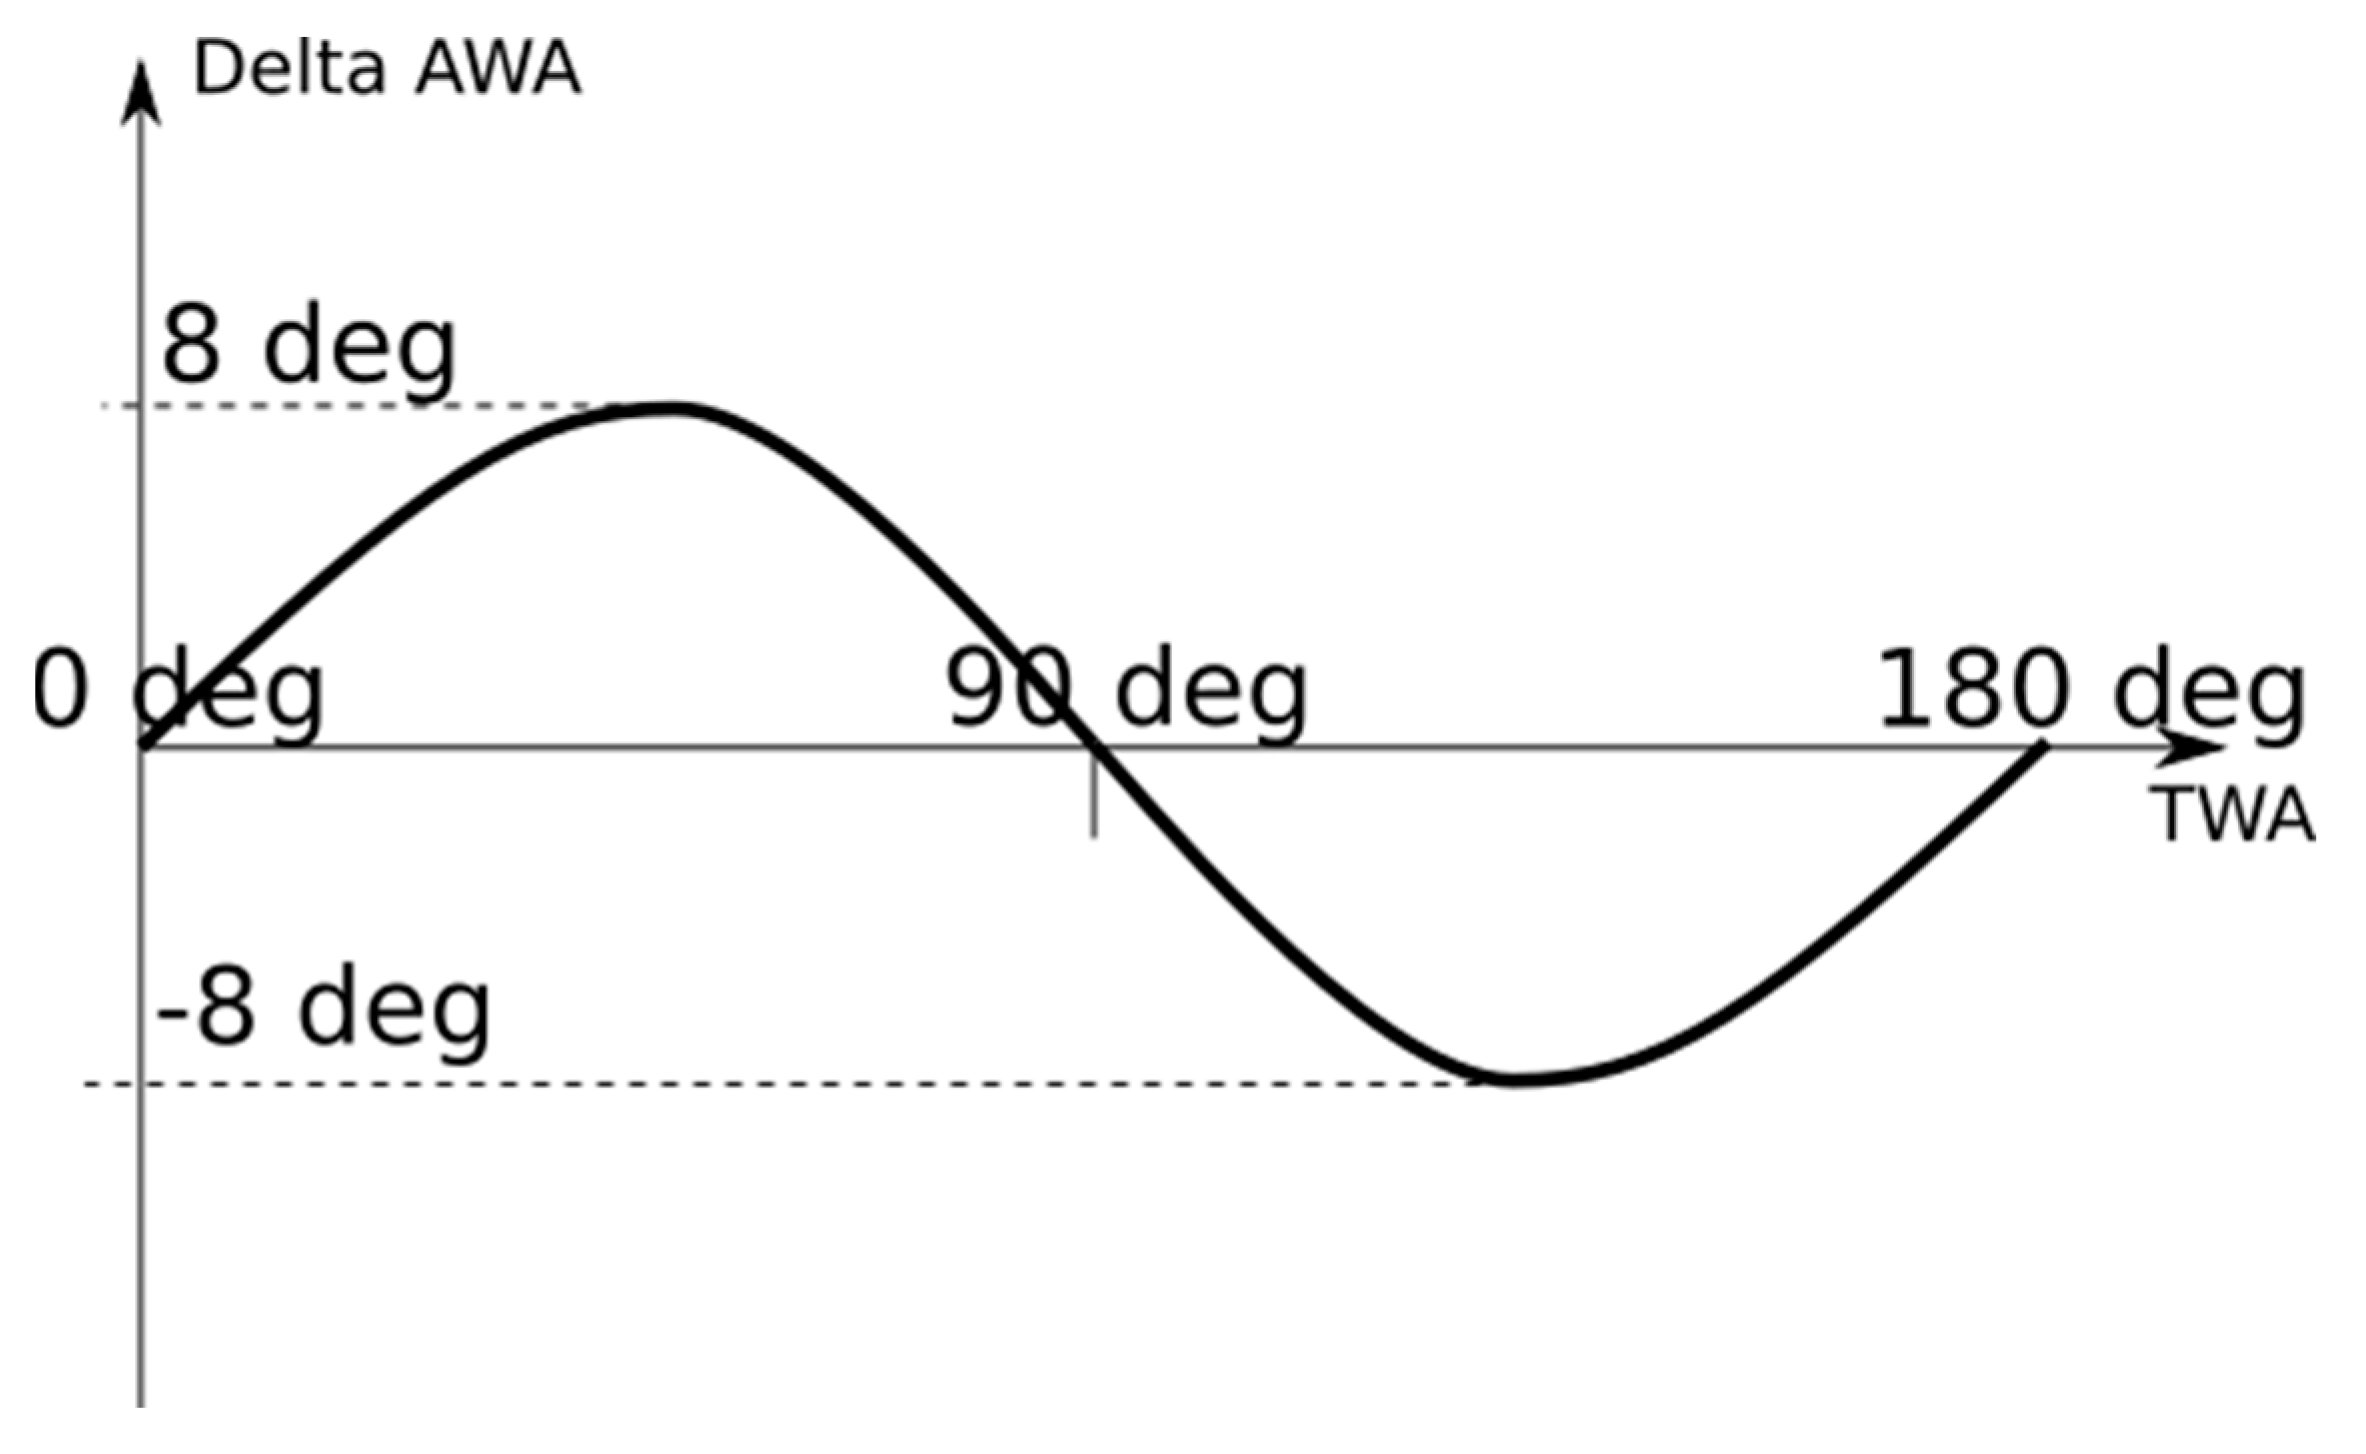
Aerodynamic interactions arise from two sources, the induced speeds from sails on a ship and the ship’s deck and superstructure. The superstructure itself mainly influences the flow downwind, which only affects the sails on a narrow band of wind angles and is thus neglected. The ship deck mainly causes a deviation of the wind, i.e., changing the apparent wind angle of the sails. This is modeled using a sinusoidal curve, like the results presented in [
19]. In head wind (0 deg TWA), beam wind (90 deg TWA) and wind from the stern (180 deg TWA), it is assumed that the deck does not influence the wind angle. The peaks of the sinusoidal curve are, as a standard, assumed to be 8 deg, i.e., the wind angle is shifted by a maximum of 8 deg towards more beam wind, as presented in
Figure 10.
The induced speeds from sails on the ship are modeled using a simplified Navier-Stokes equation, as illustrated in [
20]. In [
9], this method is verified against model test results presented in [
17] and shows good agreement.
5.4. Sensitivity Study
A variation of each of the parameters summarized in
Table 2 will result in a variation of the performance prediction result. To point out which of the parameters must be modeled with the highest accuracy, a sensitivity study is performed. During that study, the parameters are one by one modified to 90% and 110% of their baseline value and the effect of the propulsion power reduction is studied. During the study, the performance in 10 true wind angles (0 to 180 deg in steps of 20 deg) and 2 wind speeds (10 and 20 kn) was evaluated, and the variations of the average power reductions are presented in
Table 3. The presented values represent the percentual difference between the propulsion power reduction with the modified values and the power reduction with the baseline values. Results from a similar study using the ferry with two rotors are presented in
Table 4. For easier interpretation of the table, the rows are color-coded with green for the lowest influence and red for the highest influence. It must be kept in mind that this study does not respect the achievable accuracy when modeling the parameters but modifies each parameter similarly. While the lift coefficients are probably predicted with much higher accuracy than 10%, the lift forces of the hull might deviate even more than that.
The results show that the sail forces, the apparent wind angle, and the drag forces due to drift are the most important parameters, i.e., the parameters with the highest impact on the result.
5.5. Randomized Uncertainty Study
To evaluate the achievable accuracy of the model for a ship in real-life conditions, a randomized variation using a SOBOL algorithm with 200 variants was performed for the case study vessel. In contrast to a Monte Carlo simulation, a randomized study does not require probabilistic distributions, which would be impossible to define due to the lack of data for most parameters. Instead, the SOBOL algorithm distributes the variables as evenly as possible in the design space, i.e., the probability of each variable is constant within its boundaries. The boundaries are defined using results from [
9] and presented in
Table 5. Note that the lift-to-drag ratio was studied in [
9] and is thus also used here. The sail–deck interaction, i.e., the change in AWA over the deck, was not discussed in the above-mentioned study, and the boundaries are thus defined as a best guess, mainly using the values defined in ShipCLEAN and the results presented in [
19].
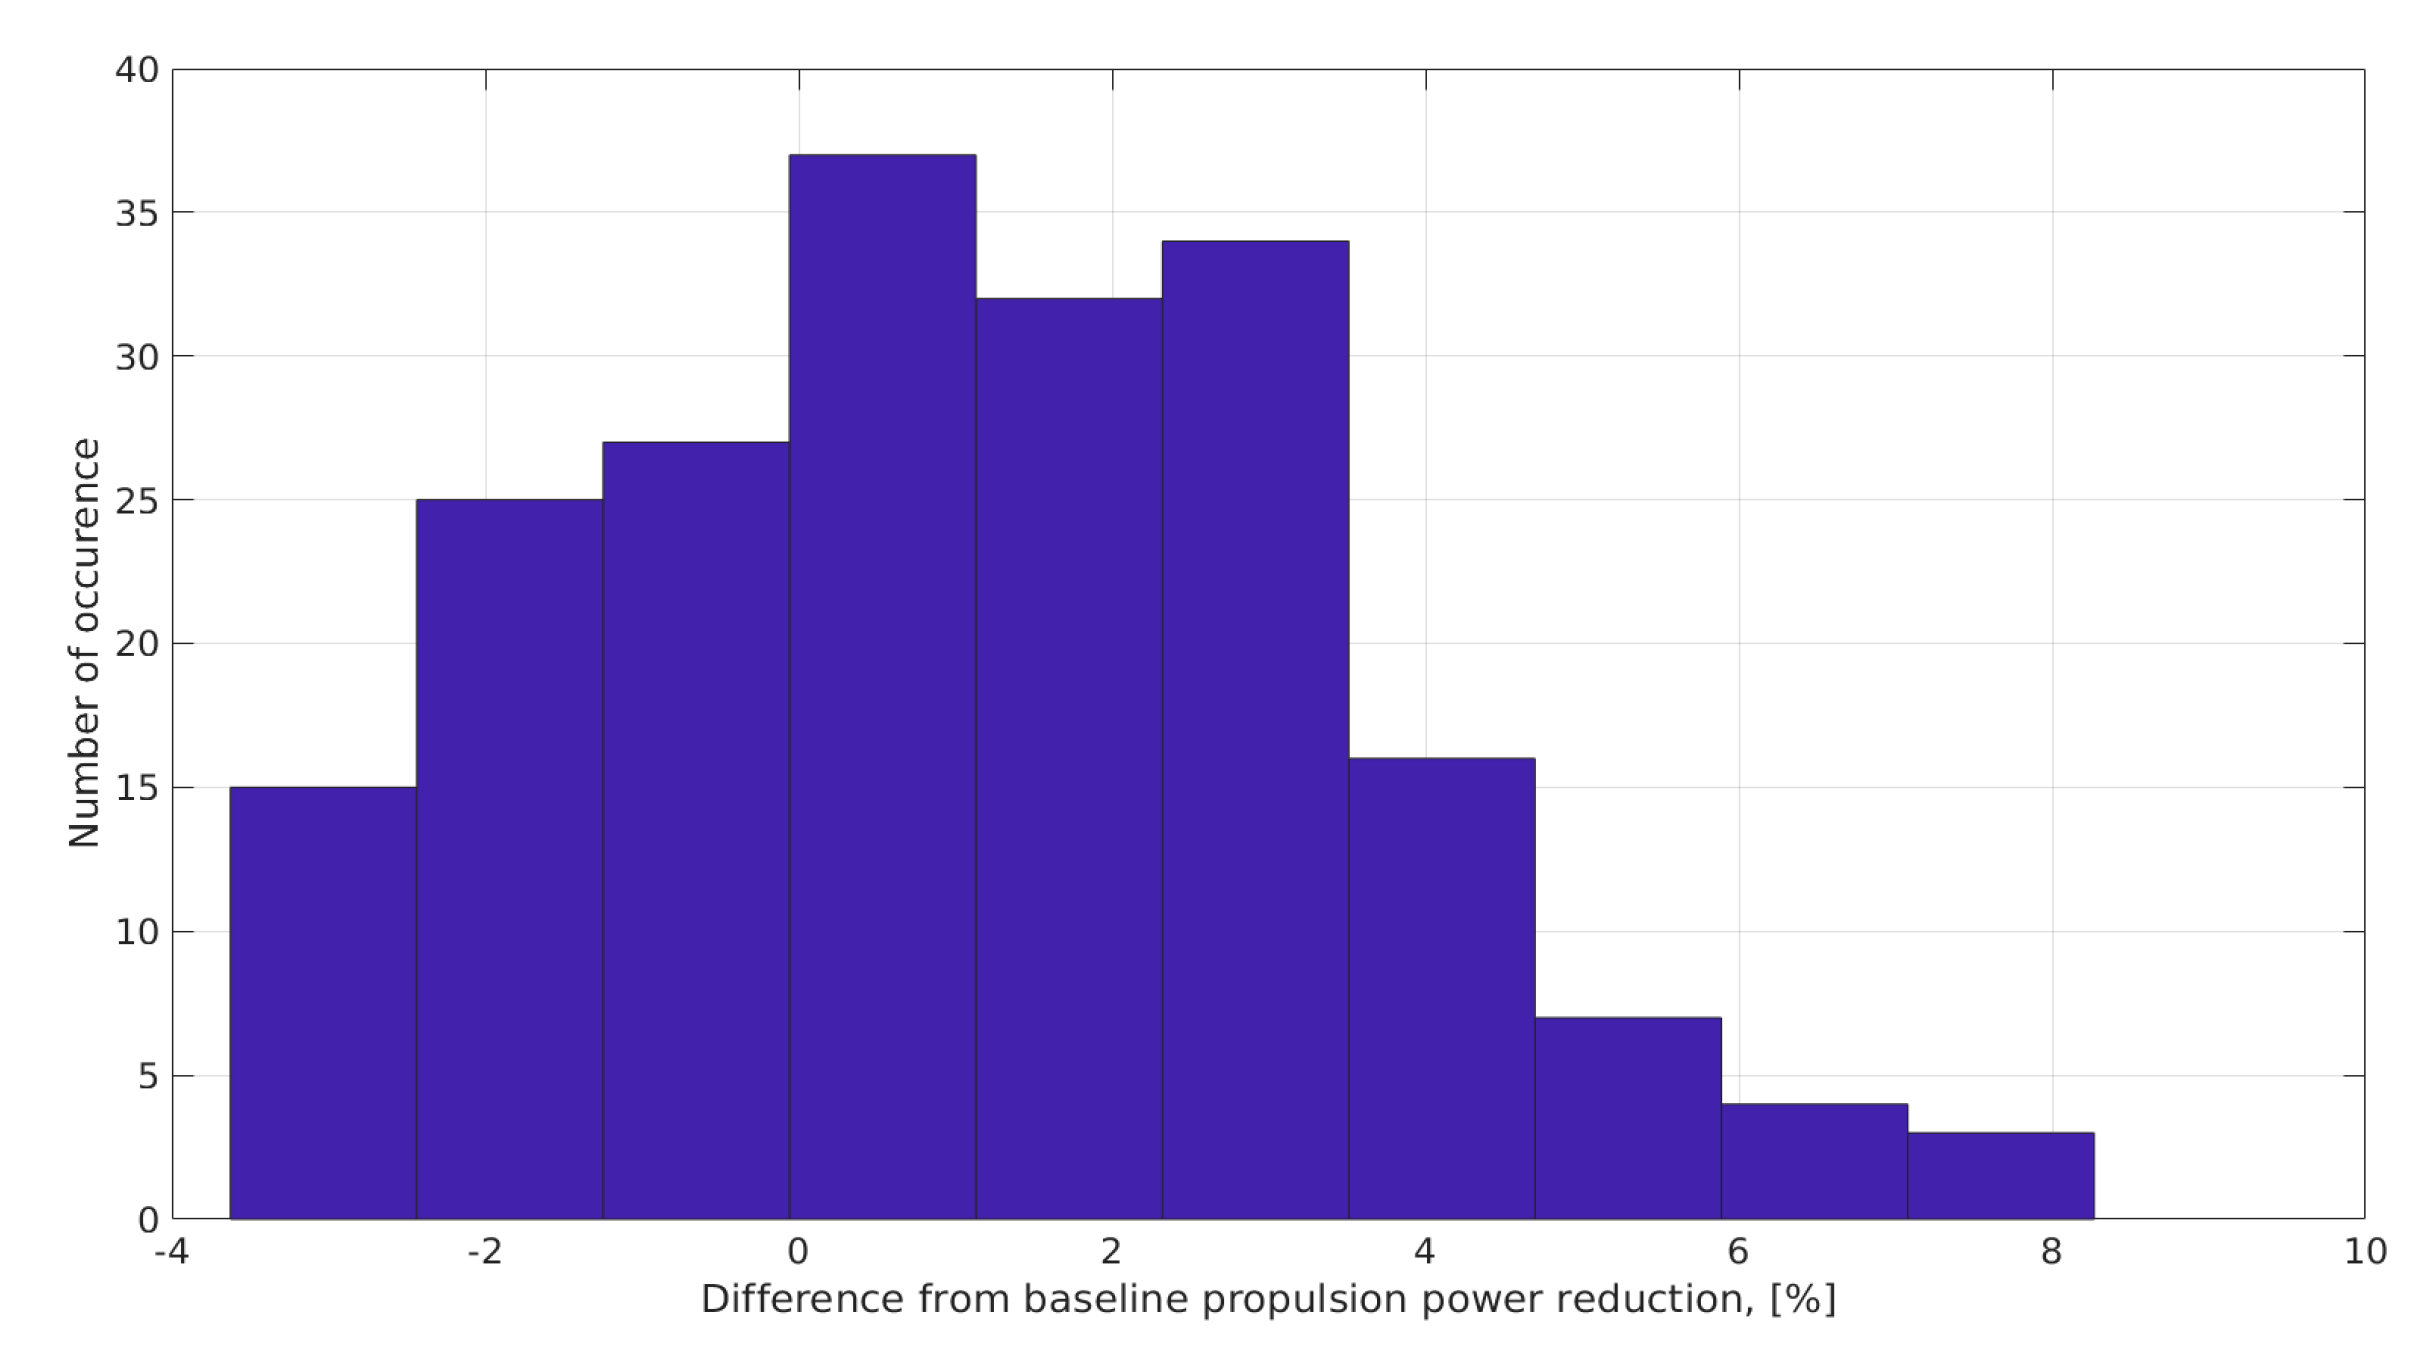
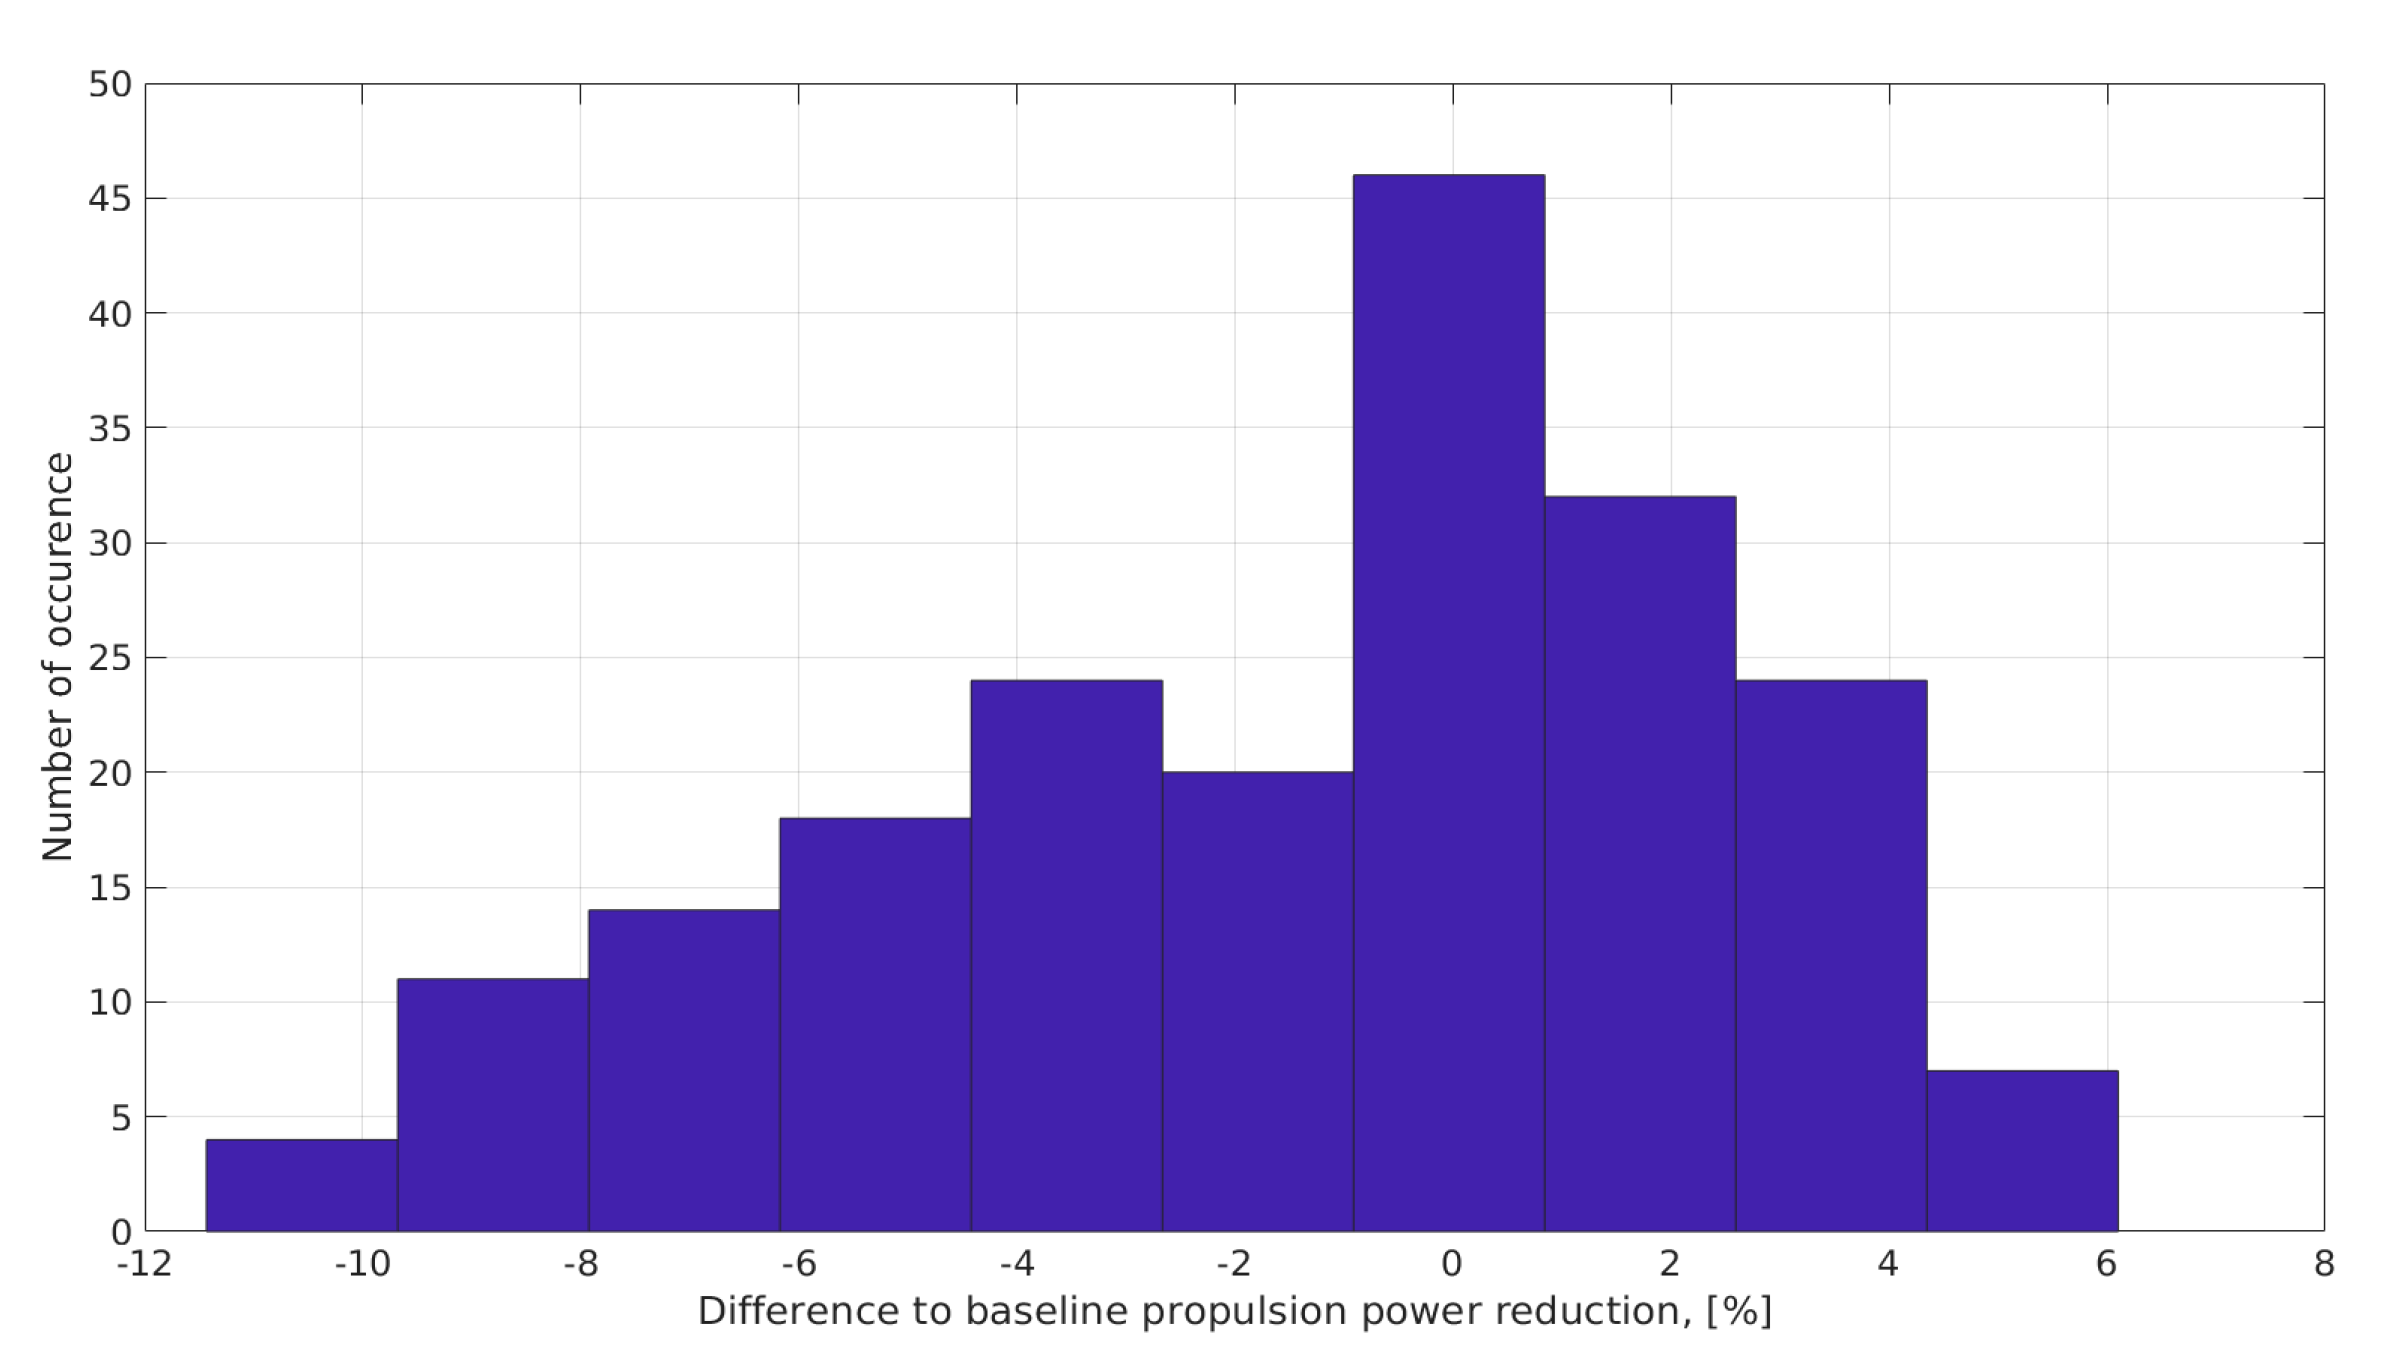
The results are presented as histograms in
Figure 11 and
Figure 12, for the one-rotor and the two-rotor ship, respectively. As in above sections, the differences in propulsion power savings are presented, i.e., a value of 1% stands for a 1% difference and equals about 0.2% power saving for the one-rotor ship.
For the one-rotor ship, the mean value is found at about 1.1% difference and the standard deviation is found to be 2.5% difference. For the two-rotor ship, these values are 1.4% (mean value) and 3.9% (standard deviation). Hence, the standard deviation in terms of absolute power reduction is less than 1% for both setups. The two-rotor ship shows higher standard deviations due to the increased drift from large sail forces and thus higher importance of the lift and drag of the drifting hull, which unfortunately are modeled with a high uncertainty.
6. Conclusions
This study presented and discussed the potential performance and design variations of WASP systems on a ferry operating in the Baltic Sea. Uncertainties in the prediction and modeling were discussed and quantified.
During design variations, the longitudinal position of the WASP systems showed to be important, with the power reductions varying between 10% (least favorable position) and 14% (best position). A comparison of different sail areas, i.e., number of sails, showed that the power reduction does not increase linearly with the number of sails or the sail area. This is mainly found to be due to non-linearly increasing drift and rudder forces, increased trim possibilities for ships with multiple sails and constraints on the maximum rudder angles. A comparison of different sail types showed that similar performance can be achieved by adjusting the areas of the different sail types. However, the non-linear drag from drifting and the limits on the rudder forces showed to be important for high sail areas. It was shown that a high lift-to-drag ratio is favorable for highly wind-assisted or purely wind-powered ships. It must be concluded that a comparison of different sail types is only possible considering the running costs and installation requirements/ constraints.
A sensitivity study with seven parameters and a variation study using ShipCLEAN were presented.
During the sensitivity study, the lift coefficient of the sails, the drag coefficient of the drifting hull and the apparent wind angle showed to be the most important factors for accurate performance prediction. It was shown that the lift and drag of the drifting hull especially become more important when the sail area is increased.
The randomized variations study showed that, despite the high uncertainties in predicting the drift forces of the hull, ShipCLEAN can predict the propulsion power reduction with a standard deviation of less than 1% power reduction. Respecting the increasing importance of the lift and drag of the drifting hull and the high uncertainties when predicting these parameters, it must be concluded that more sophisticated methods must be used or developed for ships with large sail area or purely wind-propelled ships. However, for WASP installations as seen currently, generic models such as ShipCLEAN are sufficient.
Author Contributions
Conceptualization, F.T. and J.W.R.; Methodology, F.T.; Software, F.T.; Writing—original draft, F.T. and J.W.R.; Writing—review & editing, J.W.R.; Project administration, J.W.R.; Funding acquisition, J.W.R. All authors have read and agreed to the published version of the manuscript.
Funding
This study received funding from Chalmers University of Technology Foundation for the strategic research project “Hydro- and aerodynamics”. It also received funding from the EU Interreg North Sea Europe program from the project “WASP—Wind Assisted Ship Propulsion; Run wind propulsion technology real life trials on sea going ships in operation, showcase proven concepts, market adaptation, green sea transport” (project no 38-2-6-19;
https://northsearegion.eu/wasp/ (accessed on 5 January 2023)).
Data Availability Statement
The data presented in this study are available on request from the corresponding author. The data are not publicly available due to confidentiality agreements with the project partners.
Conflicts of Interest
The authors declare no conflict of interest.
References
- IMO. 2018. (Online). Available online: http://www.imo.org/en/OurWork/Environment/PollutionPrevention/AirPollution/Pages/GHG-Emissions.aspx (accessed on 21 August 2021).
- Kramer, J.; Steen, S.; Savio, L. Drift forces—Wingsails vs. Flettner rotors. In Proceedings of the International Conference on High Performance Marine Vehicles, Cortona, Italy, 17–19 October 2016. [Google Scholar]
- van der Kolk, N.; Keuning, J.; Huijsmans, R. Part 1: Experimental validation of a RANS-CFD methodology for the hydrodynamics of wind-assisted ships operating at leeway angles. Ocean Eng. 2019, 178, 375–387. [Google Scholar] [CrossRef]
- Tillig, F.; Ringsberg, J.W. A 4 DOF simulation model developed for fuel consumption prediction of ships at sea. Ships Offshore Struct. 2019, 14 (Suppl. S1), 112–120. [Google Scholar] [CrossRef]
- Tillig, F.; Ringsberg. Design, operation and analysis of wind-assisted cargo ships. Ocean Eng. 2020, 211, 107603. [Google Scholar] [CrossRef]
- Viola, I.M.; Sacher, M.; Xu, J.; Wang, F. A numerical method for the design of ships with wind-assisted propulsion. Ocean Eng. 2015, 105, 33–42. [Google Scholar] [CrossRef]
- Tillig, F. Simulation Model of a Ship’s Energy Performance and Transportation Costs. Ph.D. Thesis, Chalmers University of Technology, Gothenburg, Sweden, 2020. [Google Scholar]
- Gerhardt, F.C.; Werner, S.; Li, D.; Malmek, K. Levelling the Playing Field: A Numerical Platform for the Fair Comparison of Wind Propulsion Systems. In Proceedings of the International Conference on High Performance Marine Vehicles, Cortona, Italy, 29–31 August 2022. [Google Scholar]
- Tillig, F.; Ringsberg. Performance prediction and design of wind-assisted propulsion systems. In Proceedings of the International Conference Wind Propulsion, London, UK, 15–16 September 2021; pp. 43–47. [Google Scholar]
- Tillig, F.; Ringsberg, J.W.; Mao, W.; Ramne, B.J. Analysis of the reduction of uncertainties in the prediction of ships’ fuel consumption—From early design to operation conditions. Ships Offshore Struct. 2018, 13 (Suppl. S1), 13–24. [Google Scholar] [CrossRef]
- Norsepower. Rotor Sail Solutions to Save Fuel- and the Planet; Norsepower: Helsinki, Finland, 2022; Available online: https://www.norsepower.com/download/brochure.pdf (accessed on 9 December 2022).
- Abbot, I.H.; von Doenhoff, A.E. Theory of Wing Sections; Dover Publications: Mineola, NY, USA, 1959. [Google Scholar]
- Barros, E.; Pascoal, A.; de Sa, E. Investigation of a method for predicting AUV derivatives. Ocean Eng. 2008, 35, 1627–1636. [Google Scholar] [CrossRef]
- Hooft, J. The cross-flow drag on a manoeuvring ship. Ocean Eng. 1996, 21, 329–342. [Google Scholar] [CrossRef]
- Inoue, S.; Hirano, M. A practical calculation method of ship manoeuvring motion. Int. Shipbuild. Prog. 1987, 28. [Google Scholar] [CrossRef]
- Norsepower. Viking Grace Rotor Sail Performance Analysis Results; Norsepower: Helsinki, Finland, 2019; Available online: https://7c859085-dddb-4d30-8667-a689091113a8.filesusr.com/ugd/cea95e_a721091625ee452db73c9fb69804268e.pdf (accessed on 1 November 2022).
- Bordogna, G.; Muggiasca, S.; Giappino, S.; Belloli, M.; Keuning, J.; Huijsmans, R. Experiments on a Flettner rotor at critical and supercritical Reynolds numbers. J. Wind Eng. Ind. Aerodyn. 2019, 188, 19–29. [Google Scholar] [CrossRef]
- Li, D.; Leer-Andersen, M.; Allenström, B. Performance and vortex formation of Flettner rotors at high Reynolds numbers. In Proceedings of the 29th International Symposium on Naval Hydrodynamics, Gothenburg, Sweden, 26–31 August 2012. [Google Scholar]
- Schoot, J. Effective wind modelling for performance prediction, including for EEDI/EEXI. In Proceedings of the BlueWeek 2022, Rotterdam, The Netherland, 13–14 June 2022. [Google Scholar]
- Garzon, F.; Figueroa, A. The Study on the Flow Generated by an Array of Four Flettner Rotors: Theory and Experiment. Appl. Math. 2017, 8, 1851–1858. [Google Scholar] [CrossRef]
| Disclaimer/Publisher’s Note: The statements, opinions and data contained in all publications are solely those of the individual author(s) and contributor(s) and not of MDPI and/or the editor(s). MDPI and/or the editor(s) disclaim responsibility for any injury to people or property resulting from any ideas, methods, instructions or products referred to in the content. |
© 2023 by the authors. Licensee MDPI, Basel, Switzerland. This article is an open access article distributed under the terms and conditions of the Creative Commons Attribution (CC BY) license (https://creativecommons.org/licenses/by/4.0/).


