Abstract
Ground-based synthetic aperture radar (GB-SAR), as a new non-contact measurement technique, has been widely applied to obtain the dynamic deflection of various bridges without corner reflectors. However, it will cause some high-frequency noise in the obtained dynamic deflection with the low signal-to-noise ratio. To solve this problem, this paper proposes an innovative high-frequency de-noising method combining the wavelet synchro-squeezing transform (WSST) method with the extreme point symmetric mode decomposition (ESMD) method. First, the ESMD method is applied to decompose the observed dynamic deflection signal into a series of intrinsic mode functions (IMFs), and the frequency boundary of the original signal autocorrelation is filtered by the mutual information entropy (MIE) for each IMF pair. Second, the high-frequency IMF components are fused into a high-frequency sub-signal. WSST is performed to remove the influence of noise to reconstruct a new sub-signal. Finally, the de-noised bridge dynamic deflection is reconstructed by the new sub-signal, the remaining IMF components, and the residual curve R. For the simulated signal with 5 dB noise, the signal-to-noise ratio (SNR) after noise reduction is increased to 11.13 dB, and the root-mean-square error (RMSE) is reduced to 0.30 mm. For the on-site experiment for the Wanning Bridge, the noise rejection ratio (NRR) is 5.48 dB, and ratio of the variance root (RVR) is 0.05 mm. The results indicate that the proposed ESMD-WSST method can retain more valid information and has a better noise reduction ability than the ESMD, WSST, and EMD-WSST methods.
1. Introduction
As an important part of infrastructure in the process of urbanization, bridges are getting more and more attention [1]. Because of rain erosion, acid corrosion, overloading, etc., a bridge will gradually show deformation and cracks, which result in a decrease in its loading capacity [2]. These conditions may directly lead to the collapse of the bridge, causing property and life losses. Therefore, it is necessary to determine the operational state of bridges [3]. The dynamic deflection, a time series signal, is an indicator that reflects the operational status of a bridge, which can used to obtain the deformation of a joint position of a bridge and further detect the degree of abnormality [4,5]. As a new non-contact measurement technology, ground-based synthetic aperture radar (GB-SAR), has been widely used in collecting dynamic deflection information with the advantages of fast speed, wide range, and high precision [6,7].
Figure 1 shows the signal flow for dynamic deflection acquisition using a GB-SAR radar wave. The beam starts from the radar transmitting unit, propagates through the air medium, and reaches the surface of the measured object. It is reflected by the measured object, and the reflected wave is received by another radar unit. By calculating the phase difference of the two reflected waves, the displacement information of the measured object can be obtained from the initial time to the time . Because the received signal will only select the echo with the highest reflection intensity, the reflectivity of the surface of the measured object needs to be relatively high compared to the surrounding environment. Before the radar wave is emitted from the unit, the GB-SAR instrument will contain a systematic error, which is the first part of the noise. The second part of the noise is generated after the launched beam. The radar wave transmission will be affected by atmospheric refraction and environmental disturbances around the instrument. It should be noted that, similarly, this effect will also occur during the echo process, thereby increasing the noise content in the signal. Because the dynamic deflection measurement studies the vibration generated by the vehicle excitation, the natural vibration of the bridge is the third part of the noise information that needs to be removed [8]. In this case, to effectively reduce the influence of noise and improve the accuracy of bridge abnormality detection, it is necessary to perform a de-noising processing for the bridge dynamic deflection signal obtained by GB-SAR.
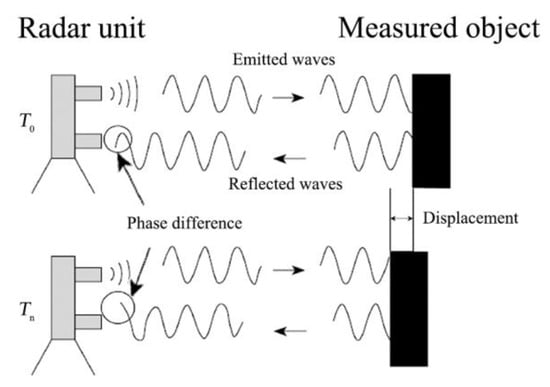
Figure 1.
Signal flow of GB-SAR radar wave.
At present, the commonly used de-noising methods for time series signals include the filtering method [9,10], the empirical mode decomposition (EMD) method [11,12], and the wavelet transform method [13,14]. The filtering method usually relies on the prior information for signal de-noising [9]. When the main vibration frequency is known, most of the noise can be removed by frequency filtering. Therefore, without prior information, the filtering method is obviously not applicable in the non-stationary nonlinear dynamic deflection signal. To deal with the non-stationary nonlinear signal, the EMD method is proposed to adaptively decompose a signal into a series of intrinsic mode functions (IMFs) [11]. However, there is a problem of mode mixing in the decomposed IMF components by the EMD method, which affects the accuracy of the results [12]. To solve the problem of mode mixing, the ensemble empirical mode decomposition (EEMD) method and the extreme-point symmetric mode decomposition (ESMD) method are proposed [15,16,17,18]. The EEMD method decomposes a signal with the added white noise and calculates the average value of multiple decomposed IMFs to alleviate mode mixing [15]. However, it still requires empirical estimation to select an effective IMF component. Due to the oneness of white noise added by the EEMD method, it still contains the residual noise [16]. The ESMD method is a new time–frequency analysis method based on Hilbert–Huang transform (HHT) improvement proposed by Wang et al. [17]. Compared with the EMD method, the ESMD method adopts the internal extremum symmetrical interpolation to form the signal envelope, which reduces the influence of the uncertainty of the low-frequency component interpolation line [18]. It can improve the linear interpolation to increase the stability of the signal decomposition and the phenomenon of excessively steep boundaries [18]. Moreover, the ESMD method adopts the direct interpolation method for spectrum analysis, which can not only directly reflect the time-varying amplitude and frequency of each mode, but also clearly identify the instantaneous energy change [17,18,19]. In addition, the ESMD method uses the least squares method to optimize the final residual mode and obtains the best adaptive global mean (AGM) [19], which can effectively reduce the difficulty of determining the number of modal decomposition screening and the mode mixing effect [20]. In conclusion, the traditional EMD, EEMD, and ESMD methods are commonly used to reduce the effect of noise by removing a certain number of low-order IMFs with relatively high frequencies. However, the effective information will be lost in the high-frequency part, and there will still be residual high-frequency noise in the remaining IMFs [11,16,18].
Due to the good localization characteristics, wavelet transform is commonly used for high-frequency signal de-noising [14]. To retain more effective information of the signal, Daubechies et al. proposed a wavelet-based synchro-squeezing transform (WSST) method based on the idea of EMD decomposition [21]. It can reduce the time–frequency spectrum blur caused by wavelet energy diffusion and noise, and improve the time–frequency resolution by rearranging the frequency of the wavelet transform results [22]. Because the reconstruction of the resulting signal is supported, the WSST method is also widely used in signal de-noising [23,24,25,26,27]. However, the WSST method can be affected by the choice of wavelet basis function and wavelet threshold criterion. Especially in the case of sudden changes in environmental noise, it is difficult to identify short-term high-frequency changes with the WSST method [23,24]. To solve this problem, Qin et al. integrated the EMD and WSST methods to de-noise the seismic signals, which obtained more accurate results [28]. However, due to the shortcoming of too steep a boundary in the decomposed signal by the EMD method, it still has the problem of modal mixing for the non-stationary nonlinear dynamic deflection signal with a short time window.
To deal with the non-stationary nonlinear dynamic deflection collected by GB-SAR, this paper proposes an innovative ESMD-WSST high-frequency de-noising method, which can retain more effective information of the signal while high-frequency de-noising. The original GB-SAR signal is decomposed into a series of IMF components by the ESMD method, which can avoid the boundary effect and modal mixing problem. The mutual information entropy (MIE) is adopted to distinguish the frequency boundaries of the decomposed IMFs, and the high-frequency sub-signal can be obtained from the fusion of high-frequency IMFs. The WSST method is used to de-noise the high-frequency sub-signal, which greatly reduces the impact of environmental noise without losing high-frequency effective information.
2. Methodology
The overall workflow of the proposed ESMD-WSST method is shown in Figure 2, which includes the following key steps: (1) Obtain the multiple IMF components in different frequencies of the dynamic deflection signal collected by GB-SAR by performing ESMD decomposition. (2) Select a pair of IMFs with the lowest MIE value as the frequency boundary of the original signal, and fuse the high-frequency IMFs as a new high-frequency sub-signal. (3) Perform WSST to remove the influence of high-frequency noise in the high-frequency sub-signal, and reconstruct the de-noised signal together with the remaining IMF components and the residual curve R.
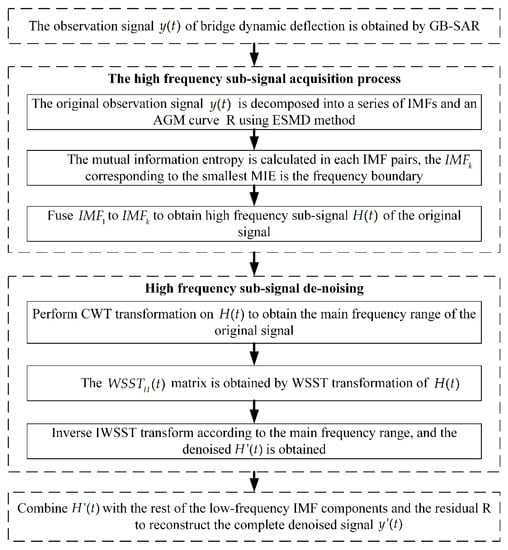
Figure 2.
The overall workflow of the ESMD-WSST method.
2.1. Mutual Information Entropy
Denote the bridge dynamic deflection signal as , which is a one-dimensional time series. It can be decomposed using the ESMD method to obtain a series of IMFs with different frequencies and an AGM curve R as follows:
where represents the number of the decomposed IMFs, represents the IMF components, and represents the AGM curve. In the ESMD method, the decomposition is adaptive. An AGM curve is formed by the midpoint of the adjacent extremum points to sequentially extract the IMF from the signal. The number of IMFs decomposed from each signal is only related to the complexity of the signal and has no correlation with the remaining extreme points of the decomposition or the number of screenings. As the proposed ESMD-WSST method has not been changed or optimized within the ESMD method, for detailed decomposition steps, please refer to [17].
For the two adjacent IMF components and (which can be treat as a pair of IMFs), the joint distribution probability is the marginal distribution probability, which can be expressed as and . According to the definition of information entropy, the joint distribution entropy is obtained as
The MIE can be defined as
Because and are independent of each other, it can be proved by Jensen’s inequality that the addition of variable can reduce the entropy of . Therefore, it can be found that:
MIE can also be a measure of the correlation between the different IMF pairs. The closer the entropy is to zero, the lower the correlation between and . The set of the IMF pair with the lowest MIE can be defined as the frequency boundary between the high and low frequency of the signal , which can be defined as follows:
where represents the IMF sequence number corresponding to the high and low frequency boundary of the original signal . After successfully distinguishing the frequency boundary, the high-frequency signal and low-frequency signal can be constructed according to Equations (6) and (7).
2.2. ESMD-WSST De-Noising Method
The main steps of the proposed ESMD-WSST de-noising method are as follows:
- Decompose the original signal into a series of IMFs and an AGM curve R.
- Use MIE to calculate the correlation of IMF pairs, where the search parameter represents the minimum value of MIE, and the corresponding IMF pair is the frequency boundary.
- The high-frequency sub-signal of the original signal is obtained by Equation (6).
- Perform continuous wavelet transform (CWT) on sub-signal to obtain the wavelet transform coefficients and instantaneous frequency using Equations (9) and (10),where is the wavelet basis, and when , the Fourier transform of is .
- Perform WSST on sub-signal ,where the range of satisfies the interval , is the lth discrete angular frequency, is the kth discrete scale, , and .
- Inverse transform is adopted to obtain the compressed de-noised signal using Equation (12),where takes a finite value, and is the conjugate Fourier transform of the basic wavelet function .
- Combine with the remaining to obtain the de-noised dynamic deflection signal .
The WSST method has a good recognition effect on high-frequency changes, but it is relatively poor in the low-frequency part. Through the decomposition of step 1, applying step 2 to extract the high frequency signal can avoid the low-frequency part from participating in the WSST de-noising and preserve more low-frequency effective information. Perform WSST de-noising in steps 3–6 for the high-frequency part. Because the low-frequency part is not involved, the frequency window of WSST is reduced to a certain extent. The resolution of WSST compression is improved, and the de-noising effect is enhanced.
3. Experiments and Analysis
3.1. Simulated Experiment and Analysis
The signal collected by GB-SAR is harmonic, and in the process of dynamic loading, the signal will produce short-time high-frequency (negative or positive) displacement changes. In this situation, to verify the proposed ESMD-WSST de-noising method for bridge dynamic deflection signals with low signal-to-noise ratio (SNR) using GB-SAR, the simulated signals are designed as follows:
where the simulated signal , and is the Gaussian white noise with an SNR of 5 dB. The sampling frequency of all sub-signals is 100 Hz. The total sampling time is 120 s with 12,000 sampling points. The constructed signal is shown in Figure 3. It can be seen that in Figure 3 is used as a true value original signal, and it has a vibration curve similar to that of a vehicle passing the bridge at a constant speed in the interval of 40–80 s. The expression is the low SNR signal after adding white noise to .
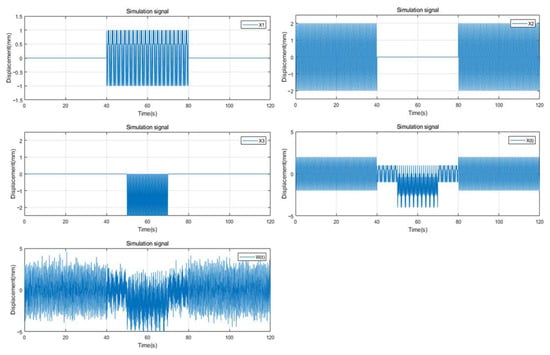
Figure 3.
The simulated signal and its constituent sub-signals.
In this study, the simulated experiment is illustrated by comparing the results with the ESMD, WSST, and EMD-WSST methods. Except for the signal decomposition part, all other steps and internal parameters of the EMD-WSST method are consistent with the proposed ESMD-WSST method. Two evaluation indicators, SNR and root-mean-square error (RMSE), are adopted to quantify the de-noising effect of each method [29], which are described as follows:
where represents the true value of the original signal, represents the value of the de-noised signal, and represents the number of sampling points.
The proposed method aims to retain more effective information while de-noising. According to Equation (15), when the effective information in the signal is removed together with the noise, the value of SNR may still be greatly improved. As the SNR can only reflect the noise content of the signal after de-noising, the effectiveness of the proposed method cannot be evaluated only using the SNR. Combining with the RMSE, which can reflect the similarity of the signals, the results can more accurately reveal the retention of the effective information. The results of the four methods are compared in Table 1. The visualization results of the experiment are shown in Figure 4. Inspection of this figure and table highlight the following features: (1) Compared with the original signal, the SNR of the de-noised signal is increased by 6.3 dB by the proposed ESMD-WSST method, and the RMSE is reduced by 0.473 mm. (2) Compared with the other three methods, the RMSE value of proposed method is 0.3049 mm, which is the smallest of all. It shows that it has the highest similarity with the original signal for the de-noised signal by the proposed method, which indicates that the ESMD-WSST method is able to retain more useful information in the de-noised signal. (3) The SNR of the de-noised signal is 11.33 dB by the proposed method, which is the highest among the listed four methods. Although it is only 1.17 dB higher than the ESMD method with SNR being 10.16 dB, considering that it has a lower RMSE result for the proposed method, it has more effective information and less noise for the de-noised signal by the proposed method. Therefore, the results of simulation experiments indicate that the proposed ESMD-WSST de-noising method retains more signal effective information while reducing noise, and it has a stronger de-noising ability than the ESMD, WSST, and EMD-WSST methods.

Table 1.
Comparison of SNR and RMSE among the four de-noised methods.
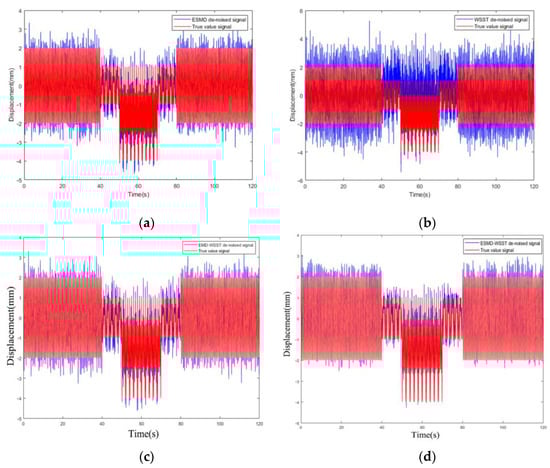
Figure 4.
Curve comparison between the de-noised signal and true value signal: (a) curve comparison between the ESMD de-noised signal and true value signal, (b) curve comparison between the WSST de-noised signal and true value signal, (c) curve comparison between the EMD-WSST de-noised signal and true value signal, (d) curve comparison between the ESMD-WSST de-noised signal and true value signal.
These differences in results are, on the one hand, caused by the different decompositions of the EMD and ESMD methods. Figure 5a,b show the results of the decomposed IMFs of the noisy signal using the ESMD and EMD methods, respectively. Because both methods are adaptive to the signal decomposition, the number of decomposed IMF is only related to the complexity of the original signal. The decomposed 9 IMFs and R are obtained by the EMD method, which are less than the decomposed 11 IMFs and an AGM curve R obtained by the ESMD method. As shown in the red areas in Figure 5b, the reason is that the decomposed IMF2 and IMF4 get different degrees of modal mixing, which would lead to the deviation of the MIE calculation and further cause one to misjudge the frequency boundary of the signal and affect the noise reduction effect.
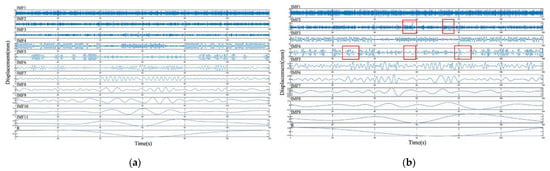
Figure 5.
Simulated original signal decomposition by the ESMD method and EMD method: (a) decomposed IMFs and an R by the ESMD method, and (b) decomposed IMFs and an R by the EMD method. (Red area shows obvious modal mixing).
On the other hand, in the process of WSST, the content of the noise part of the signal will also affect the noise reduction effect. According to the obtained MIE in Table 2, IMF1 and IMF2 are fused to acquire the high-frequency sub-signal by the ESMD-WSST method. Similarly, according to the obtained MIE in Table 3, is formed by combining IMF1 to IMF7 by the EMD-WSST method. The WSST spectrogram of , , and are shown in Figure 6. The red boxes in the figure mark the absence of low-frequency effective information. It can also be seen from the figure that (a) has the largest proportion of noise energy, followed by (b), and (c) is the smallest. Due to the different number of mixed IMFs, the effective information content of the three signals presented by the spectrogram is also different. For this reason, the energy of the noise for is larger, and the noise mixing will be reduced through the signal reconstructing. Moreover, the ESMD de-noising method directly removed the high-frequency sub-signal with noise, together with the effective information. Therefore, the RMSE value obtained by the ESMD method is not as good as that by the proposed ESMD-WSST method. In conclusion, the RMSE value can reflect the effective information proportion of the de-noised signal. The smaller the RMSE, the higher the effective information content. Therefore, compared with other de-noising methods, the proposed ESMD-WSST method can retain more high-frequency effective information of the original signal.
Table 2.
MIE between the IMFs decomposed by the ESMD method.
Table 3.
MIE between the IMFs decomposed by the EMD method.
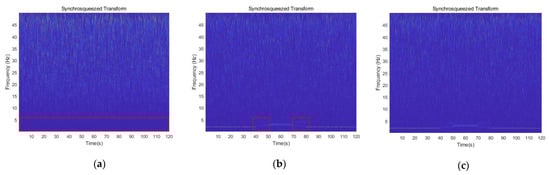
Figure 6.
Spectrogram of WSST results: (a) WSST spectrogram of high-frequency sub-signal , (b) WSST spectrogram of high-frequency sub-signal , and (c) WSST spectrogram of original signal . (Red area represents the difference in content of low-frequency effective information in each signal).
3.2. On-Site Experiment and Analysis
The Wanning Bridge is selected as the experimental bridge in this study to validate the accuracy of the proposed de-noising method for the dynamic deflection obtained by GB-SAR. The Wanning Bridge is a single-hole solid belly stone arch bridge with a span of 6.8 m, which is located on Di’anmenwai Street, Beijing, China, as shown in Figure 7a. It is still performing its traffic function as an important bridge in Beijing with a history of 500 years. To ensure its carrying capacity and the safety of vehicle traffic, it is necessary to monitor the Wanning Bridge regularly. Imaging by interferometry survey (IBIS-S), a kind of GB-SAR instrument, was used to obtain the dynamic deflection of the monitored bridge [30,31]. For a detailed introduction to IBIS-S, please refer to [30]. In order to obtain the dynamic deflection of the middle-span of the bridge completely, the IBIS-S instrument was placed under the bridge, facing the centerline of the lower surface of the bridge arch, as shown in Figure 7b. The angle of the radar unit was set to 25°, the range resolution was 0.75 m, so that the radar beam can cover more of the bridge surface. The radar was set at a vertical distance of 1.2 m from the bottom of the bridge. The sampling frequency was 99.8 Hz, and the data acquisition time was 120 s.
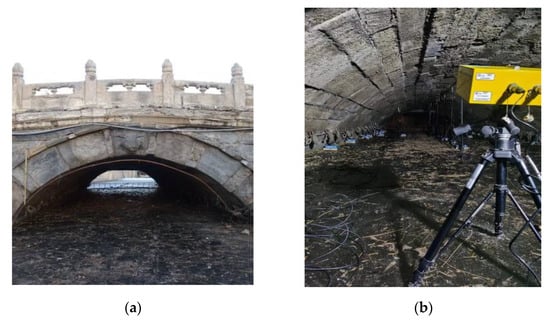
Figure 7.
The Wanning Bridge and the IBIS-S instrument layout. (a) The Wanning Bridge and (b) layout of IBIS-S for the Wanning Bridge.
Figure 8 shows the obtained dynamic deflection at the mid-span point of the Wanning Bridge. Due to the construction in ancient times, the reflectivity of the stone structures on the underside of the bridge is quite different, which affects the noise content of the dynamic deflection collected by GB-SAR. Moreover, the influence of the surrounding environment and the instrument itself make the noise information mixed with the measured dynamic deflection unavoidable. Therefore, to improve the accuracy of the obtained dynamic deflection at the mid-span point of the Wanning Bridge and to facilitate its regular monitoring, it is necessary to reduce the noises in the monitored dynamic deflection signal.
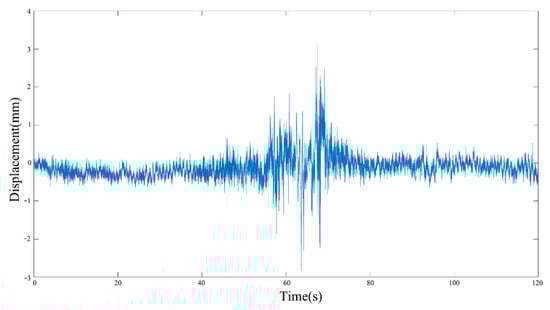
Figure 8.
Dynamic deflection data of the mid-span point on the Wanning bridge.
As shown in Figure 9, is decomposed into 11 IMFs and an AGM curve R. The MIE of each IMF pair is calculated, shown in Table 4. As described in Section 2, the IMF pair corresponding to the smallest MIE indicates the frequency boundary of signal . Therefore, IMF1 and IMF2 are fused to obtain the high-frequency sub-signal of .
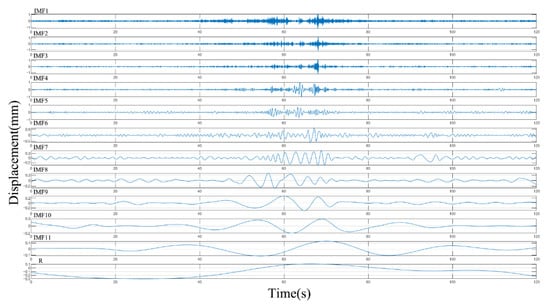
Figure 9.
The decomposed 11 IMFs components and an AGM curve R of by the ESMD method.
Table 4.
MIE between the IMFs decomposed by the ESMD method for signal .
Figure 10 shows the comparison between the original signal and the de-noised signal by the method proposed in this paper. The collected signal starts to enter the strong load from approximately 50 s and lasts until the load disappears at approximately 80 s. During this period, the vibration frequency of the effective information in the signal increases. The results indicate that the proposed ESMD-WSST method does not lose much high-frequencies effective information and reduces the noise interference, which is very effective for noise reduction of the dynamic deflection signal collected by GB-SAR.
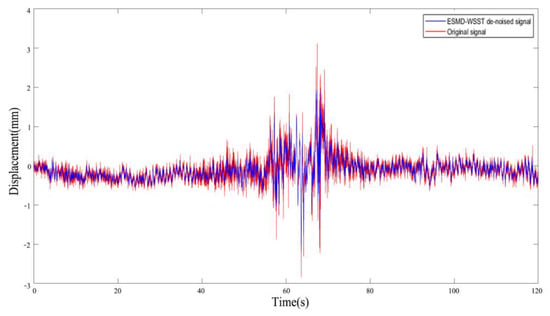
Figure 10.
Curve comparison between ESMD-WSST de-noised signal and the original signal.
Because the SNR and RMSE need to use the noise-free ground-truth signal as a reference, the actual value of the observed signal cannot be obtained in the experiment. In this study, the noise rejection ratio (NRR) and ratio of the variance root (RVR) are adopted to evaluate the noise reduction effect of the proposed ESMD-WSST method. In general, the larger the NRR is and the smaller RVR is, the better the de-noised effect is [19,32]. NRR can reflect the ability to resist interference, which is defined as
where and are the variance of the signals before and after signal de-noising.
RVR could reflect the smoothness of the noise signal, which is defined as
where is the jth element of the original signal, is the jth element of the de-noised signal, and is the number of sampling points.
To quantify the noise suppression efficiency, the de-noising evaluations NRR and RVR of the ESMD, WSST, EMD-WSST, and ESMD-WSST method are shown in Table 5. The NRR and RVR of the proposed method are 5.48 dB and 0.0501 mm. Due to the small variance of the original signal, the improvement in NRR is not huge. However, compared with other three methods, the proposed ESMD-WSST method still has a significant improvement in NRR. At the same time, the de-noising effect is evaluated together with RVR. Therefore, the method proposed in this paper is more suitable for de-noising the GB-SAR bridge dynamic deflection.
Table 5.
Comparison of NRR and RVR among the four de-noised methods.
4. Conclusions
The ESMD de-noising method reduces the influence of high-frequency noise by removing low-order IMFs, and it inevitably loses the effective information of the high-frequency part. The WSST method suppresses the influence of noise by compressing the components near the main frequency range. However, due to the influence of the wavelet basis, the processing effect of the short-term frequency conversion signal is poor. Therefore, to improve the accuracy of the obtained bridge dynamic deflection by GB-SAR, an innovative high-frequency de-noising approach integrating the ESMD and WSST methods is proposed in this study. The results from both simulation and practical experiments clearly highlight the following:
- The feasibility and accuracy of the proposed ESMD-WSST de-noising method are verified by simulation experiments. In the low signal-to-noise ratio (5 dB) environment, the SNR of the proposed method after noise reduction is 11.33 dB, and the RMSE value is 0.3049 mm, which is far superior to the traditional ESMD, WSST, and EMD-WSST methods.
- Considering the high-frequency noise content (low original SNR) and short-term high-frequency changes of bridge dynamic deflections collected by GB-SAR, the high-frequency IMF components decomposed by the ESMD method are fused by IME classification, and the high-frequency noise is compressed by the characteristics of WSST transform. It greatly preserves the effective information in the high frequency and improves the accuracy of the bridge dynamic deflection obtained by GB-SAR.
- The evaluation indicators in both the simulation experiment and the on-site bridge experiment show that the proposed ESMD-WSST de-noising method has a good noise reduction ability for the actual GB-SAR dynamic deflection, which not only reduces the impact of noise, but also retains more effective information.
In summary, the method proposed in this paper can effectively de-noise the bridge dynamic deflection obtained by GB-SAR. It is speculated that this method is also applicable to signals with short-term high-frequency changes, such as strong earthquake signals and explosion signals. Due to experimental limitations, no demonstration has been con-ducted for other types of signals. At the same time, this method aims to extract more effective information from low SNR signal. When general noise removal is carried out for signals with high initial SNR, the results of proposed method cannot be guaranteed to be better. Future developments can extend the proposed method to the field of image noise reduction or experiment with additional signals.
Author Contributions
Conceptualization, X.L., S.Z. and R.W.; methodology, X.L., S.Z. and R.W.; validation, X.L., S.Z. and R.W.; formal analysis, S.Z. and R.W.; data curation, X.L.; writing—original draft preparation, S.Z. and R.W.; writing—review and editing, X.L., S.Z. and R.W.; supervision, X.L. and R.W. funding acquisition, X.L and R.W. All authors have read and agreed to the published version of the manuscript.
Funding
This research was funded by the Ministry of Science and Technology of the People’s Republic of China, grant number 2018YFE0206100; the National Natural Science Foundation of China, grant numbers 41871367 and 42201488; the Joint Project of Beijing Municipal Commission of Education and Beijing Natural Science Foundation, grant number KZ202210016022; the Pyramid Talent Training Project of Beijing University of Civil Engineering and Architecture, grant number JDJQ20220804; the Fundamental Research Funds for Beijing Universities, grant number X20150; the Young Teachers Research Capability Enhancement Program of Beijing University of Civil Engineering and Architecture, grant number X22019; and the BUCEA Postgraduate Innovation Project.
Institutional Review Board Statement
Not applicable.
Informed Consent Statement
Not applicable.
Data Availability Statement
Not applicable.
Conflicts of Interest
The authors declare no conflict of interest.
References
- Ntotsios, E.; Papadimitriou, C.; Panetsos, P.; Karaiskos, G.; Perros, K.; Perdikaris, P.C. Bridge Health Monitoring System Based on Vibration Measurements. Bull. Earthq. Eng. 2009, 7, 469–483. [Google Scholar] [CrossRef]
- Marrongelli, G.; Gentile, C.; Saisi, A. Anomaly detection based on automated OMA and mode shape changes: Application on a historic arch bridge. In International Conference on Arch Bridges; Springer: Cham, Switzerland, 2019; pp. 447–455. [Google Scholar]
- Dabous, S.A.; Feroz, S. Condition monitoring of bridges with non-contact testing technologies. Autom. Constr. 2020, 116, 103224. [Google Scholar] [CrossRef]
- He, H.; Zhou, Y.; Cao, J.; Zhang, J. Calibration Method for Dynamic Deflection Measurement of Bridges by Photogrammetry. J. Phys. Conf. 2018, 1061, 012004. [Google Scholar] [CrossRef]
- Ye, X.; Sun, Z.; Cai, X.; Mei, L. An Improved Step-Type Liquid Level Sensing System for Bridge Structural Dynamic Deflection Monitoring. Sensors 2019, 19, 2155. [Google Scholar] [CrossRef] [PubMed]
- Tarchi, D.; Rudolf, H.; Pieraccini, M.; Atzeni, C. Remote monitoring of buildings using a ground-based SAR: Application to cultural heritage survey. Int. J. Remote Sens. 2000, 21, 3545–3551. [Google Scholar] [CrossRef]
- Granello, G.; Andisheh, K.; Palermo, A.; Waldin, J. Microwave radar interferometry as a cost-efficient method of monitoring the structural health of bridges in New Zealand. Struct. Eng. Int. 2018, 28, 518–525. [Google Scholar] [CrossRef]
- Liu, X.; Zhao, S.; Wang, P.; Wang, R.; Huang, M. Improved Data-Driven Stochastic Subspace Identification with Autocorrelation Matrix Modal Order Estimation for Bridge Modal Parameter Extraction Using GB-SAR Data. Buildings 2022, 12, 253. [Google Scholar] [CrossRef]
- Makwana, G.; Gupta, L. De-Noising of Electrocardiogram (ECG) with adaptive filter using MATLAB. In Proceedings of the 2015 Fifth International Conference on Communication Systems and Network Technologies, Gwalior, India, 4–6 April 2015; pp. 511–514. [Google Scholar]
- Zhang, D.; Wang, S.; Li, F.; Wang, J.; Sangaiah, A.K.; Sheng, V.S.; Ding, X. An ECG signal de-noising approach based on wavelet energy and sub-band smoothing filter. Appl. Sci. 2019, 9, 4968. [Google Scholar] [CrossRef]
- Boudraa, A.O.; Cexus, J.C. EMD-based signal filtering. IEEE Trans. Instrum. Meas. 2007, 56, 2196–2202. [Google Scholar] [CrossRef]
- Han, G.; Lin, B.; Xu, Z. Electrocardiogram signal denoising based on empirical mode decomposition technique: An overview. J. Instrum. 2017, 12, P03010. [Google Scholar] [CrossRef]
- Cohen, R. Signal Denoising Using Wavelets; Project Report; Department of Electrical Engineering Technion, Israel Institute of Technology: Haifa, Israel, 2012. [Google Scholar]
- Kumar, A.; Tomar, H.; Mehla, V.K.; Komaragiri, R.; Kumar, M. Stationary wavelet transform based ECG signal denoising method. ISA Trans. 2021, 114, 251–262. [Google Scholar] [CrossRef] [PubMed]
- Wu, Z.; Huang, N.E. Ensemble empirical mode decomposition: A noise-assisted data analysis method. Adv. Adapt. Data Anal. 2009, 1, 1–41. [Google Scholar] [CrossRef]
- Gaci, S. A new ensemble empirical mode decomposition (EEMD) denoising method for seismic signals. Energy Procedia 2016, 97, 84–91. [Google Scholar] [CrossRef]
- Wang, J.; Li, Z. Extreme-point symmetric mode decomposition method for data analysis. Adv. Adapt. Data Anal. 2013, 5, 1350015. [Google Scholar] [CrossRef]
- Wang, J.; Fang, X. ESMD method for frequency distribution of tank surface temperature under wind effect. Int. J. Geosci. 2015, 6, 481. [Google Scholar] [CrossRef]
- Liu, X.; Li, S.; Tong, X. Two-level W-ESMD denoising for dynamic deflection measurement of railway bridges by microwave interferometry. IEEE J. Sel. Top. Appl. Earth Obs. Remote Sens. 2018, 11, 4874–4883. [Google Scholar] [CrossRef]
- Wang, J.; Li, Z. The ESMD method for climate data analysis. Clim. Chang. Res. Lett. 2014, 3, 1–5. [Google Scholar] [CrossRef]
- Daubechies, I.; Lu, J.; Wu, H.T. Synchrosqueezed wavelet transforms: An empirical mode decomposition-like tool. Appl. Comput. Harmon. Anal. 2011, 30, 243–261. [Google Scholar] [CrossRef]
- Yang, H. Statistical analysis of synchrosqueezed transforms. Appl. Comput. Harmon. Anal. 2018, 45, 526–550. [Google Scholar] [CrossRef]
- Herrera, R.H.; Han, J.; van der Baan, M. Applications of the synchrosqueezing transform in seismic time-frequency analysis. Geophysics 2014, 79, V55–V64. [Google Scholar] [CrossRef]
- Herrera, R.H.; Tary, J.B.; Van der Baan, M.; Eaton, D.W. Body wave separation in the time-frequency domain. IEEE Geosci. Remote Sens. Lett. 2014, 12, 364–368. [Google Scholar] [CrossRef]
- Thakur, G.; Brevdo, E.; Fučkar, N.S.; Wu, H.T. The synchrosqueezing algorithm for time-varying spectral analysis: Robustness properties and new paleoclimate applications. Signal Process. 2013, 93, 1079–1094. [Google Scholar] [CrossRef]
- Oberlin, T.; Meignen, S. The second-order wavelet synchrosqueezing transform. In Proceedings of the 2017 IEEE International Conference on Acoustics, Speech and Signal Processing (ICASSP), New Orleans, LA, USA, 5–9 March 2017; pp. 3994–3998. [Google Scholar]
- Auger, F.; Flandrin, P.; Lin, Y.T.; McLaughlin, S.; Meignen, S.; Oberlin, T.; Wu, H.T. Time-frequency reassignment and synchrosqueezing: An overview. IEEE Signal Process. Mag. 2013, 30, 32–41. [Google Scholar] [CrossRef]
- Qin, X.; Cai, J.C.; Liu, S.Y. Microseismic data denoising method based on EMD mutual information entropy and synchrosqueezing transform. Geophys. Prospect. Pet. 2017, 56, 658–666. (In Chinese) [Google Scholar]
- Toprak, A.; Güler, I. Impulse noise reduction in medical images with the use of switch mode fuzzy adaptive median filter. Digit. Signal Process. 2007, 17, 711–723. [Google Scholar] [CrossRef]
- Rödelsperger, S.; Läufer, G.; Gerstenecker, C.; Becker, M. Monitoring of displacements with ground-based microwave interferometry: IBIS-S and IBIS-L. J. Appl. Geod. 2010, 4, 41–54. [Google Scholar] [CrossRef]
- Wang, R.; Zhang, T.; Liu, X.; Lu, Z.; Guo, T. Distance-restrained atmospheric parameters correction (DR-APC) model for GB-SAR transmission power attenuation compensation in bridges dynamic deflection measurement. Measurement 2022, 205, 112192. [Google Scholar] [CrossRef]
- Cai, J.; Xiao, Y.; Li, X. Nuclear magnetic resonance logging signal de-noising based on empirical mode decomposition threshold filtering in frequency domain. Prog. Geophys. 2019, 34, 509–516. [Google Scholar]


Disclaimer/Publisher’s Note: The statements, opinions and data contained in all publications are solely those of the individual author(s) and contributor(s) and not of MDPI and/or the editor(s). MDPI and/or the editor(s) disclaim responsibility for any injury to people or property resulting from any ideas, methods, instructions or products referred to in the content. |
© 2022 by the authors. Licensee MDPI, Basel, Switzerland. This article is an open access article distributed under the terms and conditions of the Creative Commons Attribution (CC BY) license (https://creativecommons.org/licenses/by/4.0/).