
A Hybrid Feature Selection Approach to Screen a Novel Set of Blood Biomarkers for Early COVID-19 Mortality Prediction


Abstract
:1. Introduction
1.1. Rationale for Developing COVID-19 Mortality Risk Prediction Technique
1.2. Review of Literature
2. Materials and Methods
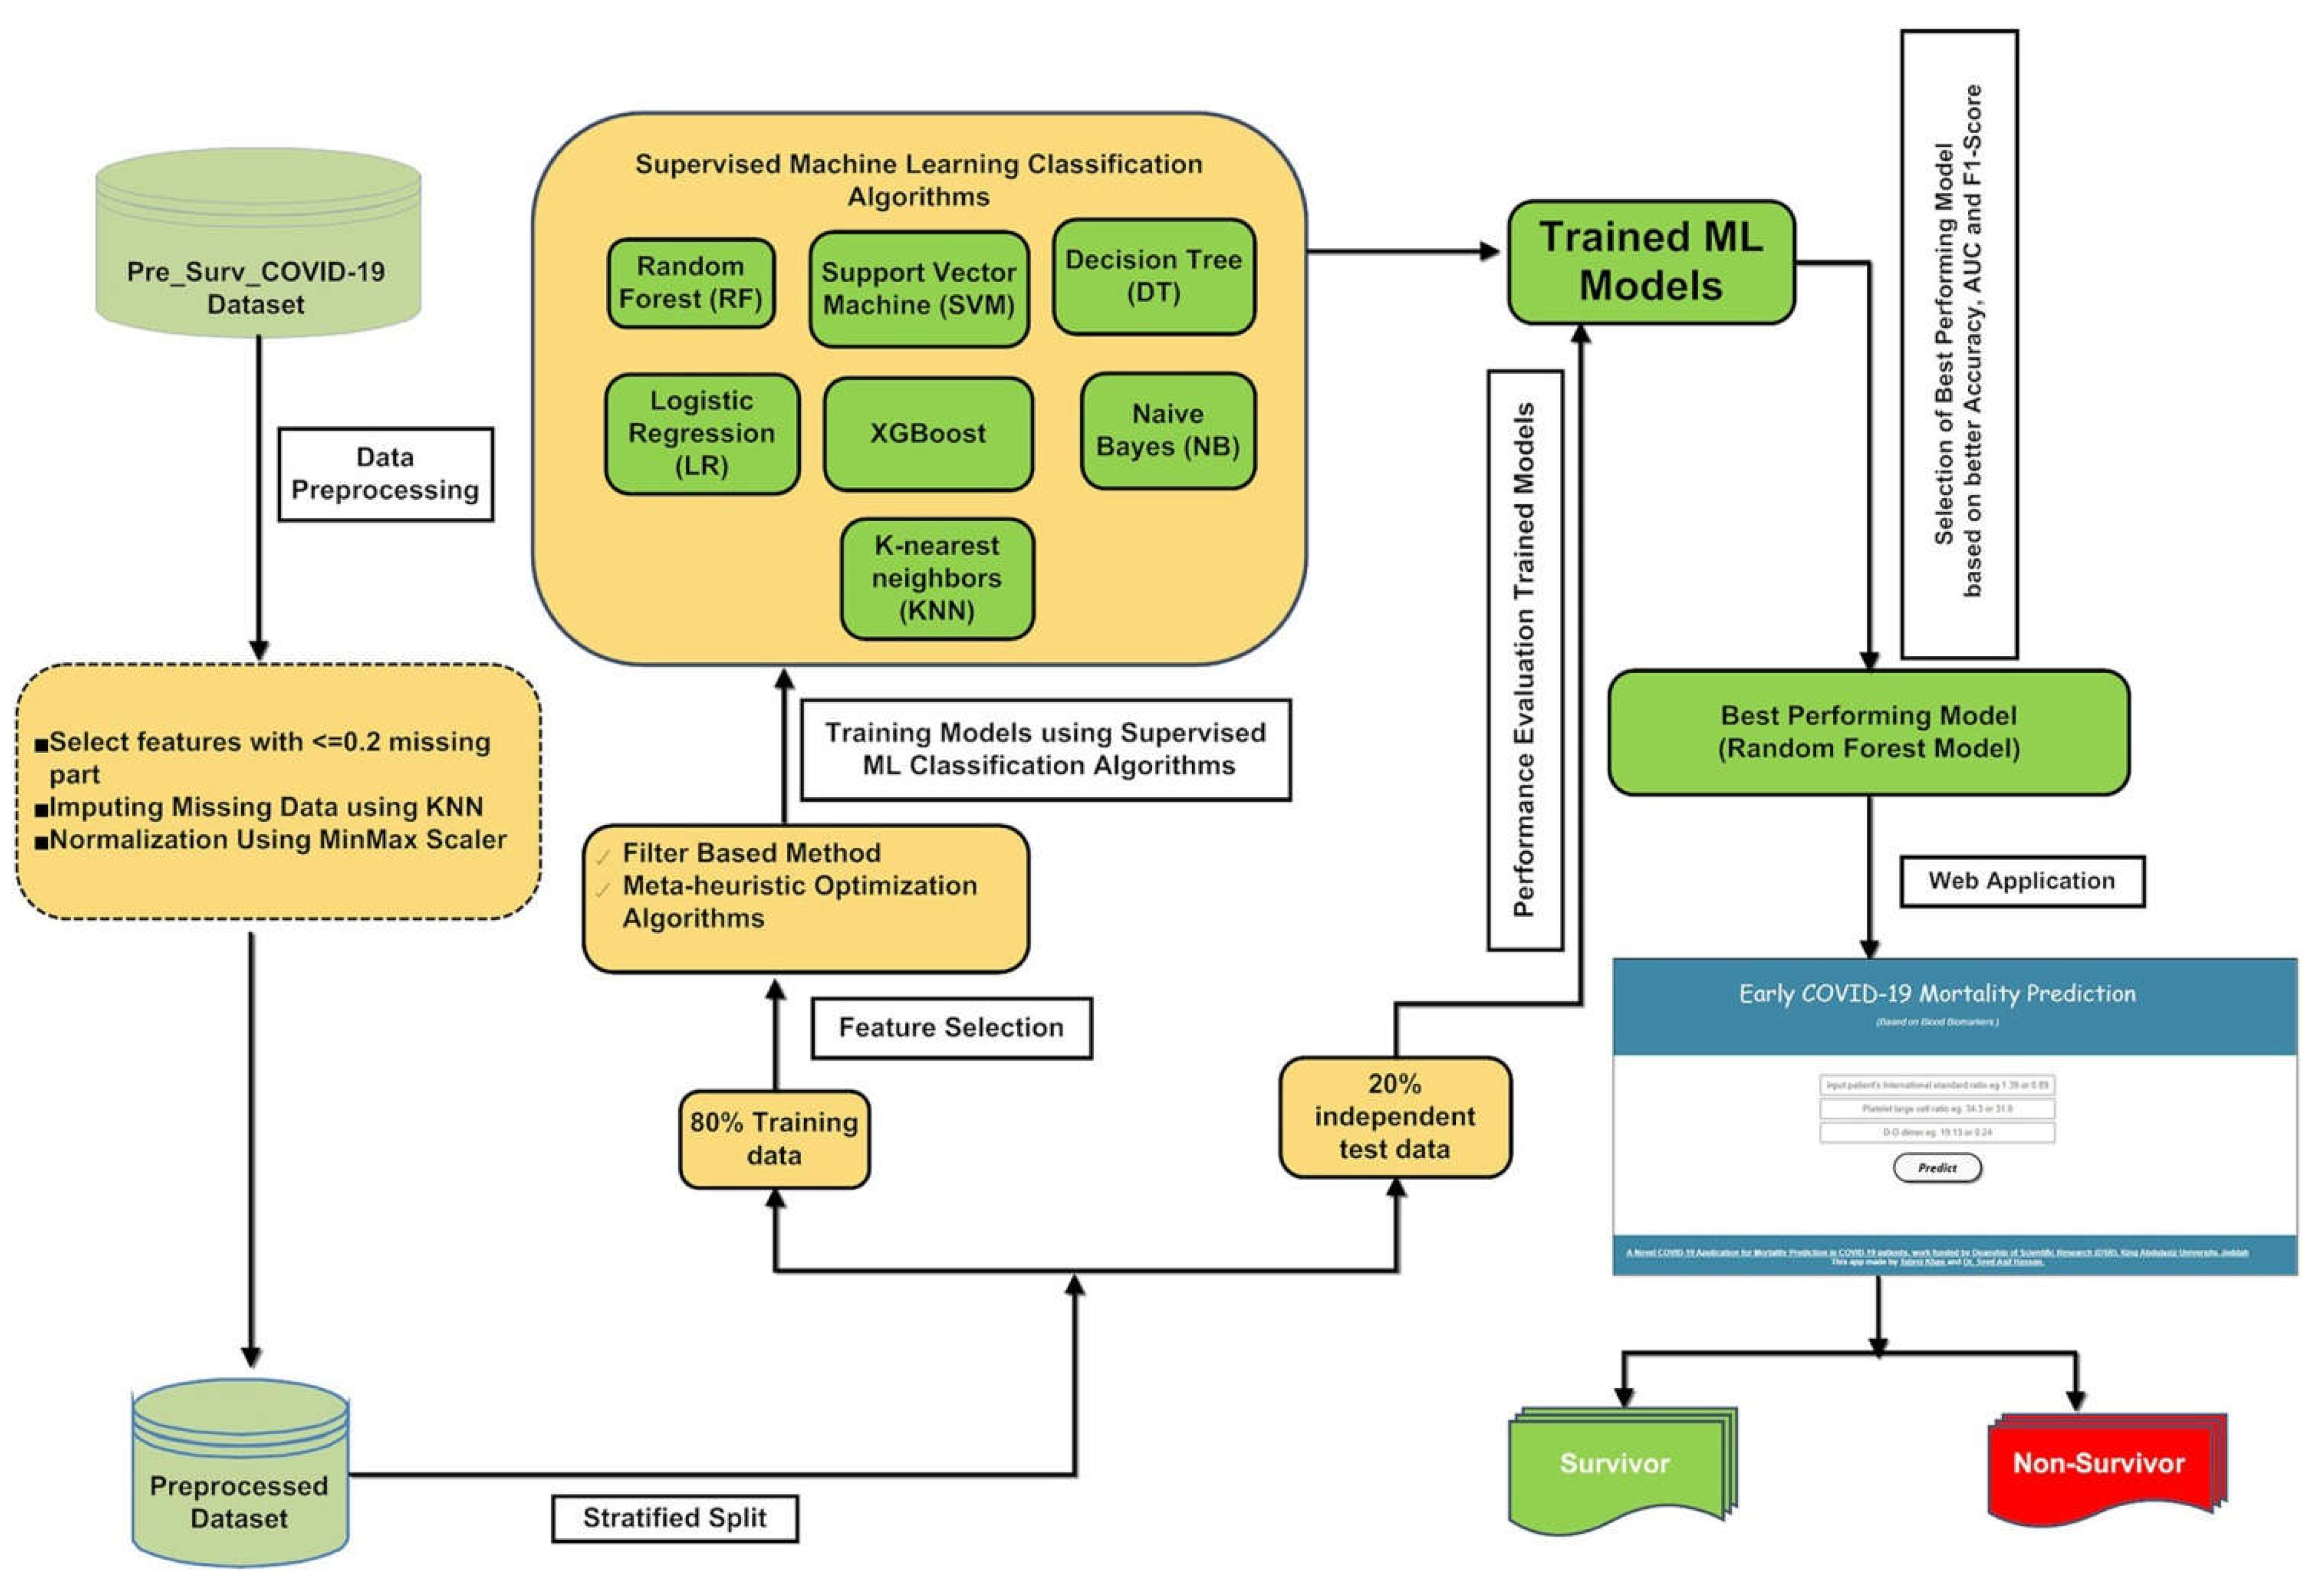
2.1. Machine Learning Pipeline
2.2. Dataset and Preprocessing
2.3. Partitioning of the Processed Data
2.4. Evaluation Metrics
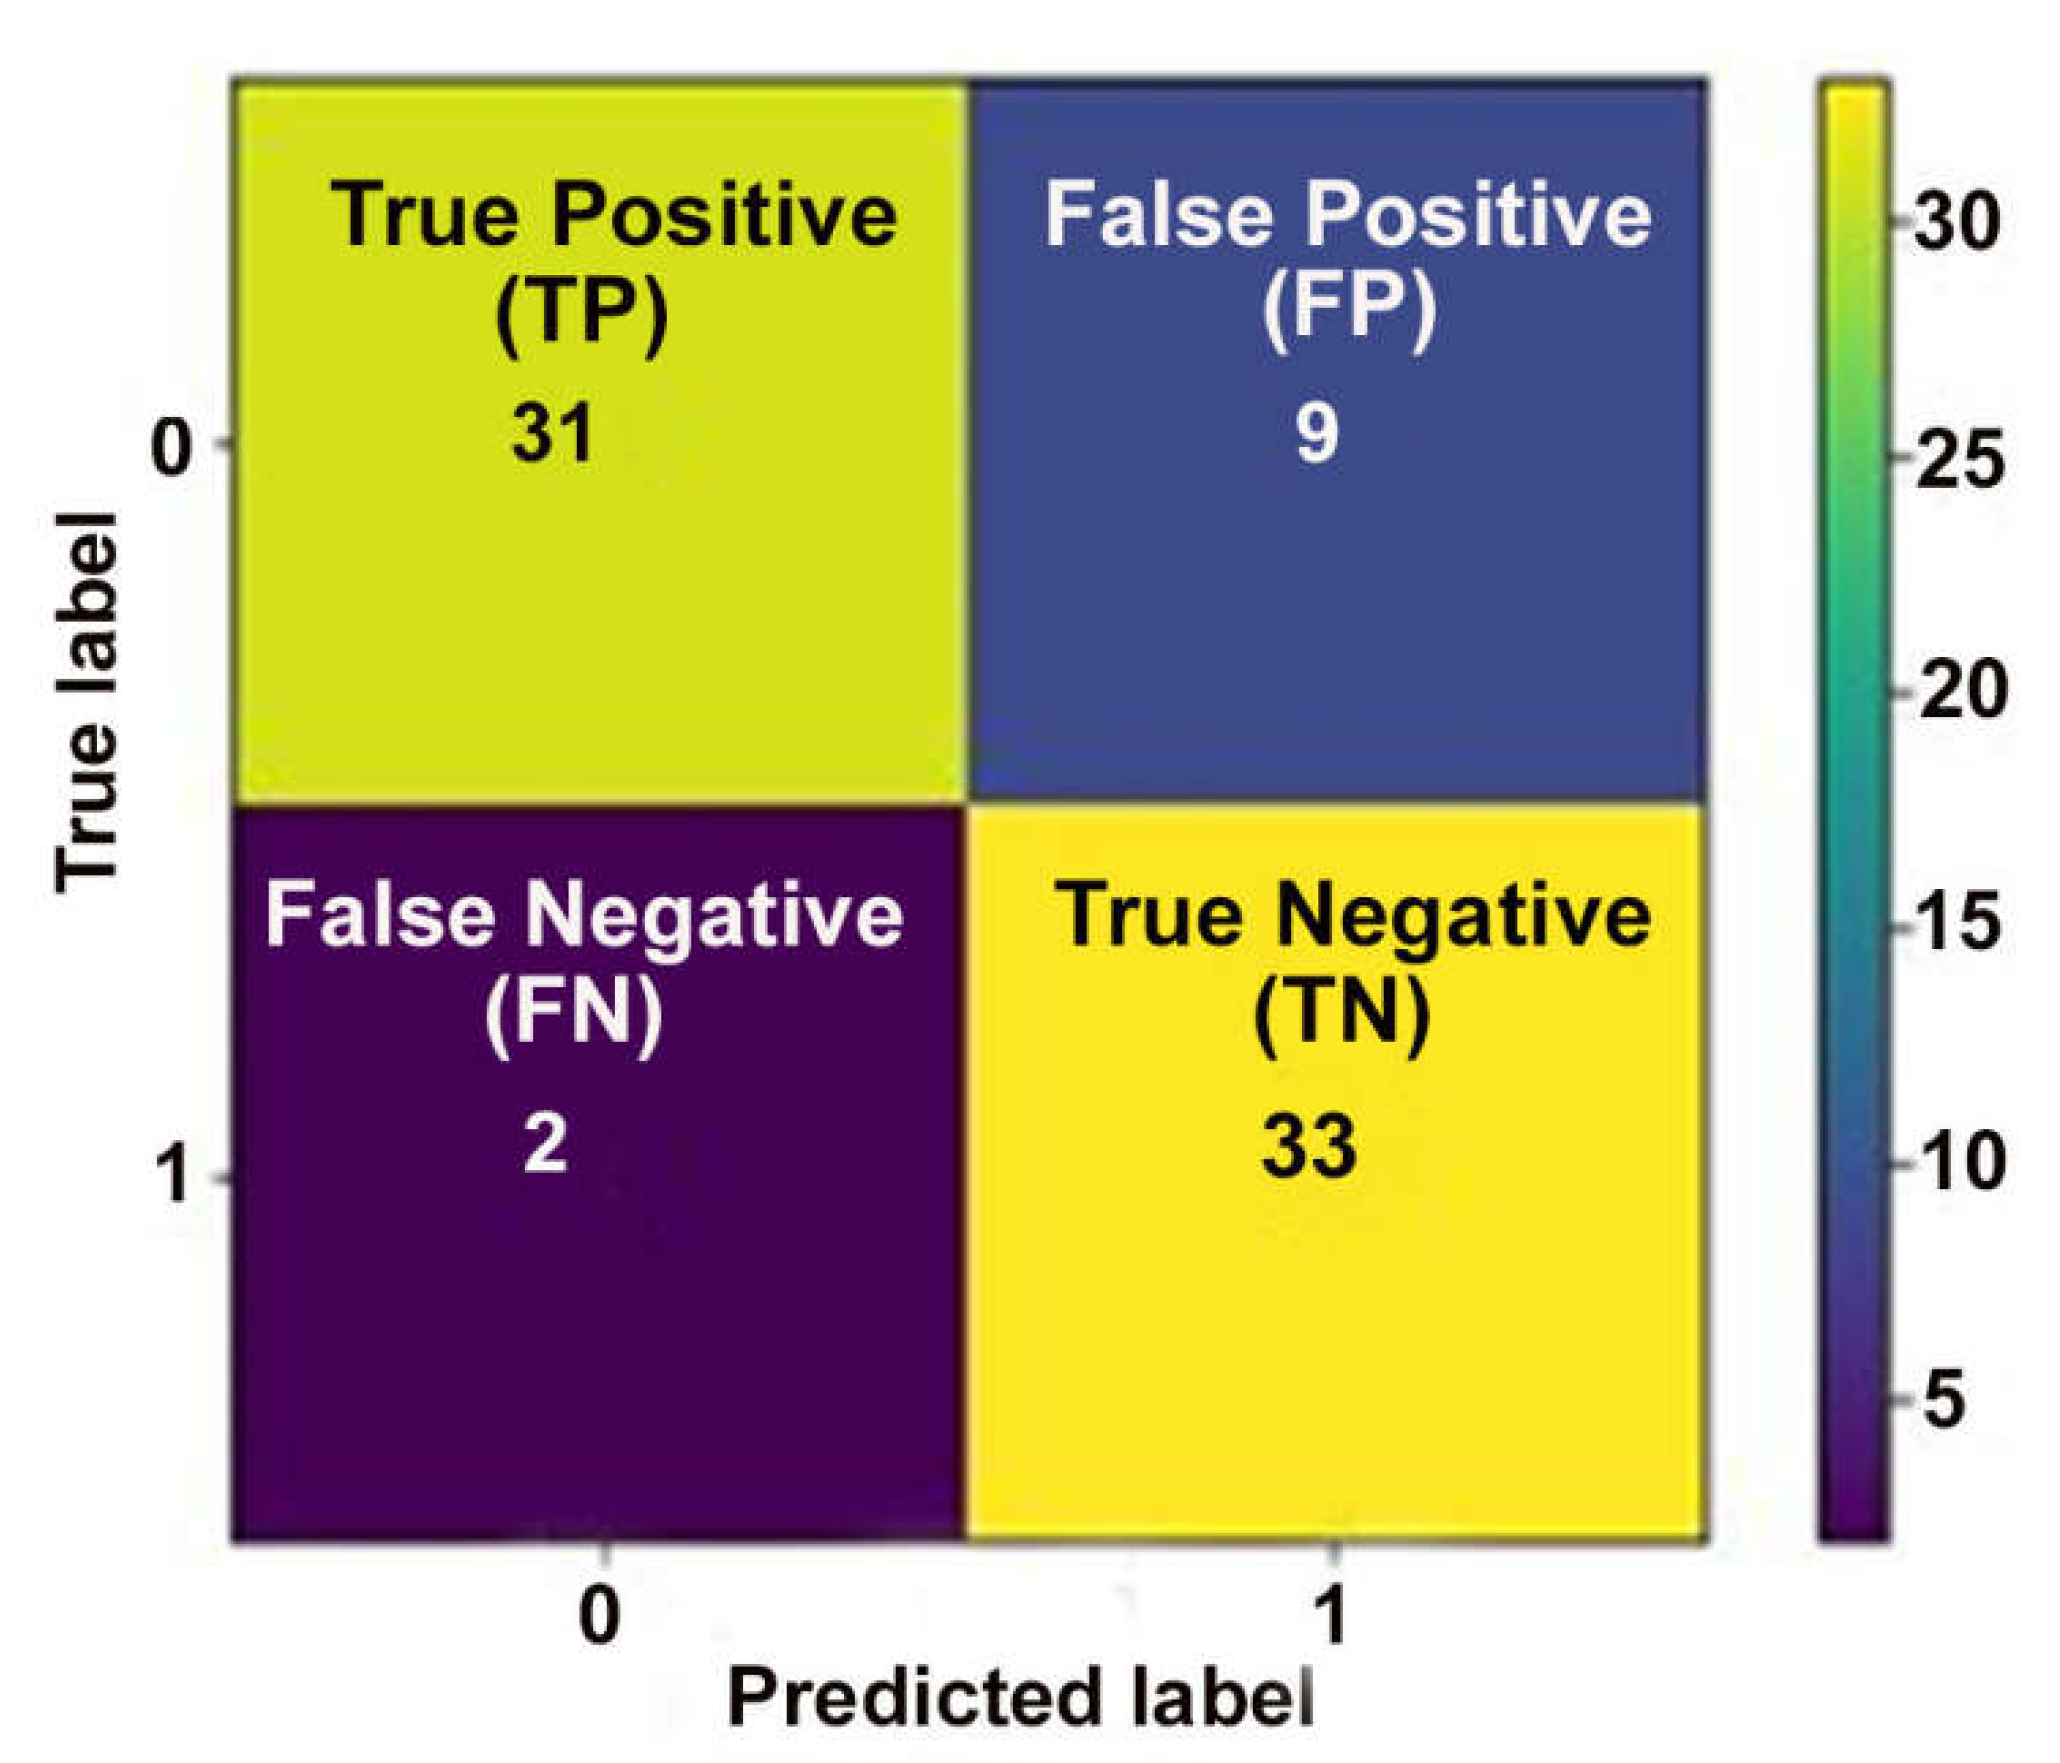
2.4.1. Accuracy and Confusion Matrix
- A positive class (in our study, the non-survivor);
- A negative class (in our research, the survivor);
- A true positive is a predicted outcome where the model correctly predicts the positive class for an actual positive instance (non-survivor) in our COVID-19 dataset;
- A true negative is an outcome where the model correctly predicts the negative class for an actual negative instance (non-survivor) in our COVID-19 dataset;
- A false positive is an outcome where the model incorrectly predicts the positive class;
- A false negative is an outcome where the model incorrectly predicts the negative class.
2.4.2. F1 Score, Precision, and Recall
2.4.3. The Area under the Receiver Operating Characteristic Curve (ROC-AUC)
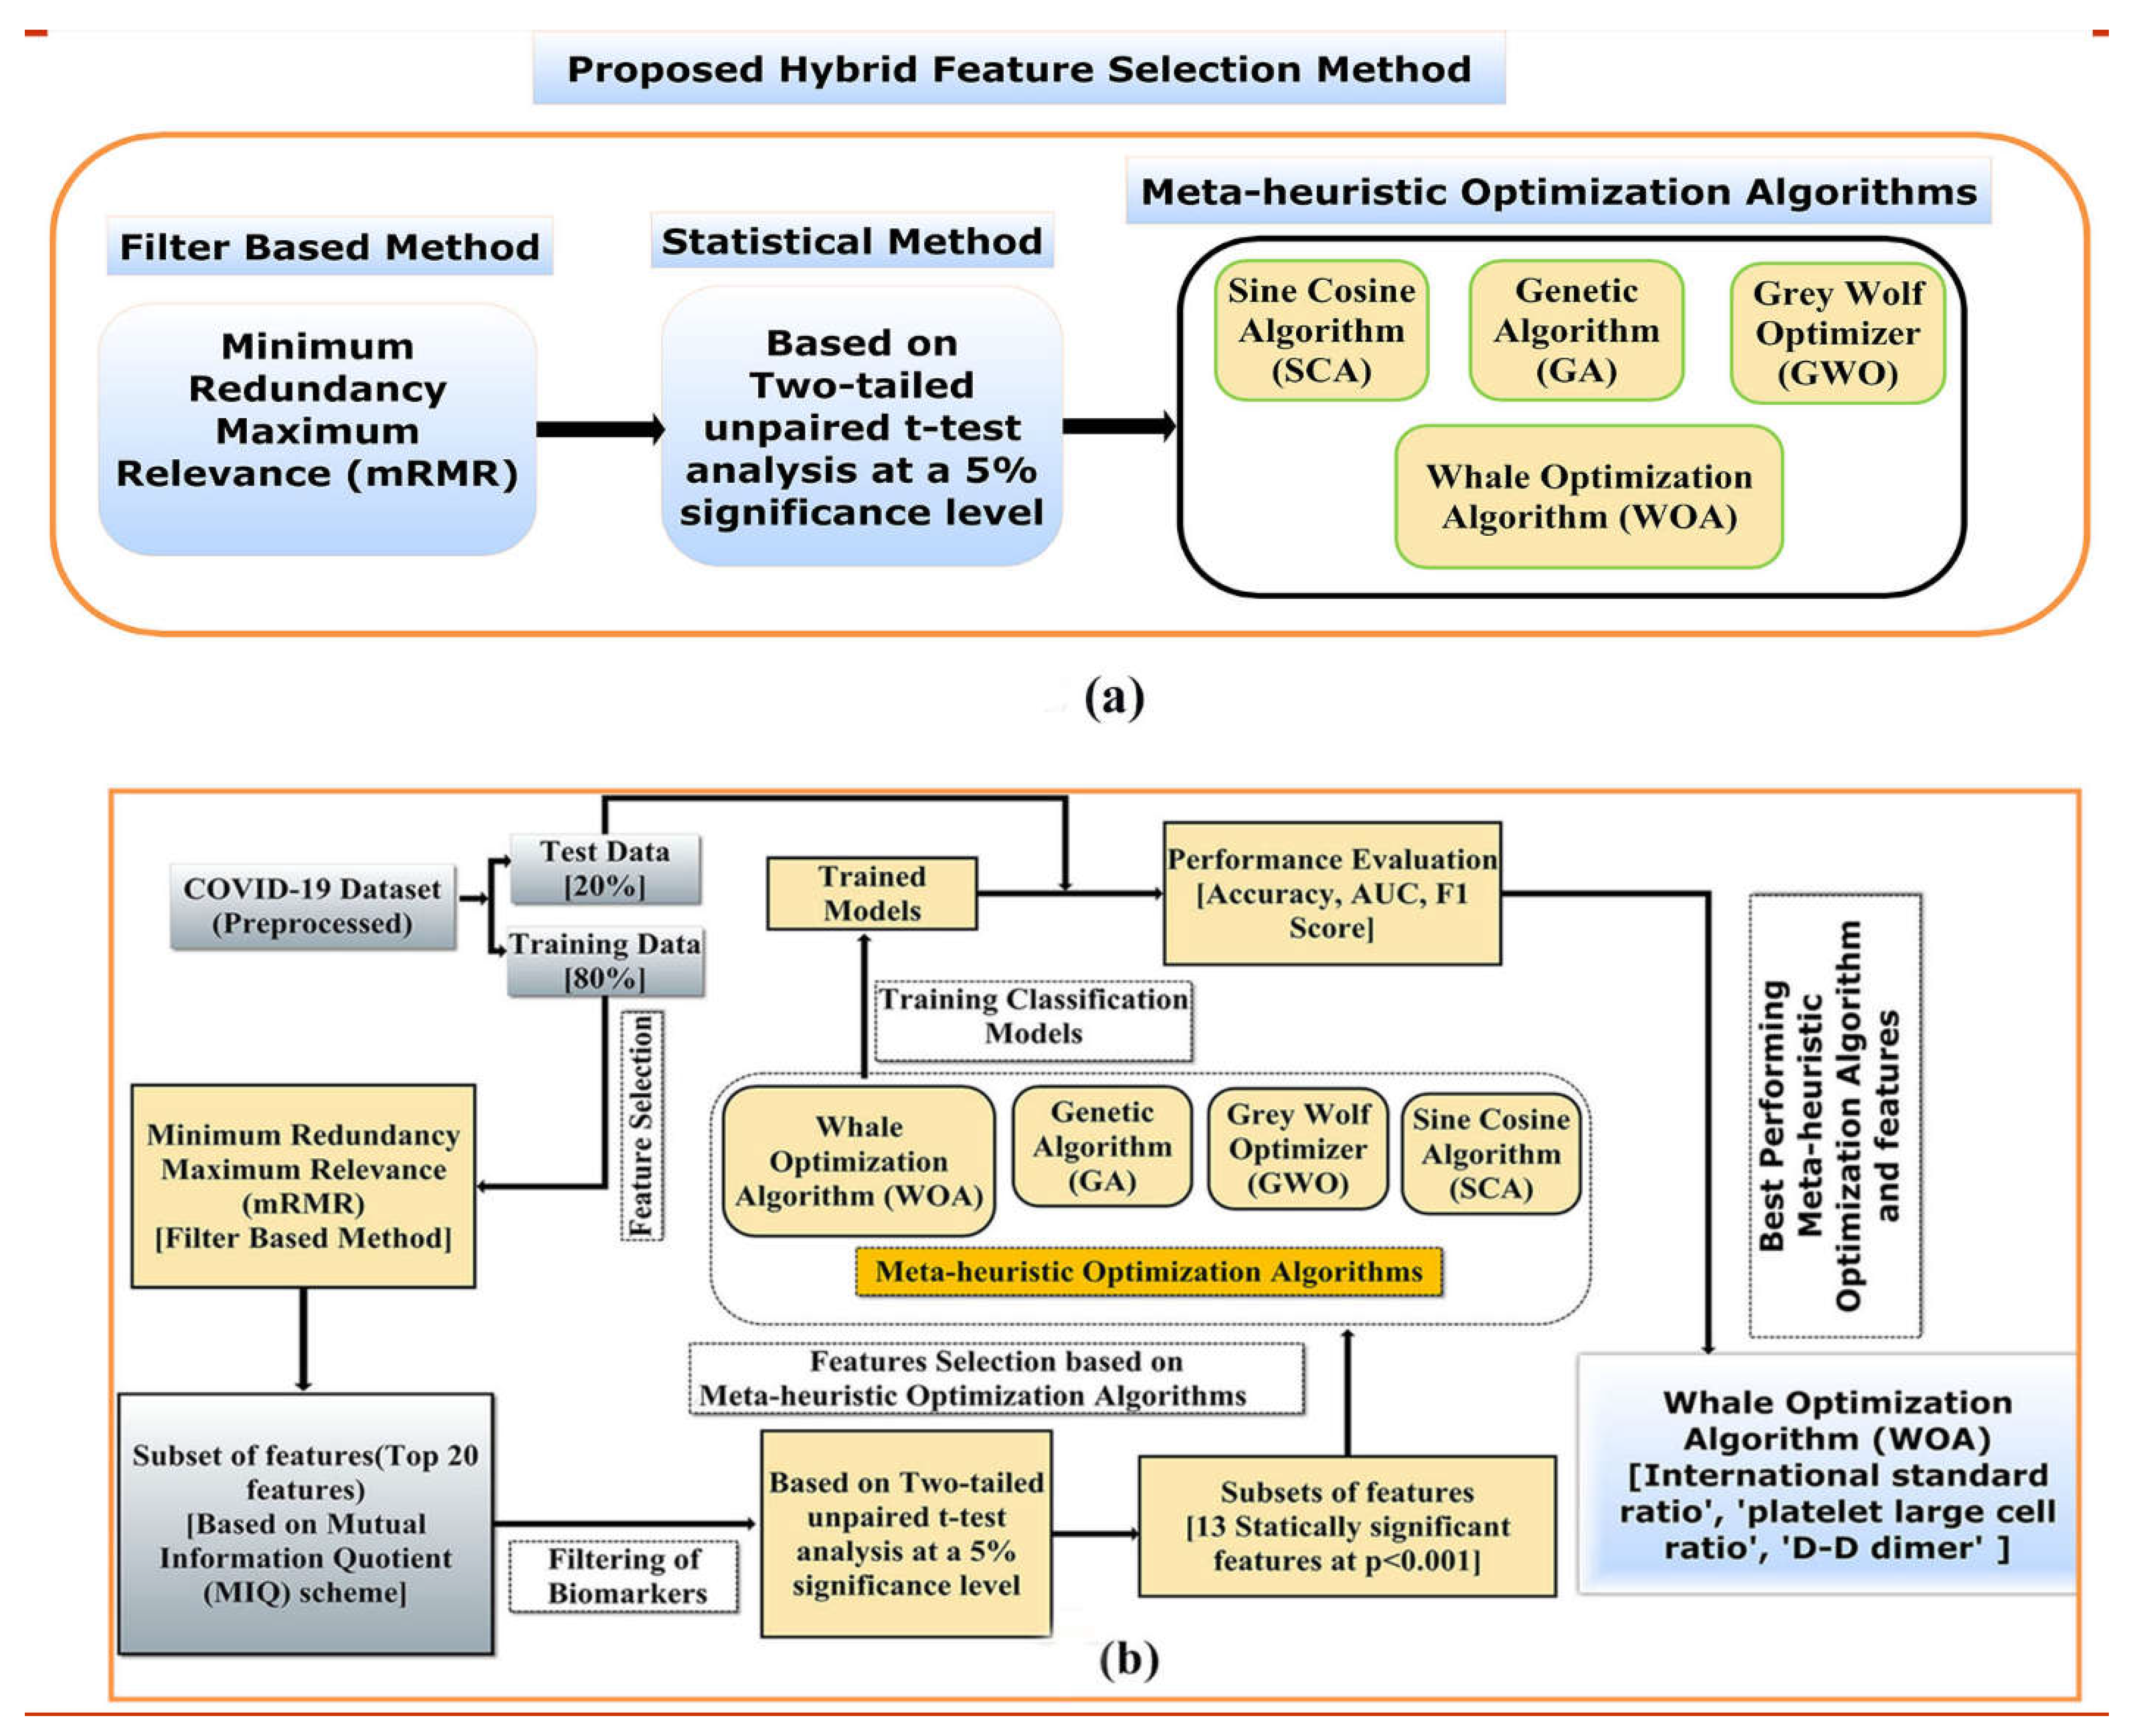
2.5. Proposed Hybrid Feature Selection Approach
2.5.1. The mRMR Feature Importance
2.5.2. Student t-Test
2.5.3. Meta-Heuristic Selection
- Whale Optimization Algorithm
- Search for Optimum Search Solution
- Encircling Prey
- Shrinking encircling mechanism
- 2.
- Spiral updating position
- Grey Wolf Optimizer
- Social Hierarchy
- (1)
- The best solution is designated as an alpha wolf (α);
- (2)
- The second best solution is selected as a beta wolf (β);
- (3)
- The third best candidate solution is defined as the delta wolf (δ);
- (4)
- And the remaining solutions are considered as the omega wolves (ω).
- Searching for Prey (Exploration)
- Encircling the Prey
- Hunting the Prey
- Attacking the Prey
- Sine Cosine Algorithm
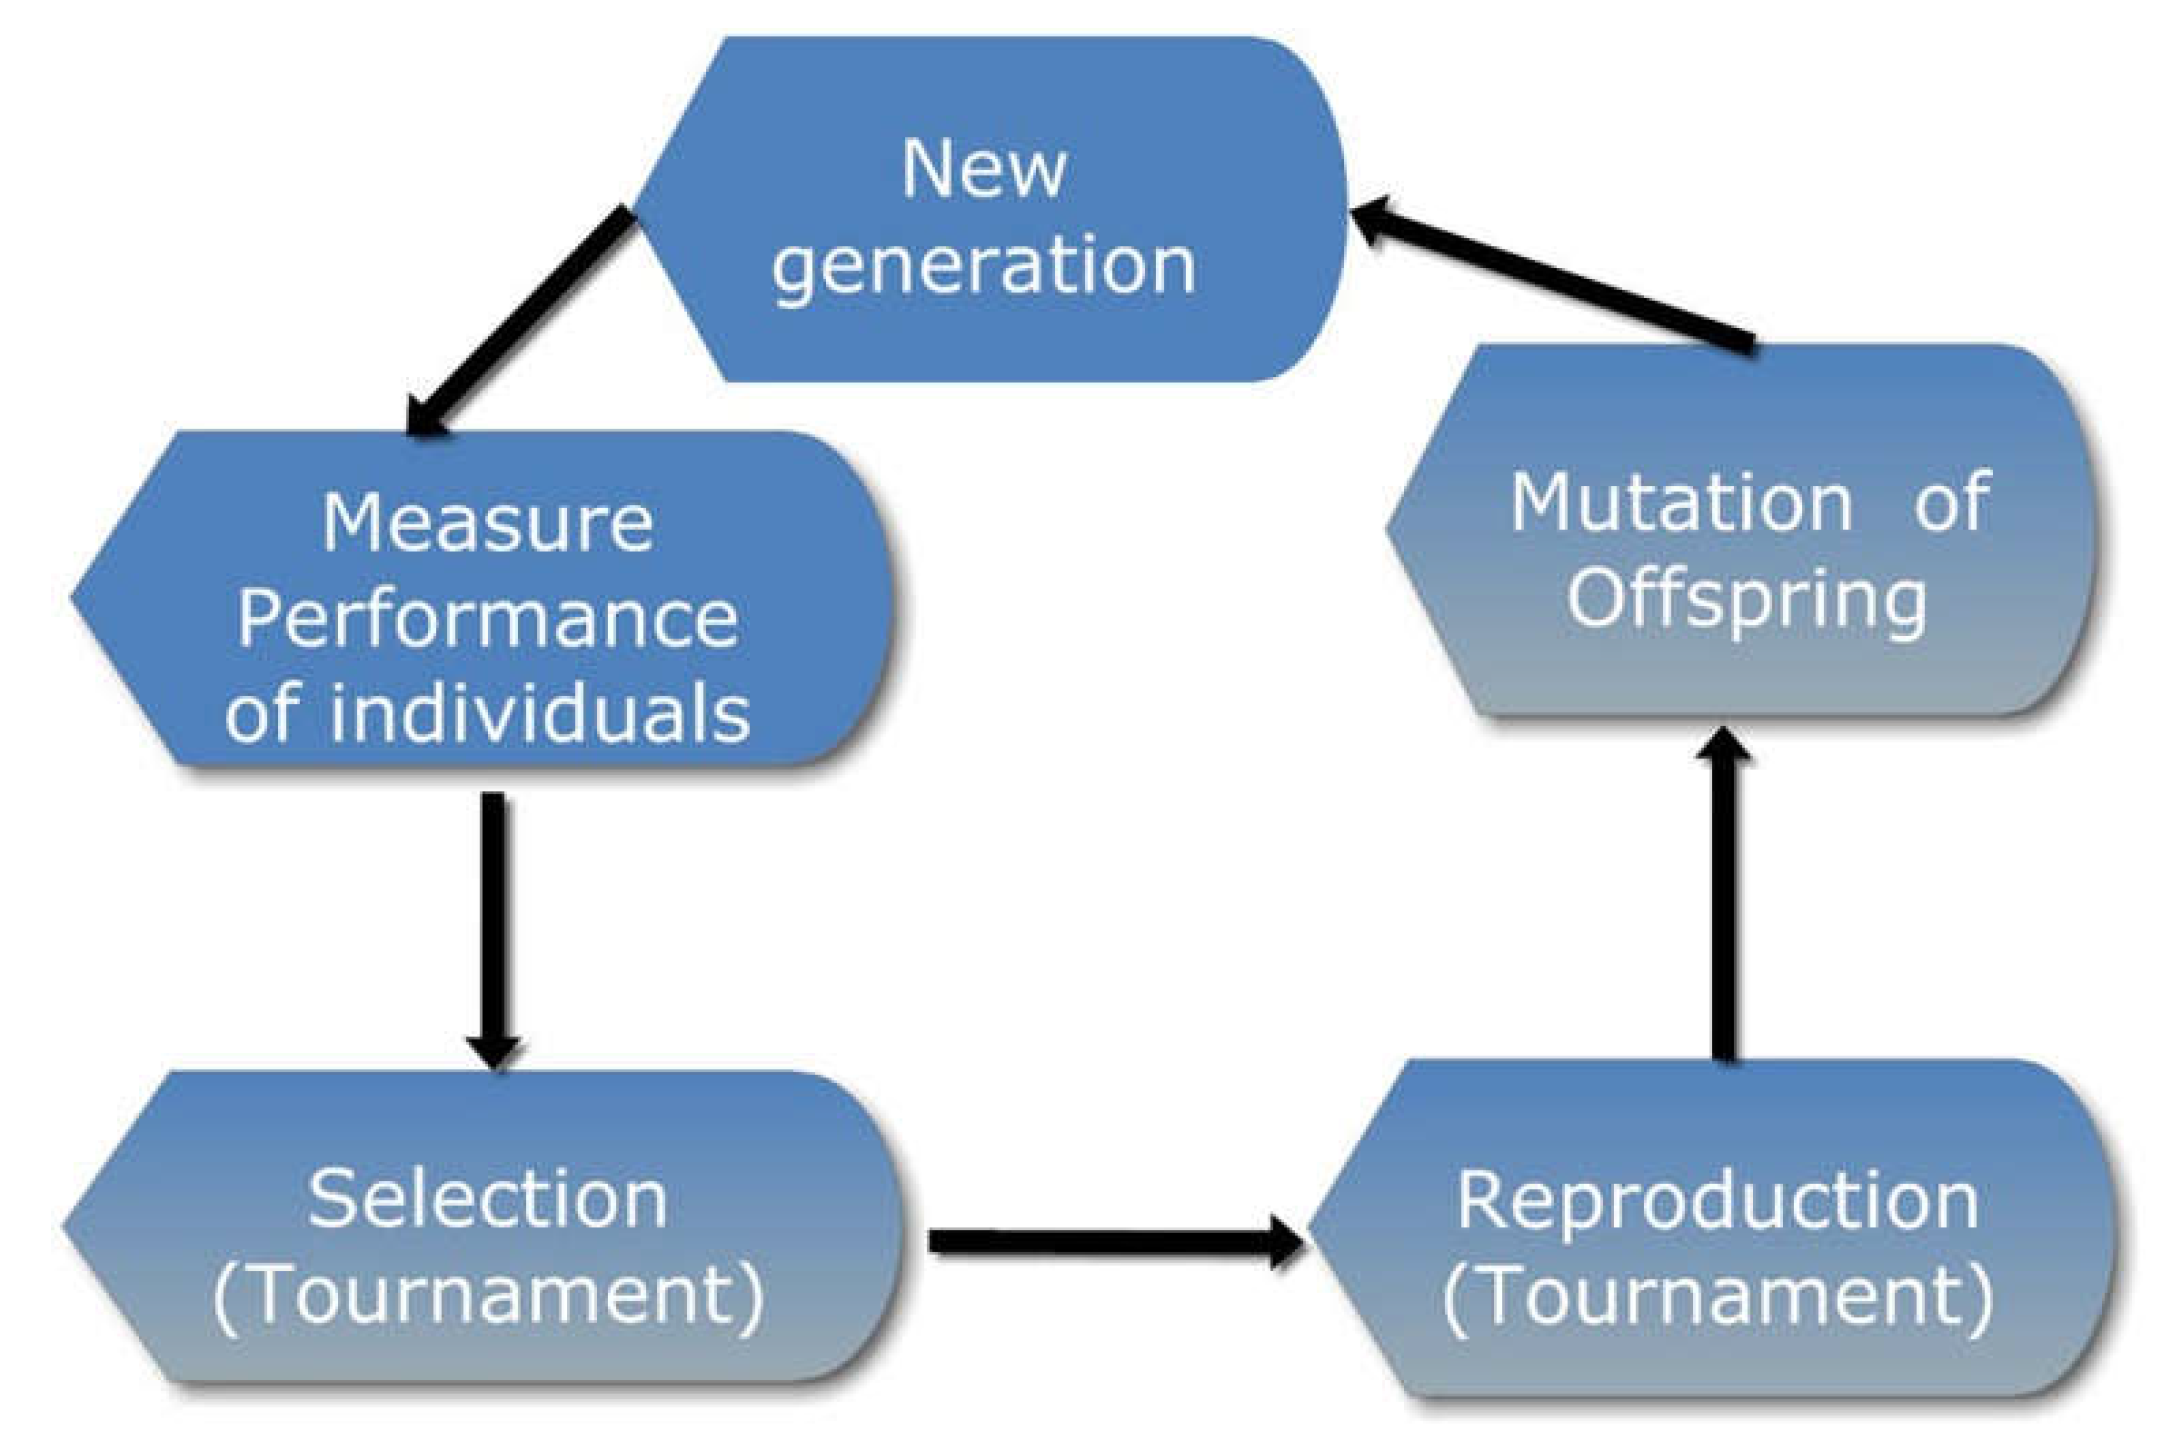
- Genetic Algorithm
2.6. Training
2.7. Classification Algorithms
2.7.1. Logistic Regression
2.7.2. XGBoost
2.7.3. Gaussian Naïve Bayes
2.7.4. Decision Trees
2.7.5. K-Nearest Neighbor
2.7.6. Support Vector Machine
2.7.7. Random Forest
2.8. Testing
2.9. Histogram Frequency Curve Plot
2.10. Student t-Test
2.11. Web Application
3. Results
3.1. Identification of Novel Combination of Blood Biomarkers
3.1.1. The mRMR Feature Importance
3.1.2. Student t-Test-Based Feature Selection
3.1.3. Meta-Heuristic Method-Based Feature Selection
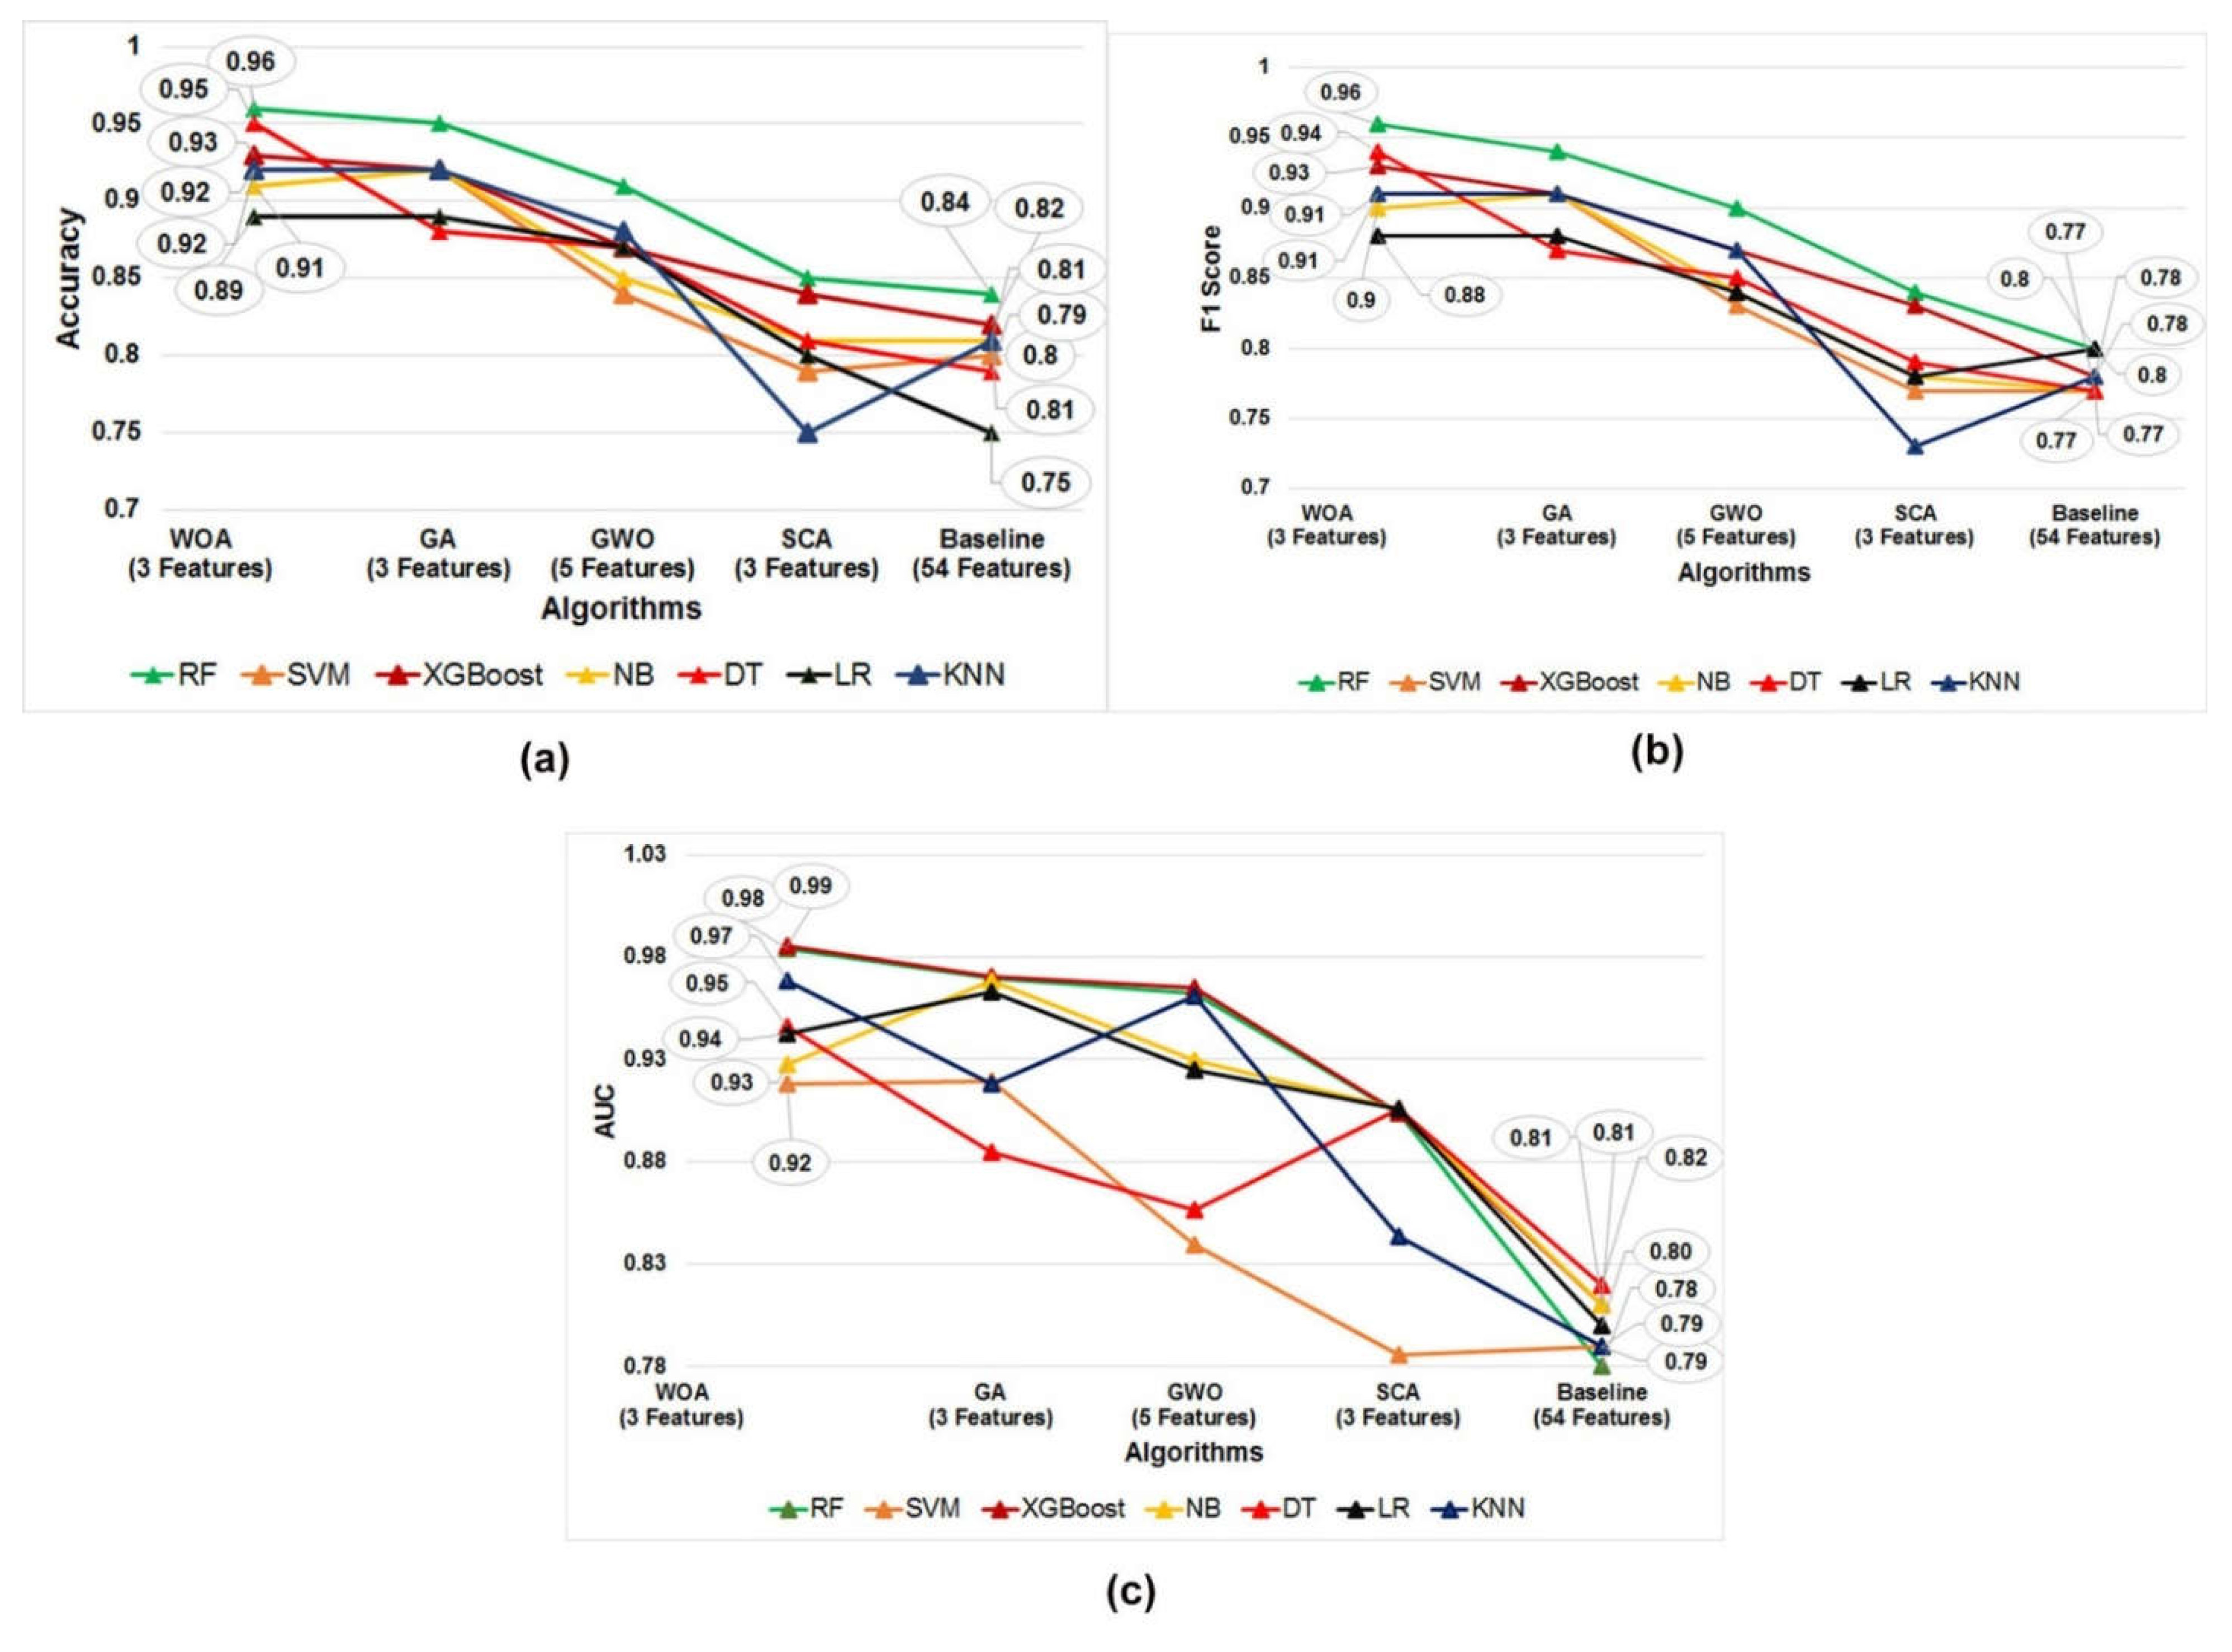
3.2. Comparative Performance of Our Model with Other Relevant Models
3.3. Implementation of the Proposed Model
4. Discussion
Limitations
5. Conclusions and Future Scope
Supplementary Materials
Author Contributions
Funding
Institutional Review Board Statement
Informed Consent Statement
Data Availability Statement
Acknowledgments
Conflicts of Interest
References
- Zu, Z.Y.; Di Jiang, M.; Xu, P.P.; Chen, W.; Ni, Q.Q.; Lu, G.M.; Zhang, L.J. Coronavirus disease 2019 (COVID-19): A perspective from china. Radiology 2020, 2020, 200490. [Google Scholar] [CrossRef] [PubMed] [Green Version]
- Menni, C.; Valdes, A.M.; Freidin, M.B.; Sudre, C.H.; Nguyen, L.H.; Drew, D.A.; Ganesh, S.; Varsavsky, T.; Cardoso, M.J.; El-Sayed Moustafa, J.S.; et al. Real-time tracking of self-reported symptoms to predict potential COVID-19. Nat. Med. 2020, 26, 1037–1040. [Google Scholar] [CrossRef] [PubMed]
- Callejon-Leblic, M.; Moreno-Luna, R.; Del Cuvillo, A.; Reyes-Tejero, I.; Garcia-Villaran, M.; Santos-Peña, M.; Maza-Solano, J.; Martín-Jimenez, D.; Palacios-Garcia, J.; Fernandez-Velez, C.; et al. loss of smell and taste can accurately predict COVID-19 infection: A machine-learning approach. J. Clin. Med. 2021, 10, 570. [Google Scholar] [CrossRef] [PubMed]
- Liu, Y.; Mao, B.; Liang, S.; Yang, J.-W.; Lu, H.-W.; Chai, Y.-H.; Wang, L.; Zhang, L.; Li, Q.-H.; Zhao, L.; et al. Association between age and clinical characteristics and outcomes of COVID-19. Eur. Respir. J. 2020, 55, 2001112. [Google Scholar] [CrossRef] [Green Version]
- Pan, A.; Liu, L.; Wang, C.; Guo, H.; Hao, X.; Wang, Q.; Huang, J.; He, N.; Yu, H.; Lin, X.; et al. Association of public health interventions with the epidemiology of the COVID-19 outbreak in Wuhan, China. JAMA 2020, 323, 1915–1923. [Google Scholar] [CrossRef] [Green Version]
- Bajgain, K.T.; Badal, S.; Bajgain, B.B.; Santana, M.J. Prevalence of comorbidities among individuals with COVID-19: A rapid review of current literature. Am. J. Infect. Control 2020, 49, 238–246. [Google Scholar] [CrossRef]
- Imran, A.; Posokhova, I.; Qureshi, H.N.; Masood, U.; Riaz, M.S.; Ali, K.; John, C.N.; Hussain, I.; Nabeel, M. AI4COVID-19: AI enabled preliminary diagnosis for COVID-19 from cough samples via an app. Inform. Med. Unlocked. 2020, 20, 100378. [Google Scholar] [CrossRef]
- Goel, T.; Murugan, R.; Mirjalili, S.; Chakrabartty, D.K. Multi-COVID-Net: Multi-objective optimized network for COVID-19 diagnosis from chest X-ray images. Appl. Soft Comput. 2022, 115, 108250. [Google Scholar] [CrossRef]
- Rahman, T.; Khandakar, A.; Qiblawey, Y.; Tahir, A.; Kiranyaz, S.; Kashem, S.B.A.; Islam, M.T.; Al Maadeed, S.; Zughaier, S.M.; Khan, M.S.; et al. Exploring the effect of image enhancement techniques on COVID-19 detection using chest X-ray images. Comput. Biol. Med. 2021, 132, 104319. [Google Scholar] [CrossRef]
- Rahman, T.; Chowdhury, M.E.H.; Khandakar, A.; Islam, K.R.; Mahbub, Z.B.; Kadir, M.A.; Kashem, S. Transfer learning with deep convolutional neural network (CNN) for pneumonia detection using chest X-ray. Appl. Sci. 2020, 10, 3233. [Google Scholar] [CrossRef]
- Islam, M.M.; Karray, F.; Alhajj, R.; Zeng, J. A review on deep learning techniques for the diagnosis of novel coronavirus (COVID-19). IEEE Access 2021, 9, 30551–30572. [Google Scholar] [CrossRef]
- Alzubaidi, L.; Zhang, J.; Humaidi, A.J.; Al-Dujaili, A.; Duan, Y.; Al-Shamma, O.; Santamaría, J.; Fadhel, M.A.; Al-Amidie, M.; Farhan, L. Review of deep learning: Concepts, CNN architectures, challenges, applications, future directions. J. Big Data 2021, 8, 53. [Google Scholar] [CrossRef]
- Riaz, M.; Bashir, M.; Younas, I. Metaheuristics based COVID-19 detection using medical images: A review. Comput. Biol. Med. 2022, 144, 105344. [Google Scholar] [CrossRef]
- Guerrero–Sánchez, Y.; Umar, M.; Sabir, Z.; Guirao, J.L.G.; Raja, M.A.Z. Solving a class of biological HIV infection model of latently infected cells using heuristic approach. Discret. Contin. Dyn. Syst.-S 2021, 14, 3611. [Google Scholar] [CrossRef]
- Sabir, Z.; Raja, M.A.Z.; Umar, M.; Shoaib, M. Design of neuro-swarming-based heuristics to solve the third-order nonlinear multi-singular Emden–Fowler equation. Eur. Phys. J. Plus 2020, 135, 410. [Google Scholar] [CrossRef]
- Silverstein, J. Most of the World Doesn’t Have Access to X-rays. The Atlantic. 2018. Available online: https://www.theatlantic.com/health/archive/2016/09/radiology-gap/501803/ (accessed on 1 April 2022).
- Kurjak, A.; Breyer, B. The use of ultrasound in developing countries. Ultras Med. Biol. 1986, 12, 611–621. [Google Scholar] [CrossRef]
- Liang, W.; Liang, H.; Ou, L.; Chen, B.; Chen, A.; Li, C.; Li, Y.; Guan, W.; Sang, L.; Lu, J.; et al. Development and validation of a clinical risk score to predict the occurrence of critical illness in hospitalized patients with COVID-19. JAMA Intern. Med. 2020, 180, 1081–1089. [Google Scholar] [CrossRef]
- Lu, J.; Hu, S.; Fan, R.; Liu, Z.; Yin, X.; Wang, Q.; Lv, Q.; Cai, Z.; Li, H.; Hu, Y.; et al. ACP risk grade: A simple mortality index for patients with confirmed or suspected severe acute respiratory syndrome coronavirus 2 disease (COVID-19) during the early stage of outbreak in Wuhan, China. medRxiv 2020, 20025510. [Google Scholar] [CrossRef]
- Gemmar, P. An interpretable mortality prediction model for COVID-19 patients-alternative approach. medRxiv 2020, 20130732. [Google Scholar] [CrossRef]
- Kang, J.; Chen, T.; Luo, H.; Luo, Y.; Du, G.; Jiming-Yang, M. Machine learning predictive model for severe COVID-19. Infect. Genet. Evol. 2021, 90, 104737. [Google Scholar] [CrossRef]
- Pourhomayoun, M.; Shakibi, M. Predicting mortality risk in patients with COVID-19 using machine learning to help medical decision-making. Smart Health 2021, 20, 100178. [Google Scholar] [CrossRef] [PubMed]
- Schöning, V.; Liakoni, E.; Baumgartner, C.; Exadaktylos, A.K.; Hautz, W.E.; Atkinson, A.; Hammann, F. Development and validation of a prognostic COVID-19 severity assessment (COSA) score and machine learning models for patient triage at a tertiary hospital. J. Transl. Med. 2021, 19, 56. [Google Scholar] [CrossRef] [PubMed]
- Bolourani, S.; Brenner, M.; Wang, P.; McGinn, T.; Hirsch, J.S.; Barnaby, D.; Zanos, T.P.; Northwell COVID-19 Research Consortium. A machine learning prediction model of respiratory failure within 48 h of patient admission for COVID-19: Model development and validation. J. Med. Intern. Res. 2021, 23, e24246. [Google Scholar] [CrossRef] [PubMed]
- Xu, W.; Sun, N.-N.; Gao, H.-N.; Chen, Z.-Y.; Yang, Y.; Ju, B.; Tang, L.-L. Risk factors analysis of COVID-19 patients with ards and prediction based on machine learning. Sci. Rep. 2021, 11, 2933. [Google Scholar] [CrossRef]
- Jimenez-Solem, E.; Petersen, T.S.; Hansen, C.; Hansen, C.; Lioma, C.; Igel, C.; Boomsma, W.; Krause, O.; Lorenzen, S.; Selvan, R.; et al. Developing and validating COVID-19 adverse outcome risk prediction models from a bi-national european cohort of 5594 patients. Sci. Rep. 2021, 11, 3246. [Google Scholar] [CrossRef]
- Ikemura, K.; Bellin, E.; Yagi, Y.; Billett, H.; Saada, M.; Simone, K.; Stahl, L.; Szymanski, J.; Goldstein, D.Y.; Gil, M.R. Using automated-machine learning to predict COVID-19 patient mortality. J. Med. Intern. Res. 2021, 23, e23458. [Google Scholar] [CrossRef]
- Ji, D.; Zhang, D.; Xu, J.; Chen, Z.; Yang, T.; Zhao, P.; Chen, G.; Cheng, G.; Wang, Y.; Bi, J.; et al. prediction for progression risk in patients with COVID-19 pneumonia: The CALL Score. Clin. Infect. Dis. 2020, 71, 1393–1399. [Google Scholar] [CrossRef] [Green Version]
- Meraihi, Y.; Gabis, A.B.; Mirjalili, S.; Ramdane-Cherif, A.; Alsaadi, F.E. Machine Learning-Based Research for COVID-19 Detection, Diagnosis, and Prediction: A Survey. SN Comput. Sci. 2022, 3, 286. [Google Scholar] [CrossRef]
- Liu, Y.-P.; Li, G.-M.; He, J.; Liu, Y.; Li, M.; Zhang, R.; Li, Y.-L.; Wu, Y.-Z.; Diao, B. Combined use of the neutrophil-to-lymphocyte ratio and CRP to predict 7-day disease severity in 84 hospitalized patients with COVID-19 pneumonia: A retrospective cohort study. Ann. Transl. Med. 2020, 8, 635. [Google Scholar] [CrossRef]
- Zhang, C.; Qin, L.; Li, K.; Wang, Q.; Zhao, Y.; Xu, B.; Liang, L.; Dai, Y.; Feng, Y.; Sun, J.; et al. A novel scoring system for prediction of disease severity in COVID-19. Front. Cell. Infect. Microbiol. 2020, 10, 318. [Google Scholar] [CrossRef]
- Shang, Y.; Liu, T.; Wei, Y.; Li, J.; Shao, L.; Liu, M.; Zhang, Y.; Zhao, Z.; Xu, H.; Peng, Z.; et al. Scoring systems for predicting mortality for severe patients with COVID-19. eClinicalMedicine 2020, 24, 100426. [Google Scholar] [CrossRef]
- Banerjee, A.; Ray, S.; Vorselaars, B.; Kitson, J.; Mamalakis, M.; Weeks, S.; Baker, M.; Mackenzie, L.S. Use of Machine Learning and Artificial Intelligence to predict SARS-CoV-2 infection from Full Blood Counts in a population. Int. Immunopharmacol. 2020, 86, 106705. [Google Scholar] [CrossRef]
- Brinati, D.; Campagner, A.; Ferrari, D.; Locatelli, M.; Banfi, G.; Cabitza, F. Detection of COVID-19 infection from routine blood exams with machine learning: A feasibility study. J. Med. Syst. 2020, 44, 135. [Google Scholar] [CrossRef]
- Thell, R.; Zimmermann, J.; Szell, M.; Tomez, S.; Eisenburger, P.; Haugk, M.; Kreil, A.; Spiel, A.; Blaschke, A.; Klicpera, A.; et al. Standard blood laboratory values as a clinical support tool to distinguish between SARS-CoV-2 positive and negative patients. Sci. Rep. 2021, 11, 9365. [Google Scholar] [CrossRef]
- Yang, H.S.; Hou, Y.; Vasovic, L.V.; Steel, P.A.D.; Chadburn, A.; Racine-Brzostek, S.E.; Velu, P.; Cushing, M.M.; Loda, M.; Kaushal, R.; et al. Routine laboratory blood tests predict SARS-CoV-2 infection using machine learning. Clin. Chem. 2020, 66, 1396–1404. [Google Scholar] [CrossRef]
- Rahman, T.; Al-Ishaq, F.A.; Al-Mohannadi, F.S.; Mubarak, R.S.; Al-Hitmi, M.H.; Islam, K.R.; Khandakar, A.; Hssain, A.A.; Al-Madeed, S.; Zughaier, S.M.; et al. Mortality Prediction Utilizing Blood Biomarkers to Predict the Severity of COVID-19 Using Machine Learning Technique. Diagnostics 2021, 11, 1582. [Google Scholar] [CrossRef]
- Chowdhury, M.E.; Rahman, T.; Khandakar, A.; Al-Madeed, S.; Zughaier, S.M.; Doi, S.A.; Hassen, H.; Islam, M.T. An early warning tool for An early warning tool for predicting mortality risk of COVID-19 patients using machine learning. Cogn. Comput. 2021, 13, 1–16. [Google Scholar] [CrossRef]
- Vaid, A.; Somani, S.; Russak, A.J.; De Freitas, J.K.; Chaudhry, F.F.; Paranjpe, I.; Johnson, K.W.; Lee, S.J.; Miotto, R.; Richter, F.; et al. Machine Learning to Predict Mortality and Critical Events in a Cohort of Patients with COVID-19 in New York City: Model Development and Validation. J. Med. Internet Res. 2020, 22, e24018. [Google Scholar] [CrossRef]
- Aladağ, N.; Atabey, R.D. The role of concomitant cardiovascular diseases and cardiac biomarkers for predicting mortality in critical COVID-19 patients. Acta Cardiol. 2020, 76, 132–139. [Google Scholar] [CrossRef]
- de Terwangne, C.; Laouni, J.; Jouffe, L.; Lechien, J.R.; Bouillon, V.; Place, S.; Capulzini, L.; Machayekhi, S.; Ceccarelli, A.; Saussez, S.; et al. Predictive accuracy of COVID-19 world health organization (Who) severity classification and comparison with a bayesian-method-based severity score (epi-score). Pathogens 2020, 9, 880. [Google Scholar] [CrossRef]
- Huang, D.; Wang, T.; Chen, Z.; Yang, H.; Yao, R.; Liang, Z. A novel risk score to predict diagnosis with coronavirus disease 2019 (COVID-19) in suspected patients: A retrospective, multicenter, and observational study. J. Med. Virol. 2020, 92, 2709–2717. [Google Scholar] [CrossRef]
- Cai, Y.-Q.; Zhang, X.-B.; Zeng, H.-Q.; Wei, X.-J.; Zhang, Z.-Y.; Chen, L.-D.; Wang, M.-H.; Yao, W.-Z.; Huang, Q.-F.; Ye, Z.-Q. Prognostic Value of Neutrophil-to-Lymphocyte Ratio, Lactate Dehydrogenase, D-Dimer and CT Score in Patients with COVID-19. Res. Sq. 2020, 1–13. [Google Scholar] [CrossRef]
- Wang, K.; Zuo, P.; Liu, Y.; Zhang, M.; Zhao, X.; Xie, S.; Zhang, H.; Chen, X.; Liu, C. Clinical and laboratory predictors of in-hospital mortality in patients with COVID-19: A cohort study in Wuhan, China. Clin. Infect. Dis. 2020, 71, 2079–2088. [Google Scholar] [CrossRef]
- Xie, J.; Hungerford, D.; Chen, H.; Abrams, S.T.; Li, S.; Wang, G.; Wang, Y.; Kang, H.; Bonnett, L.; Zheng, R.; et al. Development and external validation of a prognostic multivariable model on admission for hospitalized patients with COVID-19. Korean J Radiol. 2020, 21, 1007–1017. [Google Scholar] [CrossRef]
- Karthikeyan, A.; Garg, A.; Vinod, P.K.; Priyakumar, U.D. Machine Learning Based Clinical Decision Support System for Early COVID-19 Mortality Prediction. Front. Public Health 2021, 9, 626697. [Google Scholar] [CrossRef]
- Yan, L.; Zhang, H.-T.; Goncalves, J.; Xiao, Y.; Wang, M.; Guo, Y.; Sun, C.; Tang, X.; Jing, L.; Zhang, M.; et al. An interpretable mortality prediction model for COVID-19 patients. Nat. Mach. Intell. 2020, 2, 283–288. [Google Scholar] [CrossRef]
- Ting, K.M. Confusion Matrix. In Encyclopedia of Machine Learning; Sammut, C., Webb, G.I., Eds.; Springer: Boston, MA, USA, 2011. [Google Scholar] [CrossRef]
- Dinga, R.; Penninx, B.W.; Veltman, D.J.; Schmaal, L.; Marquand, A.F. Beyond accuracy: Measures for assessing machine learning models pitfalls and guidelines. BioRxiv 2019, 743138. [Google Scholar] [CrossRef]
- Ding, C.; Peng, H. Minimum redundancy feature selection from microarray gene expression data. J. Bioinform. Comput. Biol. 2005, 3, 185–205. [Google Scholar] [CrossRef] [PubMed]
- Mishra, P.; Singh, U.; Pandey, C.M.; Mishra, P.; Pandey, G. Application of student’s t-test analysis of variance and covariance. Ann. Cardiac. Anaesth. 2019, 22, 407–411. [Google Scholar] [CrossRef]
- Mirjalili, S.; Lewis, A. The whale optimization algorithm. Adv. Eng. Softw. 2016, 95, 51–67. [Google Scholar] [CrossRef]
- Mirjalili, S.; Mirjalili, S.M.; Lewis, A. Grey wolf optimizer. Adv. Eng. Softw. 2014, 69, 46–61. [Google Scholar] [CrossRef] [Green Version]
- Mirjalili, S. SCA: A sine cosine algorithm for solving optimization problems. Knowl.-Based Syst. 2016, 96, 120–133. [Google Scholar] [CrossRef]
- Goldberg, D.E.; Holland, J.H. Genetic Algorithms and Machine Learning. Mach. Learn. 1988, 3, 95–99. [Google Scholar] [CrossRef]
- David, E. Goldberg. In Genetic Algorithms in Search, Optimization and Machine Learning, 1st ed.; Addison-Wesley Longman Publishing Co., Inc.: Boston, MA, USA, 1989; ISBN 978-0-201-15767-3. [Google Scholar]
- Koza, J.R. Genetic programming as a means for programming computers by natural selection. Stat. Comput. 1994, 4, 87–112. [Google Scholar] [CrossRef]
- Wright, R.E. Logistic regression. In Reading and Understanding Multivariate Statistics; Grimm, L.G., Yarnold, P.R., Eds.; American Psychological Association: Washington, DC, USA, 1995; pp. 217–244. [Google Scholar]
- Hosmer, D.W., Jr.; Lemeshow, S.; Sturdivant, R.X. Applied Logistic Regression; John Wiley & Sons: Hoboken, NJ, USA, 2013; Volume 398. [Google Scholar]
- Chen, T.; Guestrin, C. XGBoost: A scalable tree boosting system. In Proceedings of the KDD 2016—The 22nd ACM SIGKDD International Conference on Knowledge Discovery and Data Mining, San Francisco, CA, USA, 13–17 August 2016; ACM: New York, NY, USA, 2016; pp. 785–794. [Google Scholar] [CrossRef] [Green Version]
- Saba, T. Computer vision for microscopic skin cancer diagnosis using handcrafted and non-handcrafted features. Microsc. Res. Tech. 2021, 84, 1272–1283. [Google Scholar] [CrossRef]
- Khan, M.A.; Sharif, M.; Akram, T.; Raza, M.; Saba, T.; Rehman, A. Hand-crafted and deep convolutional neural network features fusion and selection strategy: An application to intelligent human action recognition. Appl. Soft Comput. 2020, 87, 105986. [Google Scholar] [CrossRef]
- Altman, N.S. An introduction to kernel and nearest-neighbor nonparametric regression. Am. Stat. 1992, 46, 175–185. [Google Scholar] [CrossRef] [Green Version]
- Cortes, C.; Vapnik, V. Support-Vector Networks. Mach. Learn. 1995, 20, 273–297. [Google Scholar] [CrossRef]
- Breiman, L. Random Forests. Mach. Learn. 2001, 45, 5–32. [Google Scholar] [CrossRef] [Green Version]
- Yu, H.-H.; Qin, C.; Chen, M.; Wang, W.; Tian, D.-S. The D-dimer level is associated with the severity of COVID-19. Thromb. Res. 2020, 195, 219–225. [Google Scholar] [CrossRef]
- Long, H.; Nie, L.; Xiang, X.; Li, H.; Zhang, X.; Fu, X.; Ren, H.; Liu, W.; Wang, Q.; Wu, Q. D-Dimer and Prothrombin Time Are the Significant Indicators of Severe COVID-19 and Poor Prognosis. BioMed Res. Int. 2020, 2020, 6159720. [Google Scholar] [CrossRef]
- Tang, N.; Li, D.; Wang, X.; Sun, Z. Abnormal coagulation parameters are associated with poor prognosis in patients with novel coronavirus pneumonia. J. Thromb. Haemost. 2020, 18, 844–847. [Google Scholar] [CrossRef] [Green Version]
- Zhou, F.; Yu, T.; Du, R.; Fan, G.; Liu, Y.; Liu, Z.; Xiang, J.; Wang, Y.; Song, B.; Gu, X.; et al. Clinical course and risk factors for mortality of adult inpatients with COVID-19 in Wuhan, China: A retrospective cohort study. Lancet 2020, 395, 1054–1062. [Google Scholar] [CrossRef]
- Yao, Y.; Cao, J.; Wang, Q.; Shi, Q.; Liu, K.; Luo, Z.; Chen, X.; Chen, S.; Yu, K.; Huang, Z.; et al. D-dimer as a biomarker for disease severity and mortality in COVID-19 patients: A case-control study. J. Intensiv. Care 2020, 8, 49. [Google Scholar] [CrossRef]
- Poudel, A.; Poudel, Y.; Adhikari, A.; Aryal, B.B.; Dangol, D.; Bajracharya, T.; Maharjan, A.; Gautam, R. D-dimer as a biomarker for assessment of COVID-19 prognosis: D-dimer levels on admission and its role in predicting disease outcome in hospitalized patients with COVID-19. PLoS ONE 2021, 16, e0256744. [Google Scholar] [CrossRef]
- Varikasuvu, S.R.; Varshney, S.; Dutt, N.; Munikumar, M.; Asfahan, S.; Kulkarni, P.P.; Gupta, P. D-dimer, disease severity, and deaths (3D-study) in patients with COVID-19: A systematic review and meta-analysis of 100 studies. Sci. Rep. 2021, 11, 21888. [Google Scholar] [CrossRef]
- Hottz, E.D.; Bozza, F.A.; Bozza, P. Platelets in immune response to virus and immunopathology of viral infections. Front. Med. 2018, 5, 121. [Google Scholar] [CrossRef]
- Pogorzelska, K.; Krętowska, A.; Krawczuk-Rybak, M.; Sawicka-Żukowska, M. Characteristics of platelet indices and their prognostic significance in selected medical condition–a systematic review. Adv. Med. Sci. 2020, 65, 310–315. [Google Scholar] [CrossRef]
- Demirin, H.; Ozhan, H.; Ucgun, T.; Celer, A.; Bulur, S.; Cil, H.; Gunes, C.; Yildirim, H.A. Normal range of mean platelet volume in healthy subjects: Insight from a large epidemiologic study. Thromb. Res. 2011, 128, 358–360. [Google Scholar] [CrossRef]
- Thorup, C.V.; Christensen, S.; Hvas, A.-M. Immature platelets as a predictor of disease severity and mortality in sepsis and septic shock: A systematic review. In Seminars in Thrombosis and Hemostasis; Thieme Medical Publishers: New York, NY, USA, 2020; Volume 41, pp. 320–327. [Google Scholar] [CrossRef]
- Gu, S.X.; Tyagi, T.; Jain, K.; Gu, V.W.; Lee, S.H.; Hwa, J.M.; Kwan, J.M.; Krause, D.S.; Lee, A.I.; Halene, S.; et al. Thrombocytopathy and endotheliopathy: Crucial contributors to COVID-19 thromboinflammation. Nat. Rev. Cardiol. 2021, 18, 194–209. [Google Scholar] [CrossRef]
- Cohen, A.; Harari, E.; Cipok, M.; Laish-Farkash, A.; Bryk, G.; Yahud, E.; Sela, Y.; Lador, N.K.; Mann, T.; Mayo, A.; et al. Immature platelets in patients hospitalized with Covid-19. J. Thromb. Thrombolysis 2021, 51, 608–616. [Google Scholar] [CrossRef]
- Mezgebe, M.; Jacobson, B.F.; Mayne, E.S.; Louw, S. Change in platelet indices in patients with Coronavirus disease-2019 (COVID-19): A reflection of platelet activation and contribution to immunothrombosis? Int. J. Lab. Hem. 2022, 44, e46–e48. [Google Scholar] [CrossRef]
- He, J.; Wei, Y.; Chen, J.; Chen, F.; Gao, W.; Lu, X. Dynamic trajectory of platelet-related indicators and survival of severe COVID-19 patients. Crit. Care 2020, 24, 607. [Google Scholar] [CrossRef]
- Daniels, S.A.; Wei, H.; Denning, D.W. Platelet size as a predictor for severity and mortality in COVID-19 patients: A systematic review and meta-analysis. medRxiv 2021, 21260576. [Google Scholar] [CrossRef]
- Alnor, A.; Sandberg, M.B.; Toftanes, B.E.; Vinholt, P.J. Platelet parameters and leukocyte morphology is altered in COVID-19 patients compared to non-COVID-19 patients with similar symptomatology. Scand. J. Clin. Lab. Investig. 2021, 81, 213–217. [Google Scholar] [CrossRef]
- Iba, T.; Warkentin, T.E.; Thachil, J.; Levi, M.; Levy, J.H. Proposal of the Definition for COVID-19-Associated Coagulopathy. J. Clin. Med. 2021, 10, 191. [Google Scholar] [CrossRef]
- Zinellu, A.; Paliogiannis, P.; Carru, C.; Mangoni, A.A. INR and COVID-19 severity and mortality: A systematic review with meta-analysis and meta-regression. Adv. Med. Sci. 2021, 66, 372–380. [Google Scholar] [CrossRef]
- Jin, X.; Duan, Y.; Bao, T.; Gu, J.; Chen, Y.; Li, Y.; Mao, S.; Chen, Y.; Xie, W. The values of coagulation function in COVID-19 patients. PLoS ONE 2020, 15, e0241329. [Google Scholar] [CrossRef]
- Araya, S.; Mamo, M.A.; Tsegay, Y.G.; Atlaw, A.; Aytenew, A.; Hordofa, A.; Negeso, A.E.; Wordofa, M.; Niguse, T.; Cheru, M.; et al. Blood coagulation parameter abnormalities in hospitalized patients with confirmed COVID-19 in Ethiopia. PLoS ONE 2021, 16, e0252939. [Google Scholar] [CrossRef]
- Hirsh, J.; Poller, L. The international normalized ratio. A guide to understanding and correcting its problems. Arch. Intern. Med. 1994, 154, 282–288. [Google Scholar] [CrossRef]
- Shikdar, S.; Vashisht, R.; Bhattacharya, P.T. International Normalized Ratio (INR) [Updated 10 May 2021]. In StatPearls; StatPearls Publishing: Treasure Island, FL, USA, 2022. Available online: https://www.ncbi.nlm.nih.gov/books/NBK507707/ (accessed on 30 April 2022).


| Studies on Blood Biomarker-Based COVID-19 Mortality Risk Prediction | Blood Biomarker | Machine Learning Algorithms | Accuracy | Area Under the Curve (AUC) | F1 score |
|---|---|---|---|---|---|
| Banerjee et al. 2020 [33] | Full Blood counts | RF and Artificial Neural Network (ANN) based models | 90–91% | 94–95% | NA |
| Brinati et al. 2020 [34] | White Blood Cell (WBC) count, and the platelets, High Sensitivity C-Reactive Protein (hs-CRP), Aspartate Aminotransferase (AST), Alanine Transaminase (ALT), Gamma-Glutamyl Transferase (GGT), Alkaline Phosphatase (ALP), and Lactate Dehydrogenase (LDH) plasma levels | RF and Three-way Random Forest (TWRF) based models | 82–86% | 84–86% | NA |
| Thell et al. 2021 [35] | Eosinophils, ferritin, leukocytes, and erythrocytes | Univariate and multivariate binomial logistic regression-based models | 72.3–79.4% | 0.915 | NA |
| Yang et al. 2020 [36] | Patient demographic features (age, sex, race) with 27 routine laboratory tests | Gradient boosting decision tree (GBDT) | NA | 0.854 | NA |
| Rahman et al. 2021 [37] | Age, Lymphocyte count, D-dimer, CRP, and Creatinine | LR and developed a nomogram with LR algorithm | 0.91 ± 0.03 | 0.992 for the external validation cohort dataset | 0.92 ± 0.03 |
| Chowdhury et al. 2021 [38] | LDH, neutrophils (%), lymphocyte (%), hs-CRP, and age | Multi-tree XGBoost model and developed a nomogram using Multi-tree XGBoost | 100% | 0.991 for the validation cohort dataset | NA |
| Vaid et al. 2020 [39] | Mortality at 7 Days biomarker: Age, Anion Gap, hs-CRP, LDH, Oxygen Saturation (SpO2), Blood Urea Nitrogen (BUN), Ferritin, Red Cell Distribution Width (RDW), Diastolic Blood Pressure | XGBoost classifier-based model | NA | In external validation, the XGBoost classifier obtained an AUC-ROC of 0.88 at 3 days, 0.86 at 5 days, 0.86 at 7 days, and 0.84 at 10 days for mortality prediction | NA |
| Aladağ et al. 2020 [40] | Intubated patients, a Lower Glomerular filtration rate (GFR) value, and N-terminal pro-brain natriuretic peptide (NT-proBNP) values | Multiple Logistic Regression (MLR) | NA | NA | NA |
| Terwangne et al. 2020 [41] | Age, acute kidney injury, lymphocytes, activated prothrombin time (aPTT), and (LDH) Levels | Bayesian network analysis for severity classification of COVID-19 | NA | 83.8% AUC obtained from Bayesian network trained and evaluated using the entire set of patients | NA |
| Huang et al. 2020 [42] | Epidemiological exposure histories, weakness/fatigue, heart rate <100 beat/min, bilateral pneumonia, neutrophil count ≤ 6.3 × 10⁹/L, eosinophil count ≤ 0.02 × 10⁹/L, glucose ≥ 6 mmol/L, D-dimer ≥ 0.5 mg/L, and CRP <5 mg/L | Multivariate logistic regression model based novel risk score | NA | 0.921 | NA |
| Cia et al. 2020 [43] | LDH, Neutrophil to Lymphocyte Ratio (NLR), D-dimer, and CRP score on admission and severity of COVID-19 infection | LR model | NA | The AUC values for NLR were 0.716, 0.650 for D-dimer, 0.612 for CT score, and 0.740 for LDH, which indicate a specific diagnostic value for the severity of COVID-19 infection | NA |
| Wang et al. 2020 [44] | The clinical model was developed using a history of hypertension, age, and coronary heart disease, and the laboratory model was developed using peripheral capillary oxygen saturation, neutrophil, hs-CRP, D-dimer, lymphocyte count, GFR, AST, and age | Stepwise Akaike information criterion and ensemble XGBoost (extreme gradient boosting) model | NA | Clinical model AUC values were 0.88 and 0.98 for the laboratory model | NA |
| Xie et al. 2020 [45] | LDH, age, SpO2, and Lymphocyte Count | Multivariable logistic regression model and developed a nomogram using Multivariable logistic regression | NA | Independent validation cohort with an AUC of 0.98 | NA |
| Bolourani et al. 2021 [24] | Body mass index (BMI), age, and hypertension, to build a mortality prediction model from COVID-19 data from the United Kingdom and Denmark | XGBoost model | 0.919 | 0.77 | NA |
| Jimenez-Solem et al. 2021 [26] | BMI, age, and hypertension | RF-based model | NA | The model showed a higher discriminative power with an AUC of 0.818 at hospital admission, 0.906 at diagnosis, and 0.721 during ICU admission | NA |
| Karthikeyan et al. 2021 [46] | Neutrophils, lymphocytes, LDH, hs-CRP, and age | XGBoost feature importance and neural network classification | 96.526 ± 0.637 | 0.9895 ± 0.0057 | 0.9687 ± 0.006 |
| Yan et al. 2020 [47] | LDH, hs-CRP, and lymphocyte count | Interpretable single tree XGBoost model | NA | Predict the mortality of COVID-19 individuals with 94% accuracy as early as 3 days before the patient outcome | NA |
| Sl.no. | Clinical Attributes |
|---|---|
| 1 | Serum chloride |
| 2 | Monocytes (%) |
| 3 | Serum sodium |
| 4 | Serum potassium |
| 5 | Calcium |
| 6 | Corrected calcium |
| 7 | Indirect bilirubin |
| 8 | Prothrombin Time (PT) |
| 9 | Total Protein (TP) |
| 10 | Neutrophils (%) |
| 11 | Basophil count (BC) |
| 12 | High sensitivity C-reactive protein (hs-CRP) |
| 13 | Hemoglobin |
| 14 | International Standard Ratio (INR) |
| 15 | Platelet Large Cell Ratio (P-LCR) |
| 16 | Mean Platelet Volume (MPV) |
| 17 | Procalcitonin (PCT) |
| 18 | D-Dimer |
| 19 | Platelet Distribution Width (PDW) |
| 20 | Serum Glutamic-Pyruvic Transaminase (SGPT) |
| Sl.no. | Name of Blood Biomarkers | Mean and Standard Deviation of Blood Biomarkers between Two Classes of Population (Survivor and Non-Survivor) | Two-Tailed p-Value of the Mean Difference for the Blood Biomarkers between Two Classes of Population (Survivor and Non-Survivor) | |
|---|---|---|---|---|
| Non-Survivor | Survivor | |||
| 1 | Serum chloride | 0.448291385 ± 0.155 | 0.3763732 ± 0.119 | p < 0.0001 |
| 2 | Monocytes (%) | 0.017486858 ± 0.007 | 0.011148923 ± 0.051 | p < 0.0001 |
| 3 | serum sodium | 0.3911567 ± 0.166 | 0.325273619 ± 0.122 | p < 0.0001 |
| 4 | Serum potassium | 0.255000148 ± 0.140 | 0.234565716 ± 0.070 | 0.0709 |
| 5 | Calcium | 0.556278701 ± 0.119 | 0.64440659 ± 0.125 | p < 0.0001 |
| 6 | Corrected calcium | 0.587374724 ± 0.131 | 0.625911132 ± 0.104 | 0.0018 |
| 7 | Indirect Bilirubin | 0.129711839 ± 0.125 | 0.111754649 ± 0.096 | 0.1199 |
| 8 | Prothrombin Time (PT) | 0.089973693 ± 0.102 | 0.055744667 ± 0.010 | p < 0.0001 |
| 9 | Total protein (TP) | 0.58374466 ± 0.162 | 0.648346818 ± 0.147 | p < 0.0001 |
| 10 | Neutrophils (%) | 0.902449663 ± 0.097 | 0.757378019 ± 0.177 | p < 0.0001 |
| 11 | Basophil count (#) | 0.186996944 ± 0.183 | 0.179833248 ± 0.163 | 0.6907 |
| 12 | High sensitivity C-Reactive Protein (hs-CRP) | 0.398503 ± 0.238 | 0.036965 ± 0.078 | p < 0.0001 |
| 13 | Hemoglobin | 0.668481 ± 0.143 | 0.686667 ± 0.118 | 0.1821 |
| 14 | International Standard Ratio (INR) | 0.069874 ± 0.095 | 0.018222 ± 0.007 | p < 0.0001 |
| 15 | Platelet Large Cell Ratio (P-LCR) | 0.513142 ± 0.179 | 0.414974 ± 0.178 | p < 0.0001 |
| 16 | Mean Platelet Volume (MPV) | 0.482952 ± 0.184 | 0.383799 ± 0.178 | p < 0.0001 |
| 17 | Procalcitonin (PCT) | 0.037908 ± 0.102 | 0.018682 ± 0.073 | 0.0366 |
| 18 | D-Dimer | 0.571878041 ± 0.408 | 0.280508629 ± 0.085 | p < 0.0001 |
| 19 | Platelet Distribution Width (PDW) | 0.393129813 ± 0.204 | 0.222059325 ± 0.112 | p < 0.0001 |
| 20 | Serum Glutamic-Pyruvic Transaminase (SGPT) | 0.034611327 ± 0.091 | 0.016735918 ± 0.014 | 0.0070 |
| Meta-Heuristic Methods | Global Optimal Feature Subset |
|---|---|
| WOA | ‘INR’, ‘P-LCR’, ‘D-Dimer’ |
| GA | hsCRP’, ‘SGPT’, ‘INR’ |
| GWO | ‘Monocytes (%)’, ’TP’, ‘INR’, ‘D-Dimer’, ‘PDW’ |
| SCA | ‘TP’, ‘INR’, ‘PDW’ |
| Accuracy | |||||||
| RF | SVM | XGBoost | NB | DT | LR | KNN | |
| WOA | 0.96 ± 0.062 | 0.92 ± 0.024 | 0.93 ± 0.047 | 0.91 ± 0.025 | 0.95 ± 0.037 | 0.89 ± 0.053 | 0.92 ± 0.024 |
| GA | 0.95 ± 0.024 | 0.92 ± 0.034 | 0.92 ± 0.019 | 0.92 ± 0.027 | 0.88 ± 0.034 | 0.89 ± 0.029 | 0.92 ± 0.034 |
| GWO | 0.91 ± 0.044 | 0.84 ± 0.039 | 0.87 ± 0.032 | 0.85 ± 0.032 | 0.87 ± 0.027 | 0.87 ± 0.036 | 0.88 ± 0.039 |
| SCA | 0.85 ± 0.040 | 0.79 ± 0.045 | 0.84 ± 0.034 | 0.81 ± 0.049 | 0.81 ± 0.037 | 0.8 ± 0.049 | 0.75 ± 0.045 |
| Base line | 0.84 ± 0.044 | 0.80 ± 0.032 | 0.81 ± 0.019 | 0.82 ± 0.027 | 0.82 ± 0.036 | 0.75 ± 0.025 | 0.81 ± 0.024 |
| F1 score | |||||||
| RF | SVM | XGBoost | NB | DT | LR | KNN | |
| WOA | 0.96 ± 0.099 | 0.91 ± 0.034 | 0.93 ± 0.060 | 0.9 ± 0.036 | 0.94 ± 0.048 | 0.88 ± 0.053 | 0.91 ± 0.034 |
| GA | 0.94 ± 0.024 | 0.91 ± 0.035 | 0.91 ± 0.017 | 0.91 ± 0.035 | 0.87 ± 0.037 | 0.88 ± 0.031 | 0.91 ± 0.035 |
| GWO | 0.9 ± 0.064 | 0.83 ± 0.052 | 0.87 ± 0.038 | 0.84 ± 0.043 | 0.85 ± 0.034 | 0.84 ± 0.053 | 0.87 ± 0.052 |
| SCA | 0.84 ± 0.058 | 0.77 ± 0.062 | 0.83 ± 0.040 | 0.78 ± 0.064 | 0.79 ± 0.047 | 0.78 ± 0.075 | 0.73 ± 0.062 |
| Base line | 0.80 ± 0.034 | 0.77 ± 0.017 | 0.78 ± 0.036 | 0.77 ± 0.053 | 0.77 ± 0.035 | 0.80 ± 0.064 | 0.78 ± 0.058 |
| AUC Value | |||||||
| RF | SVM | XGBoost | NB | DT | LR | KNN | |
| WOA | 0.98 ± 0.024 | 0.92 ± 0.004 | 0.99 ± 0.015 | 0.93 ± 0.009 | 0.95 ± 0.011 | 0.94 ± 0.020 | 0.97 ± 0.004 |
| GA | 0.97 ± 0.026 | 0.92 ± 0.027 | 0.97 ± 0.015 | 0.97 ± 0.015 | 0.88 ± 0.024 | 0.96 ± 0.030 | 0.92 ± 0.027 |
| GWO | 0.96 ± 0.020 | 0.84 ± 0.025 | 0.97 ± 0.024 | 0.93 ± 0.020 | 0.86 ± 0.050 | 0.93 ± 0.014 | 0.96 ± 0.025 |
| SCA | 0.90 ± 0.052 | 0.79 ± 0.050 | 0.90 ± 0.025 | 0.91 ± 0.025 | 0.91 ± 0.025 | 0.91 ± 0.054 | 0.84 ± 0.050 |
| Base line | 0.78 ± 0.004 | 0.79 ± 0.015 | 0.81 ± 0.027 | 0.81 ± 0.011 | 0.82 ± 0.027 | 0.80 ± 0.026 | 0.79 ± 0.025 |
| Sl.no. | Author | Machine Learning Model | Blood Biomarker (Features) | Accuracy (%) | F1 score | AUC Value |
|---|---|---|---|---|---|---|
| 1 | Yan et al. 2020 [42] | Single tree XGBoost model | LDH, hs-CRP, and lymphocytes | 90 ± 0.537 | 95 ± 0.06 | 97.77 ± 1.82 |
| 2 | Karthikeyan et al. 2021 [41] | Neural Network (NN)-based classification model | Lymphocytes, Neutrophils, hs-CRP, LDH, and age | 96.526 ± 0.637 | 0.9687 ± 0.006 | 0.9895 ± 0.0057 |
| 3 | Rehman et al. 2021 [32] | LR model | Age, Lymphocyte count, D-dimer, CRP, and Creatinine | 0.92 ± 0.03 | 0.93 ± 0.03 | 0.992 ± 0.008 |
| 4 | Our Proposed RF-based model | RF model | INR, P-LCR, and D-dimer | 0.96 ± 0.062 | 0.96 ± 0.099 | 0.98 ± 0.024 |
Publisher’s Note: MDPI stays neutral with regard to jurisdictional claims in published maps and institutional affiliations. |
© 2022 by the authors. Licensee MDPI, Basel, Switzerland. This article is an open access article distributed under the terms and conditions of the Creative Commons Attribution (CC BY) license (https://creativecommons.org/licenses/by/4.0/).
Share and Cite
Syed, A.H.; Khan, T.; Alromema, N. A Hybrid Feature Selection Approach to Screen a Novel Set of Blood Biomarkers for Early COVID-19 Mortality Prediction. Diagnostics 2022, 12, 1604. https://doi.org/10.3390/diagnostics12071604
Syed AH, Khan T, Alromema N. A Hybrid Feature Selection Approach to Screen a Novel Set of Blood Biomarkers for Early COVID-19 Mortality Prediction. Diagnostics. 2022; 12(7):1604. https://doi.org/10.3390/diagnostics12071604
Chicago/Turabian StyleSyed, Asif Hassan, Tabrej Khan, and Nashwan Alromema. 2022. "A Hybrid Feature Selection Approach to Screen a Novel Set of Blood Biomarkers for Early COVID-19 Mortality Prediction" Diagnostics 12, no. 7: 1604. https://doi.org/10.3390/diagnostics12071604
APA StyleSyed, A. H., Khan, T., & Alromema, N. (2022). A Hybrid Feature Selection Approach to Screen a Novel Set of Blood Biomarkers for Early COVID-19 Mortality Prediction. Diagnostics, 12(7), 1604. https://doi.org/10.3390/diagnostics12071604