
A Classification Approach for Cancer Survivors from Those Cancer-Free, Based on Health Behaviors: Analysis of the Lifelines Cohort

 , and
, and
Abstract
:Simple Summary
Abstract
1. Introduction
2. Materials and Methods
2.1. Study Design
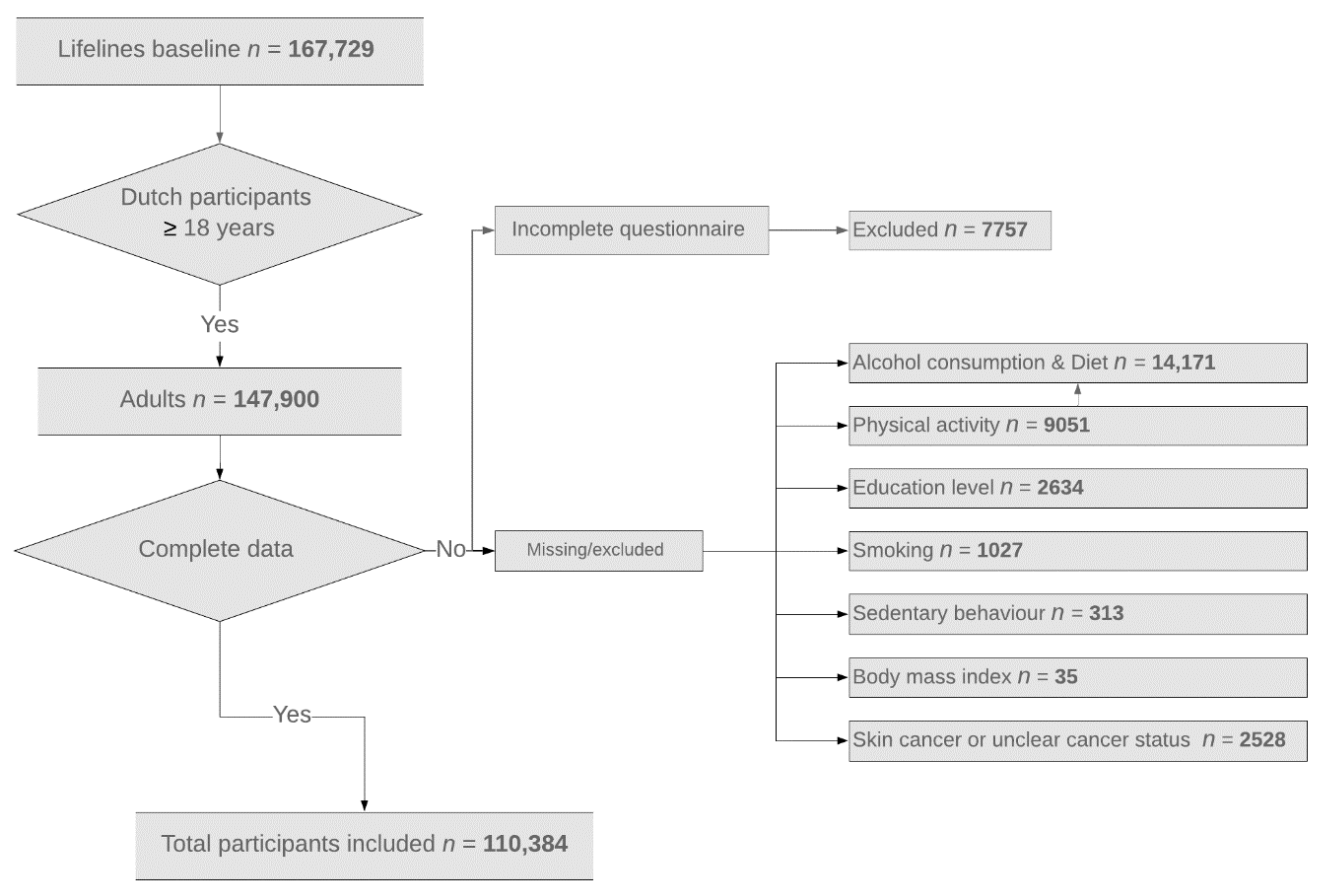
2.2. Participants
2.3. Measurements of Health Behaviors and Socioeconomic Factors
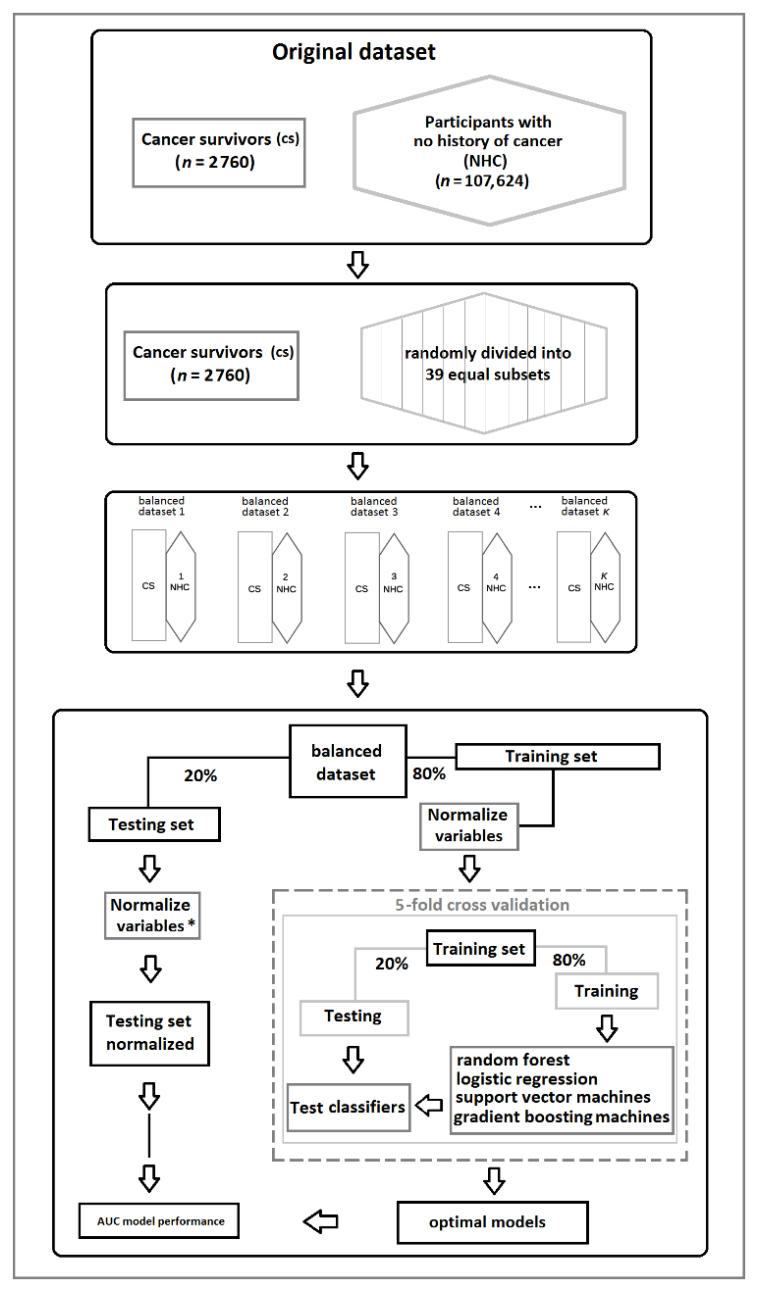
2.4. Statistical Analysis
3. Results
3.1. Descriptive Analysis of the Cohort
3.2. Performance of Individual Variables in Differentiating Cancer Survivors from Cancer-Free Participants
3.3. Performance of Nonlinear Algorithms
3.4. The Case–Control Analysis
4. Discussion
5. Conclusions
Supplementary Materials
Author Contributions
Funding
Institutional Review Board Statement
Informed Consent Statement
Data Availability Statement
Acknowledgments
Conflicts of Interest
References
- Ferlay, J.; Colombet, M.; Soerjomataram, I.; Dyba, T.; Randi, G. Cancer incidence and mortality patterns in Europe: Estimates for 40 countries and 25 major cancers in 2018. Eur. J. Cancer 2018, 103, 356–387. [Google Scholar] [CrossRef] [PubMed]
- Allemani, C.; Matsuda, T.; Di Carlo, V.; Harewood, R.; Matz, M.; Nikšić, M.; Bonaventure, A.; Valkov, M.; Johnson, C.J.; Estève, J.; et al. Articles Global surveillance of trends in cancer survival 2000–14 ( CONCORD-3 ): Analysis of individual records for 37,513,025 patients diagnosed with one of 18 cancers from 322 population-based registries in 71 countries. Lancet 2018, 14, 1023–1075. [Google Scholar] [CrossRef] [Green Version]
- Di Salvo, F.; Van Eycken, E.; Mayer-da-Silva, A.; Pannozzo, F.; Smailyte, G.; Mazzei, A.; Usala, M.; Aareleid, T.; Lambe, M.; Zvolský, M.; et al. Age and case mix-standardised survival for all cancer patients in Europe 1999–2007: Results of EUROCARE-5, a population-based study. Eur. J. Cancer 2015, 51, 2120–2129. [Google Scholar] [CrossRef]
- World Health Organisation. Latest global cancer data: Cancer burden rises to 18.1 million new cases and 9.6 million cancer deaths in 2018. Int. Agency Res. Cancer 2018. Available online: https://www.who.int/cancer/PRGlobocanFinal.pdf (accessed on 22 March 2021).
- Aunan, J.R.; Cho, W.C.; Søreide, K. The biology of aging and cancer: A brief overview of shared and divergent molecular hallmarks. Aging Dis. 2017, 8, 628–642. [Google Scholar] [CrossRef] [Green Version]
- Charles, S. Cancer survivorship. N. Engl. J. Med. 2018, 379, 2438–2450. [Google Scholar] [CrossRef]
- Lagergren, P.; Schandl, A.; Aaronson, N.K.; Adami, H.O.; de Lorenzo, F.; Denis, L.; Faithfull, S.; Liu, L.; Meunier, F.; Ulrich, C. Cancer survivorship: An integral part of Europe’s research agenda. Mol. Oncol. 2019, 13, 624–635. [Google Scholar] [CrossRef] [PubMed]
- Tollosa, D.N.; Tavener, M.; Hure, A.; James, E.L. Adherence to multiple health behaviours in cancer survivors: A systematic review and meta-analysis. J. Cancer Surviv. 2019. [Google Scholar] [CrossRef] [PubMed]
- Jayes, L.; Haslam, P.L.; Gratziou, C.G.; Powell, P.; Britton, J.; Vardavas, C.; Jimenez-Ruiz, C.; Leonardi-Bee, J.; Dautzenberg, B.; Lundbäck, B.; et al. SmokeHaz: Systematic Reviews and Meta-analyses of the Effects of Smoking on Respiratory Health. Chest 2016, 150, 164–179. [Google Scholar] [CrossRef] [Green Version]
- Bagnardi, V.; Rota, M.; Botteri, E.; Tramacere, I.; Islami, F.; Fedirko, V.; Scotti, L.; Jenab, M.; Turati, F.; Pasquali, E.; et al. Alcohol consumption and site-specific cancer risk: A comprehensive dose–response. Br. J. Cancer 2015, 112, 580–593. [Google Scholar] [CrossRef]
- Potter, J.; Brown, L.; Williams, R.L.; Byles, J.; Collins, C.E. Diet quality and cancer outcomes in adults: A systematic review of epidemiological studies. Int. J. Mol. Sci. 2016, 17, 1052. [Google Scholar] [CrossRef] [Green Version]
- Grosso, G.; Bella, F.; Godos, J.; Sciacca, S.; Del Rio, D.; Ray, S.; Galvano, F.; Giovannucci, E.L. Possible role of diet in cancer: Systematic review and multiple meta-analyses of dietary patterns, lifestyle factors, and cancer risk. Nutr. Rev. 2017, 75, 405–419. [Google Scholar] [CrossRef]
- Moore, S.C.; Lee, I.; Weiderpass, E.; Campbell, P.T.; Sampson, J.N.; Kitahara, C.M.; Keadle, S.K.; Arem, H.; De Gonzalez, A.B.; Hartge, P.; et al. Association of Leisure-Time Physical Activity With Risk of 26 Types of Cancer in 1.44 Million Adults. JAMA Intern. Med. 2016, 176, 816–825. [Google Scholar] [CrossRef]
- Choi, E.K.; Park, H.B.; Lee, K.H.; Park, J.H.; Eisenhut, M.; van der Vliet, H.J.; Kim, G.; Shin, J.I. Body mass index and 20 specific cancers: Re-analyses of dose-response meta-analyses of observational studies. Ann. Oncol. 2018, 29, 749–757. [Google Scholar] [CrossRef] [Green Version]
- Schmid, D.; Michael, F. Television Viewing and Time Spent Sedentary in Relation to Cancer Risk: A Meta-Analysis. J. Natl. Cancer Inst. 2014, 106, 1–19. [Google Scholar] [CrossRef] [Green Version]
- De Magalhães, J.P. How ageing processes influence cancer. Nat. Rev. Cancer 2013, 13, 357–365. [Google Scholar] [CrossRef]
- Kim, H.I.; Lim, H.; Moon, A. Sex differences in cancer: Epidemiology, genetics and therapy. Biomol. Ther. 2018, 26, 335–342. [Google Scholar] [CrossRef]
- Menvielle, G.; Kunst, A.E.; Stirbu, I.; Strand, B.H.; Borrell, C.; Regidor, E.; Leclerc, A.; Esnaola, S.; Bopp, M.; Lundberg, O.; et al. Educational differences in cancer mortality among women and men: A gender pattern that differs across Europe. Br. J. Cancer 2008, 98, 1012–1019. [Google Scholar] [CrossRef]
- Mowls, D.S.; Brame, L.S.; Martinez, S.A.; Beebe, L.A. Lifestyle behaviors among US cancer survivors. J. Cancer Surviv. 2016, 10, 692–698. [Google Scholar] [CrossRef]
- Eakin, E.G.; Youlden, D.R.; Baade, P.D.; Lawler, S.P.; Reeves, M.M.; Heyworth, J.S.; Fritschi, L. Health behaviors of cancer survivors: Data from an Australian population-based survey. Cancer Causes Control. 2007, 18, 881–894. [Google Scholar] [CrossRef]
- Oh, M.G.; Han, M.A.; Park, J.; Ryu, S.Y.; Park, C.Y.; Choi, S.W. Health behaviors of cancer survivors: The fourth korea national health and nutrition examination survey (KNHANES IV, 2007-09). Jpn. J. Clin. Oncol. 2013, 43, 981–987. [Google Scholar] [CrossRef] [Green Version]
- Friis, K.; Larsen, F.B.; Nielsen, C.V.; Momsen, A.M.H.; Stapelfeldt, C.M. Social inequality in cancer survivors’ health behaviours-A Danish population-based study. Eur. J. Cancer Care 2018, 1–13. [Google Scholar] [CrossRef] [PubMed]
- Park, B.; Kong, S.Y.; Kim, J.; Kim, Y.; Park, I.H.; Jung, S.Y.; Lee, E.S.; Ivkovic, V. Health behaviors of cancer survivors in nationwide cross-sectional survey in Korea: Higher alcohol drinking, lower smoking, and physical inactivity pattern in survivors with higher household income. Medicine 2015, 94, 1–8. [Google Scholar] [CrossRef] [PubMed]
- Bellizzi, K.M.; Rowland, J.H.; Jeffery, D.D.; McNeel, T. Health behaviors of cancer survivors: Examining opportunities for cancer control intervention. J. Clin. Oncol. 2005, 23, 8884–8893. [Google Scholar] [CrossRef] [PubMed]
- Mayer, D.K.; Terrin, N.C.; Menon, U.; Kreps, G.L.; McCance, K.; Parsons, S.K.; Mooney, K.H. Health Behaviors in Cancer Survivors. Oncol. Nurs. Forum 2007, 34, 643–651. [Google Scholar] [CrossRef] [PubMed] [Green Version]
- Coups, E.J.; Ostroff, J.S. A population-based estimate of the prevalence of behavioral risk factors among adult cancer survivors and noncancer controls. Prev. Med. 2005, 40, 702–711. [Google Scholar] [CrossRef] [PubMed]
- Wang, Z.; McLoone, P.; Morrison, D.S. Diet, exercise, obesity, smoking and alcohol consumption in cancer survivors and the general population: A comparative study of 16 282 individuals. Br. J. Cancer 2015, 112, 572–575. [Google Scholar] [CrossRef] [Green Version]
- Richter, A.N.; Khoshgoftaar, T.M. A review of statistical and machine learning methods for modeling cancer risk using structured clinical data. Artif. Intell. Med. 2018, 90, 1–14. [Google Scholar] [CrossRef] [PubMed] [Green Version]
- Breiman, L. Random Forests. Mach. Learn. 2001, 5–32. [Google Scholar] [CrossRef] [Green Version]
- Dreiseitl, S.; Ohno-machado, L. Logistic regression and artificial neural network classification models: A methodology review. J. Med. Inform. 2003, 35, 352–359. [Google Scholar] [CrossRef] [Green Version]
- Krakovska, O.; Christie, G.; Sixsmith, A.; Ester, M.; Moreno, S. Performance comparison of linear and nonlinear feature selection methods for the analysis of large survey datasets. PLoS ONE 2019, 14, e0213584. [Google Scholar] [CrossRef]
- Kourou, K.; Exarchos, T.P.; Exarchos, K.P.; Karamouzis, M.V.; Fotiadis, D.I. Machine learning applications in cancer prognosis and prediction. Comput. Struct. Biotechnol. J. 2015, 13, 8–17. [Google Scholar] [CrossRef] [PubMed] [Green Version]
- Ganggayah, M.D.; Taib, N.A.; Har, Y.C.; Lio, P.; Dhillon, S.K. Predicting factors for survival of breast cancer patients using machine learning techniques. BMC Med. Inform. Decis. Mak. 2019, 19, 48. [Google Scholar] [CrossRef] [PubMed] [Green Version]
- Lynch, C.M.; Abdollahi, B.; Fuqua, J.D.; de Carlo, A.R.; Bartholomai, J.A.; Balgemann, R.N.; van Berkel, V.H.; Frieboes, H.B. Prediction of lung cancer patient survival via supervised machine learning classification techniques. Int. J. Med. Inform. 2017, 108, 1–8. [Google Scholar] [CrossRef] [PubMed]
- Cruz, J.A.; Wishart, D.S. Applications of Machine Learning in Cancer Prediction and Prognosis. Cancer Inform. 2006, 2, 59–78. [Google Scholar] [CrossRef]
- Scholtens, S.; Smidt, N.; Swertz, M.A.; Bakker, S.J.L.; Dotinga, A.; Vonk, J.M.; Van Dijk, F.; Van Zon, S.K.R.; Wijmenga, C.; Wolffenbuttel, B.H.R.; et al. Cohort Profile: LifeLines, a three-generation cohort study and biobank. Int. J. Epidemiol. 2015, 44, 1172–1180. [Google Scholar] [CrossRef] [Green Version]
- Holm, A.S.S.; Wulf, H.C. Self-reported skin cancer is unreliable. Eur. J. Epidemiol. 2015, 30, 159–162. [Google Scholar] [CrossRef]
- Galobardes, B.; Lynch, J.; Smith, G.D. Measuring socioeconomic position in health research. Br. Med. Bull. 2007, 81–82, 21–37. [Google Scholar] [CrossRef] [Green Version]
- National Cancer Institute. Smoking and Tobacco Control Monograph 9: Cigars: Health Effects and Trends. Available online: https://cancercontrol.cancer.gov/brp/tcrb/monographs/9/m9_complete.pdf (accessed on 28 October 2019).
- Kromhout, D.; Spaaij, C.J.K.; De Goede, J.; Weggemans, R.M.; Brug, J.; Geleijnse, J.M.; Van Goudoever, J.B.; Hoes, A.W.; Hopman, M.T.E.; Iestra, J.A.; et al. The 2015 Dutch food-based dietary guidelines. Eur. J. Clin. Nutr. 2016, 70, 869–878. [Google Scholar] [CrossRef]
- Wendel-vos, G.C.W.; Schuit, A.J.; Saris, W.H.M.; Kromhout, D. Reproducibility and relative validity of the Short Questionnaire to Assess Health-enhancing physical activity. J. Clin. Epidemiol. 2003, 56, 1163–1169. [Google Scholar] [CrossRef] [Green Version]
- Ainsworth, B.E.; Haskell, W.L.; Herrmann, S.D.; Meckes, N.; Basett, D.R.B., Jr.; Tudor-Locke, C.; Greer, J.L.; Vezina, J.; Whitt-glover, M.C.; Leon, A.S. 2011 Compendium of Physical Activities: A Second Update of Codes and MET Values. Med. Sci. Sports Exerc. 2011, 43, 1575–1581. [Google Scholar] [CrossRef] [Green Version]
- Vinke, P.C.; Corpeleijn, E.; Dekker, L.H.; Jacobs, D.R.; Navis, G.; Kromhout, D. Development of the food-based Lifelines Diet Score (LLDS) and its application in 129,369 Lifelines participants. Eur. J. Clin. Nutr. 2018, 72, 1111–1119. [Google Scholar] [CrossRef] [Green Version]
- Sun, Y.; Wong, A.K.C.; Kamel, M.S. Classification of imbalanced data: A review. Int. J. Pattern Recognit. Artif. Intell. 2009, 23, 687–719. [Google Scholar] [CrossRef]
- Christodoulou, E.; Ma, J.; Collins, G.S.; Steyerberg, E.W.; Verbakel, J.Y.; Van Calster, B. A systematic review shows no performance benefit of machine learning over logistic regression for clinical prediction models. J. Clin. Epidemiol. 2019, 110, 12–22. [Google Scholar] [CrossRef]
- Cortés-Ibáñez, F.O.; Jaramillo-Calle, D.A.; Vinke, P.C.; Byambasukh, O.; Corpeleijn, E.; Sijtsma, A.; Eulenburg, C.; Vonk, J.M.; de Bock, G.H. Comparison of health behaviours between cancer survivors and the general population: A cross-sectional analysis of the Lifelines cohort. J. Cancer Surviv. 2020. [Google Scholar] [CrossRef] [Green Version]
- Hawkins, M.L.; Buys, S.S.; Gren, L.H.; Simonsen, S.E.; Kirchhoff, A.C.; Hashibe, M. Do cancer survivors develop healthier lifestyle behaviors than the cancer-free population in the PLCO study? J. Cancer Surviv. 2017, 11, 233–245. [Google Scholar] [CrossRef]
- Prince, S.A.; Adamo, K.B.; Hamel, M.E.; Hardt, J.; Connor Gorber, S.; Tremblay, M. A comparison of direct versus self-report measures for assessing physical activity in adults: A systematic review. Int. J. Behav. Nutr. Phys. Act. 2008, 5. [Google Scholar] [CrossRef] [Green Version]
- Sweegers, M.G.; Boyle, T.; Vallance, J.K.; Chinapaw, M.J.; Brug, J.; Aaronson, N.K.; D’Silva, A.; Kampshoff, C.S.; Lynch, B.M.; Nollet, F.; et al. Which cancer survivors are at risk for a physically inactive and sedentary lifestyle? Results from pooled accelerometer data of 1447 cancer survivors. Int. J. Behav. Nutr. Phys. Act. 2019, 16, 1–15. [Google Scholar] [CrossRef]


| Variables | Cancer Survivors | Matched Cancer-Free Controls | All Participants without Cancer | p-Value |
|---|---|---|---|---|
| Participants | 2760 | 2759 | 107,624 | |
| Age, mean (SD) | 57 (18) | 57 (18) | 44 (16) | p < 0.001 |
| Sex, females (%) | 1883 (68.2%) | 1882 (68.2%) | 62,910 (58.5%) | p < 0.001 |
| Education level | ||||
| Low (%) | 1209 (43.8%) | 1179 (42.7%) | 30,676 (28.5%) | |
| Medium (%) | 862 (31.2%) | 869 (31.5%) | 43,107 (40.1%) | |
| High (%) | 689 (25.0%) | 711 (25.8%) | 33,841 (31.4%) | p < 0.001 |
| Time since cancer diagnosis | ||||
| ≤5 years (%) | 1153 (41.7%) | |||
| >5 years (%) | 1607 (58.3%) | p < 0.001 | ||
| Body mass index | 26.2 (5.20) | 26.0 (5.10) | 25.4 (5.20) | p < 0.001 |
| Smoking g/day, mean (SD) | 2.02 (5.69) | 1.65 (4.85) | 2.21 (5.75) | |
| Never (%) | 1013 (36.7%) | 1095 (39.7%) | 50,624 (47.0%) | |
| Former (%) | 1288 (46.7%) | 1238 (44.9%) | 35,067 (32.6%) | |
| Current (%) | 459 (16.6%) | 426 (15.4%) | 21,933 (20.4%) | p < 0.001 |
| Alcohol intake g/day | 3.31 (9.35) | 3.57 (9.24) | 3.95 (9.46) | p < 0.001 |
| Physical activity hrs/week | 3.25 (5.75) | 3.50 (5.58) | 3.00 (5.00) | p < 0.001 |
| Diet LLDS | 26.00 (8.00) | 26.00 (8.00) | 24.00 (8.00) | p < 0.001 |
| Sedentary behavior (TV hrs/day) | 3.00 (1.61) | 3.50 (1.50) | 2.00 (1.50) | p < 0.001 |
| Scenarios | AUC 39 Subsets | AUC Case–Controls | ||||||
|---|---|---|---|---|---|---|---|---|
| Logistic Regression | Random Forest | Support Vector Machines | Gradient Boosting Machines | Logistic Regression | Random Forest | Support Vector Machines | Gradient Boosting Machines | |
| All variables included * (95% CI). | 0.75 ± 0.01 | 0.75 ± 0.01 | 0.76 ± 0.02 | 0.74 ± 0.01 | 0.52 ± 0.01 | 0.52 ± 0.01 | 0.55 ± 0.02 | 0.53 ± 0.01 |
| - Excluding age (95% CI) | 0.63 ± 0.01 | 0.63 ± 0.01 | 0.66 ± 0.01 | 0.65 ± 0.02 | - | - | - | - |
| - Excluding age and sex (95% CI) | 0.62 ± 0.01 | 0.63 ± 0.01 | 0.65 ± 0.01 | 0.64 ± 0.02 | - | - | - | - |
| - Excluding age and education level (95% CI) | 0.60 ± 0.01 | 0.62 ± 0.01 | 0.63 ± 0.01 | 0.61 ± 0.01 | - | - | - | - |
| Variables | All Variables | Health Behaviors * | Case–Control * |
|---|---|---|---|
| Age | 100 | - | - |
| Sex | 7.65 | - | - |
| Education level | 6.03 | - | - |
| Body Mass Index | 56.44 | 100 | 100 |
| Alcohol intake | 54.04 | 99.42 | 99.15 |
| Physical activity | 45.87 | 83.23 | 84.93 |
| Diet | 43.77 | 73.95 | 76.93 |
| Sedentary behavior | 32.96 | 53.19 | 58.77 |
| Smoking | 13.27 | 12.84 | 24.30 |
Publisher’s Note: MDPI stays neutral with regard to jurisdictional claims in published maps and institutional affiliations. |
© 2021 by the authors. Licensee MDPI, Basel, Switzerland. This article is an open access article distributed under the terms and conditions of the Creative Commons Attribution (CC BY) license (https://creativecommons.org/licenses/by/4.0/).
Share and Cite
Cortés-Ibañez, F.O.; Belur Nagaraj, S.; Cornelissen, L.; Sidorenkov, G.; de Bock, G.H. A Classification Approach for Cancer Survivors from Those Cancer-Free, Based on Health Behaviors: Analysis of the Lifelines Cohort. Cancers 2021, 13, 2335. https://doi.org/10.3390/cancers13102335
Cortés-Ibañez FO, Belur Nagaraj S, Cornelissen L, Sidorenkov G, de Bock GH. A Classification Approach for Cancer Survivors from Those Cancer-Free, Based on Health Behaviors: Analysis of the Lifelines Cohort. Cancers. 2021; 13(10):2335. https://doi.org/10.3390/cancers13102335
Chicago/Turabian StyleCortés-Ibañez, Francisco O., Sunil Belur Nagaraj, Ludo Cornelissen, Grigory Sidorenkov, and Geertruida H. de Bock. 2021. "A Classification Approach for Cancer Survivors from Those Cancer-Free, Based on Health Behaviors: Analysis of the Lifelines Cohort" Cancers 13, no. 10: 2335. https://doi.org/10.3390/cancers13102335