
Characteristics of Volatile Organic Compounds in the Pearl River Delta Region, China: Chemical Reactivity, Source, and Emission Regions


Abstract
:1. Introduction
2. Materials and Methods
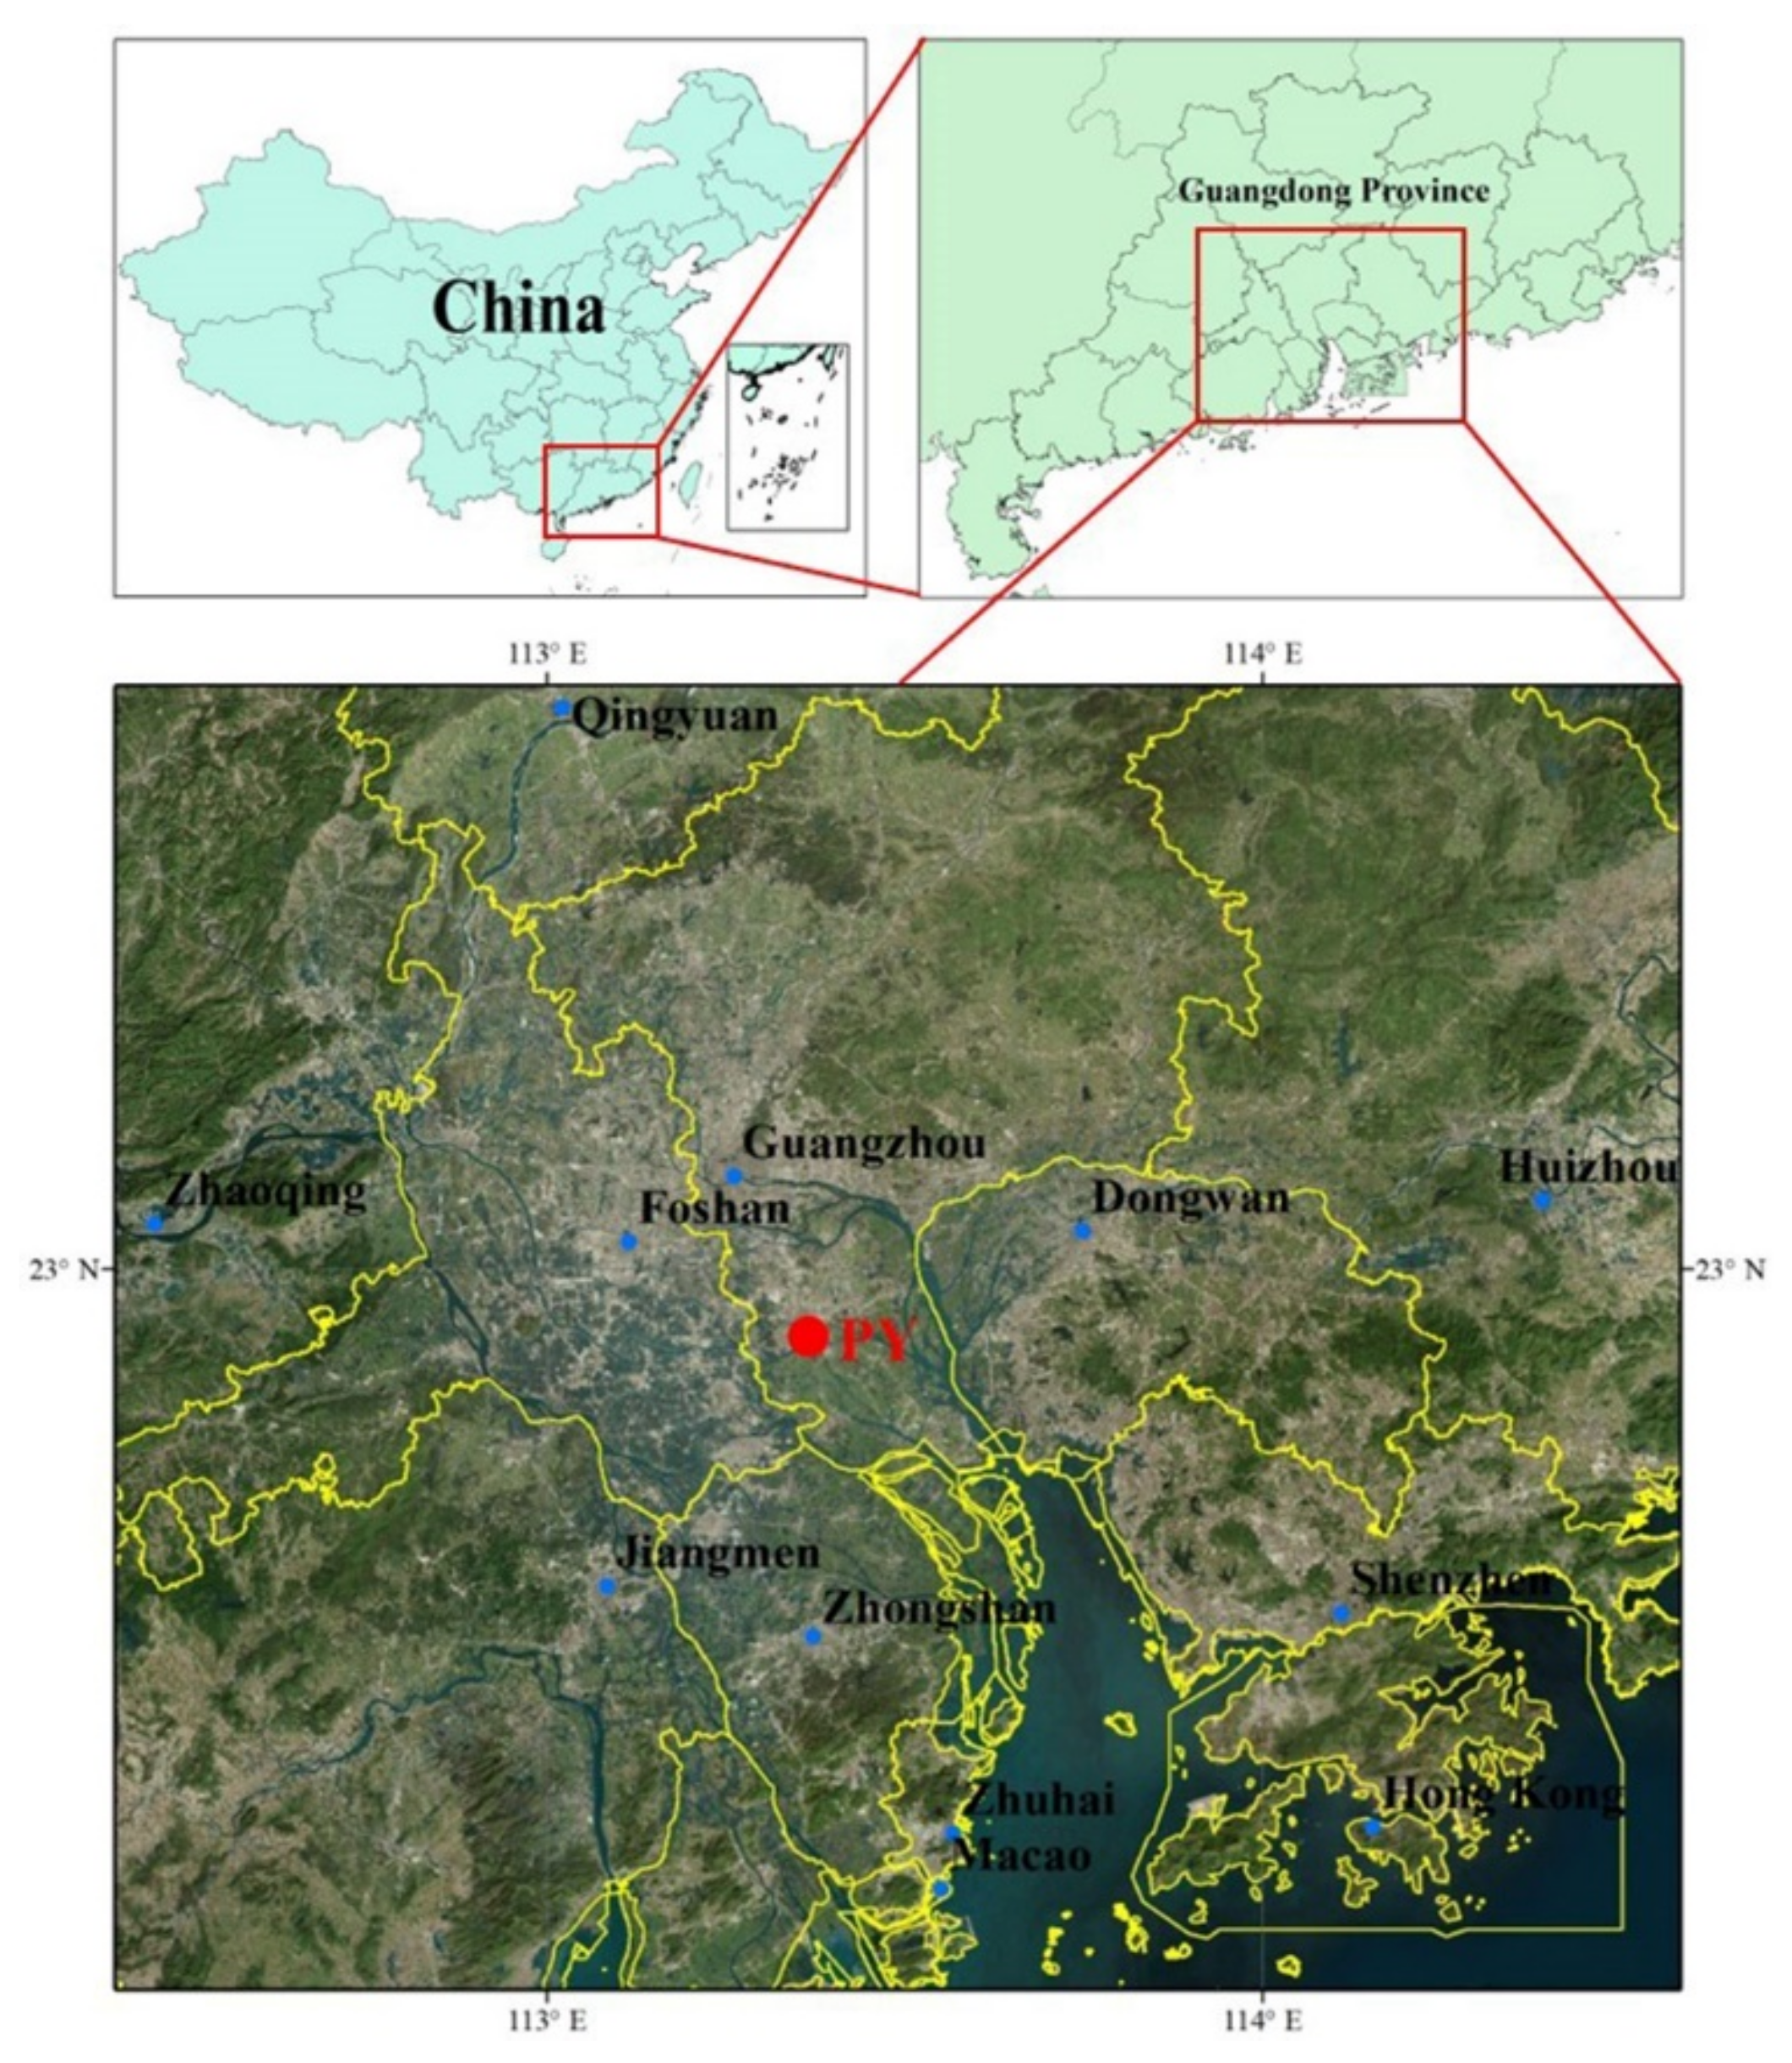
2.1. Field Sampling
2.2. Online Measurement of VOCs and Other Pollutants
2.3. Quality Control and Quality Assurance
2.4. Data Analysis
2.4.1. The OH Loss Rate of VOCs
2.4.2. Secondary Organic Aerosol Formation Potential (SOAFP)
2.4.3. Positive Matrix Factorization
3. Results
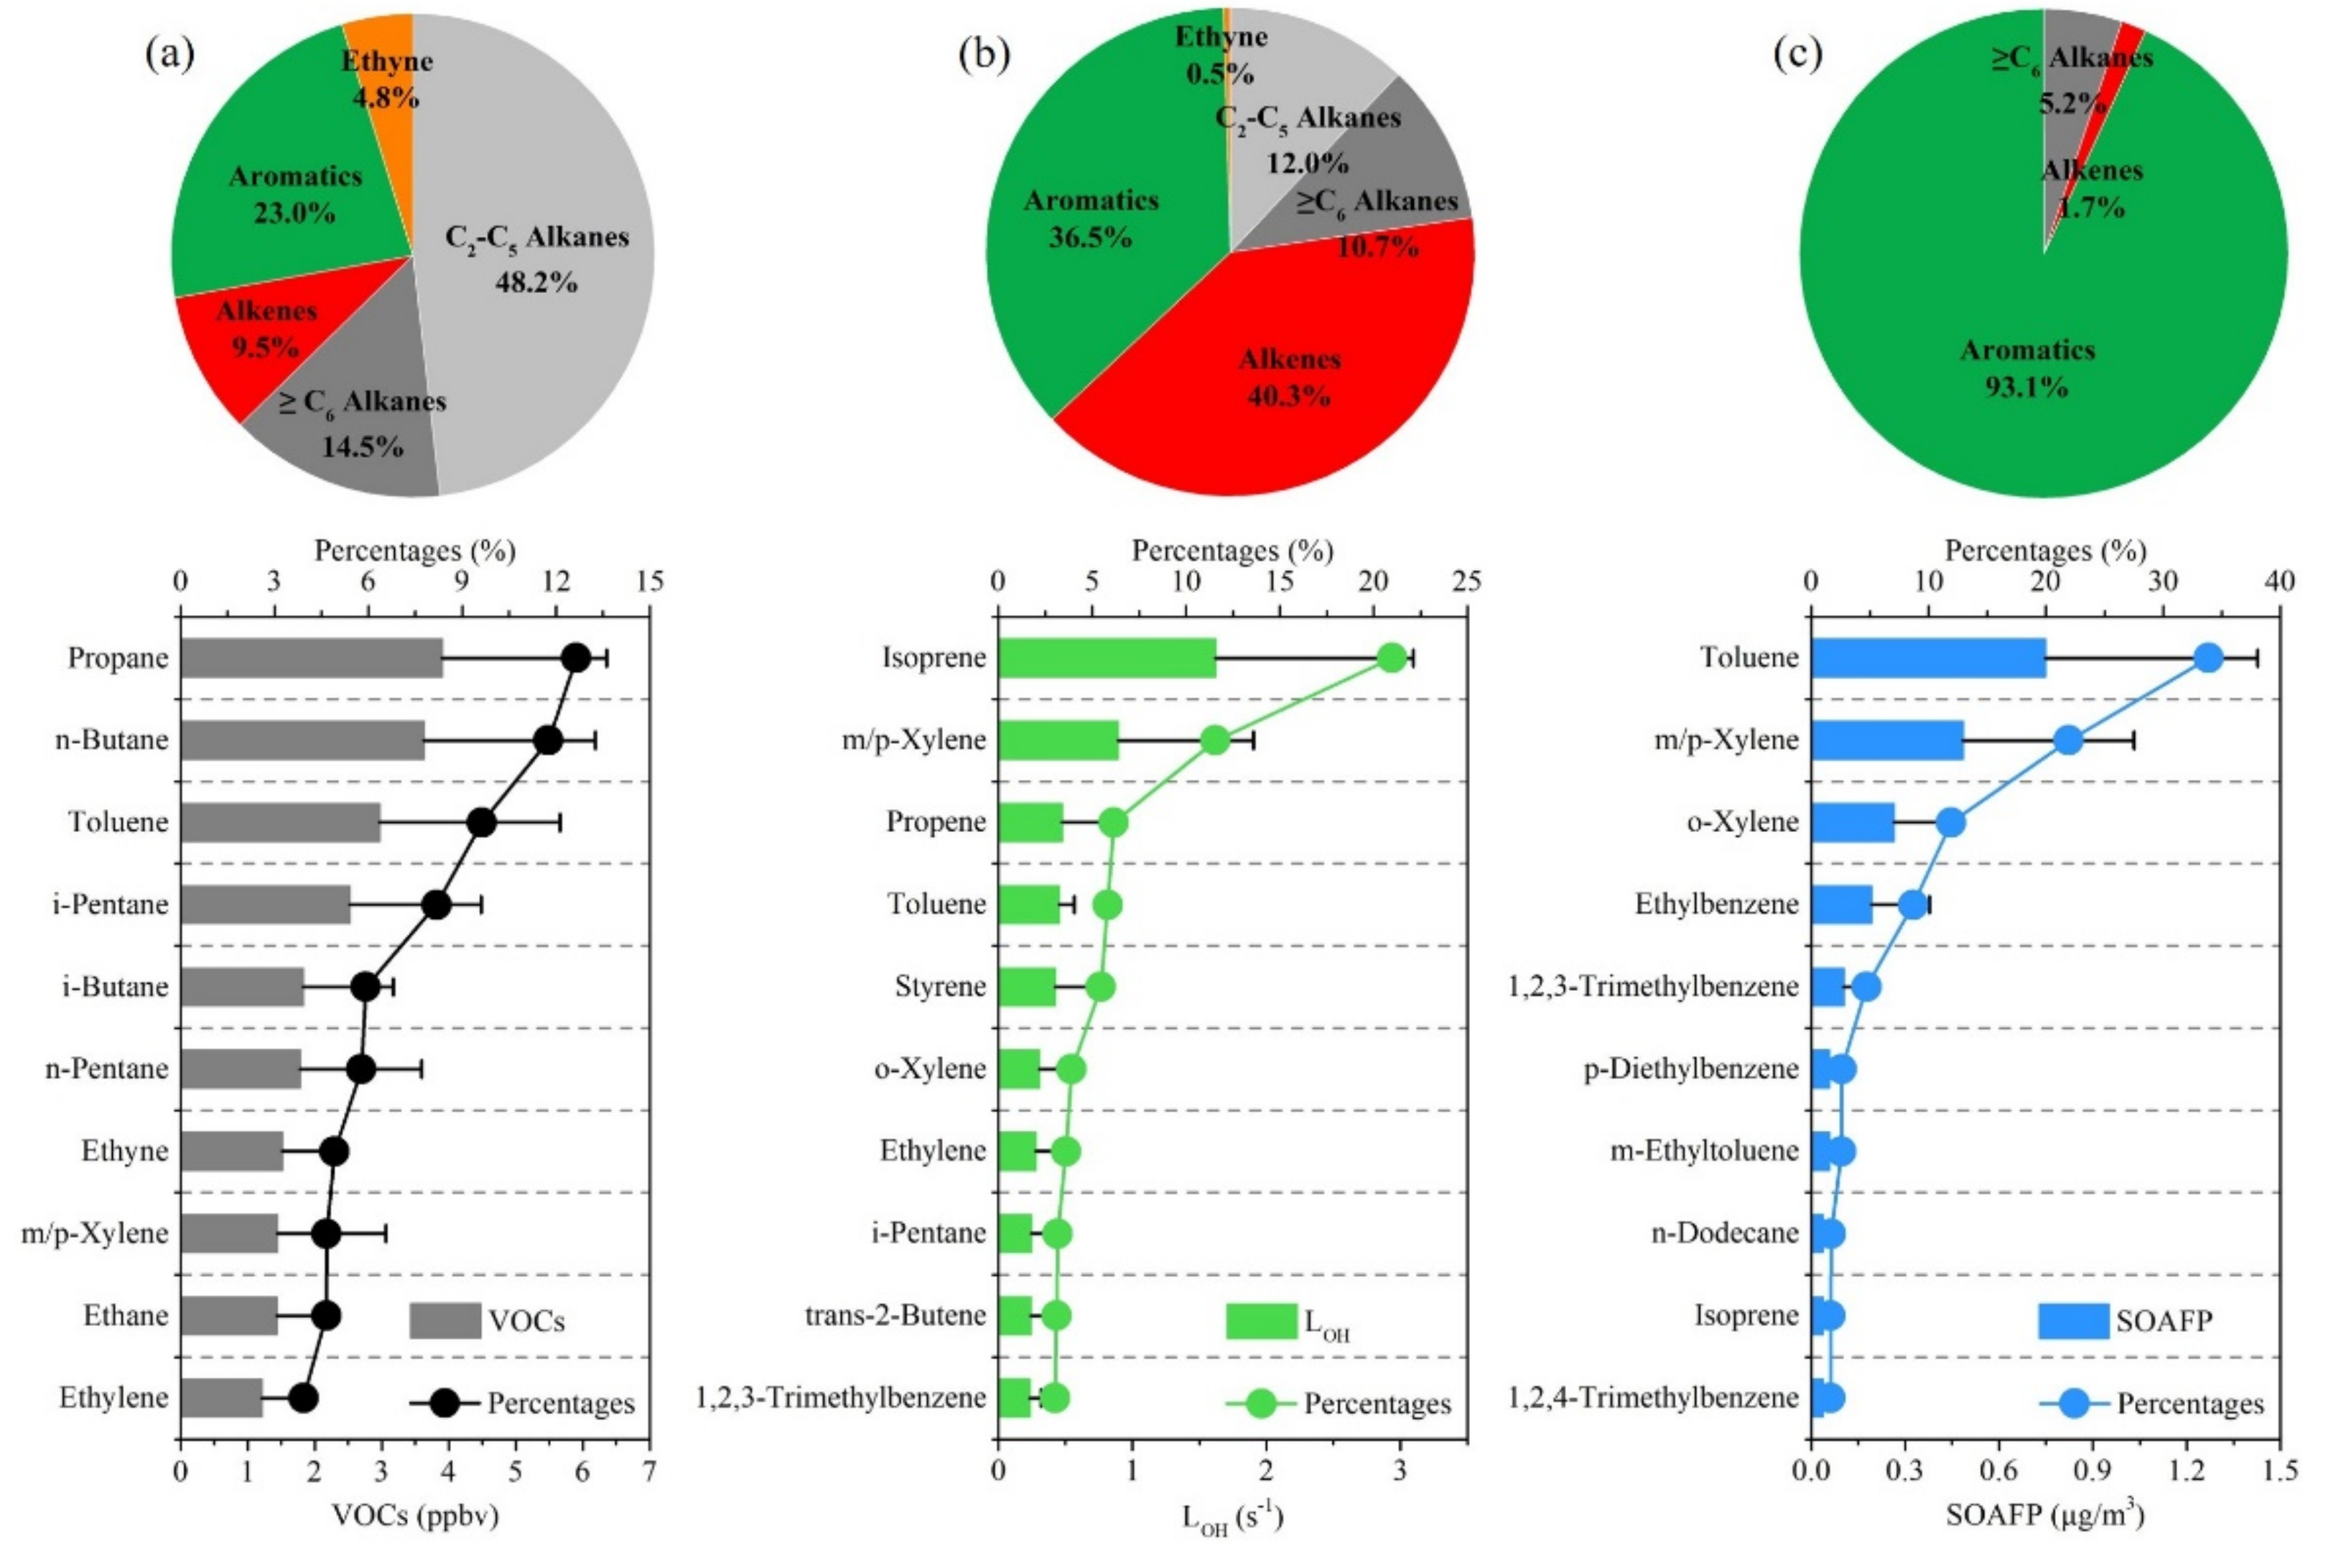
3.1. Characteristics of O3 and Ambient VOCs
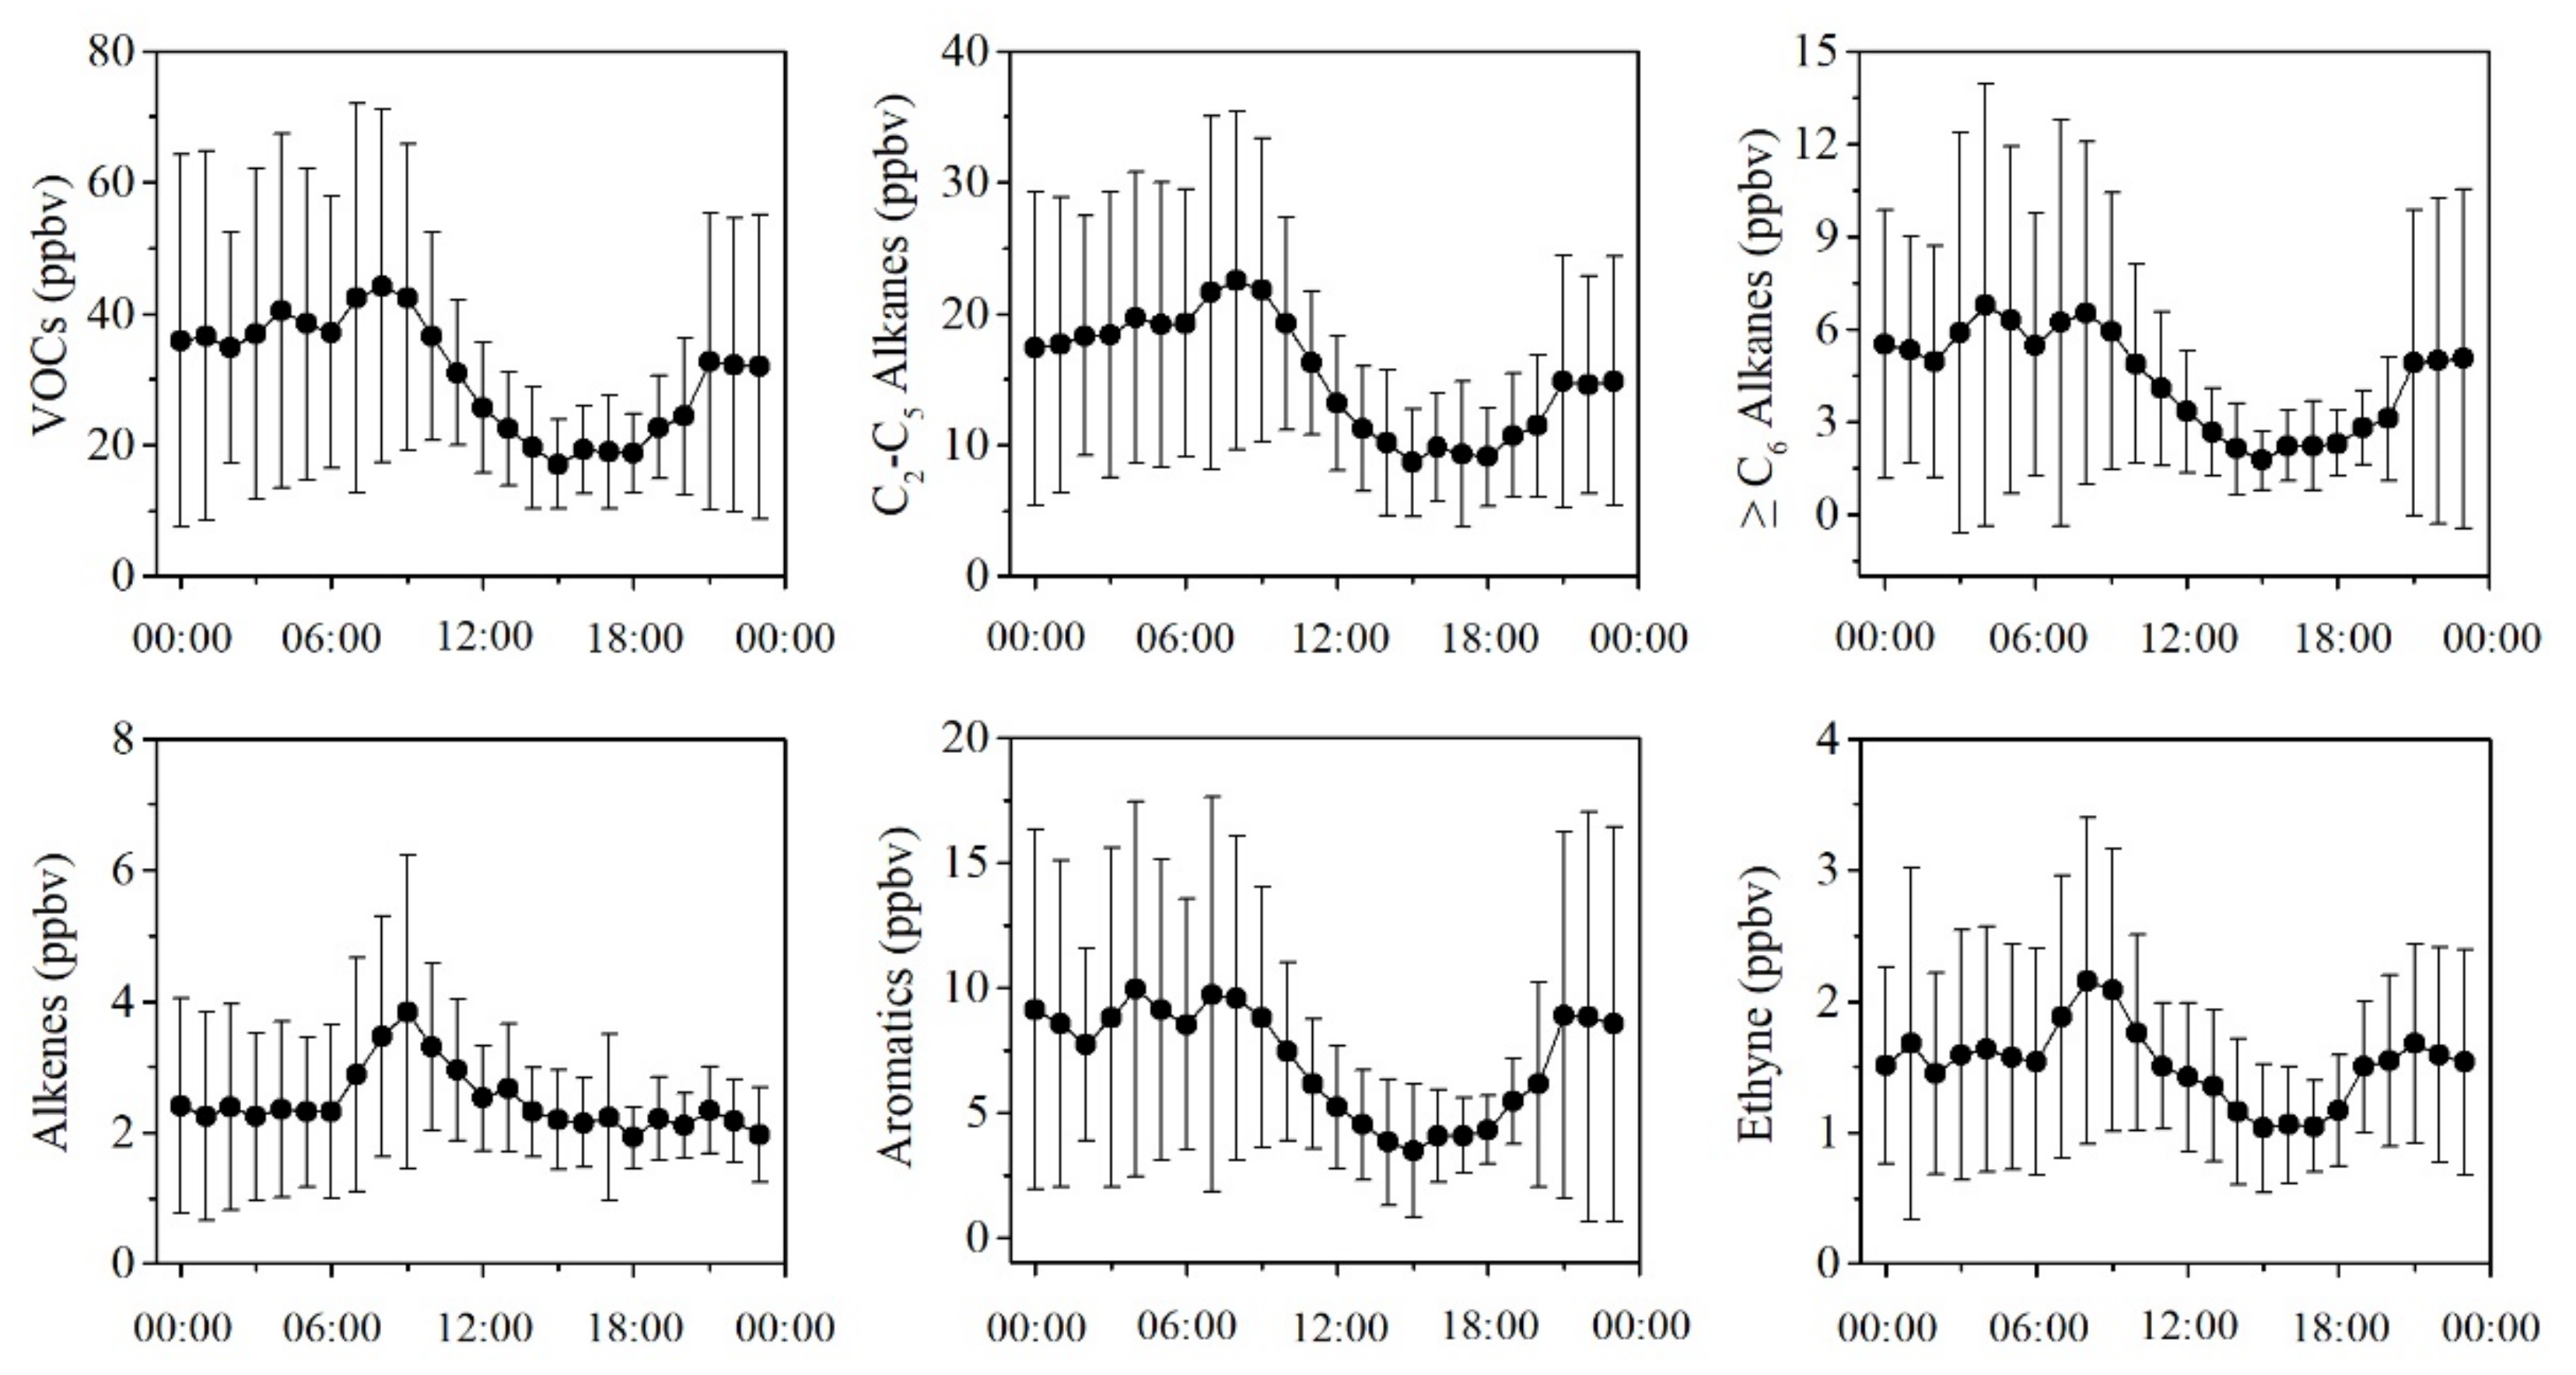
3.2. Diurnal Variations in VOCs
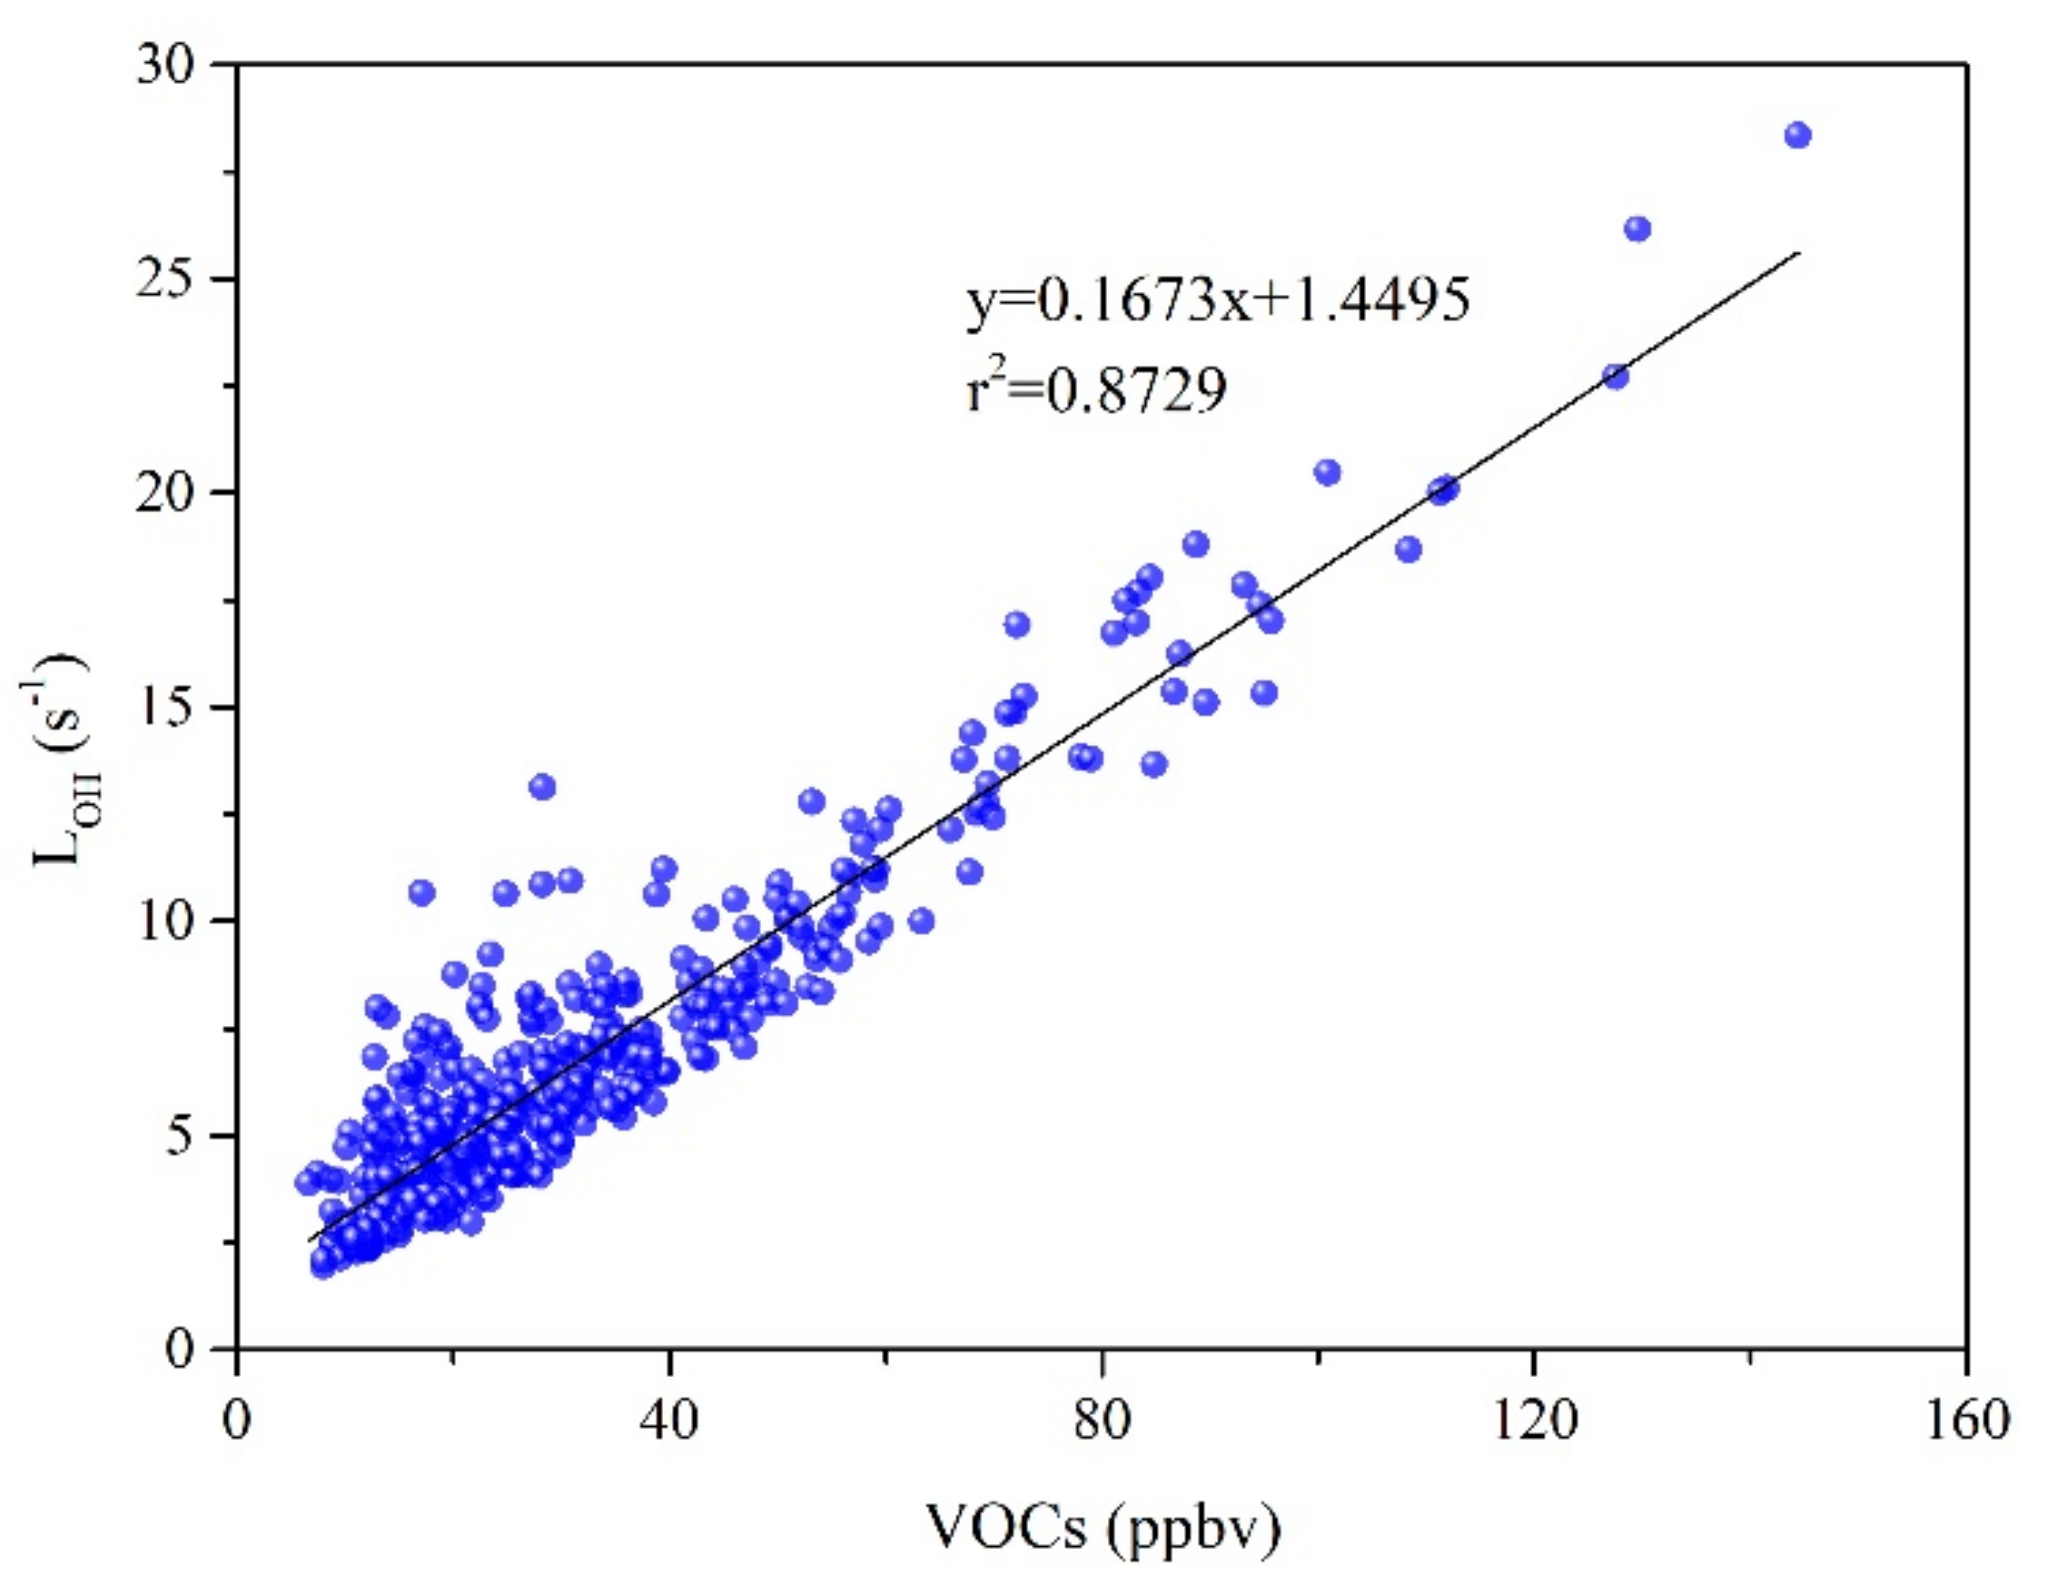
3.3. LOH and SOAFP
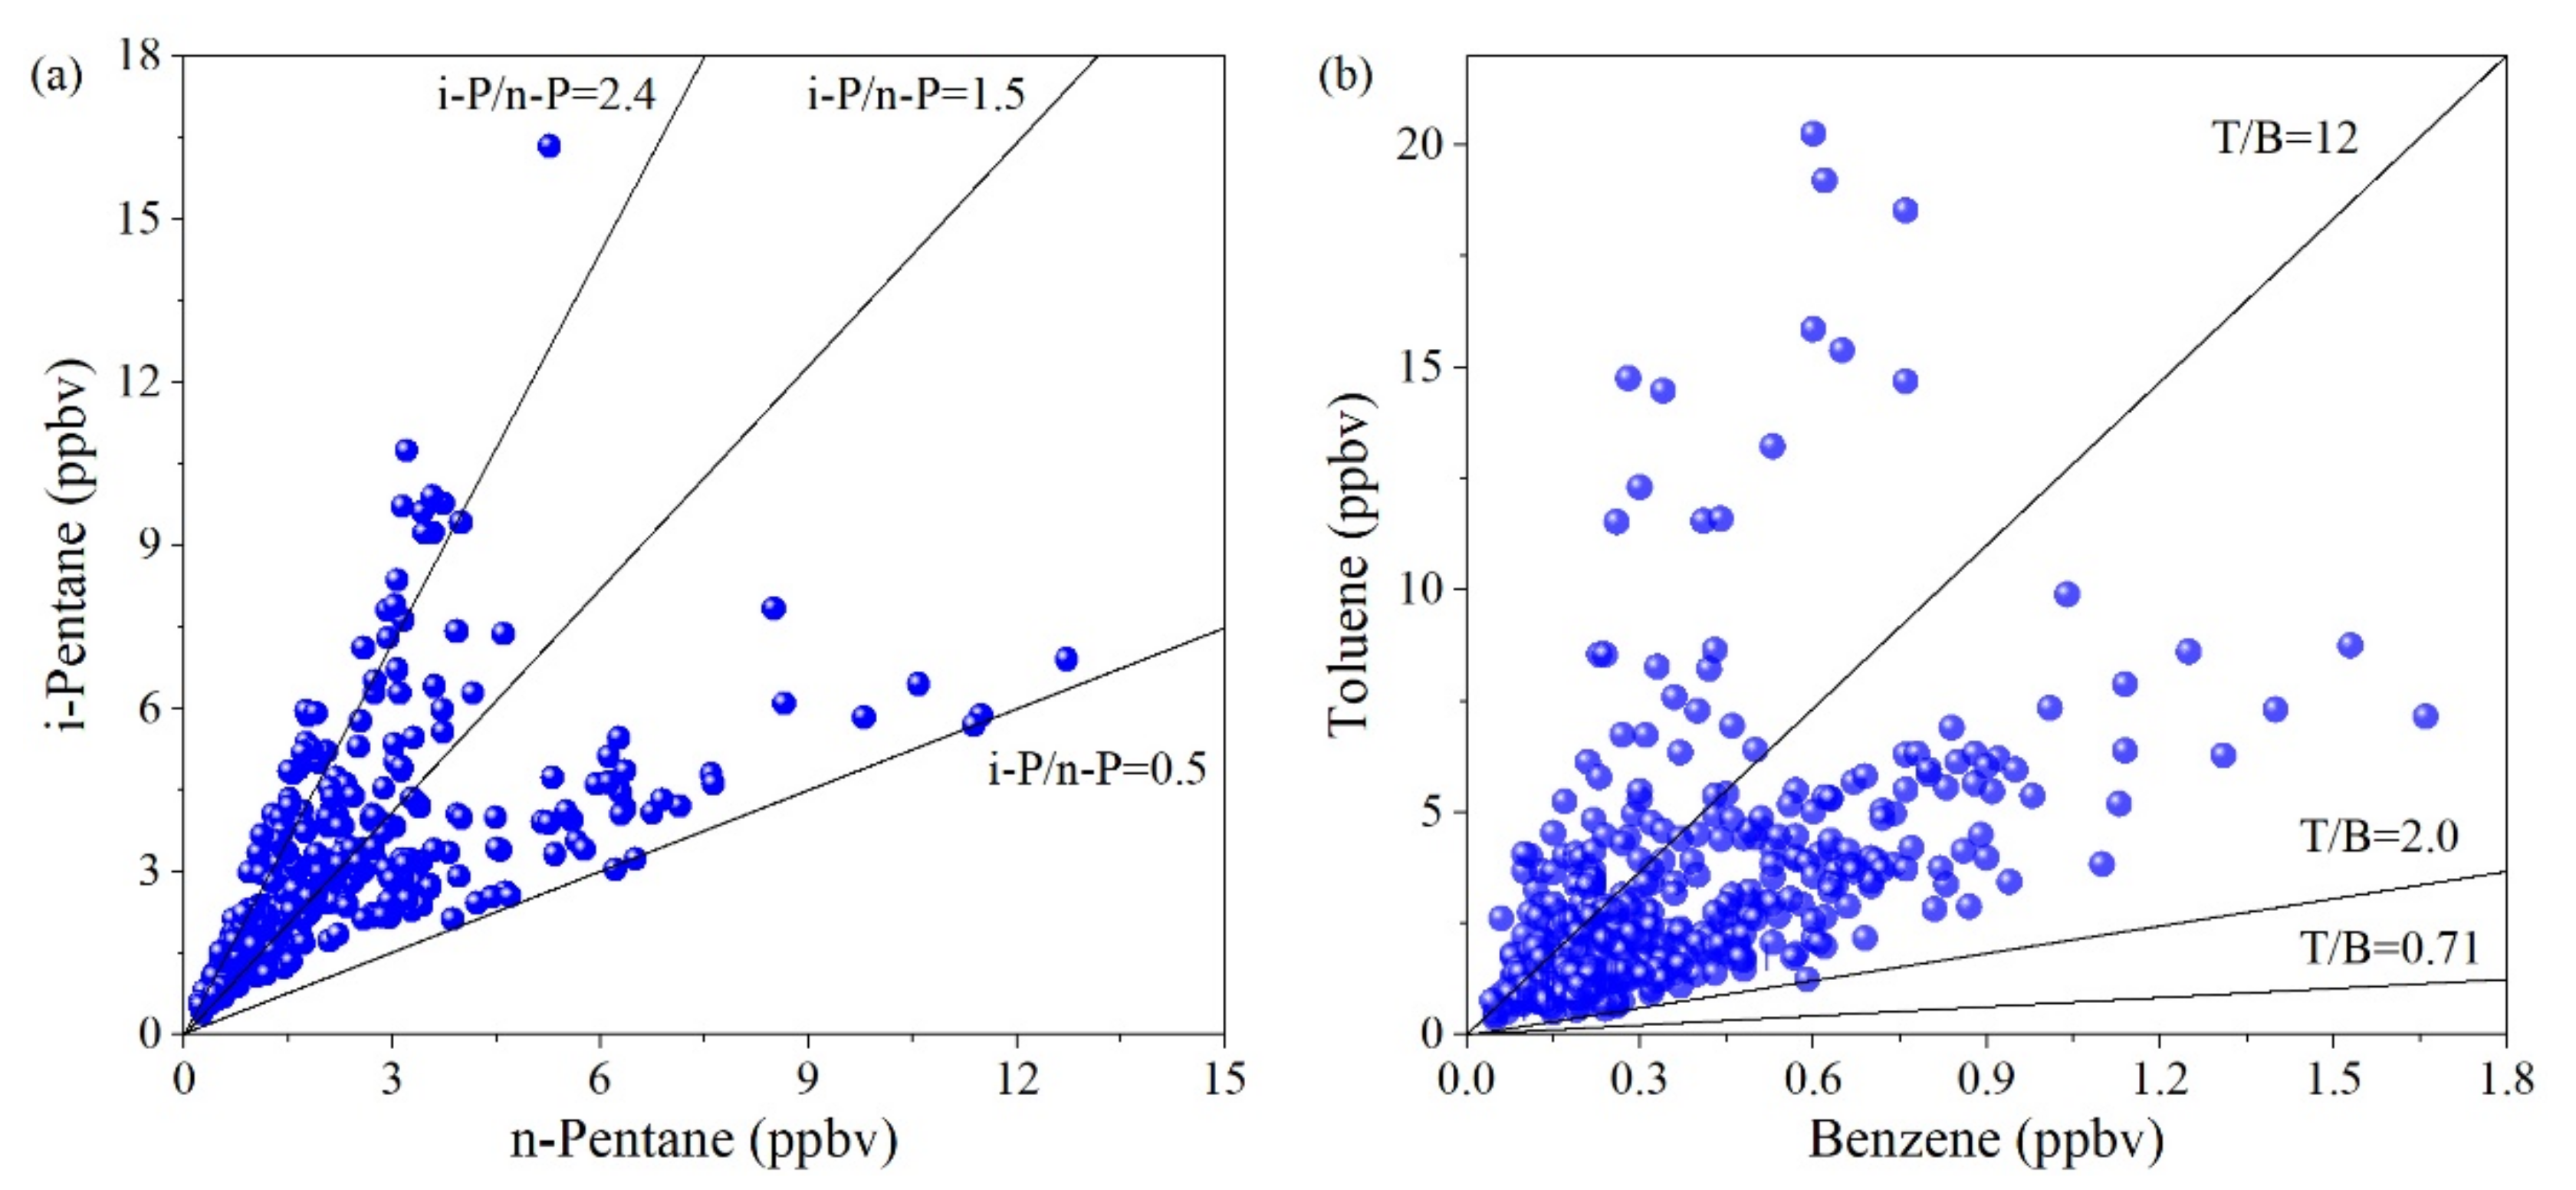
3.4. Ratio Analysis
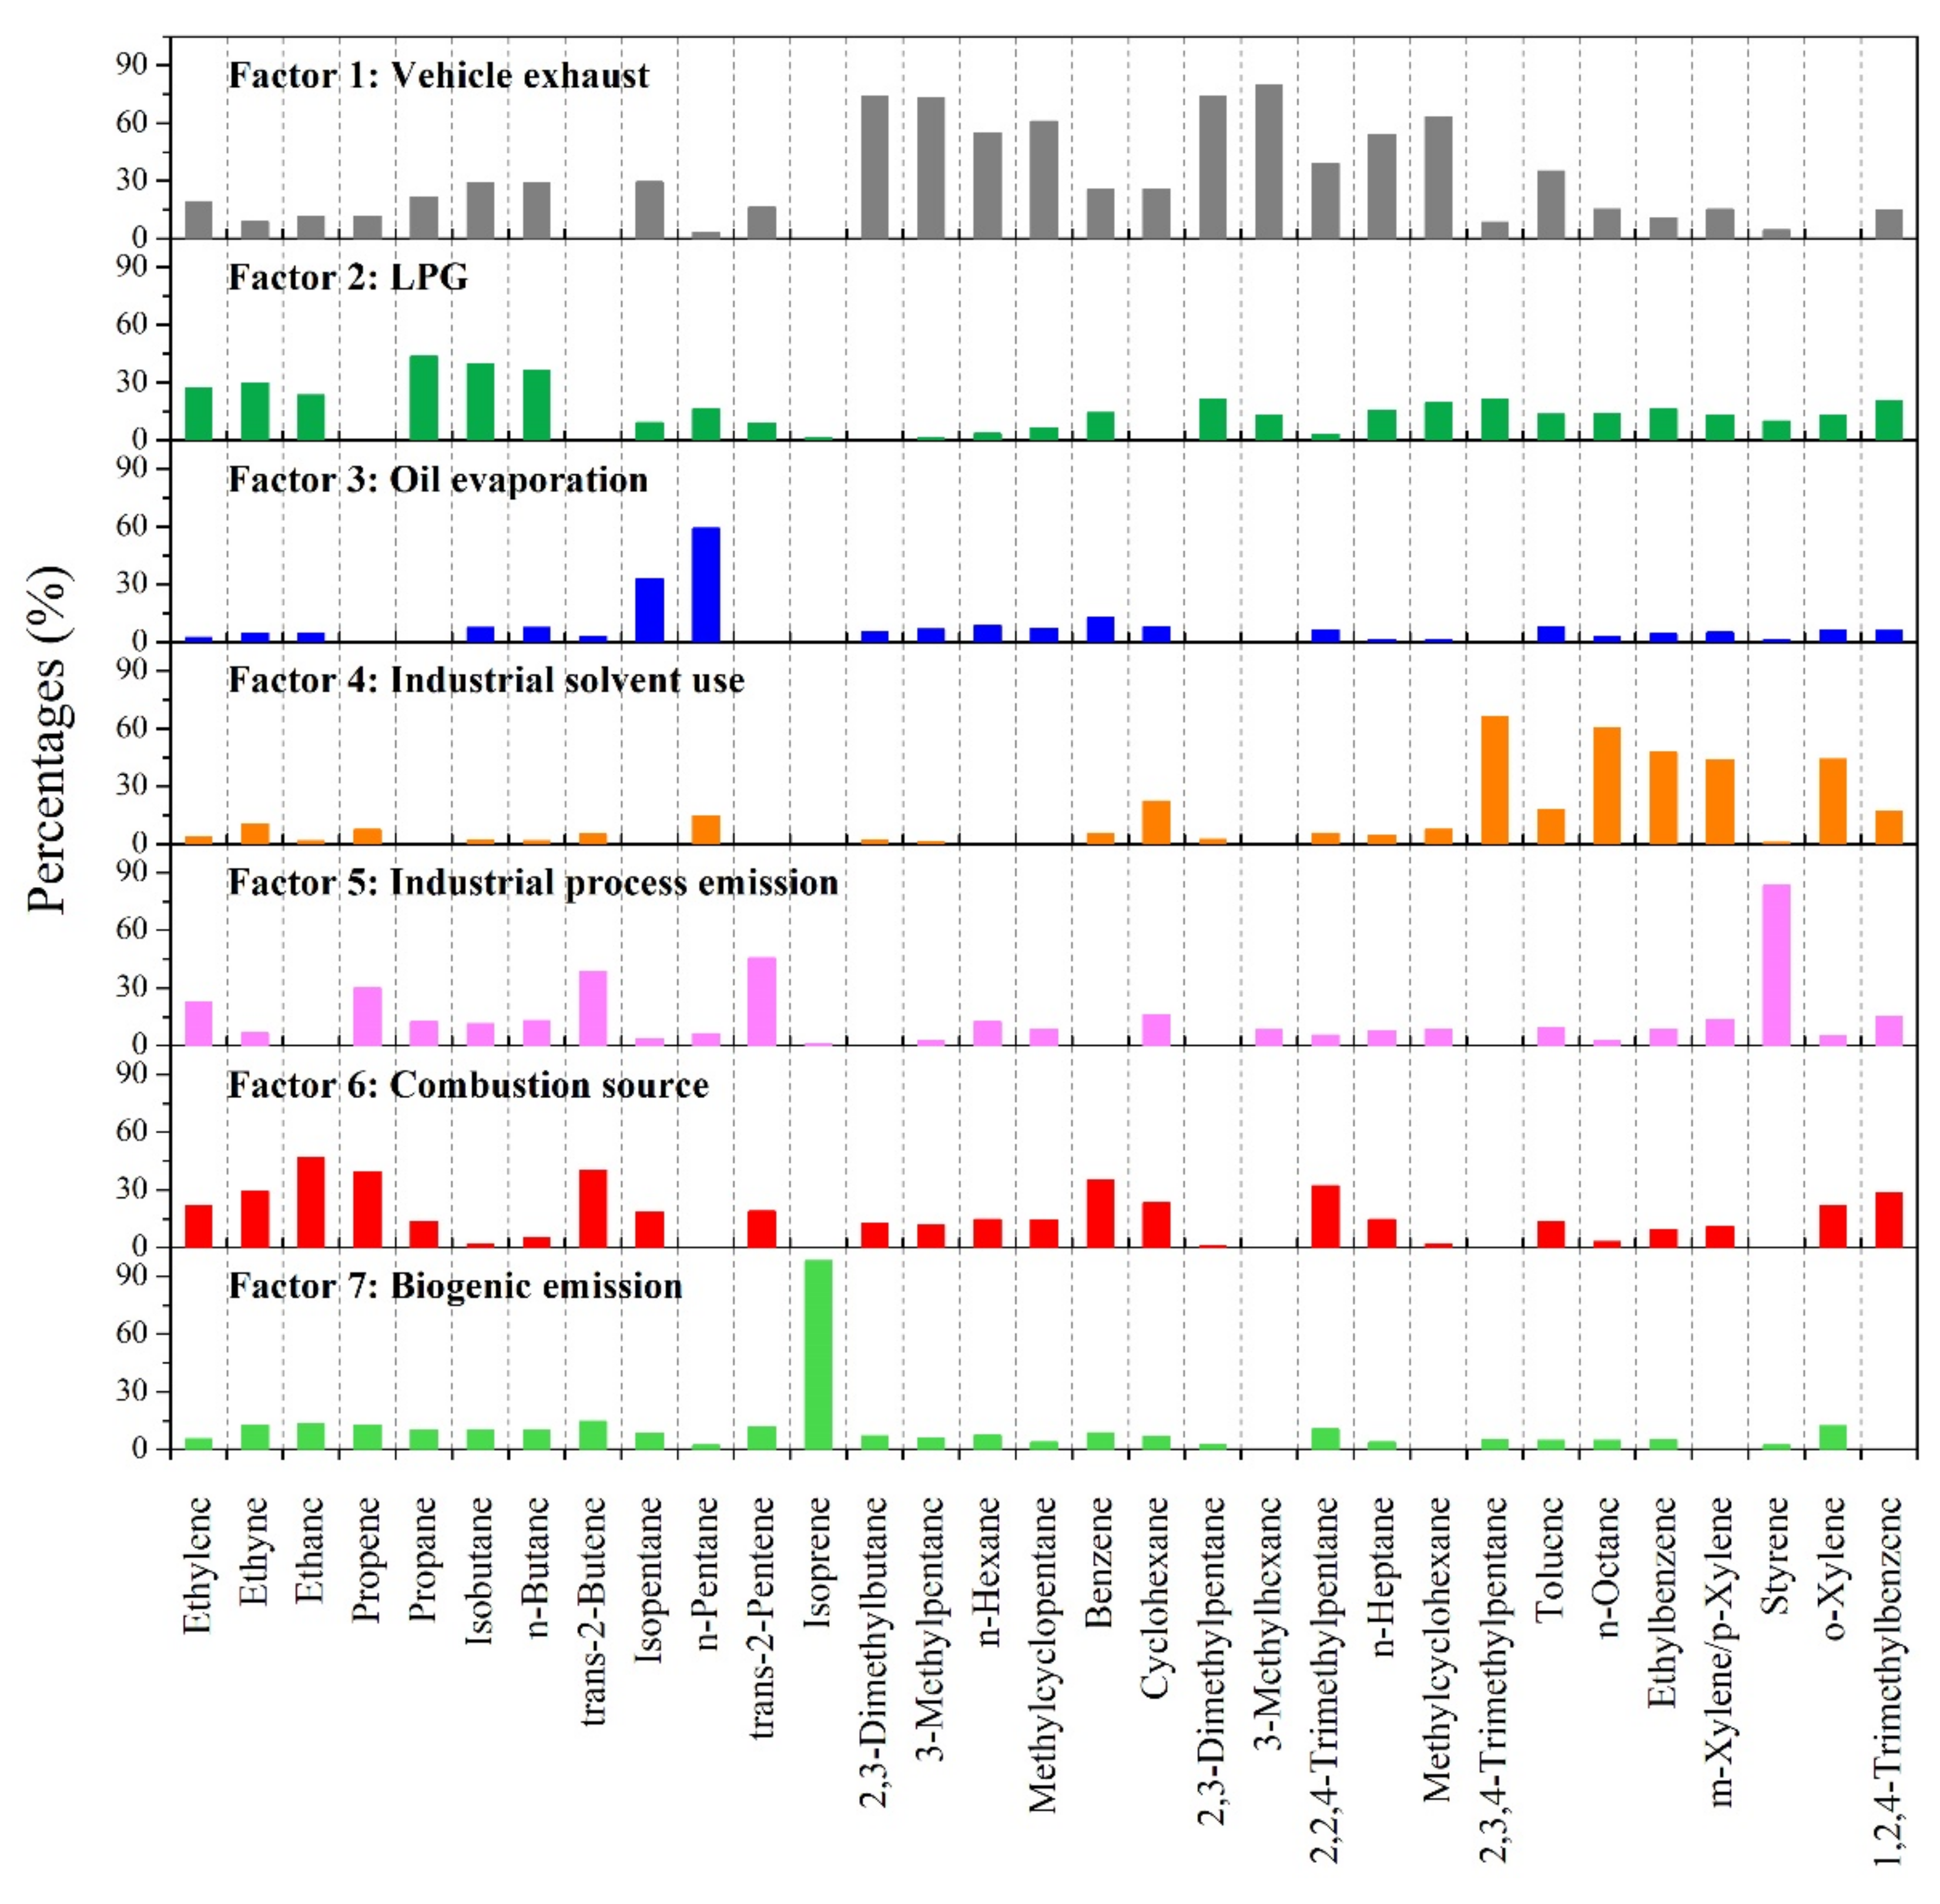
3.5. Source Apportionment with PMF
3.5.1. Source Identification
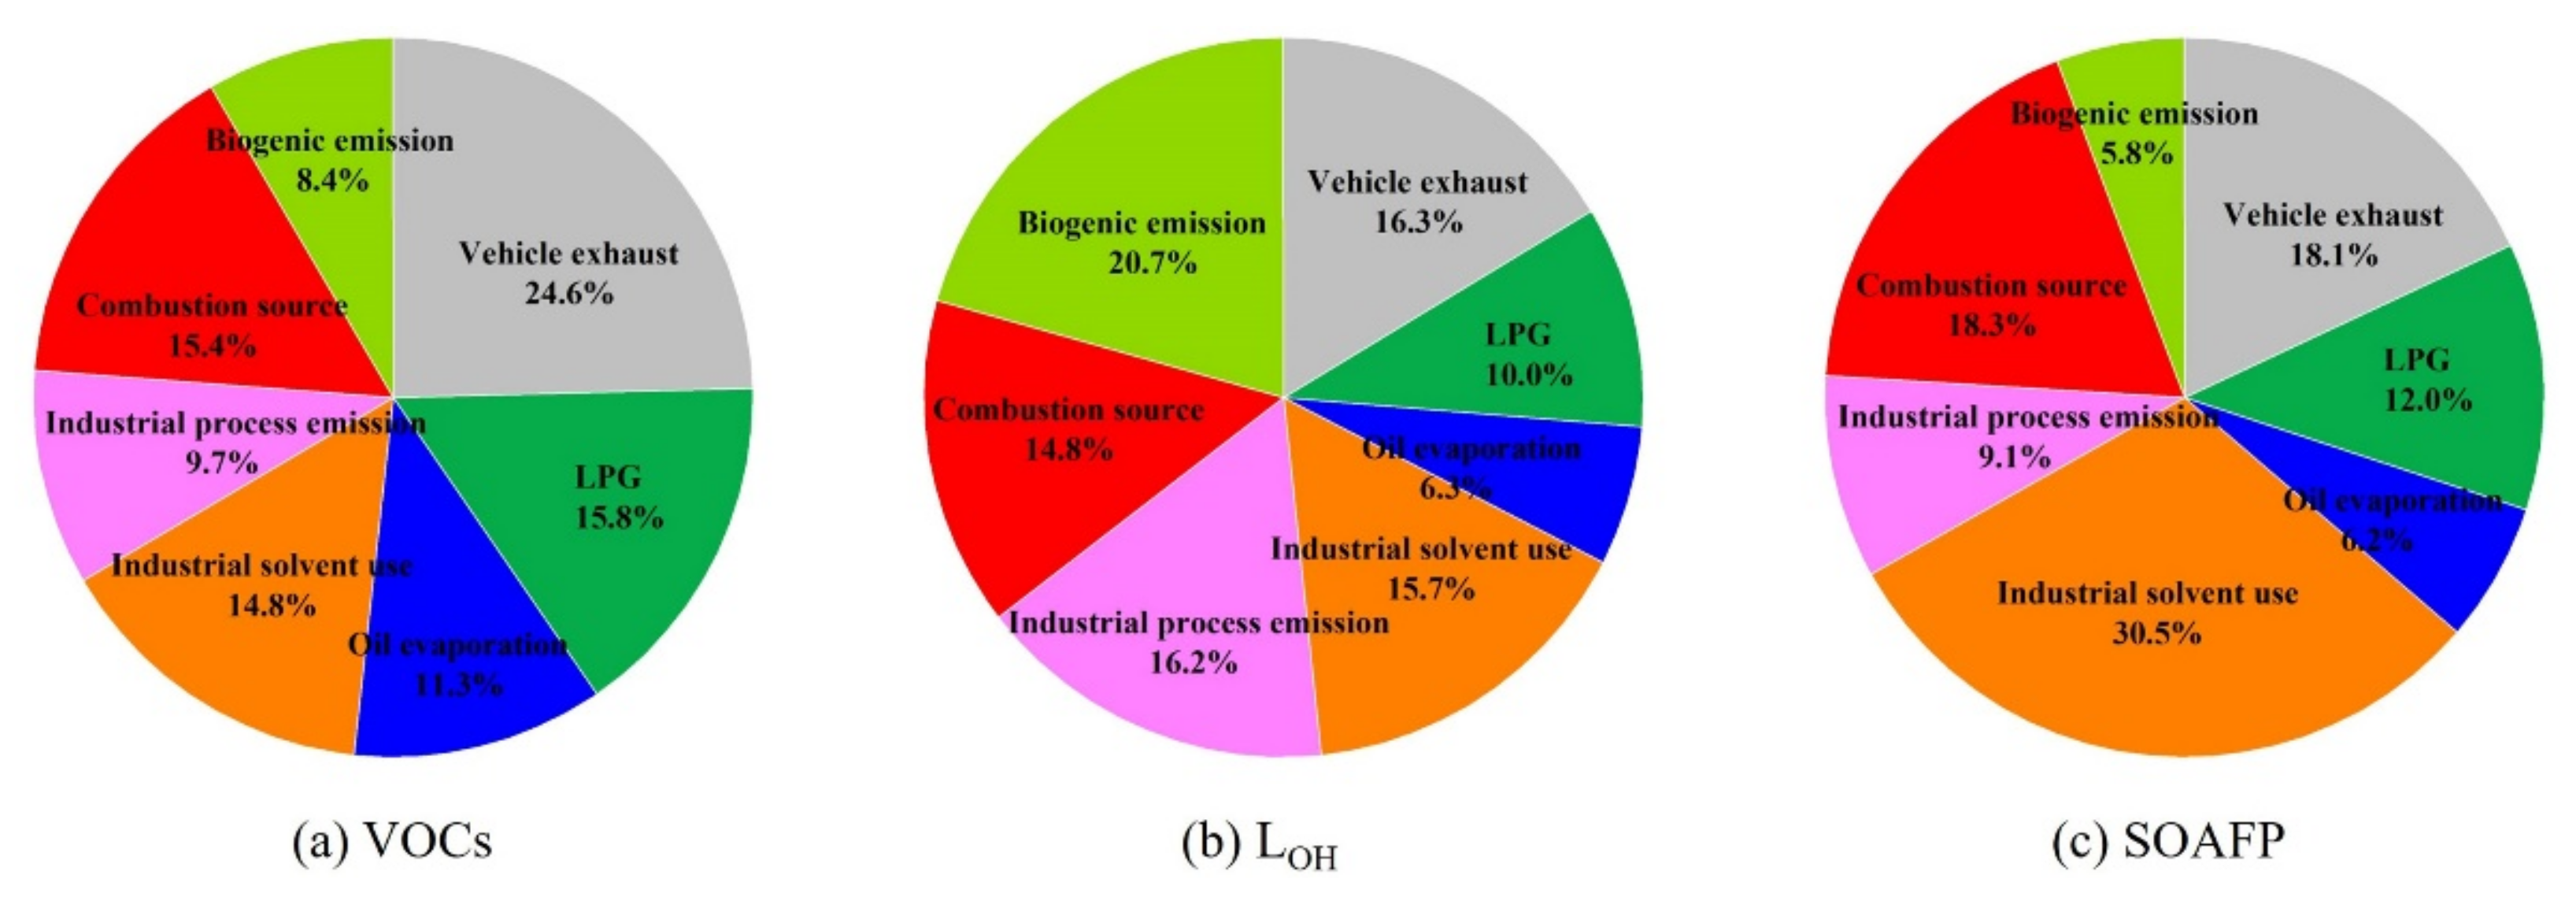
3.5.2. Sources of LOH and SOAFP
3.6. Emission Regions of Different Sources
4. Conclusions
Author Contributions
Funding
Institutional Review Board Statement
Informed Consent Statement
Data Availability Statement
Acknowledgments
Conflicts of Interest
References
- Chameides, W.L.; Fehsenfeld, F.; Rodgers, M.O.; Cardelino, C.; Martinez, J.; Parrish, D.; Lonneman, W.; Lawson, D.R.; Rasmussen, R.A.; Zimmerman, P.; et al. Ozone precursor relationships in the ambient atmosphere. J. Geophys. Res. Atmos. 1992, 97, 6037–6055. [Google Scholar] [CrossRef]
- Forstner, H.J.L.; Flagan, R.C.; Seinfeld, J.H. Secondary organic aerosol from the photooxidation of aromatic hydrocarbons: Molecular composition. Environ. Sci. Technol. 1997, 31, 1345–1358. [Google Scholar] [CrossRef]
- O’Dowd, C.D.; Aalto, P.; Hameri, K.; Kulmala, M.; Hoffmann, T. Aerosol formation—Atmospheric particles from organic vapours. Nature 2002, 416, 497–498. [Google Scholar] [CrossRef] [PubMed]
- Odum, J.R.; Jungkamp, T.P.W.; Griffin, R.J.; Flagan, R.C.; Seinfeld, J.H. The atmospheric aerosol-forming potential of whole gasoline vapor. Science 1997, 276, 96–99. [Google Scholar] [CrossRef] [PubMed] [Green Version]
- Atkinson, R. Atmospheric chemistry of VOCs and NOx. Atmos. Environ. 2000, 34, 2063–2101. [Google Scholar] [CrossRef]
- Sato, K.; Takami, A.; Isozaki, T.; Hikida, T.; Shimono, A.; Imamura, T. Mass spectrometric study of secondary organic aerosol formed from the photo-oxidation of aromatic hydrocarbons. Atmos. Environ. 2010, 44, 1080–1087. [Google Scholar] [CrossRef]
- FinlaysonPitts, B.J.; Pitts, J.N. Tropospheric air pollution: Ozone, airborne toxics, polycyclic aromatic hydrocarbons, and particles. Science 1997, 276, 1045–1052. [Google Scholar] [CrossRef] [Green Version]
- West, J.J.; Fiore, A.M.; Horowitz, L.W.; Mauzerall, D.L. Global health benefits of mitigating ozone pollution with methane emission controls. Proc. Natl. Acad. Sci. USA 2006, 103, 3988–3993. [Google Scholar] [CrossRef] [Green Version]
- Alexis, N.E.; Carlsten, C. Interplay of air pollution and asthma immunopathogenesis: A focused review of diesel exhaust and ozone. Int. Immunopharmacol. 2014, 23, 347–355. [Google Scholar] [CrossRef]
- Bhatia, A.; Tomer, R.; Kumar, V.; Singh, S.D.; Pathak, H. Impact of tropospheric ozone on crop growth and productivity—A review. J. Sci. Ind. Res. 2012, 71, 97–112. [Google Scholar]
- Feng, Z.; Hu, E.; Wang, X.; Jiang, L.; Liu, X. Ground-level O3 pollution and its impacts on food crops in China: A review. Environ. Pollut. 2015, 199, 42–48. [Google Scholar] [CrossRef] [PubMed]
- Monks, P.S.; Archibald, A.T.; Colette, A.; Cooper, O.; Coyle, M.; Derwent, R.; Fowler, D.; Granier, C.; Law, K.S.; Mills, G.E.; et al. Tropospheric ozone and its precursors from the urban to the global scale from air quality to short-lived climate forcer. Atmos. Chem. Phys. 2015, 15, 8889–8973. [Google Scholar] [CrossRef] [Green Version]
- IPCC. Climate Change 2013: The Assessment Reports of the Intergovernmental Panel on Climate Change; Cambridge University Press: Cambridge, UK, 2013; p. 1552. [Google Scholar]
- Cabada, J.C.; Pandis, S.N.; Subramanian, R.; Robinson, A.L.; Polidori, A.; Turpin, B. Estimating the secondary organic aerosol contribution to PM2.5 using the EC tracer method. Aerosol Sci. Technol. 2004, 38, 140–155. [Google Scholar] [CrossRef] [Green Version]
- Lonati, G.; Giugliano, M.; Butelli, P.; Romele, L.; Tardivo, R. Major chemical components of PM2.5 in Milan (Italy). Atmos. Environ. 2005, 39, 1925–1934. [Google Scholar] [CrossRef]
- Guo, S.; Hu, M.; Zamora, M.L.; Peng, J.; Shang, D.; Zheng, J.; Du, Z.; Wu, Z.; Shao, M.; Zeng, L.; et al. Elucidating severe urban haze formation in China. Proc. Natl. Acad. Sci. USA 2014, 111, 17373–17378. [Google Scholar] [CrossRef] [Green Version]
- Huang, R.J.; Zhang, Y.L.; Bozzetti, C.; Ho, K.F.; Cao, J.J.; Han, Y.M.; Daellenbach, K.R.; Slowik, J.G.; Platt, S.M.; Canonaco, F.; et al. High secondary aerosol contribution to particulate pollution during haze events in China. Nature 2014, 514, 218–222. [Google Scholar] [CrossRef] [Green Version]
- Zhang, J.K.; Sun, Y.; Liu, Z.R.; Ji, D.S.; Hu, B.; Liu, Q.; Wang, Y.S. Characterization of submicron aerosols during a month of serious pollution in Beijing, 2013. Atmos. Chem. Phys. 2014, 14, 2887–2903. [Google Scholar] [CrossRef] [Green Version]
- Chang, D.; Song, Y.; Liu, B. Visibility trends in six megacities in China 1973–2007. Atmos. Res. 2009, 94, 161–167. [Google Scholar] [CrossRef]
- Zhang, Q.; He, K.B.; Huo, H. Policy: Cleaning China’s air. Nature 2012, 484, 161–162. [Google Scholar] [CrossRef] [PubMed]
- Ministry of Environmental Protection, Peopele’s Republic of China. The State Council Issues Action Plan on Prevention and Control of Air Pollution Introducing Ten Measures to Improve Air Quality. 2013. Available online: http://www.gov.cn/jrzg/2013-09/12/content_2486918.htm (accessed on 14 September 2021).
- Zheng, B.; Tong, D.; Li, M.; Liu, F.; Hong, C.; Geng, G.; Li, H.; Li, X.; Peng, L.; Qi, J.; et al. Trends in China’s anthropogenic emissions since 2010 as the consequence of clean air actions. Atmos. Chem. Phys. 2018, 18, 14095–14111. [Google Scholar] [CrossRef] [Green Version]
- Bian, Y.; Huang, Z.; Ou, J.; Zhong, Z.; Xu, Y.; Zhang, Z.; Xiao, X.; Ye, X.; Wu, Y.; Yin, X.; et al. Evolution of anthropogenic air pollutant emissions in Guangdong Province, China, from 2006 to 2015. Atmos. Chem. Phys. 2019, 19, 11701–11719. [Google Scholar] [CrossRef] [Green Version]
- Li, M.; Zhang, Q.; Zheng, B.; Tong, D.; Lei, Y.; Liu, F.; Hong, C.; Kang, S.; Yan, L.; Zhang, Y.; et al. Persistent growth of anthropogenic non-methane volatile organic compound (NMVOC) emissions in China during 1990–2017: Drivers, speciation and ozone formation potential. Atmos. Chem. Phys. 2019, 19, 8897–8913. [Google Scholar] [CrossRef] [Green Version]
- Lu, X.; Hong, J.Y.; Zhang, L.; Cooper, O.R.; Schultz, M.G.; Xu, X.B.; Wang, T.; Gao, M.; Zhao, Y.H.; Zhang, Y.H. Severe surface ozone pollution in China: A global perspective. Environ. Sci. Technol. Lett. 2018, 5, 487–494. [Google Scholar] [CrossRef]
- Wang, T.; Xue, L.; Brimblecombe, P.; Lam, Y.F.; Li, L.; Zhang, L. Ozone pollution in China: A review of concentrations, meteorological influences, chemical precursors, and effects. Sci. Total Environ. 2017, 575, 1582–1596. [Google Scholar] [CrossRef]
- Wang, W.N.; Cheng, T.H.; Gu, X.F.; Chen, H.; Guo, H.; Wang, Y.; Bao, F.W.; Shi, S.Y.; Xu, B.R.; Zuo, X.; et al. Assessing spatial and temporal patterns of observed ground-level ozone in China. Sci. Rep. 2017, 7, 3651. [Google Scholar] [CrossRef] [PubMed]
- Sun, L.; Xue, L.; Wang, T.; Gao, J.; Ding, A.; Cooper, O.R.; Lin, M.; Xu, P.; Wang, Z.; Wang, X.; et al. Significant increase of summertime ozone at Mount Tai in Central Eastern China. Atmos. Chem. Phys. 2016, 16, 10637–10650. [Google Scholar] [CrossRef] [Green Version]
- Ma, Z.; Xu, J.; Quan, W.; Zhang, Z.; Lin, W.; Xu, X. Significant increase of surface ozone at a rural site, north of eastern China. Atmos. Chem. Phys. 2016, 16, 3969–3977. [Google Scholar] [CrossRef] [Green Version]
- Ministry of Ecology and Environment of the Peopele’s Republic of China. China Environment Situation Bulletin 2013 and 2015. Available online: http://www.mee.gov.cn/hjzl/sthjzk/zghjzkgb/ (accessed on 14 September 2021).
- Department of Ecology and Environment of Guangdong Province. 2020 Report on the State of Guangdong Provincial Ecology and Environment. 2021. Available online: http://gdee.gd.gov.cn/gkmlpt/content/3/3266/post_3266052.html#3185 (accessed on 14 September 2021).
- Shao, M.; Lu, S.H.; Liu, Y.; Xie, X.; Chang, C.C.; Huang, S.; Chen, Z.M. Volatile organic compounds measured in summer in Beijing and their role in ground-level ozone formation. J. Geophys. Res. Atmos. 2009, 114, 13. [Google Scholar] [CrossRef]
- Cheng, H.; Guo, H.; Wang, X.; Saunders, S.M.; Lam, S.H.M.; Jiang, F.; Wang, T.; Ding, A.; Lee, S.; Ho, K.F. On the relationship between ozone and its precursors in the Pearl River Delta: Application of an observation-based model (OBM). Environ. Sci. Pollut. Res. 2010, 17, 547–560. [Google Scholar] [CrossRef]
- Xue, L.; Wang, T.; Louie, P.K.K.; Luk, C.W.Y.; Blake, D.R.; Xu, Z. Increasing external effects negate local efforts to control ozone air pollution: A case study of Hong Kong and implications for other Chinese cities. Environ. Sci. Technol. 2014, 48, 10769–10775. [Google Scholar] [CrossRef] [PubMed] [Green Version]
- Xue, L.K.; Wang, T.; Gao, J.; Ding, A.J.; Zhou, X.H.; Blake, D.R.; Wang, X.F.; Saunders, S.M.; Fan, S.J.; Zuo, H.C.; et al. Ground-level ozone in four Chinese cities: Precursors, regional transport and heterogeneous processes. Atmos. Chem. Phys. 2014, 14, 13175–13188. [Google Scholar] [CrossRef] [Green Version]
- Zhang, Q.; Streets, D.G.; Carmichael, G.R.; He, K.B.; Huo, H.; Kannari, A.; Klimont, Z.; Park, I.S.; Reddy, S.; Fu, J.S.; et al. Asian emissions in 2006 for the NASA INTEX-B mission. Atmos. Chem. Phys. 2009, 9, 5131–5153. [Google Scholar] [CrossRef] [Green Version]
- Li, M.; Zhang, Q.; Streets, D.G.; He, K.B.; Cheng, Y.F.; Emmons, L.K.; Huo, H.; Kang, S.C.; Lu, Z.; Shao, M.; et al. Mapping Asian anthropogenic emissions of non-methane volatile organic compounds to multiple chemical mechanisms. Atmos. Chem. Phys. 2014, 14, 5617–5638. [Google Scholar] [CrossRef] [Green Version]
- Atkinson, R.; Arey, J. Atmospheric degradation of volatile organic compounds. Chem Rev. 2003, 103, 4605–4638. [Google Scholar] [CrossRef]
- Claeys, M.; Graham, B.; Vas, G.; Wang, W.; Vermeylen, R.; Pashynska, V.; Cafmeyer, J.; Guyon, P.; Andreae, M.O.; Artaxo, P.; et al. Formation of secondary organic aerosols through photooxidation of isoprene. Science 2004, 303, 1173–1176. [Google Scholar] [CrossRef] [PubMed] [Green Version]
- Zhang, Y.L.; Wang, X.M.; Blake, D.R.; Li, L.F.; Zhang, Z.; Wang, S.Y.; Guo, H.; Lee, F.S.C.; Gao, B.; Chan, L.Y.; et al. Aromatic hydrocarbons as ozone precursors before and after outbreak of the 2008 financial crisis in the Pearl River Delta region, south China. J. Geophys. Res. Atmos. 2012, 117, 16. [Google Scholar] [CrossRef] [Green Version]
- Zhang, Y.L.; Wang, X.M.; Barletta, B.; Simpson, I.J.; Blake, D.R.; Fu, X.; Zhang, Z.; He, Q.; Liu, T.; Zhao, X.; et al. Source attributions of hazardous aromatic hydrocarbons in urban, suburban and rural areas in the Pearl River Delta (PRD) region. J. Hazard. Mater. 2013, 250–251, 403–411. [Google Scholar] [CrossRef] [Green Version]
- Zhang, Y.L.; Wang, X.M.; Zhang, Z.; Lü, S.; Huang, Z.; Li, L. Sources of C2–C4 alkenes, the most important ozone nonmethane hydrocarbon precursors in the Pearl River Delta region. Sci. Total Environ. 2015, 502, 236–245. [Google Scholar] [CrossRef] [PubMed]
- Chen, H.W.; Li, G.K.; Li, H.; Zhang, Z.X. Characteristics of volatile organic compounds in Guangzhou. Environ Chem. 2003, 22, 89–92, (In Chinese with English Abstract). [Google Scholar]
- Zhou, Y.; Yue, D.L.; Zhang, T. Source apportionment of spring ambient volatile Organic compounds in Guangzhou. Environ. Monit. Forew. 2017, 9, 42–47, (In Chinese with English Abstract). [Google Scholar]
- Wu, F.K.; Yu, Y.; Sun, J.; Zhang, J.; Wang, J.; Tang, G.; Wang, Y. Characteristics, source apportionment and reactivity of ambient volatile organic compounds at Dinghu Mountain in Guangdong Province, China. Sci. Total Environ. 2016, 548, 347–359. [Google Scholar] [CrossRef]
- Zhang, Z.; Zhang, Y.L.; Wang, X.M.; Lu, S.J.; Huang, Z.H.; Huang, X.Y.; Yang, W.Q.; Wang, Y.S.; Zhang, Q. Spatiotemporal patterns and source implications of aromatic hydrocarbons at six rural sites across China’s developed coastal regions. J. Geophys. Res. Atmos. 2016, 121, 6669–6687. [Google Scholar] [CrossRef]
- Amiet, F.; Robert, M.; Martin, N.A. Gas Chromatography: MCERTS certification for ambient air analysis on benzene and VOCs. Int. Environ. Technol. 2013, 23, 46–47. [Google Scholar]
- Wang, H.L.; Chen, C.H.; Wang, Q.; Huang, C.; Su, L.Y.; Huang, H.Y.; Lou, S.R.; Zhou, M.; Li, L.; Qiao, L.P.; et al. Chemical loss of volatile organic compounds and its impact on the source analysis through a two-year continuous measurement. Atmos. Environ. 2013, 80, 488–498. [Google Scholar] [CrossRef]
- Carter, W.P.L. Update Maximum Incremental Reactivity Scale and Hydrocarbon Bin Reactivities for Regulatory Application. Calif. Air Resour Board Contact 07-339. 2009. Available online: https://ww2.arb.ca.gov/sites/default/files/barcu/regact/2009/mir2009/mir10.pdf (accessed on 15 December 2021).
- Chen, W.T.; Shao, M.; Yuan, B.; Wang, M.; Lu, S.H. Parameterization of contribution to secondary organic aerosol (SOA) formation from ambient volatile organic compounds (VOCs). Acta Sci. Circumst. 2013, 33, 163–172, (In Chinese with English Abstract). [Google Scholar]
- Grosjean, D.; Seinfeld, J.H. Parameterization of the formation potential of secondary organic aerosols. Atmos. Environ. 1989, 23, 1733–1747. [Google Scholar] [CrossRef]
- Grosjean, D. In situ organic aerosol formation during a smog episode: Estimated production and chemical functionality. Atmos. Environ. 1992, 26, 953–963. [Google Scholar] [CrossRef]
- Paatero, P. Least squares formulation of robust non-negative factor analysis. Chemom. Intell. Lab. Syst. 1997, 37, 23–35. [Google Scholar] [CrossRef]
- Paatero, P.; Tapper, U. Positive matrix factorization: A non-negative factor model with optimal utilization of error estimates of data values. Environmetrics 1994, 5, 111–126. [Google Scholar] [CrossRef]
- Yuan, B.; Shao, M.; de Gouw, J.; Parrish, D.D.; Lu, S.; Wang, M.; Zeng, L.; Zhang, Q.; Song, Y.; Zhang, J.; et al. Volatile organic compounds (VOCs) in urban air: How chemistry affects the interpretation of positive matrix factorization (PMF) analysis. J. Geophys. Res. Atmos. 2012, 117, D24302. [Google Scholar] [CrossRef]
- Hui, L.; Liu, X.; Tan, Q.; Feng, M.; An, J.; Qu, Y.; Zhang, Y.; Cheng, N. VOC characteristics, sources and contributions to SOA formation during haze events in Wuhan, Central China. Sci. Total Environ. 2019, 650, 2624–2639. [Google Scholar] [CrossRef] [PubMed]
- Abeleira, A.; Pollack, I.B.; Sive, B.; Zhou, Y.; Fischer, E.V.; Farmer, D.K. Source characterization of volatile organic compounds in the Colorado Northern Front Range Metropolitan Area during spring and summer 2015. J. Geophys. Res. Atmos. 2017, 122, 3595–3613. [Google Scholar] [CrossRef]
- Yang, W.Q.; Zhang, Y.L.; Wang, X.M.; Li, S.; Zhu, M.; Yu, Q.Q.; Li, G.H.; Huang, Z.H.; Zhang, H.N.; Wu, Z.F.; et al. Volatile organic compounds at a rural site in Beijing: Influence of temporary emission control and wintertime heating. Atmos. Chem. Phys. 2018, 18, 12663–12682. [Google Scholar] [CrossRef] [Green Version]
- Luo, R.X.; Liu, B.S.; Liang, D.N.; Bi, X.H.; Zhang, Y.F.; Feng, Y.C. Characteristics of ozone and source apportionment of the precursor VOCs in Tianjin suburbs in summer. Environ. Sci. 2021, 42, 75–87, (In Chinese with English Abstract). [Google Scholar]
- Cai, C.; Geng, F.; Tie, X.; Yu, Q.; An, J. Characteristics and source apportionment of VOCs measured in Shanghai, China. Atmos. Environ. 2010, 44, 5005–5014. [Google Scholar] [CrossRef]
- Zhang, X.; Yin, Y.; Wen, J.; Huang, S.; Han, D.; Chen, X.; Cheng, J. Characteristics, reactivity and source apportionment of ambient volatile organic compounds (VOCs) in a typical tourist city. Atmos. Environ. 2019, 215, 116898. [Google Scholar] [CrossRef]
- Baudic, A.; Gros, V.; Sauvage, S.; Locoge, N.; Sanchez, O.; Sarda-Estève, R.; Kalogridis, C.; Petit, J.E.; Bonnaire, N.; Baisnée, D. Seasonal variability and source apportionment of volatile organic compounds (VOCs) in the Paris megacity (France). Atmos. Chem. Phys. 2017, 16, 11961–11989. [Google Scholar] [CrossRef] [Green Version]
- Garzón, J.P.; Huertas, J.I.; Magaña, M.; Huertas, M.E.; Cárdenas, B.; Watanabe, T.; Maeda, T.; Wakamatsu, S.; Blanco, S. Volatile organic compounds in the atmosphere of Mexico City. Atmos. Environ. 2015, 119, 415–429. [Google Scholar] [CrossRef] [Green Version]
- Zou, Y.; Deng, X.J.; Zhu, D.; Gong, D.C.; Wang, H.; Li, F.; Tan, H.B.; Deng, T.; Mai, B.R.; Liu, X.T.; et al. Characteristics of 1 year of observational data of VOCs, NOx and O3 at a suburban site in Guangzhou, China. Atmos. Chem. Phys. 2015, 15, 6625–6636. [Google Scholar] [CrossRef] [Green Version]
- Liu, Q.; Lu, X.L.; Zeng, P.; Yu, S. Characteristics and source apportionment of ambient VOCs in spring in Liuzhou. Environ. Sci. 2021, 42, 65–74, (In Chinese with English Abstract). [Google Scholar]
- Zhang, T.; Zhou, Y.; Yue, D.L.; Chen, D.H.; Ou, Y.B.; Wang, X.M. Seasonal variation characteristics of concentration and chemical reactivity of VOCs in typical areas of the Pearl River Delta. Environ. Pollut. Control 2021, 43, 1–7, (In Chinese with English Abstract). [Google Scholar]
- Song, M.D.; Tan, Q.W.; Feng, M.; Qu, Y.; Liu, X.G.; An, J.L.; Zhang, Y.H. Source apportionment and secondary transformation of atmospheric nonmethane hydrocarbons in Chengdu, Southwest China. J. Geophys. Res. Atmos. 2018, 123, 9741–9763. [Google Scholar] [CrossRef]
- Feng, J.; Zhang, Y.; Song, W.; Deng, W.; Zhu, M.; Fang, Z.; Ye, Y.; Fang, H.; Wu, Z.; Lowther, S.; et al. Emissions of nitrogen oxides and volatile organic compounds from liquefied petroleum gas-fueled taxis under idle and cruising modes. Environ. Pollut. 2020, 267, 115623. [Google Scholar] [CrossRef]
- Zhang, Y.L.; Wang, X.M.; Zhang, Z.; Lu, S.; Shao, M.; Lee, F.S.C.; Yu, J. Species profiles and normalized reactivity of volatile organic compounds from gasoline evaporation in China. Atmos. Environ. 2013, 79, 110–118. [Google Scholar] [CrossRef]
- Fang, Z.; Deng, W.; Zhang, Y.L.; Ding, X.; Tang, M.J.; Liu, T.Y.; Hu, Q.H.; Zhu, M.; Wang, Z.Y.; Yang, W.Q.; et al. Open burning of rice, corn and wheat straws: Primary emissions, photochemical aging, and secondary organic aerosol formation. Atmos. Chem. Phys. 2017, 17, 14821–14839. [Google Scholar] [CrossRef] [Green Version]
- Tang, X.Y.; Zhang, Y.H.; Shao, M. Atmospheric Environmental Chemistry, 2nd ed.; Higher Education Press: Beijing, China, 2006; pp. 75–721. [Google Scholar]
- Wang, H.L.; Chen, C.H.; Huang, C.; Li, L.; Cheng, Z.; Chen, M.H.; Zheng, X.H. Characterization of volatile organic compounds (VOCs) around the Chinese Spring Festival and International Labour Day in the urban area of Shanghai, China. Acta Sci. Circumst. 2010, 30, 1749–1757, (In Chinese with English Abstract). [Google Scholar]
- Liu, Y.; Shao, M.; Fu, L.L.; Lu, S.H.; Zeng, L.M.; Tang, D.G. Source profiles of volatile organic compounds (VOCs) measured in China: Part I. Atmos. Environ. 2008, 42, 6247–6260. [Google Scholar] [CrossRef]
- Zhang, Z.; Wang, X.M.; Zhang, Y.L.; Lü, S.; Huang, Z.; Huang, X.; Wang, Y. Ambient air benzene at background sites in China’s most developed coastal regions: Exposure levels, source implications and health risks. Sci. Total Environ. 2015, 511, 792–800. [Google Scholar] [CrossRef]
- Liu, C.T.; Zhang, C.L.; Mu, Y.J.; Liu, J.; Zhang, Y. Emission of volatile organic compounds from domestic coal stove with the actual alternation of flaming and smoldering combustion processes. Environ. Pollut. 2017, 221, 385–391. [Google Scholar] [CrossRef] [PubMed]
- Zhang, Y.L.; Yang, W.Q.; Simpson, I.; Huang, X.Y.; Yu, J.Z.; Huang, Z.H.; Wang, Z.Y.; Zhang, Z.; Liu, D.; Huang, Z.Z.; et al. Decadal changes in emissions of volatile organic compounds (VOCs) from on-road vehicles with intensified automobile pollution control: Case study in a busy urban tunnel in south China. Environ. Pollut. 2018, 233, 806–819. [Google Scholar] [CrossRef] [PubMed] [Green Version]
- Araizaga, A.E.; Mancilla, Y.; Mendoza, A. Volatile organic compound emissions from Light-Duty Vehicles in Monterrey, Mexico: A Tunnel Study. Int. J. Environ. Res. 2013, 7, 277–292. [Google Scholar]
- Barletta, B.; Meinardi, S.; Simpson, I.J.; Zou, S.; Sherwood Rowland, F.; Blake, D.R. Ambient mixing ratios of nonmethane hydrocarbons (NMHCs) in two major urban centers of the Pearl River Delta (PRD) region: Guangzhou and Dongguan. Atmos. Environ. 2008, 42, 4393–4408. [Google Scholar] [CrossRef] [Green Version]
- Chan, L.Y.; Chu, K.W.; Zou, S.C.; Chan, C.Y.; Wang, X.M.; Barletta, B.; Blake, D.R.; Guo, H.; Tsai, W.Y. Characteristics of nonmethane hydrocarbons (NMHCs) in industrial, industrial-urban, and industrial-suburban atmospheres of the Pearl River Delta (PRD) region of south China. J. Geophys. Res. Atmos. 2006, 111, D11304. [Google Scholar] [CrossRef] [Green Version]
- McDonald, B.C.; de Gouw, J.A.; Gilman, J.B.; Jathar, S.H.; Akherati, A.; Cappa, C.D.; Jimenez, J.L.; Lee-Taylor, J.; Hayes, P.L.; McKeen, S.A.; et al. Volatile chemical products emerging as largest petrochemical source of urban organic emissions. Science 2018, 359, 760–764. [Google Scholar] [CrossRef] [Green Version]
- Tsai, J.H.; Lin, K.H.; Chen, C.Y.; Lai, N.; Ma, S.Y.; Chiang, H.L. Volatile organic compound constituents from an integrated iron and steel facility. J. Hazard. Mater. 2008, 157, 569–578. [Google Scholar] [CrossRef]
- Zhang, Y.; Zhang, R.; Yu, J.; Zhang, Z.; Yang, W.; Zhang, H.; Lyu, S.; Wang, Y.; Dai, W.; Wang, Y.; et al. Isoprene mixing ratios measured at twenty sites in China during 2012–2014: Comparison with model simulation. J. Geophys. Res. Atmos. 2020, 125, e2020JD033523. [Google Scholar] [CrossRef]
- Borbon, A.; Gilman, J.B.; Kuster, W.C.; Grand, N.; Chevaillier, S.; Colomb, A.; Dolgorouky, C.; Gros, V.; Lopez, M.; Sarda-Esteve, R.; et al. Emission ratios of anthropogenic volatile organic compounds in northern mid-latitude megacities: Observations versus emission inventories in Los Angeles and Paris. J. Geophys. Res. Atmos. 2013, 118, 2041–2057. [Google Scholar] [CrossRef]
- Zheng, H.; Kong, S.; Chen, N.; Niu, Z.; Zhang, Y.; Jiang, S.; Yan, Y.; Qi, S. Source apportionment of volatile organic compounds: Implications to reactivity, ozone formation, and secondary organic aerosol potential. Atmos. Res. 2021, 249, 105344. [Google Scholar] [CrossRef]
- Gilman, J.B.; Kuster, W.C.; Goldan, P.D.; Herndon, S.C.; Zahniser, M.S.; Tucker, S.C.; Brewer, W.A.; Lerner, B.M.; Williams, E.J.; Harley, R.A.; et al. Measurements of volatile organic compounds during the 2006 TexAQS/GoMACCS campaign: Industrial influences, regional characteristics, and diurnal dependencies of the OH reactivity. J. Geophys. Res. Atmos. 2009, 114, D00F06. [Google Scholar] [CrossRef] [Green Version]
- Mo, Z.W.; Shao, M.; Lu, S.H.; Niu, H.; Zhou, M.Y.; Sun, J. Characterization of non-methane hydrocarbons and their sources in an industrialized coastal city, Yangtze River Delta, China. Sci. Total Environ. 2017, 593, 641–653. [Google Scholar] [CrossRef] [PubMed]
- Wu, R.; Xie, S. Spatial Distribution of Ozone Formation in China Derived from Emissions of Speciated Volatile Organic Compounds. Environ. Sci. Technol. 2017, 51, 2574–2583. [Google Scholar] [CrossRef] [PubMed]
- Zhao, Y.L.; Nguyen, N.T.; Presto, A.A.; Hennigan, C.J.; May, A.A.; Robinson, A.L. Intermediate Volatility Organic Compound Emissions from On-Road Diesel Vehicles: Chemical Composition, Emission Factors, and Estimated Secondary Organic Aerosol Production. Environ. Sci. Technol. 2015, 49, 11516–11526. [Google Scholar] [CrossRef] [PubMed]
- Deng, W.; Hu, Q.H.; Liu, T.Y.; Wang, X.M.; Zhang, Y.L.; Song, W.; Sun, Y.; Bi, X.H.; Yu, J.Z.; Yang, W.Q.; et al. Primary particulate emissions and secondary organic aerosol (SOA) formation from idling diesel vehicle exhaust in China. Sci. Total Environ. 2017, 593–594, 462–469. [Google Scholar] [CrossRef] [PubMed]


| Cities | Periods | VOCs (ppbv) | Percentages (%) | References | ||||
|---|---|---|---|---|---|---|---|---|
| C2–C5 Alkanes | ≥C6 Alkanes | Alkenes | Aromatics | Alkyne | ||||
| Beijing | October–November 2014 | 23.41 | 45.5% | 8.5% | 12.0% | 21.0% | 13.0% | [58] |
| Tianjin | June–August 2018 | 14.10 | 49.6% | 0.0% | 31.2% | 10.6% | 8.5% | [59] |
| Shanghai | January 2007–March 2010 | 25.59 | 35.1% | 19.4% | 7.6% | 38.0% | 0.0% | [60] |
| Wuhan | January 2016 | 32.07 | 58.7% | - | 18.4% | 15.2% | 7.6% | [56] |
| Liuzhou | March 2019 | 22.83 | 49.3% | 6.0% | 19.4% | 11.2% | 14.1% | [65] |
| Chengdu | October 2016–September 2017 | 41.70 | 56.6% | - | 19.7% | 17.3% | 6.5% | 67 |
| Guilin | May–November 2018 | 21.79 | 18.2% | 2.6% | 4.4% | 71.4% | 3.4% | 61 |
| Jiangmen | July–August 2016 | 8.47 | 34.6% | 8.3% | 17.1% | 35.1% | 5.0% | [66] |
| Guangzhou | June 2011–May 2012 | 44.54 | 38.1% | 20.7% | 16.5% | 24.8% | 0.0% | [64] |
| Guangzhou | April 2013 | 41.30 | 38.1% | 22.4% | 9.4% | 24.0% | 6.1% | [44] |
| Paris, French | January–February 2010 | 67.84 | 49.4% | 2.6% | 5.4% | 41.6% | 1.1% | [62] |
| Mexico City, Mexico | November–December 2011 | 88.20 | 46.7% | 12.0% | 10.3% | 25.4% | 5.6% | [63] |
| Colorado, USA | March–May 2015 | 32.10 | 93.8% | 3.7% | 0.2% | 1.7% | 0.6% | [57] |
| Colorado, USA | July–September 2015 | 46.49 | 94.0% | 3.1% | 1.2% | 1.3% | 0.4% | [57] |
| Guangzhou | August–September 2020 | 31.80 | 48.2% | 14.5% | 9.5% | 23.1% | 4.7% | |
Publisher’s Note: MDPI stays neutral with regard to jurisdictional claims in published maps and institutional affiliations. |
© 2021 by the authors. Licensee MDPI, Basel, Switzerland. This article is an open access article distributed under the terms and conditions of the Creative Commons Attribution (CC BY) license (https://creativecommons.org/licenses/by/4.0/).
Share and Cite
Yang, W.; Yu, Q.; Pei, C.; Liao, C.; Liu, J.; Zhang, J.; Zhang, Y.; Qiu, X.; Zhang, T.; Zhang, Y.; et al. Characteristics of Volatile Organic Compounds in the Pearl River Delta Region, China: Chemical Reactivity, Source, and Emission Regions. Atmosphere 2022, 13, 9. https://doi.org/10.3390/atmos13010009
Yang W, Yu Q, Pei C, Liao C, Liu J, Zhang J, Zhang Y, Qiu X, Zhang T, Zhang Y, et al. Characteristics of Volatile Organic Compounds in the Pearl River Delta Region, China: Chemical Reactivity, Source, and Emission Regions. Atmosphere. 2022; 13(1):9. https://doi.org/10.3390/atmos13010009
Chicago/Turabian StyleYang, Weiqiang, Qingqing Yu, Chenglei Pei, Chenghao Liao, Jianjun Liu, Jinpu Zhang, Yanli Zhang, Xiaonuan Qiu, Tao Zhang, Yongbo Zhang, and et al. 2022. "Characteristics of Volatile Organic Compounds in the Pearl River Delta Region, China: Chemical Reactivity, Source, and Emission Regions" Atmosphere 13, no. 1: 9. https://doi.org/10.3390/atmos13010009