Article

Evaluating the Physicochemical Properties of Some Kosovo’s and Imported Honey Samples

1
Faculty of Agribusiness, University of Peja “Haxhi Zeka”, Street, UҪK, 30000 Pejë, Kosovo
2
Faculty of Agriculture and Food Science, University of Sarajevo, Zmaja od Bosne 8, 71000 Sarajevo, Bosnia and Herzegovina
3
Kosovo Institute of Agriculture, Street, Adem Jashari 144, 30000 Pejë, Kosovo
4
Faculty of Food Sciences and Biotechnology, UBT College, Lagjja Kalabria, 10000 Prishtinë, Kosovo
5
Department of Biology, Faculty of Mathematics and Natural Sciences, University of Prishtina, Mother Teresa 5, 10000 Prishtinë, Kosovo
*
Author to whom correspondence should be addressed.
Appl. Sci. 2022, 12(2), 629; https://doi.org/10.3390/app12020629
Submission received: 20 November 2021 / Revised: 31 December 2021 / Accepted: 4 January 2022 / Published: 10 January 2022
(This article belongs to the Special Issue Chemical Composition, Properties and Applications of Honey)

Abstract

:
This study evaluated the physicochemical properties (moisture, pH, electrical conductivity, free acidity, hydroxymethylfurfural (HMF), proteins, insoluble solids, and ash) of 45 Kosovo’s and imported honey samples, using methods provided by national and international standards. The moisture values of all honey samples analyzed were below 20%. The free acidity was above 50.0 meq kg−1 in 14 out of 33 samples (42%) collected in Kosovo, while 2 out of 12 imported honey samples (16.7%) showed higher values than 50 meq kg−1. In this study, 7 out of 33 honey samples (21%) from Kosovo and one out of 12 honey samples from imports had soluble solids content below 80 °Brix. In terms of HMF, 5 out of 33 Kosovo honey samples (15%) and 4 out of 12 imported honey samples (33%) exceeded 40 mg/kg, which is the maximum content of HMF set in standards. The values of some physicochemical parameters (free acidity, HMF, and soluble solids) of local and imported honey samples are not within the quality limits set in legislation. Further studies are needed to evaluate the properties of fresh honey produced in Kosovo and the stability of honey during prolonged storage.

1. Introduction

Honey produced by bees is a very concentrated natural sugar solution, which consists of a complex mixture of carbohydrates and is consumed as a food with high nutritional value [1]. It is produced worldwide and is known as the only product in the form of concentrated sugar with a low content of enzymes (glucose oxidase, catalase, phosphatase), glucose and sucrose (65—the total amount of soluble matter), proteins, amino acids, organic acids, vitamins, lipids, volatile chemicals, flavonoids, phenolic acids, and various minerals [2,3,4]. The biochemical characteristics of honey and its quality depend on the climatic conditions, mode of production, maturity, storage conditions, and source of honey nectar [5,6,7,8]. The identity and quality requirements of honey are regulated by the Codex Alimentarius standard [9] and the EU Honey Directive [10], which are indicated in Table 1.
Different researchers have investigated the physicochemical properties of honey from many countries worldwide [11,12,13,14]. The moisture content is important as it influences many other parameters in honey, such as the sugar content, hydroxymethylfurfural (HMF), viscosity, crystallization, as well as sensory and microbial properties. Codex Standard for Honey of 2001 [9] stipulates that the moisture content in honey should not exceed 20 g 100 g−1. Authors have also mentioned that honey, being hygroscopic, can absorb moisture, thus the moisture in honey can increase depending on the processing operations, as well as due to inadequate storage conditions [11,12].
The natural acidity and low pH level of honey are also important parameters since they contribute to inhibition of microbiological growth, but on the other hand, these two parameters could also be related to adulteration and deterioration of honey. The Codex Alimetarius [9] permits a maximum value of 50.0 meq kg−1 free acidity and higher values may indicate possible fermentation of sugars into acids.
The soluble solid content is a parameter that shows the presence of most sugars in honey. The honey product is considered qualitative when values are above 80 °Brix [15].
Electrical conductivity and ash are used as indicators of honey quality and depend on the mineral content of the honey. Ash presents as an inorganic residue after carbonization, while electric conductivity measures all ionizable organic and inorganic substances [16]. The EU Honey Directive stipulates a maximum permitted value of 0.8 µS cm−1 conductivity for nectar honey except for chestnut honey, which should not be less than 0.8 µS cm−1 [10].
Apart from other factors, the quality of honey can also be affected by the use of excessive heating either during the production process or due to improper storage conditions [17]. The HMF (hydroxymethylfurfural) content is considered an important parameter for the measurement of honey quality and authenticity. It is usually absent or only low amounts occur naturally in fresh honey, while high levels may be a result of inadequate storage, adulteration with sugar additives, or application of heat to decrease honey’s viscosity [18].
Since high levels of HMF may be the result of excessive heat treatment, improper storage, or possible adulation with other sugars or syrups, food standards regulate the levels of HMF in honey.
The Codex Alimentarius Commission recommends the maximum amount of HMF to be 40 or 80 mg/kg for honey from tropical climates [9,19]. The European Union established the same maximum amount of HMF [20].
The Republic of Kosovo has a tradition in honey production. Data on beekeeping, although scarce, show that the number of beehives and total production sharply increased in Kosovo after the war. The total honey produced in Kosovo in 2019 was around 2198 tons [21].
Kosovo aims to support the competitiveness of the agro-food sector in line with EU veterinary, phytosanitary, and food safety standards. Thus, the physicochemical and microbiological properties of certain food products are addressed through different assessments [22,23].
As far as we are aware, there are no data about the general physicochemical properties of honey from Kosovo. Despite this fact, there are few studies, which show features, such as the concentrations of selected elements for soil, honey and bee pollen, and radioactivity level in Kosovo’s honey as well as the phenolic and flavonoid content of honey from Kosovo [24,25,26].
This study aimed to assess the physicochemical properties of several honey samples of different floral origins from Kosovo, including some samples of imported commercial honey available in Kosovo markets.

2. Materials and Methods
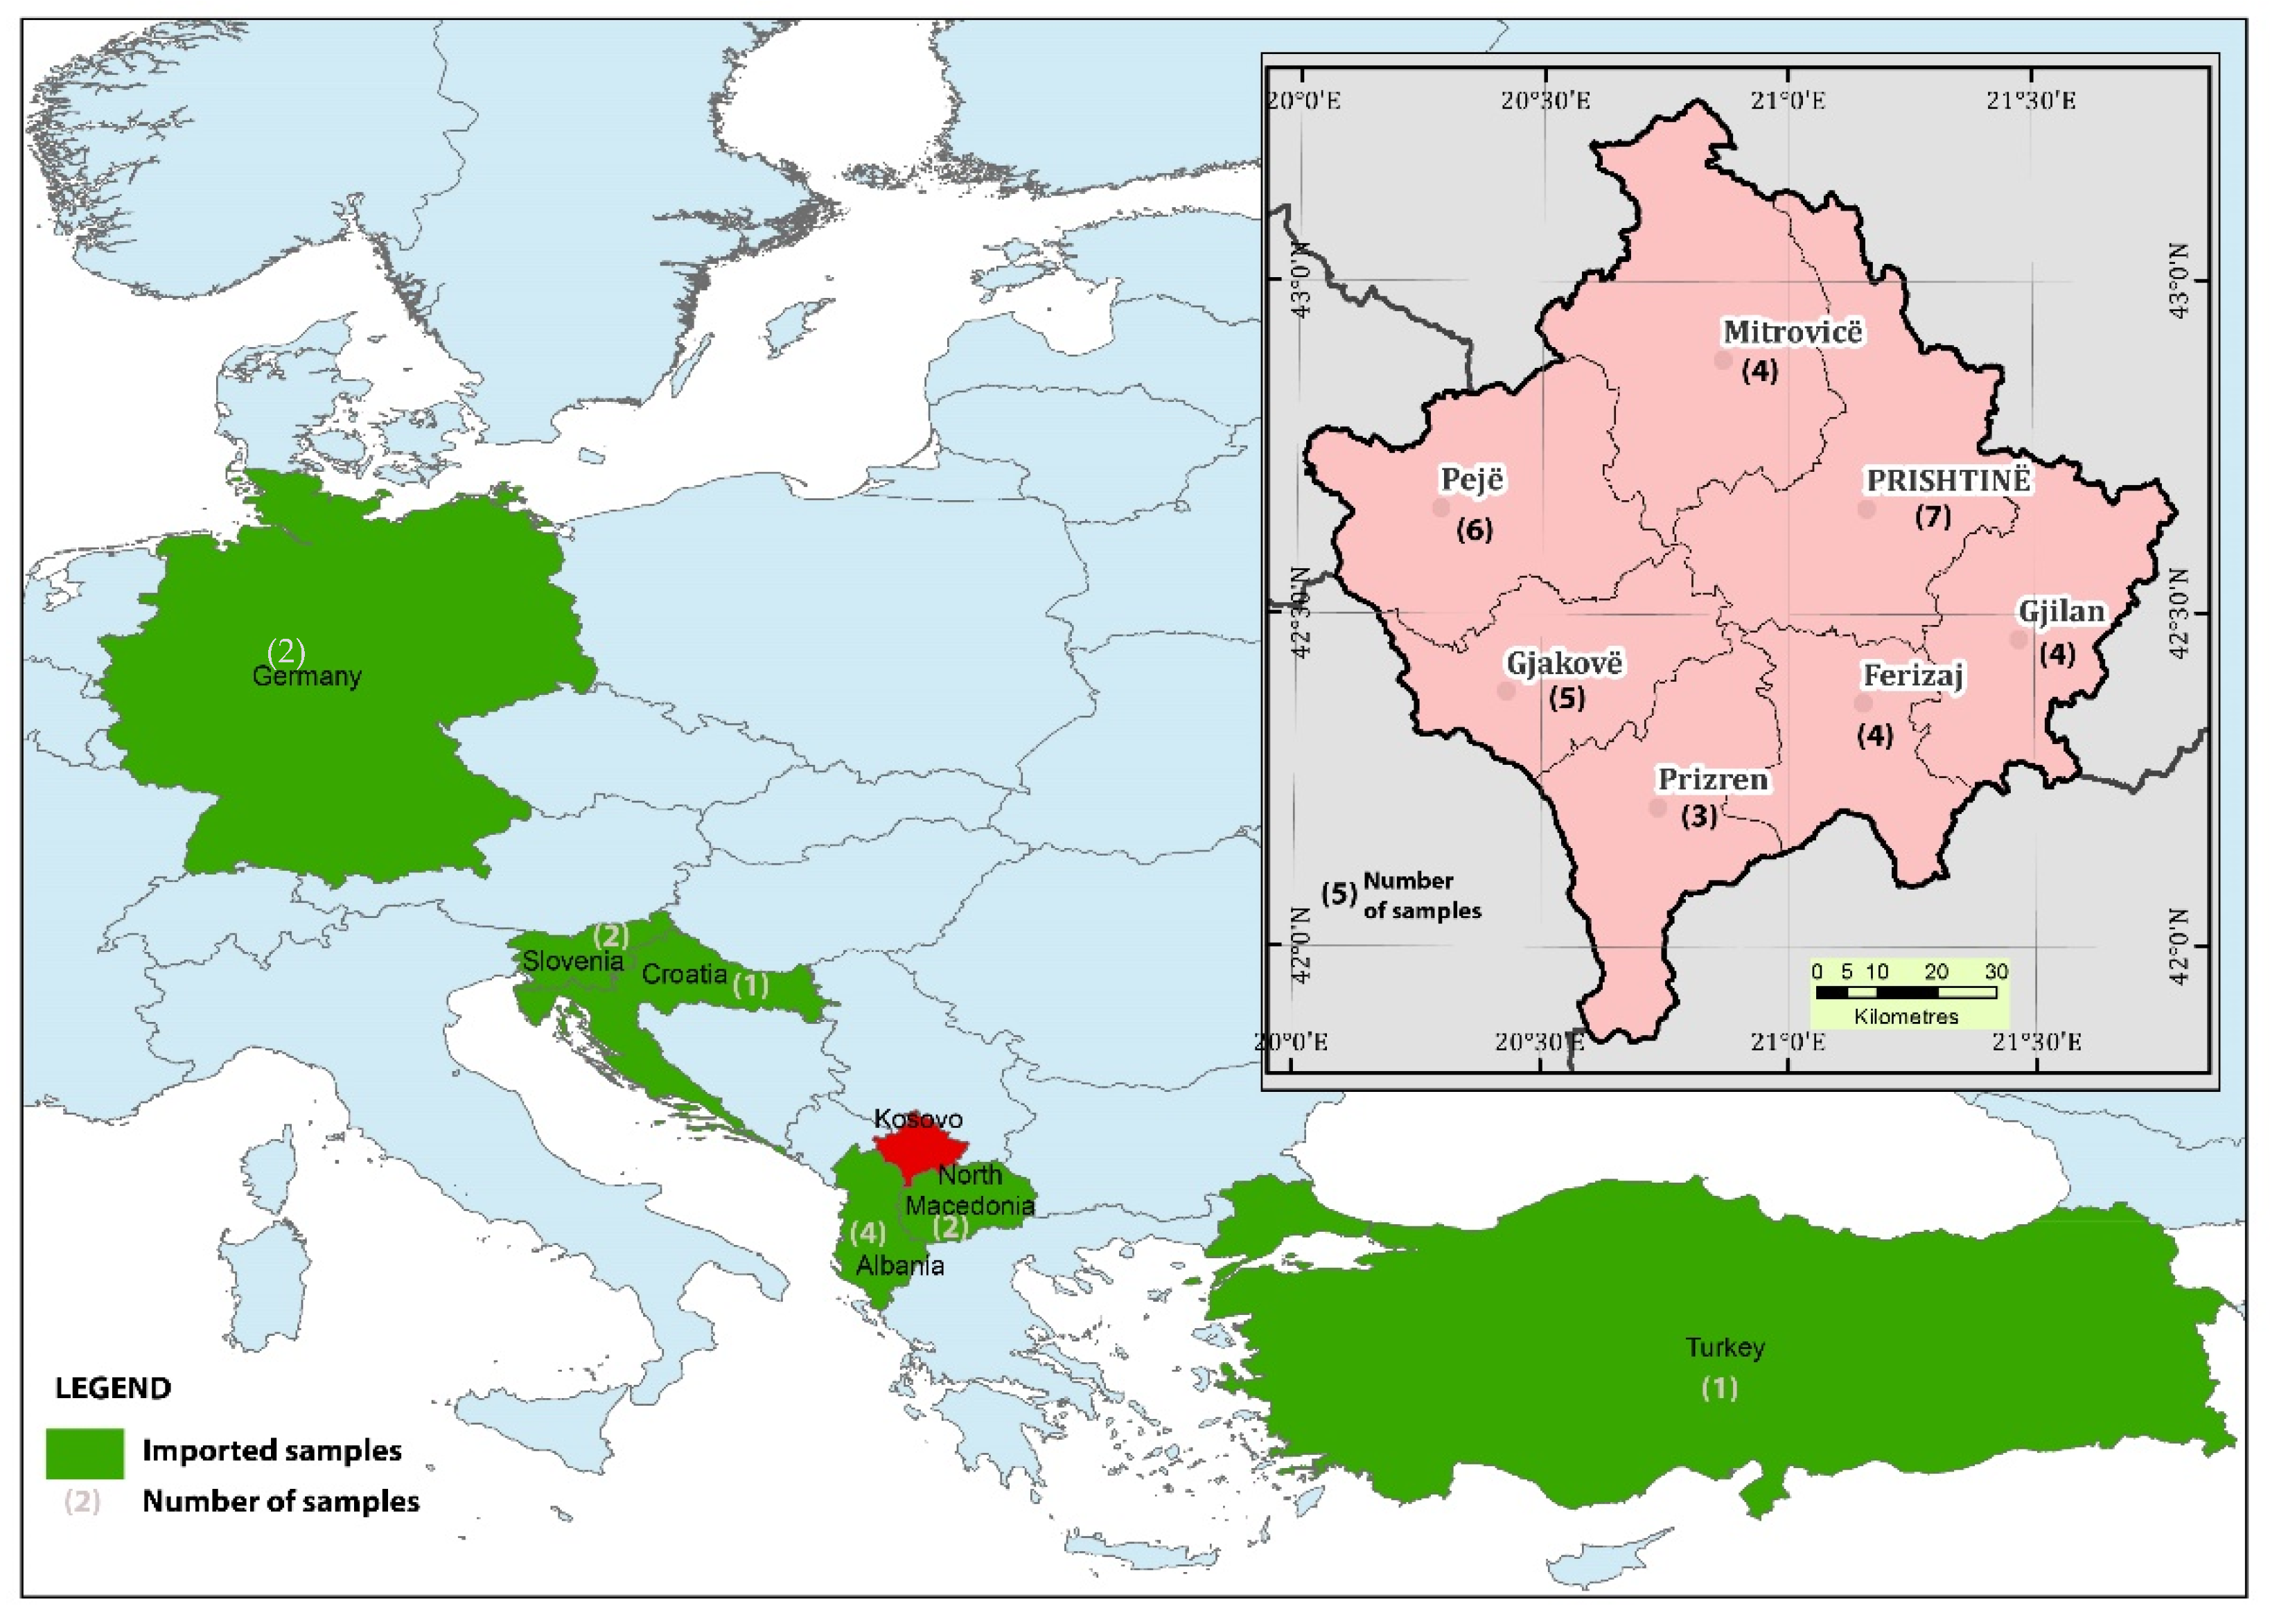
2.1. Samples

Forty-five honey samples (15 flower honey, 11 forest honey, 8 Acacia honey, 8 mixed honey, and 3 chestnut honey) were assessed for their physicochemical parameters (moisture, pH, electric conductivity, free acidity, HMF, proteins, soluble solids, and ash).

2.2. Samples from Kosovo

Thirty-three honey samples were obtained from different regions in Kosovo between July and August 2019. Samples of locally produced honey were collected in seven Kosovo regions as follows: 7 samples from Prishtina region, 6 samples from Peja region, 5 samples from Gjakova region, 4 samples from Gjilan region, 4 samples from Ferizaj Region, 4 samples from Mitrovica region, and 3 samples from Prizren region. All samples were collected in sterile containers labeled with the type of honey, place, and collection date. Samples were transferred to the laboratory and protected from light at ambient temperature until analyzed.

2.3. Samples from Imports

Twelve containers of imported honey were purchased in supermarket chains in Kosovo. The net weight of honey packed in containers was 0.5 kg. The imported honey originated from Albania (4 samples), Germany (2 samples), Slovenia (2 samples), North Macedonia (2 samples), Turkey (1 sample), and Croatia (1 sample). The production year of imported honey was 2019, which is the same as the production year of Kosovo’s honey. The samples of imported honey (4 flower honey, 2 forest honey, 4 Acacia honey and chestnut honey) were placed in sterile containers, which were labeled the type of honey, place and country of origin, and collection date, transferred to the laboratory, and kept protected from light at ambient temperature until analysis.
In total, 45 samples, both locally produced and imported samples, were protected from light at room temperature. The analyses of moisture, pH, electric conductivity, free acidity, HMF, proteins, soluble solid content, and ash were performed between October 2020 and March 2021 at the Kosovo Agricultural Institute in Peja and at the laboratory of the Faculty of Agriculture and Food Sciences in Sarajevo in Bosnia and Herzegovina. Figure 1 shows the geographical origin of the studied Kosovo’s and imported honey samples studied.

2.4. Determination of Moisture Content

Moisture content was determined using an ABBE refractometer 220 V BOE 32,400 Model RMT. The refractive index of the sample was determined with a refractometer, at a constant temperature of 20 °C. Based on the refractive index, the amount of water (% m/m) was calculated, i.e., using a table. If the index was not determined at a temperature of 20 °C, the temperature correction was taken into account and the results were reduced to a temperature of 20 °C (AOAC Official Method 920.182; Rulebook on Methods for Control of Honey and Other Bee Products, Official Gazette of BiH, No. 37/09).

2.5. Determination of pH, Electric Conductivity, and Free Acidity

pH and electric conductivity were determined according to the AOAC (Association of Official Analytical Chemistry) method 981.121. A honey sample of 10 g was dissolved in 75 mL of distilled water. A calibrated pH/Conductivity-meter (S213 Mettler Toledo Seven Compact Duo pH/Conductivity Meters) was used for direct reading of the pH and conductivity value for each honey sample. Electric conductivity is a parameter through which the ability of ions to conduct an electric current between two electrodes is determined.
Free acidity was determined by the titrimetric method. This method is based on the titration of the honey sample (10 g diluted with 75 mL of distilled water), with 0.1 N sodium hydroxide in the presence of phenolphthalein as an indicator.

2.6. Determination of Hydroxymethylfurfural (HMF)

The VWR UV/Visible Spectrophotometer-1600PC was used to analyze the hydroxymethylfurfural (HMF) content in honey samples. The determination is based on the absorbance of hydroxymethylfurfural in the ultraviolet (UV) and visible (Vis) part of the 284 nm spectrum. In order to prevent the interference of other components at this wavelength, the differences between the absorbance of the pure honey solution and after the addition of disulfide were determined.

2.7. Determination of Proteins

Protein content was determined using the Kjeldahl method, which includes digestion with acid, distillation, and titration according to the AOAC 969.37 method using a Kjeldahl Apparatus (FOSS Kjeltec 8420 autosampler systems).

2.8. Determination of Soluble Solids

The soluble solid content was determined by using an ABBE refractometer Model RMT 0–95% Brix, 0–70 °C. Total soluble solids expressed as Brix degrees (a percentage of sugar is considered to be, at 20 °C, one °Brix) was read from the table of correspondence between the refractive index at 20 °C and degrees Brix.

2.9. Determination of Ash

Ash, which presents the mineral content in honey samples, was determined by taking about 10 g of honey sample, after the addition of 10 mL warm distilled water, evaporation (100–300 °C), and ashing in an electrical furnace (Protherm) at 550 °C until ashing was complete, according to the method AOAC 969.36.

2.10. Statistical Analyses

All analyses were carried out in triplicate and the data were calculated using Excel and expressed as means ± standard deviations (SDs). The mean and the standard deviation were used to determine the central tendency and the dispersion of the data. The t–test was used to compare and see if there was a significant difference between the values of local and imported honey samples. All tests were set at the p ≤ 0.05 level of significance.

3. Results and Discussion

3.1. Honey Samples from Kosovo and Imports

The physicochemical parameters of Kosovo’s and imported honey samples (moisture, pH, electric conductivity, free acidity, HMF, protein, soluble solids, and ash) are shown in Table 2 and Table 3. Table 4 presents the date expressed as means ± standard deviations (SD) and differences between Kosovo’s and imported honey samples.

3.2. Moisture Content

The moisture content (%) in Kosovo’s honey samples varied from 14.0 to 19.0 (mean value ± SD = 16.53 ± 1.35%), while the moisture content values in imported honey samples ranged between 15.23 to 17.45 (mean value ± SD = 16.60 ± 0.60%). All of the moisture values in both local and imported honey samples were below 20%, which is the maximum value allowed by Council Directive 2001/110/EC [10]. The moisture content values in this study are close to those obtained in other studies [16,27]. No significant differences were observed when comparing the water content of Kosovo’s and imported honey samples (p-value > 0.05). The water content values in Kosovo’s honey samples are also close to the results obtained by other researchers from EU countries. Several studies showed similar results regarding the water content in honey samples from Croatia, Romania, and Italy, ranging between 15.40 to 18.03% [28,29,30,31,32]. The water content is a very important parameter and depends on numerous factors, such as the botanical origin, harvesting season, level of maturity in the hive as well as processing techniques, packaging, and storage conditions [33]. The water content is also an important parameter in showing both the viscosity and moistness of honey.

3.3. pH

The pH values in Kosovo’s honey samples ranged between 3.32 and 4.02 (mean value ± SD = 3.90 ± 0.25). The values recorded for the pH in samples of imported honey varied from 3.51 to 5.02 (mean value ± SD = 4.00 ± 0.36). Statistical tests did not show significant differences when comparing the pH values of Kosovo’s and imported honey samples. The pH values obtained in this study are consistent with other reported data [34]. It is considered that a pH level between 3.2 and 4.5 in the honey inhibits microbiological growth [35]. The pH values of all honey samples investigated in this study were below 4.5, except for one sample with a pH value of 5.2 (IH8 sample). Studies have shown that pH values decrease after one year of storage [35,36].

3.4. Electrical Conductivity
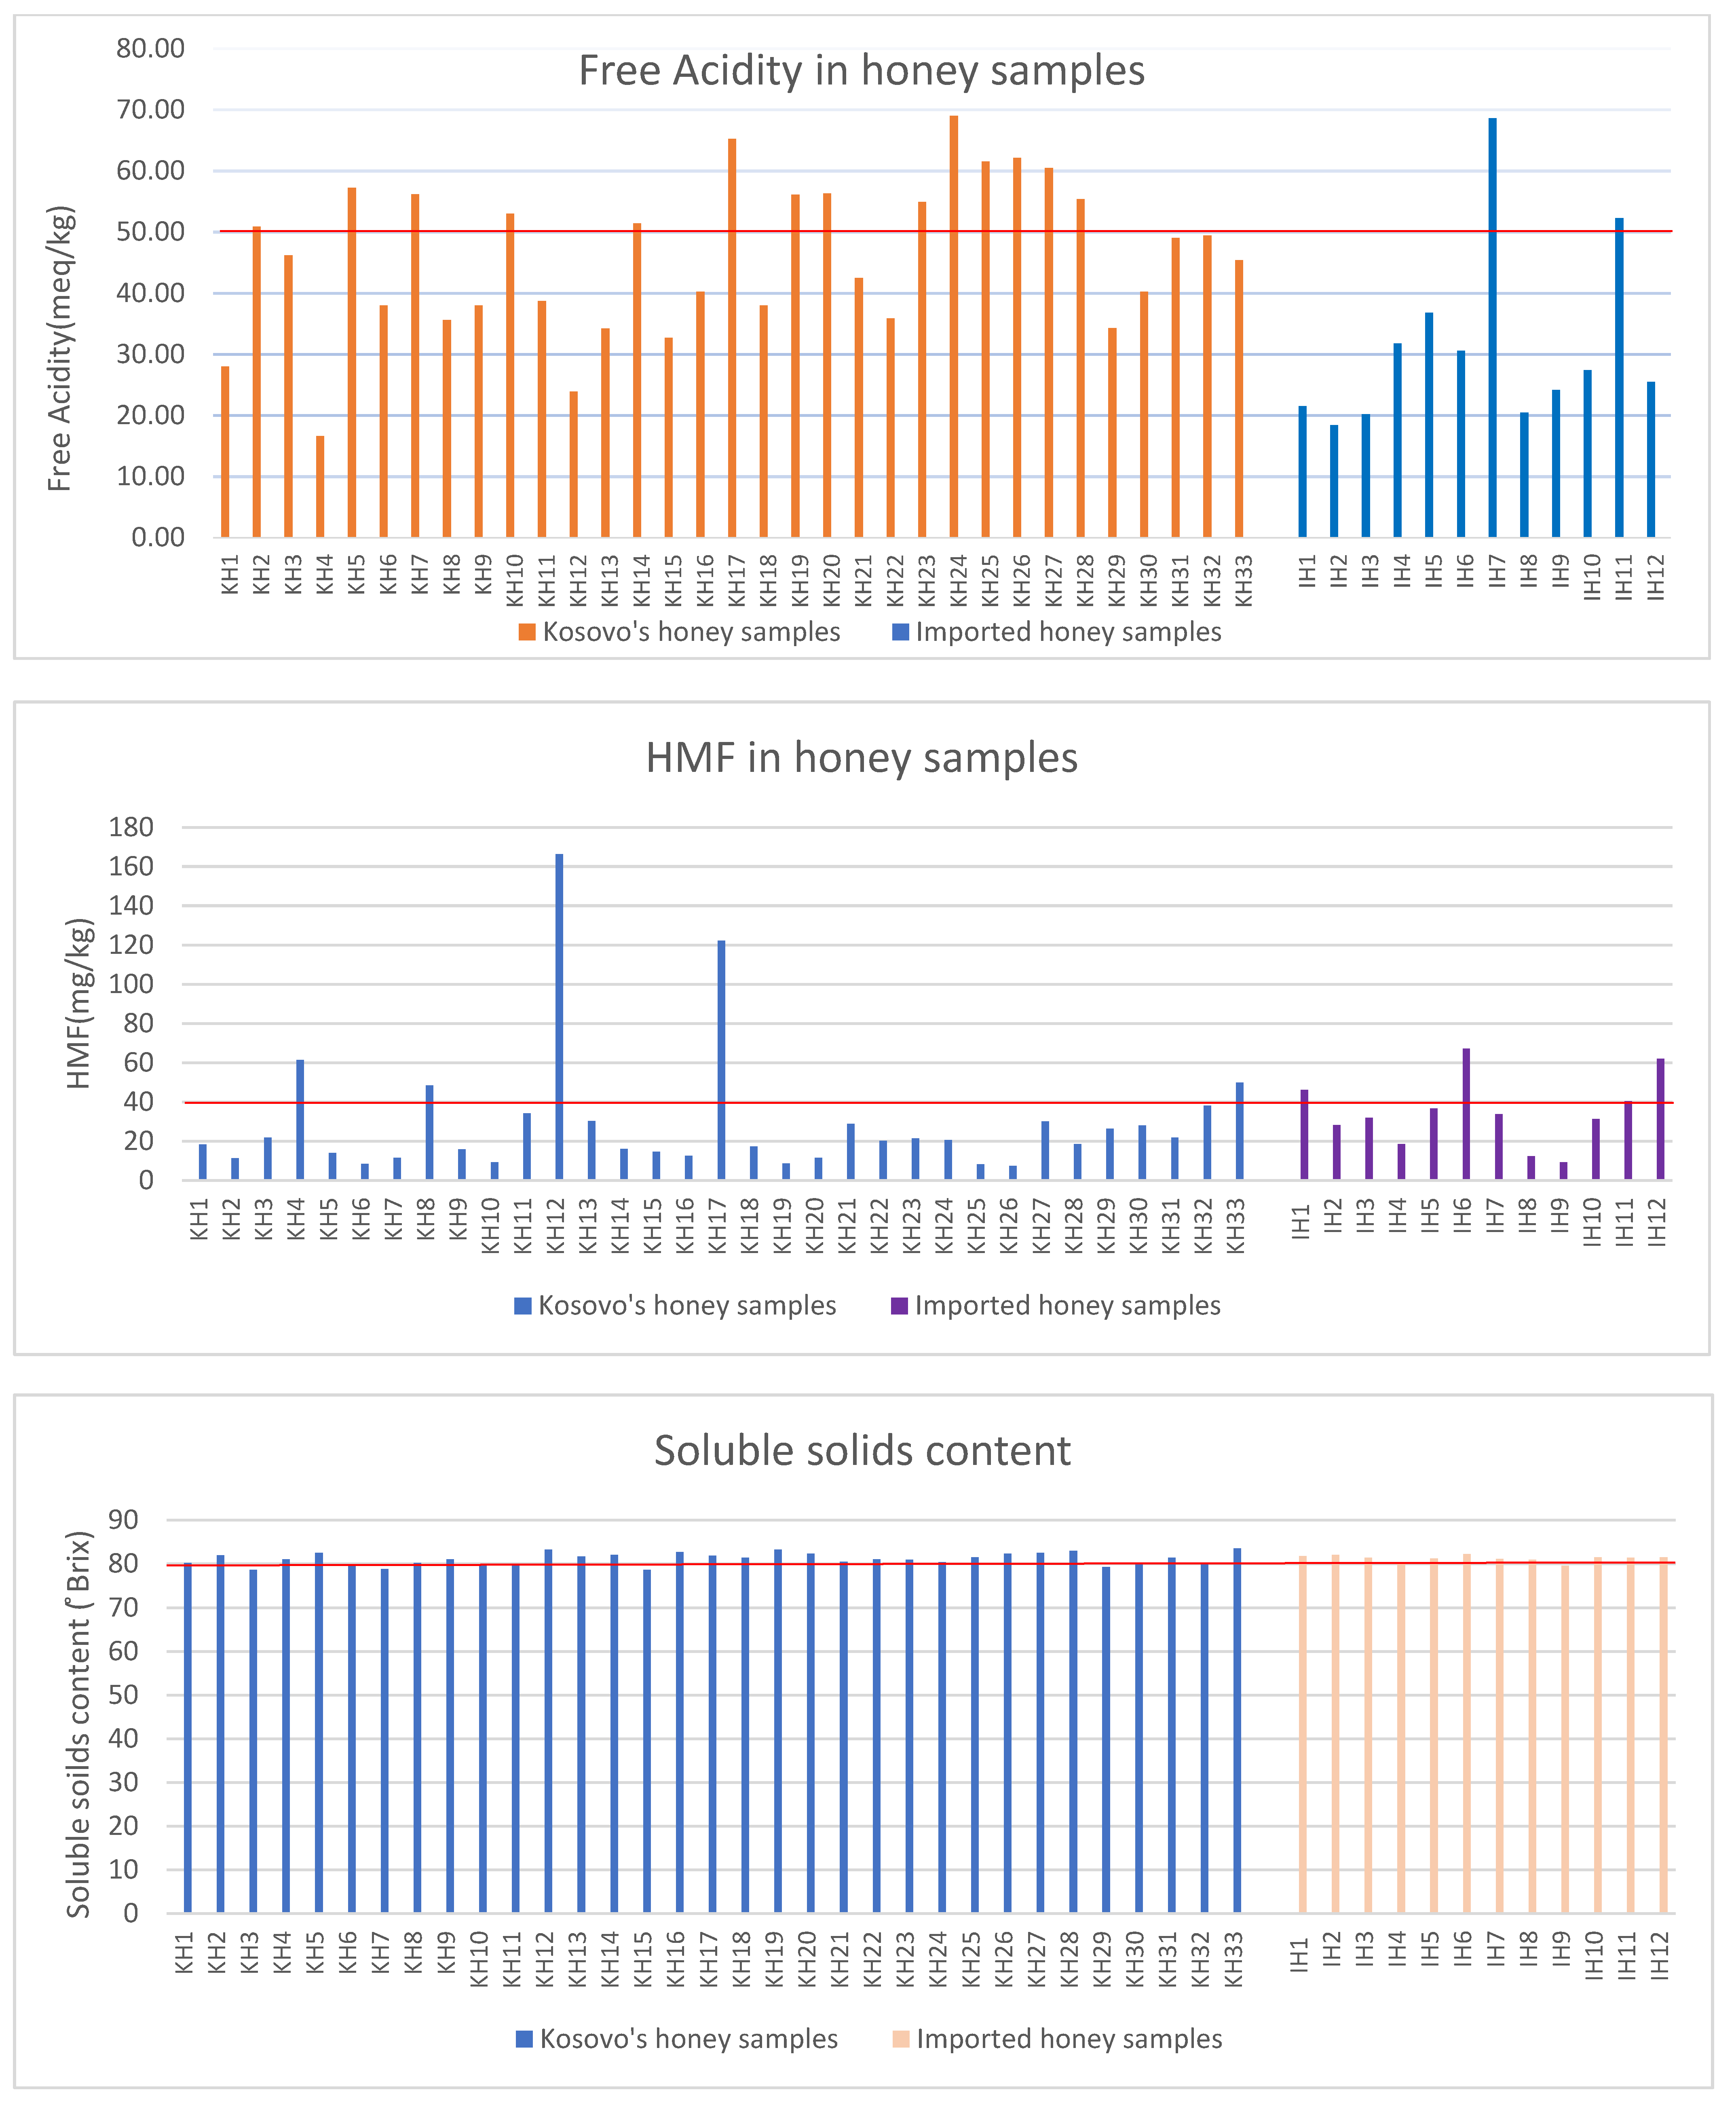
The electrical conductivity in Kosovo’s honey samples ranged between 0.12 and 0.75 mS cm−1 (mean value ± SD = 0.39 ± 0.18), while the electrical conductivity of imported honey samples ranged between 0.07 and 1.02 mS cm−1 (mean value ± SD = 0.26 ± 0.28). All samples had conductivity values below 0.8 mS cm−1, which is the maximum value allowed by Council Directive 2001/110/EC [10], apart from sample IH8, which showed an electrical conductivity value of 1.02 mS cm−1. The sample IH8 was chestnut honey and had the highest conductivity, ash, and pH. Other studies have also reported that the conductivity of honey depends on the acid as well as the ash contents, where higher ash and acid contents show higher conductivity [37,38,39]. When comparing the electrical conductivity, a significant difference (p < 0.05) was shown between the values of local and imported honey samples. The conductivity values in this study are close to values reported by other authors [40,41]. The mean electrical conductivity values in Kosovo’s honey samples (0.39 mS cm−1) are lower when compared to some mean values from other studies conducted in Italy (0.67 mS cm−1) and Bulgaria (0.69 mS cm−1) [42,43].

3.5. Free Acidity

The free acidity (meq kg −1) in Kosovo’s honey samples ranged between 23.90 and 69.00 (mean value ± SD = 45.95 ± 12.30%). On the other hand, the free acidity in imported honey samples varied from 18.40 to 68.60 (mean value ± SD = 31.48 ± 14.33%). The free acidity was above 50.0 meq kg−1 which is the maximum value allowed by Council Directive 2001/110/EC [10], in 14 out of 33 samples (42%) collected from beekeepers in Kosovo, while only 2 out of 12 imported honey samples (16.7%) showed higher values than 50.0 meq kg −1, which is the maximum value permitted by Codex Alimentarius and EU standards. Slightly higher values than 50.0 meq kg−1 (50.90–57.20) were shown in the following honey samples: KH2 (forest honey, Peja region), KH5 (mixed honey, Ferizaj region), KH7 (forest honey, Prishtina region), KH10 (flower honey, Prishtina region), KH14 (flower honey, Gjilan region), KH19 (forest honey, Gjakova region), KH20 (Acacia honey, Gjilan region), KH 23 (forest honey, Prizren), KH28 (flower honey, Mitrovica region), and in imported honey sample IH11 (chestnut honey, Albania). Free acidity values between 60 and 69 meq kg −1 were observed in the following Kosovo honey samples: KH17 (Acacia honey, Gjakova region), KH24 (mixed honey, Gjakova region), KH25 (forest honey, Prishtina-region), KH26 (mixed honey, Gjilan region), KH27 (mixed honey, Prishtina region), and in imported honey sample IH7 (flower honey, N. Macedonia). Statistical analyses showed significant differences (p < 0.05) in terms of the free acidity values in Kosovo’s and imported honey samples. Although the free acidity is usually influenced by the natural presence of organic acids in honey, the harvest season, and the floral origin [12,44], the values above 50 meq kg−1 found in 14 Kosovo’s honey samples and in 2 imported honey samples are an indication that fermentation may have occurred. Literature data show lower levels of acidity in honey samples in comparison with this study. The average values from this study are higher than those obtained by authors from Turkey, Croatia, as well as those obtained by Italian researchers [29,30,31,45,46]. The lower value of acidity shows the freshness of honey, but due to the fermentation process, the value can increase during storage [47,48,49]. In our case, analyses were carried out in honey samples stored for more than one year, so we assume that acidity increased with storage. Different authors evaluated the free acidity of honey samples stored at room temperature over different periods, and the results showed an increase in free acidity after 20 or 30 months of storage [50,51].

3.6. Hydroxymethylfurfural (HMF)

The HMF content in honey samples from Kosovo analyzed in this study ranged between 7.41 and 166.43 mg/kg of honey (mean value ± SD = 29.48 ± 32.26). According to both the Codex Alimentarius Commission and European Union, 28 honey samples (85%) met the HMF directive, while five honey samples (15%) exceeded 40 mg/kg, which is the maximum content of HMF set in the above-mentioned standards [9,10]. The honey samples KH4 (forest honey, Gjakova region), KH8 (Acacia, Prishtina region), KH12 (mixed honey, Ferizaj region), KH17 (Acacia honey, Gjakova region), and KH33 (flower honey, Ferizaj region) exceeded the maximum content of HMF set in honey standards. Generally, HMF is not present in fresh honey and its content is used to evaluate the quality and freshness of honey [52,53,54]. Although only HMF is not strong evidence for extensive heating or a prolonged period of storage and adulteration [55], the samples that exceeded 40 mg/kg indicates excessive heating or inadequate storage conditions. The content of HMF was below 10 mg/kg in six samples (KH6, KH7, KH10, KH19, KH25, and KH26), indicating a medium degree of freshness. In the other 22 samples, the HMF content ranged between 11.25 and 38.04 mg/kg. The HMF content in imported honey samples ranged between 9.20 and 67.25 mg/kg (mean value ± SD = 34.76 ± 16.96). In 4 out of 12 (33%) of the samples, the HMF content exceeded the maximum limit (40 mg/kg) set by the honey standards. The imported honey samples IH1 (Acacia honey, München/Germany), IH6 (Acacia honey, Manavlar Gida San/Turkey), IH11 (chestnut honey, Korçë/Albania), and IH12 (chestnut honey, Korçë/Albania) exceeded the maximum content of HMF set in honey standards. No significant differences were shown when comparing the HMF values of local and imported honey samples. Although most of Kosovo’s honey samples (85%) met the standards with regard to HMF, researchers from Rumania and Moldova reported that all samples analyzed had an HMF content below 40 mg/kg [56,57].
A summary of the results of the acidity, HMF, and soluble solids of local and imported honey is presented in Figure 2. The results presented in the figure show the increased values of free acidity, HMF, and low soluble solid contents.

3.7. Protein

The protein content in Kosovo’s honey samples varied from 0.20 to 1.90 (mean value ± SD = 0.44 ± 0.32%). The highest protein content values were recorded in two honey samples originating from Gjilan and Gjakova regions (KH14 and KH24). All other values were under 1%. The protein content of imported honey samples ranged from 0.01 to 7.68 (mean value ± SD = 1.00 ± 2.05%). The highest protein content (7.68%) was shown in the imported honey sample IH10 from Albania. Statistical tests did not show significant differences between the values of the protein content in local and imported honey samples.

3.8. Soluble Solids

The total soluble solids expressed as °Brix of the honey samples from Kosovo ranged from 78.60 to 83.50 (mean value ± SD = 81.09 ± 1.37). The analyzed imported honey samples showed soluble solids content values between 79.50 and 82.20 (mean value ± SD = 81.18 ± 0.70). The comparison between the average content of soluble solids in local and imported honey samples did not show significant differences. Usually, the content of soluble solids in honey is 80 °Brix or above [58]. The grading system of the United States Department of Agriculture stipulates that honey is qualitative and is more stable during storage for a longer period when results exceed 80 °Brix (<20% water). In this study, 7 out of 33 honey samples from Kosovo had a soluble solids content below 80 °Brix. On the other hand, only one out of 12 imported honey samples had a soluble solids content below 80 °Brix. Values lower than 80 °Brix of soluble solids were observed in Kosovo’s samples KH3 (Acacia honey, Peja region), KH6 (flower honey, Prishtina region), KH7 (forest honey, Prishtina region), KH10 (flower honey, Prishtina region), KH11 (flower honey, Prishtina region), KH15 (forest honey, Mitrovica region), KH29 (chestnut honey, Peja region), and IH9 (flower honey, N. Macedonia) of imported honey. These values are similar to those reported in other studies [15]. The soluble solids content of honey samples from Portugal ranged from 79.0 to 82.2 °Brix, while the content of soluble solids of honey from Mexico ranged from 79.1 to 81.7 °Brix [59].

3.9. Ash

The ash content is a quality criterion that evaluates the mineral content in honey, indicating the geographical origin, nutritional values as well as harvesting processes and beekeeping techniques. Therefore, the ash content depends on the soil from which flowers have grown and on the kind of nectar collected by bees [12,60]. The ash values in Kosovo’s honey samples ranged from 0.01 to 0.76 g kg−1 (mean value ± SD = 0.24 ± 0.20). The analyses of the honey samples coming from imports showed that the ash content ranged from 0.01 to 0.60 g kg−1 (mean value ± SD = 0.16 ± 0.22). Statistical testing did not show a significant difference (p-value > 0.05) between the ash content values in Kosovo’s samples and those from imports. In this study, the ash content of Kosovo’s samples (mean 0.24%) was in the acceptable range and these results showed approximately similarity with those obtained by other researchers from Portugal and Romania [61,62].

4. Conclusions

As a conclusion from this research, we can say that the values of some physicochemical parameters of both local and imported honey samples are not within the quality limits set in legislation. We assume that the increased values of free acidity, HMF, and low soluble solid contents in some samples are due to improper storing by beekeepers/markets. The increased values of free acidity and HMF in some samples indicate possible fermentation of sugars and possible overheating. Therefore, further studies are needed to evaluate the properties of fresh honey produced in Kosovo and the stability of honey during prolonged storage.

Author Contributions

Conceptualization, A.R. (Agim Rysha) and G.K.; methodology, G.K., L.B. and V.S.; software, A.R. (Aurorë Rysha) and E.K.-K.; validation, A.R. (Agim Rysha), G.K. and L.B.; formal analysis, G.K., L.B. and V.S.; sampling, A.R. (Aurorë Rysha), F.Z. and E.K.-K.; writing—original draft preparation, A.R. (Agim Rysha) and G.K.; supervision, A.R. All authors have read and agreed to the published version of the manuscript.

Funding

This research received no external funding.

Institutional Review Board Statement

Not applicable.

Informed Consent Statement

Not applicable.

Data Availability Statement

Data of this manuscript are original, and all other data used for comparison or other discussion are cited in the manuscript.

Acknowledgments

We would like to thank the University of Sarajevo and the Kosovo Agricultural Institute in Peja for their help with the study. The laboratory assessment took place at the Faculty of Agriculture and Food Sciences in Sarajevo, Bosnia and Herzegovina and the Kosovo Agricultural Institute in Peja, Kosovo.

Conflicts of Interest

No potential conflict of interest was reported by the authors.

References

  1. Saxena, S.; Gautam, S.; Sharma, A. Physical, biochemical and antioxidant properties of some Indian honeys. Food Chem. 2010, 118, 391–397. [Google Scholar] [CrossRef]
  2. Krell, R. Value-Added Products from Beekeeping; FAO Agricultural Services Bulletin No. 124; Food and Agriculture Organization of the United Nations: Rome, Italy, 1996. [Google Scholar]
  3. Blasa, M.; Candiracci, M.; Accorsi, A.; Piacentini, M.P.; Albertini, M.C.; Piatti, E. Raw Millefiori honey is packed full of antioxidants. Food Chem. 2006, 97, 217–222. [Google Scholar] [CrossRef]
  4. Bilandžić, N.; Dokić, M.; Sedak, M.; Kolanović, B.S.; Varenina, I.; Končurat, A.; Rudan, N. Determination of trace elements in Croatian floral honey originating from different regions. Food Chem. 2011, 128, 1160–1164. [Google Scholar] [CrossRef]
  5. Guler, A.; Bakan, A.; Nisbet, C.; Yavuz, O. Determination of important biochemical properties of honey to discriminate pure and adulterated honey with sucrose (Saccharum officinarum L.) syrup. Food Chem. 2007, 105, 1119–1125. [Google Scholar] [CrossRef]
  6. Bogdanov, S.; Martin, P.; Lüllmann, C. Harmonized methods of the European Honey Commission. Apidologie 1997, 1–59. Available online: https://agris.fao.org/agris-search/search.do?recordID=FR1998002973 (accessed on 15 November 2021).
  7. Crane, E. Honey: A Comprehensive Survey; Heinemann (for) the Bee Research Association: London, UK, 1975; p. 608. [Google Scholar]
  8. Zappi, A. Development and application of a database of food ingredient fraud and economically motivated adulteration from 1980 to 2010. Eur. food Res. Technol. A 2018, 244, 118–126. [Google Scholar] [CrossRef]
  9. Codex Alimentarius Commission. Draft Revised Standard for Standard for Honey (at Step 10 of the Codex Procedure) Alinorm; Codex Alimentarius Commission: Rome, Italy, 2001; pp. 19–26. [Google Scholar]
  10. The Council of The Europian Union Council Directive 2001/110/. Off. J. Eur. Communities 2001, L10, 47–52.
  11. Escuredo, O.; Míguez, M.; Fernández-González, M.; Carmen Seijo, M.C. Nutritional value and antioxidant activity of honeys produced in a European Atlantic area. Food Chem. 2013, 138, 851–856. [Google Scholar] [CrossRef]
  12. Karabagias, I.K.; Badeka, A.; Kontakos, S.; Karabournioti, S.; Kontominas, M.G. Characterisation and classification of Greek pine honeys according to their geographical origin based on volatiles, physicochemical parameters and chemometrics. Food Chem. 2014, 146, 548–557. [Google Scholar] [CrossRef]
  13. Suárez-Luque, S.; Mato, I.; Huidobro, J.F.; Simal-Lozano, J.; Sancho, M.T. Rapid determination of minority organic acids in honey by high-performance liquid chromatography. J. Chromatogr. A 2002, 955, 207–214. [Google Scholar] [CrossRef]
  14. Won, S.R.; Lee, D.C.; Ko, S.H.; Kim, J.W.; Rhee, H.I. Honey major protein characterization and its application to adulteration detection. Food Res. Int. 2008, 41, 952–956. [Google Scholar] [CrossRef]
  15. Albu, A.; Radu-Rusu, C.G.; Pop, I.M.; Frunza, G.; Nacu, G. Quality assessment of raw honey issued from Eastern Romania. Agriculture 2021, 11, 247. [Google Scholar] [CrossRef]
  16. Feás, X.; Pires, J.; Estevinho, M.L.; Iglesias, A.; de Araujo, J.P.P. Palynological and physicochemical data characterisation of honeys produced in the Entre-Douro e Minho region of Portugal. Int. J. Food Sci. Technol. 2010, 45, 1255–1262. [Google Scholar] [CrossRef]
  17. Pita-Calvo, C.; Guerra-Rodríguez, M.E.; Vázquez, M. Analytical methods used in the quality control of honey. J. Agric. Food Chem. 2017, 65, 690–703. [Google Scholar] [CrossRef] [PubMed]
  18. Flajak, I.; Primorac, L.; Bilić, B.; Novak, M.; Cvijetić Stokanović, M.; Kenjerić, D. Evaluation of 5-(Hydroxymethyl) Furan-2-Carbaldehyde (Hmf) Evaluation of 5- (Hydroxymethyl) Furan-2-Carbaldehyde (Hmf) Content in Honey: Comparison of Chromatographic and Spectrophotometric Method. Technol. Acta 2016, 9, 37–41. [Google Scholar]
  19. Codex Alimentarius Commission. Draft Amended Standard for Standard for Honey. CXS 12–1981, Amended in 2019. pp. 1–9. Available online: https://www.fao.org/fao-who-codexalimentarius/sh-proxy/es/?lnk=1&url=https%253A%252F%252Fworkspace.fao.org%252Fsites%252Fcodex%252FStandards%252FCXS%2B12-1981%252FCXS_012e.pdf (accessed on 15 November 2021).
  20. Datsyuk, V.V. Peculiarities of KrF excimer vibrational relaxation in low-pressure Kr/F2 mixtures excited by a short pulse. Appl. Phys. B Photophysics Laser Chem. 1992, 55, 60–64. [Google Scholar] [CrossRef]
  21. Beekeeping Sector in Kosovo. Recura 2021. Available online: https://agroportal-ks.com/wp-content/uploads/2021/03/Beekeeping-Sector-in-Kosovo.pdf (accessed on 15 November 2021).
  22. Rysha, A.; Delaš, F. Sensory properties and chemical composition of Shar cheese from Kosovo. Mljekarstvo 2014, 64, 295–303. [Google Scholar] [CrossRef] [Green Version]
  23. Rysha, A.; Markov, K.; Frece, J.; Čvek, D.; Delaš, F. A survey of the microbiological quality of Sharri, a hard mountain cheese from Kosovo. Int. J. Dairy Technol. 2014, 67, 277–282. [Google Scholar] [CrossRef]
  24. Kastrati, G.; Paçarizi, M.; Sopaj, F.; Tašev, K.; Stafilov, T.; Mustafa, M.K. Investigation of concentration and distribution of elements in three environmental compartments in the region of Mitrovica, kosovo: Soil, honey and bee pollen. Int. J. Environ. Res. Public Health 2021, 18, 2269. [Google Scholar] [CrossRef]
  25. Dizman, S.; Hodolli, G.; Kadiri, S.; Aliu, H.; Makolli, S. Radioactivity in Kosovo honey samples. Polish J. Environ. Stud. 2020, 29, 1119–1127. [Google Scholar] [CrossRef]
  26. Ibrahimi, H.; Hajdari, A. Phenolic and flavonoid content, and antioxidant activity of honey from Kosovo. J. Apic. Res. 2020, 59, 452–457. [Google Scholar] [CrossRef]
  27. Baroni, M.V.; Arrua, C.; Nores, M.L.; Fayé, P.; Diaz, M.P.; Chiabtando, G.A.; Wuderlin, D.A. Composition of honey from Córdoba (Argentina): Assessment of North/South provenance by chemometrics. Food Chem. 2009, 114, 727–733. [Google Scholar] [CrossRef]
  28. Uršulin-Trstenjak, N.; Levanić, D.; Grabar, I.; Koldenjak, M.; Bošnir, J. Physico-Chemical Profiles of Croatian Honey with an Overview of Its Consumption. J. Appl. Health Sci. 2017, 3, 51–60. [Google Scholar] [CrossRef]
  29. Šarić, G.; Matković, D.; Hruškar, M.; Vahčić, N. Characterisation and classification of Croatian honey by physicochemical parameters. Food Technol. Biotechnol. 2008, 46, 355–367. [Google Scholar]
  30. Marghitas, L.A.; Dezmirean, D.S.; Pocol, C.B.; Ilea, M.; Bobis, O.; Gergen, I. The development of a biochemical profile of black locust honey by identifying biochemical determinants of its quality. Not. Bot. Hort I Agrobot. Cluj Napoca 2010, 38, 84–90. [Google Scholar]
  31. Persano Oddo, L.; Piro, R. Main European unifloral honeys: Descriptive sheets. Apidologie 2004, 35, S38–S81. [Google Scholar] [CrossRef]
  32. Kenjerić, D.; Mandić, M.L.; Primorac., L.; Bubola, D.; Perl, A. Flavonoid profile of Robinia honeys produced in Croatia. Food Chem. 2007, 102, 683–690. [Google Scholar] [CrossRef]
  33. Acquarone, C.; Buera, P.; Elizalde, B. Pattern of pH and electrical conductivity upon honey dilution as a complementary tool for discriminating geographical origin of honeys. Food Chem. 2007, 101, 695–703. [Google Scholar] [CrossRef]
  34. Cantarelli, M.A.; Pellerano, R.G.; Marchevsky, E.J.; Camiña, J.M. Quality of Honey from Argentina: Study of Chemical Composition and Trace Elements. J. Argent. Chem. Soc. 2008, 96, 33–41. [Google Scholar]
  35. Missio da Silva, P.; Gonzaga, L.V.; Biluca, F.C.; Schulz, M.; Vitali, L.; Micke, G.A.; Oliveira Costa, A.C.; Fett, R. Stability of Brazilian Apis mellifera L. honey during prolonged storage: Physicochemical parameters and bioactive compounds. LWT 2020, 129, 109521. [Google Scholar] [CrossRef]
  36. Zarei, M.; Fazlara, A.; Alijani, N. Evaluation of the changes in physicochemical and antioxidant properties of honey during storage. Funct. Foods Heal. Dis. 2019, 9, 593–605. [Google Scholar] [CrossRef]
  37. Sancho, M.T.; Muniategui, S.; Sánchez, M.P.; Huidobro, J.F.; Simal, J. Relationships between electrical conductivity and total and sulphated ash contents in Basque honeys. Apidologie 1991, 22, 487–494. [Google Scholar] [CrossRef] [Green Version]
  38. Bromberg, W.; Berrian, B. An approach to recidivism. Bull. Am. Acad. Psychiatry Law 1974, 2, 111–114. [Google Scholar] [PubMed]
  39. Živkov Baloš, M.; Popov, N.; Vidaković, S.; Ljubojević Pelić, D.; Pelić, M.; Mihaljev, Ž.; Jakšić, S. Electrical conductivity and acidity of honey. Arch. Vet. Med. 2018, 11, 91–101. [Google Scholar] [CrossRef]
  40. Kaškoniene, V.; Venskutonis, P.R.; Čeksteryte, V. Carbohydrate composition and electrical conductivity of different origin honeys from Lithuania. LWT 2010, 43, 801–807. [Google Scholar] [CrossRef]
  41. Mondragón-Cortez, P.; Ulloa, J.A.; Rosas-Ulloa, P.; Rodríguez-Rodríguez, R.; Resendiz Vizquez, J.A. Physicochemical characterization of honey from the West region of México. CyTA J. Food 2013, 11, 7–13. [Google Scholar] [CrossRef]
  42. Oddo, L.P.; Piazza, M.G.G.; Sabatini, A.G.G.; Accorti, M. Characterization of Unifloral Honeys. Apidologie 1995, 26, 453–465. [Google Scholar] [CrossRef] [Green Version]
  43. Atanassova, J.; Yurukova, L.; Lazarova, M. Pollen and Inorganic Characteristics of Bulgarian Unifloral Honeys. Czech J. Food Sci. 2012, 30, 520–526. [Google Scholar] [CrossRef] [Green Version]
  44. Mato, I.; Huidobro, J.F.; Simal-Lozano, J.; Sancho, M.T. Rapid determination of nonaromatic organic acids in honey by capillary zone electrophoresis with direct ultraviolet detection. J. Agric. Food Chem. 2006, 54, 1541–1550. [Google Scholar] [CrossRef]
  45. Kahraman, T.; Buyukunal, S.K.; Vural, A.; Altunatmaz, S.S. Physico-chemical properties in honey from different regions of Turkey. Food Chem. 2010, 123, 41–44. [Google Scholar] [CrossRef]
  46. Ozcan, M.; Arslan, D.; Ceylan, D.A. Effect of inverted saccharose on some properties of honey. Food Chem. 2006, 99, 24–29. [Google Scholar] [CrossRef]
  47. Gomes, S.; Dias, L.G.; Moreira, L.L.; Rodrigues, P.; Estevinho, L. Physicochemical, microbiological and antimicrobial properties of commercial honeys from Portugal. Food Chem. Toxicol. 2010, 48, 544–548. [Google Scholar] [CrossRef] [Green Version]
  48. Desissa, Y. Detection of the Electrical Conductivity and Acidity of Honey from Different Areas of Tepi. Food Sci. Technol. 2014, 2, 59–63. [Google Scholar]
  49. Seraglio, S.K.T.; Silva, B.; Bergamo, G.; Brugnerotto, P.; Gonzaga, L.V.; Fett, R.; Costa, A.C.O. An overview of physicochemical characteristics and health-promoting properties of honeydew honey. Food Res. Int. 2019, 119, 44–66. [Google Scholar] [CrossRef] [PubMed]
  50. Ajlouni, S.; Sujirapinyokul, P. Hydroxymethylfurfuraldehyde and amylase contents in Australian honey. Food Chem. 2010, 119, 1000–1005. [Google Scholar] [CrossRef]
  51. Cavia, M.M.; Fernández-Muiño, M.A.; Alonso-Torre, S.; Huidobro, J.F.; Sancho, M.T. Evolution of acidity of honeys from continental climates: Influence of induced granulation. Food Chem. 2007, 100, 1728–1733. [Google Scholar] [CrossRef]
  52. Mouhoubi-Tafinine, Z.; Ouchemoukh, S.; Bachir Bey, M.; Louaileche, H.; Tamendjari, A. Effect of storage on hydroxymethylfurfural (HMF) and color of some Algerian honey. Int. Food Res. J. 2018, 25, 1044–1050. [Google Scholar]
  53. Gidamis, A.B.; Chove, B.E.; Shayo, N.B.; Nnko, S.A.; Bangu, N.T. Quality evaluation of honey harvested from selected areas in Tanzania with special emphasis on hydroxymethyl furfural (HMF) levels. Plant. Foods Hum. Nutr. 2004, 59, 129–132. [Google Scholar] [CrossRef]
  54. Zappalà, M.; Fallico, B.; Arena, E.; Verzera, A. Methods for the determination of HMF in honey: A comparison. Food Control 2005, 16, 273–277. [Google Scholar] [CrossRef]
  55. Da Silva, P.M.; Gauche, C.; Gonzaga, L.V.; Costa, A.C.O.; Fett, R. Honey: Chemical composition, stability and authenticity. Food Chem. 2016, 196, 309–323. [Google Scholar] [CrossRef]
  56. Pauliuc, D.; Ciursă, P.; Ropciuc, S.; Dranca, F.; Oroian, M. Physicochemical Parameters Prediction and Authentication of Different Monofloral Honeys Based on FTIR Spectra. J. Food Compos. Anal. 2021, 102, 104021. [Google Scholar] [CrossRef]
  57. Chirsanova, A.; Capcanari, T.; Boistean, A.; Siminiuc, R. Physico-Chemical Profile of Four Types of Honey from the South of the Republic of Moldova. Food Nutr. Sci. 2021, 12, 874–888. [Google Scholar] [CrossRef]
  58. Krishnasree, V.; Ukkuru, P.M. Quality Analysis of Bee Honeys. Int. J. Curr. Microbiol. Appl. Sci. 2017, 6, 626–636. [Google Scholar] [CrossRef] [Green Version]
  59. Silva, L.R.; Videira, R.; Monteiro, A.P.; Valentão, P.; Andrade, P.B. Honey from Luso region (Portugal): Physicochemical characteristics and mineral contents. Microchem. J. 2009, 93, 73–77. [Google Scholar] [CrossRef]
  60. Suárez-Luque, S.; Mato, I.; Huidobro, J.F.; Simal-Lozano, J. Capillary zone electrophoresis method for the simultaneous determination of cations in honey. J. Chromatogr. A 2005, 1083, 193–198. [Google Scholar] [CrossRef] [PubMed]
  61. Mendes, E.; Brojo, P.E.; Ferreira, I.; Ferreira, M.A. Quality evaluation of Portuguese honey. Carbohydr. Polym. 1998, 37, 219–223. [Google Scholar] [CrossRef]
  62. Al, M.L.; Daniel, D.; Moise, A.; Bobis, O.; Laslo, L.; Bogdanov, S. Physico-Chemical and Bioactive Properties of Different Floral Origin Honeys from Romania. Food Chem. 2009, 112, 863–867. [Google Scholar] [CrossRef]
Figure 1. Geographical origin of the studied honey samples.
Applsci 12 00629 g001
Figure 2. Summary of the values shown for free acidity, HMF, and soluble solids.
Applsci 12 00629 g002
Table 1. Compositional criteria of honey.
Directive 2001/110 EU
Composition Criteria Blossom HoneyHoneydew
Honey *
GeneralExceptionGeneralRevised CODEX 2001
Moisture %<20Calluna and baker’s honey < 23 Baker’s from
Calluna < 25
<20The same No indication for baker’s honey
Fructose + glucose %Sucrose %>60
<5
Robina, Medicogo, Banksia, Hedysarum, Eucaliptus, Eucryphiaspp, and Citrus <10 Lavandula & Borogo < 15>45
<5
The same
The same
Water-insoluble%<0.1Pressed honey < 0.5<0.1The same
Electrical conductivity mS. Cm¹<0.8Chestnut, Arbutus, Erica, Eucolyptus, Tilia, Calluna, Manuka and Melaleuca<0.8The same
Free acid meq. kg¹ <50Baker’s honey < 50<50The same
Diastase activity DN **>8Baker’s honey and honey with low natural enzyme content > 8 when HMF is less than 15 mg.kg¹>8Honeys with low natural enzyme cintent > 3 DN
HMF mg.kg¹ **<50baker’s honey Honeys of tropical climate and blenda of these honey < 80<40Honeys with low natural enzyme vontent > 3 DN. Honeys of tropical climate and blends: <80
* Honeydew honey and blends of honeydew honey with blossom honey. ** Determined after processing and blending.
Table 2. Physicochemical parameters of Kosovo’s honey samples (KH).
SampleType of HoneyMoisture
(%)
pHEC (mS/cm)Free Acidity (meq/kg)HMF (mg/kg)Protein
(%)
Soluble Solids Content
°Brix
Ash
(%)
KH 1Flower 17.764.070.2528.0018.310.3080.200.15
KH 2Forest 15.173.900.5850.90 **11.260.3881.900.57
KH 3Acacia 18.633.630.2446.2021.740.2878.60 ***0.14
KH 4Forest 16.803.760.1216.6061.33 *0.2081.000.01
KH 5Mixed 16.473.940.4657.20 **14.000.3982.500.20
KH 6Flower 19.003.600.2238.008.330.3279.70 ***0.06
KH 7Forest 18.803.940.5056.20 **11.500.4078.80 ***0.22
KH 8Acacia16.504.140.4035.6048.52 *0.2380.200.41
KH 9Forest 16.804.490.6538.0015.930.3181.000.59
KH 10Flower 18.453.720.2553.00 **9.220.4179.70 ***0.17
KH 11Flower 17.603.560.2138.7034.210.2679.60 ***0.02
KH 12Mixed 14.503.800.1123.90166.4 *0.2283.200.07
KH 13Mixed15.603.810.4134.2030.240.3381.600.16
KH 14Flower15.104.150.6951.40 **16.101.2682.000.75
KH 15Forest18.303.580.1832.7014.620.2878.60 ***0.39
KH 16Mixed 14.903.590.1740.2012.540.2782.700.08
KH 17Acacia15.564.220.4165.20 **122.34 *0.6281.800.76
KH 18Forest 15.463.740.2438.0017.300.2881.400.16
KH 19Forest 15.264.200.5256.10 **8.670.4383.200.26
KH 20Acacia 14.603.810.3156.30 **11.420.4382.300.14
KH 21Flower 16.703.870.6342.5028.740.4080.400.06
KH 22Flower 16.804.110.3435.9020.070.4081.000.13
KH 23Forest 16.673.990.4454.90 **21.400.2880.900.15
KH 24Mixed 17.633.550.3169.00 **20.501.9080.300.07
KH 25Forest 15.954.340.7361.50 **8.120.4081.500.42
KH 26Mixed 15.803.770.3962.10 **7.410.5382.300.10
KH 27Mixed 15.604.110.7560.50 **30.100.7582.500.41
KH 28Flower 15.324.020.6355.40 **18.570.5282.900.21
KH 29Chestnut 18.504.340.57 34.3026.320.2979.20 ***0.07
KH 30Flower 17.353.920.3640.2028.040.3180.000.23
KH 31Flower17.443.520.2649.0021.790.6681.400.26
KH 32Mixed16.633.550.3049.4038.040.3880.100.10
KH 33Flower14.004.050.2945.4049.88 *0.2883.500.45
* HMF > 40 mg/kg. ** FA > 50 meq kg−1. *** Soluble solids < 80 °Brix.
Table 3. Physicochemical parameters of imported honey samples (IH).
SampleType of HoneyMoisture
(%)
pHEC (mS/cm)Free Acidity (meq/kg)HMF (mg/kg)Protein
(%)
Soluble Solids Content
°Brix
Ash
(%)
IH 1Acacia17.363.910.0721.5046.21 *0.2181.700.06
IH 2Forest 16.054.320.6018.4028.250.4882.000.53
IH 3Acacia16.844.050.1020.2031.810.1381.300.05
IH 4Flower 17.263.650.0931.8018.370.0180.200.01
IH 5Acacia16.853.880.1136.8036.610.3781.200.01
IH 6Acacia15.233.920.1330.6067.25 *0.1982.200.02
IH 7Flower 16.003.960.1068.60 **33.720.1181.100.03
IH 8Chestnut 17.005.021.0220.5012.331.1680.900.60
IH 9Flower 17.453.830.1624.209.200.2079.50 ***0.01
IH 10Flower 16.383.830.1427.4031.167.6881.400.07
IH 11Chestnut 16.544.170.5152.30 **40.25 *1.4181.300.53
IH 12Forest 16.303.510.0825.5062.00 *0.1381.400.01
* HMF > 40 mg/kg. ** FA > 50 meq kg−1. *** Soluble solids content < 80 °Brix.
Table 4. Physicochemical parameters of Kosovo’s and imported honey samples.
Total
Samples
(n = 45)
Moisture
(%)
phEC
(mS/cm)
Free Acidity
(meq/kg)
HMF
(mg/kg)
Protein
(%)
Soluble Solids
Content
°Brix (%)
Ash
(%)
Mean ± SD
(min−max)
Mean ± SD
(min−max)
Mean ± SD
(min−max)
Mean ± SD
(min−max)
Mean ± SD
(min−max)
Mean ± SD
(min−max)
Mean ± SD
(min−max)
Mean ± SD
(min−max)
* KH Samples
(n = 33)
16.53 ± 1.35
(14.00−19.00)
3.90 ± 0.25
(3.32−4.02)
0.39 ± 0.18
(0.12−0.75)
45.95 ± 12.30
(23.90−69.00)
29.48 ± 32.26
(7.41−166.43)
0.44 ± 0.32
(0.20−1.90)
81.09 ± 1.37
(78.60−83.50)
0.24 ± 0.20
(0.01−0.76)
** IH samples
(n = 12)
16.60 ± 0.60
(15.23−17.45)
4.00 ± 0.36
(3.51−5.02)
0.26 ± 0.28
(0.07−1.02)
31.48 ± 14.33
(18.40−68.60)
34.76 ± 16.96
(9.20−67.25)
1.00 ± 2.05
(0.01−7.68)
81.18 ± 0.70
(79.50−82.20)
0.16 ± 0.02
(0.01−0.60)
>p > 0.05p > 0.05p < 0.05p < 0.05p > 0.05p > 0.05p > 0.05p > 0.05
* KH—Kosovo’s honey. ** IH—Imported honey.
Publisher’s Note: MDPI stays neutral with regard to jurisdictional claims in published maps and institutional affiliations.

