Article

Isolation of Pseudomonas Strains with Potential for Protection of Soybean Plants against Saline Stress

by
Stefanie Bernardette Costa-Gutierrez
1,†,
María Carolina del Valle Caram-Di Santo
1,
Ana María Zenoff
1,
Manuel Espinosa-Urgel
2,
Ricardo Ezequiel de Cristóbal
1,* and
Paula Andrea Vincent
1,*
1
Facultad de Bioquímica, Química y Farmacia, Instituto Superior de Investigaciones Biológicas (INSIBIO, CONICET-UNT) e Instituto de Química Biológica “Dr. Bernabé Bloj”, Universidad Nacional de Tucumán, Chacabuco 461, San Miguel de Tucumán 4000, Tucumán, Argentina
2
Department of Environmental Protection, Estación Experimental del Zaidín, CSIC, Profesor Albareda 1, E-18008 Granada, Spain
*
Authors to whom correspondence should be addressed.
Stefanie Bernardette Costa-Gutierrez Present address: Planta Piloto de Procesos Industriales Microbiológicos (PROIMI-CONICET), Avenida Belgrano y Pasaje Caseros, San Miguel de Tucumán 4000, Tucumán, Argentina.
Agronomy 2021, 11(11), 2236; https://doi.org/10.3390/agronomy11112236
Submission received: 25 August 2021 / Revised: 11 October 2021 / Accepted: 12 October 2021 / Published: 4 November 2021

Abstract

:
Salinity is a major detrimental factor for plant growth and crop productivity that could be alleviated by the use of plant growth promoting bacteria (PGPB) with a protective role in such stressful conditions. In this study, four native strains of the genus Pseudomonas were isolated from both a strongly saline soil and the rhizosphere of soybean plants grown in a slightly saline soil. These isolates were able to tolerate high NaCl concentration, showed efficient adhesion to biotic and abiotic surfaces and efficiently colonized the rhizosphere of soybean grown in slightly saline soil. In these conditions, the four strains outperformed Pseudomonas putida KT2440, a strain known as a good root colonizer of different plants. Inoculation with all the isolates improved seed germination and vigor index, particularly in saline conditions, and one of them also had a positive effect on shoot length and phenological state of soybean plants grown in slightly saline soil. Our results suggest that the search for classical plant growth promotion traits may not be mandatory for selecting putative PGPB. Instead, characteristics such as stress tolerance, adhesion, competitive colonization, and plant growth promotion should be tested using the soil types and crops in which the bacteria will be used.

1. Introduction

Soybean (Glycine max (L.) Merrill) is the most widely produced and consumed oilseed crop worldwide. Soybeans and their by-products are used in human and livestock feed. The main constraint to its cultivation is drought, which is closely related to soil salinity; seedlings are considered a salt-sensitive to moderately salt-tolerant crop [1]. Salinity stress has detrimental effects on soybean, such as inhibition of seed germination, reduction of growth, nodulation, biomass accumulation, and yield [2,3]. Soil salinization, often caused by poor land management, is one of the main problems affecting crop productivity and is expected to cause the loss of almost 50% of the total agricultural land area by 2050 [4,5]. In a context of climate change, this situation, coupled with population increase, makes guaranteeing global food supply one of the greatest challenges to face in the near future [6]. In addition to education and training efforts to ensure proper land management by producers, alternatives strategies are required for improving crop productivity in salinity-affected lands.
In 1978, Kloepper and Schroth popularized the term PGPR (plant growth-promoting rhizobacteria) to describe root-associated and rhizosphere bacteria capable of acting as biofertilizers or biocontrol agents [7]. Since not only rhizobacteria but also some soil bacteria and endophytes have been shown to have these capabilities, the broader term PGPB (plant growth-promoting bacteria) is now frequently used [8]. Among these beneficial bacteria, some can enhance plant growth under abiotic stress conditions such as salinity and drought, and have given rise to the term IST (induced systemic tolerance) [9]. Different bacterial genera have been proposed to alleviate salt stress in plants, such as Agrobacterium [10], Arthrobacter [11], Azotobacter [12], Azospirillum [13], Bacillus [14], Burkholderia [14], Klebsiella [15], Pseudomonas [16,17], Rhizobium [18], and Serratia [19].
Traditionally, the study of putative PGPB begins with the isolation of bacteria (from the soil or rhizosphere) and screening for plant growth promotion traits under in vitro conditions [15,16,17]. These traits include direct and indirect mechanisms, such as the synthesis of phytohormones [20], nutrient solubilization and uptake [21,22], biological nitrogen fixation [22], and siderophore production [23]. Subsequently, the bacteria with the highest number of desirable traits are selected to evaluate their plant growth promoting effect under axenic conditions [24]. So far, the development of alternative screening methods that allow the identification of putative PGPB without resorting to classical PGP traits has received very little attention [25,26]. Some reports have suggested that the potentially useful activities of PGPBs must be accompanied by efficient rhizosphere colonization and persistence of the bacteria under field conditions for effective use of these microorganisms as bioinoculants [26,27]. Thus, traits related to bacterial fitness in the environmental settings in which they will be applied must be considered an intrinsic part of the selection process for PGPBs.
In the present work we have isolated native salt-tolerant bacteria of the genus Pseudomonas from a strongly saline soil and from the rhizosphere of soybean plants grown in a slightly saline soil. Strains were identified by 16S rRNA sequencing and further evaluated in terms of their salt tolerance, adherence to biotic and abiotic surfaces, fitness in the soybean rhizosphere, and plant growth promotion in slightly saline soils. This approach shows promising results for the identification and further exploitation of PGPBs for the development of bioinoculants.

2. Materials and Methods

2.1. Soil Sampling and Bacterial Isolation

Soil samples were collected from an agricultural area of soybean monoculture in Leales, Eastern Tucumán, Argentina (27°16′52″ S 65°01′08″ W). Two saline soil samples were collected at a depth of 10 cm. Soil sample 1 was collected from an elevated zone of the field, while soil sample 2 was collected from a lower zone of the same field. A non-saline soil sample was also collected from the same area. The physical and chemical characteristics of the soil samples were analyzed by Laboratory PH7 Diagnóstico Agrícola (Tucumán, Argentina) and are summarized in Table 1.
Bacterial isolation was carried out from saline soil samples and from the rhizosphere of soybean plants. To isolate soil bacteria, 0.5 g of each sample was suspended in 1.5 mL saline solution (NaCl 0.9% w/v) and 100 µL of 10-fold serial dilutions were plated on the media described below. Soybean-associated rhizosphere bacteria were isolated as follows. Seeds (Glycine max, variety A8000) were kindly provided by Dr. Mariano Pardo (Obispo Colombres Agroindustrial Experimental Station, Tucumán, Argentina). The seeds were surface disinfected by immersion in ethanol (70% v/v) for 30 s, followed by rapid rinsing with sterile distilled water, immersion in sodium hypochlorite (20% v/v) for 30 s, and finally rinsing with abundant distilled water [28]. All trials requiring soybean cultivation used the saline soil with the lowest EC value (Table 1), since it allows soybean growth despite salinity. Thus, disinfected seeds were sown in plastic pots containing 0.5 kg of non-sterile slightly saline soil. Plants were grown under controlled conditions in a Panasonic Versatile Environmental Test Chamber (MLR-352H), at 24 °C and 70% humidity with a daily light period of 16 h. Plants were irrigated periodically with sterile distilled water for 15 days. Subsequently, they were carefully removed and their roots placed in sterile 50 mL tubes containing 4 g of glass beads and 3 mL of saline solution. Tubes were vortexed for 2 min to remove bacteria attached to the root and 100 µL of 10-fold serial dilutions of the suspension were plated on Petri dishes with different culture media with and without 0.8 M NaCl: Luria-Bertani (LB) 1× and 0.1× (10-fold diluted); M9 medium supplemented with glucose, sodium citrate, or sodium benzoate (final concentration 0.2% w/v); and a modified S1 medium for Pseudomonas, lacking trimethoprim [29]. Plates were incubated at 30 °C for 48 h, the number of colonies was quantified and fluorescence was observed under UV light. Then, Pseudomonas strains were isolated using modified S1 medium.

2.2. Taxonomical Identification of the Isolates

The isolated bacteria were identified by 16S rDNA analysis. Universal primers 27F (5′-AGAGTTTGATCMTGGCTCAG-3′) and 1492R (5′-GGTTACCTTGTTACGACTT-3′) were used for PCR amplification and sequencing in the conditions previously described [30]. Sequences were analyzed with DNAMAN and the MOLE-BLAST tool of the National Center for Biotechnology Information (NCBI; https://blast.ncbi.nlm.nih.gov/Blast.cgi, accessed on 4 October 2021). Sequences have been deposited in GenBank with accession numbers MZ020813 (EFY1), MZ020969 (EFY2), MZ020970 (EFY3), and MZ020971 (EFY4).
The evolutionary history was inferred using the neighbor-joining method [31]. The optimal tree with the sum of branch length = 0.14652826 is shown. The tree is drawn to scale, with branch lengths in the same units as those of the evolutionary distances used to infer the phylogenetic tree. The evolutionary distances were computed using the maximum composite likelihood method [32] and are in the units of the number of base substitutions per site. All positions containing gaps and missing data were eliminated. There were a total of 1372 positions in the final dataset. Evolutionary analyses were conducted in MEGA7 [33].

2.3. Salinity Tolerance

To test the salinity tolerance of the isolates, overnight cultures were diluted to an optical density (OD600) of 0.5 and 50 µL of the bacterial suspensions were inoculated in Erlenmeyer flasks containing 20 mL of LB medium with and without 0.8 M NaCl. Flasks were incubated at 30 °C with constant agitation and OD600 was measured every hour for 10 h and a final point at 24 h, using a Perkin-Elmer Lambda 20 spectrophotometer. Flasks with LB + 0.8 M NaCl medium were incubated up to 72 h. Alternatively, overnight cultures were diluted to an optical density (OD600) of 1.0 and 10-fold serial dilutions (10 µL) were spotted on LB plates with and without 0.8 M NaCl. The plates were incubated at 30 °C for 24 h and growth was visually inspected. Pseudomonas putida KT2440 was used as a positive control in these experiments.
Additionally, bacterial survival was evaluated in a solution obtained from the strongly saline soil sample. The solution was prepared following the protocol provided by Walter and colleagues [34] with modifications. Briefly, 25 g of the strongly saline soil sample was suspended in 100 mL of sterile distilled water. The suspension was filtered through sterile gauze and centrifuged at 8000 rpm for 15 min. Then, the solution was filtered under vacuum through a 0.22 µm filter. The resulting solution had an EC value of 4.2 dS/m and a pH of 7.4 and was used to test long-term survival of the bacteria. Erlenmeyer flasks containing 20 mL of the soil solution were inoculated with bacterial suspensions (6 × 10⁶ CFU/mL) and incubated at 30 °C with constant agitation for 12 days, after which 10-fold serial dilutions were plated in LB and CFU/mL were quantified.

2.4. Exopolysaccharide (EPS) Production, Bacterial Surface Adhesion, Colonization and Competition in Rhizosphere

EPS production was tested using Congo red staining. Overnight cultures were diluted to an OD600 = 0.05 and 5 µL were spotted on LB plates supplemented with Congo red (40 µg/mL), with and without 0.5 M NaCl [16]. The plates were incubated at 30 °C for 48 h. Colonies were evaluated according to morphology and color [35].
Biofilm formation was evaluated during growth in 96-well polystyrene microtiter plates (Sorfa Life Science Research), using the protocol described by O’Toole and Kolter [36]. Biofilm formation was tested in LB and LB + 0.3 M NaCl [16]. Overnight cultures grown in the evaluated media were diluted to an OD600 of 0.1 and placed in the wells. The plates were incubated at 30 °C without agitation and biofilm formation was quantified at the indicated times by staining with crystal violet (0.4%), solubilizing the dye with 30% glacial acetic acid and measuring absorbance at 540 nm.
Bacterial adhesion to soybean seeds was also tested, as previously described [16]. Bacteria were cultured in M9 medium supplemented with glucose and diluted to an OD600 of 1 (equivalent to 109 CFU/mL). Bacterial suspensions were used to inoculate disinfected soybean seeds by immersion for 2 min. Unattached bacteria were removed from the surface of the inoculated seeds by brief rinsing with distilled water. Seeds (N = 10) were placed into sterile 50 mL tubes containing 10 mL of saline solution and 4 g of glass beads (diameter, 3 mm). Attached bacteria were removed by vortexing the tubes for 2 min. The suspensions were serially diluted and plated on M9 medium supplemented with sodium citrate. The plates were incubated at 30 °C for 24 h and the number of cells was quantified.
A second group of inoculated seeds (N = 5) was sown in pots (0.5 kg) containing sterile sand and pots containing sterile slightly saline soil samples. The soil was sterilized by three successive sterilizations in autoclave (121 °C for 20 min) every 24 h. Seedlings were periodically watered with sterile 80 mM NaCl saline solution (pots with sand) or sterile distilled water (pots with slightly saline soil). The pots were maintained under controlled conditions as described above. Ten days after sowing, the soybean seedlings were gently removed from the soil. Roots were cut and transferred to 50 mL tubes containing 10 mL of saline solution and 4 g of glass beads. Root-associated bacteria were removed and evaluated as above.
Additionally, competitive colonization between each isolate against P. putida KT2440 was evaluated in the soybean rhizosphere. For this, tetracycline resistance mutants of the isolates were used. The mutants were performed by triparental mating using mini-Tn7-Tc transposon carrying a tetracycline resistance marker [37] following the protocol previously described [38]. A rifampicin-resistant strain of P. putida KT2440 was also used [16]. Disinfected soybean seeds were co-inoculated with 109 CFU/mL of each tetracycline-resistant isolate and the P. putida KT2440-Rifr strain, both in the same proportion (1:1 v/v) [16]. The soybean seedlings were grown in the two different substrates described above. Ten days after sowing, the seedlings were removed from the soil, roots were cut and processed as previously described. The bacterial suspensions obtained were serially diluted and plated on M9 medium supplemented with sodium citrate with Rif or Tc (Sigma-Aldrich, Shanghai, China), as appropriate.

2.5. Plant Growth Promotion in Slightly Saline Soil

Plant growth promotion assays were performed in slightly saline and non-saline soils (Table 1). Seeds were disinfected and inoculated with each isolate or with P. putida KT2440 as described above. Inoculated and non-inoculated (control) seeds (N = 25) were sown in pots containing 1.5 kg of non-sterile soil and plants were grown under the controlled conditions described above for 21 days, irrigated with distilled water on demand. After that time, the total length of the plants was measured, their phenological state was determined based on leaf development, the percentage of germinated seeds (germination rate) was quantified, and the vigor index (VI) was calculated using the following equation [39]: V I = T L   ×   G 10 , where G is the germination rate and TL the total plant length. Two independent experiments were performed for each treatment.

2.6. Statistical Analysis

All results correspond to three independent experiments, with three technical replicates each, unless otherwise indicated, and are expressed as mean values ± standard error. One-way ANOVA (Tukey’s test, p < 0.05) was applied, using MINITAB statistical software (version 17 for Windows), to detect significant differences among the bacteria evaluated, taking into account that a p value < 0.05 was considered statistically significant.

3. Results and Discussion

3.1. Soil Characteristics, Bacterial Isolation, and Selection of Isolates

Table 1 provides the physicochemical characteristics of the soil samples (two saline and one non-saline) used in this work. The texture of the evaluated soils was silty loam and their pH values were 8.4, 8.8, and 8.1 for slightly saline soil, strongly saline soil, and non-saline soil, respectively. The electrical conductivity (EC) values of the saline soils is extremely different (1.5 and 29.8 dS/m), due to the natural slope of the field which favors the accumulation of soluble salts after irrigation and rainfall. According to FAO classification, the soil sample with the highest EC value can be considered as strongly saline soil, where agricultural activity is not suitable [40]. Although soils with EC ≤ 2 dS/m are not classified as saline, the saline soil with EC = 1.5 was considered a slightly saline soil due to the high Na+ content compared to the non-saline soil (Table 1), and the fact that many plant species decrease their productivity in such soil.
Bacterial isolation was performed from both saline soil samples and from the rhizosphere of soybean grown in slightly saline soil. The number of culturable bacteria obtained on each culture medium for each soil is presented in Table 2. The number of CFU per gram of slightly saline soil is in accordance with the value obtained in other silty loam soil [41]. As expected, the values obtained from the rhizosphere samples were in general higher than those from soil samples, the strongly saline soil sample showed the lowest number of culturable cells. This is in line with the idea that microbial abundance is higher in the rhizosphere due to nutrients provided by root exudates, but it may also indicate that the root offers a protective environment against saline stress. Interestingly, the number of culturable cells in the modified S1 selective medium was three and four orders of magnitude higher in the soybean rhizosphere sample than in the slightly and strongly saline soil samples, respectively. This suggests that fluorescent Pseudomonads are favored in the plant environment, in agreement with previous studies [42].
Using the modified S1 medium, four isolates were selected for further analysis, three obtained from the rhizosphere of soybean grown in the slightly saline soil (EFY1, EFY2, and EFY4) and one from the strongly saline soil (EFY3).

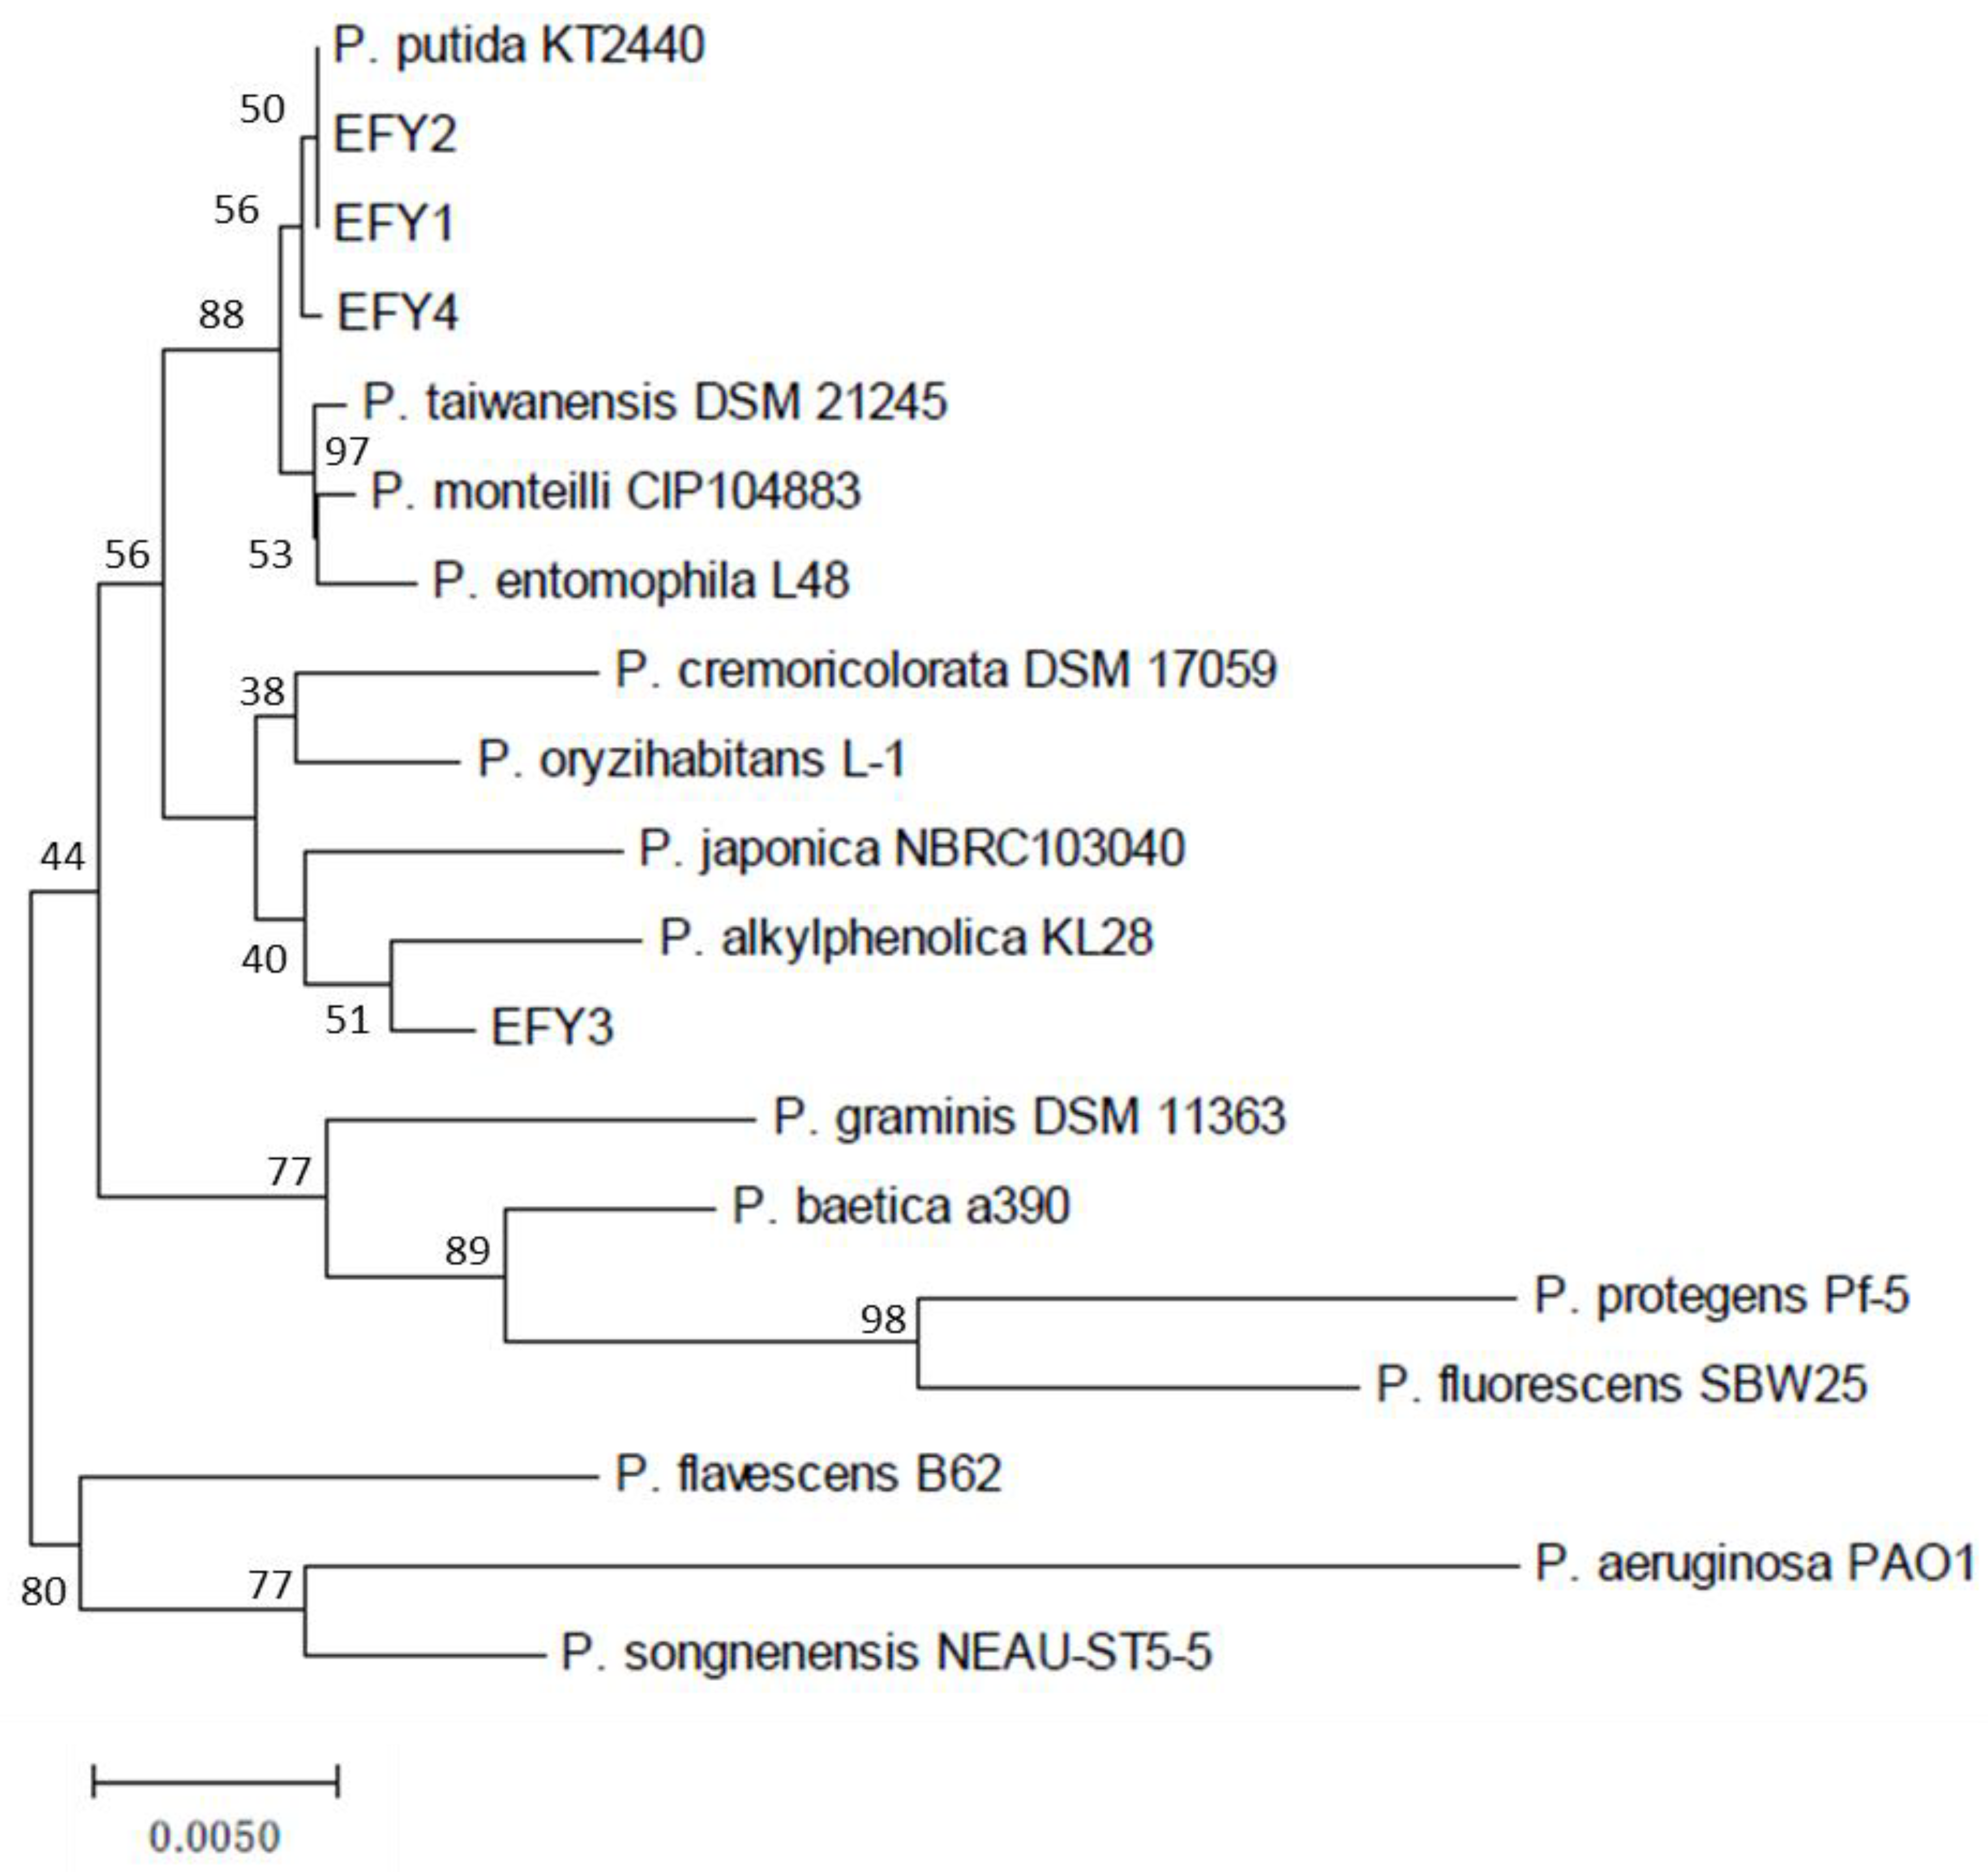
3.2. Identification of Pseudomonas Isolates

Amplification, sequencing and analysis of the 16S rDNA indicated that the four isolates belong to the genus Pseudomonas. The phylogenetic tree is shown in Figure 1. Results indicate that isolates EFY1, EFY2, and EFY4 are closely related to Pseudomonas putida KT2440, while EFY3 is the most divergent isolate of the four, being closely related to P. alkylphenolica KL25. Colony morphology and Congo red binding assays also evidenced the divergence between EFY3 and the other three isolates (Supplementary Material 2). Isolates EFY1, EFY2, and EFY4 showed similar colony morphology as P. putida KT2440, whereas EFY3 exhibited wrinkled colonies with higher color intensity, indicative of different composition of the extracellular polymeric matrix.

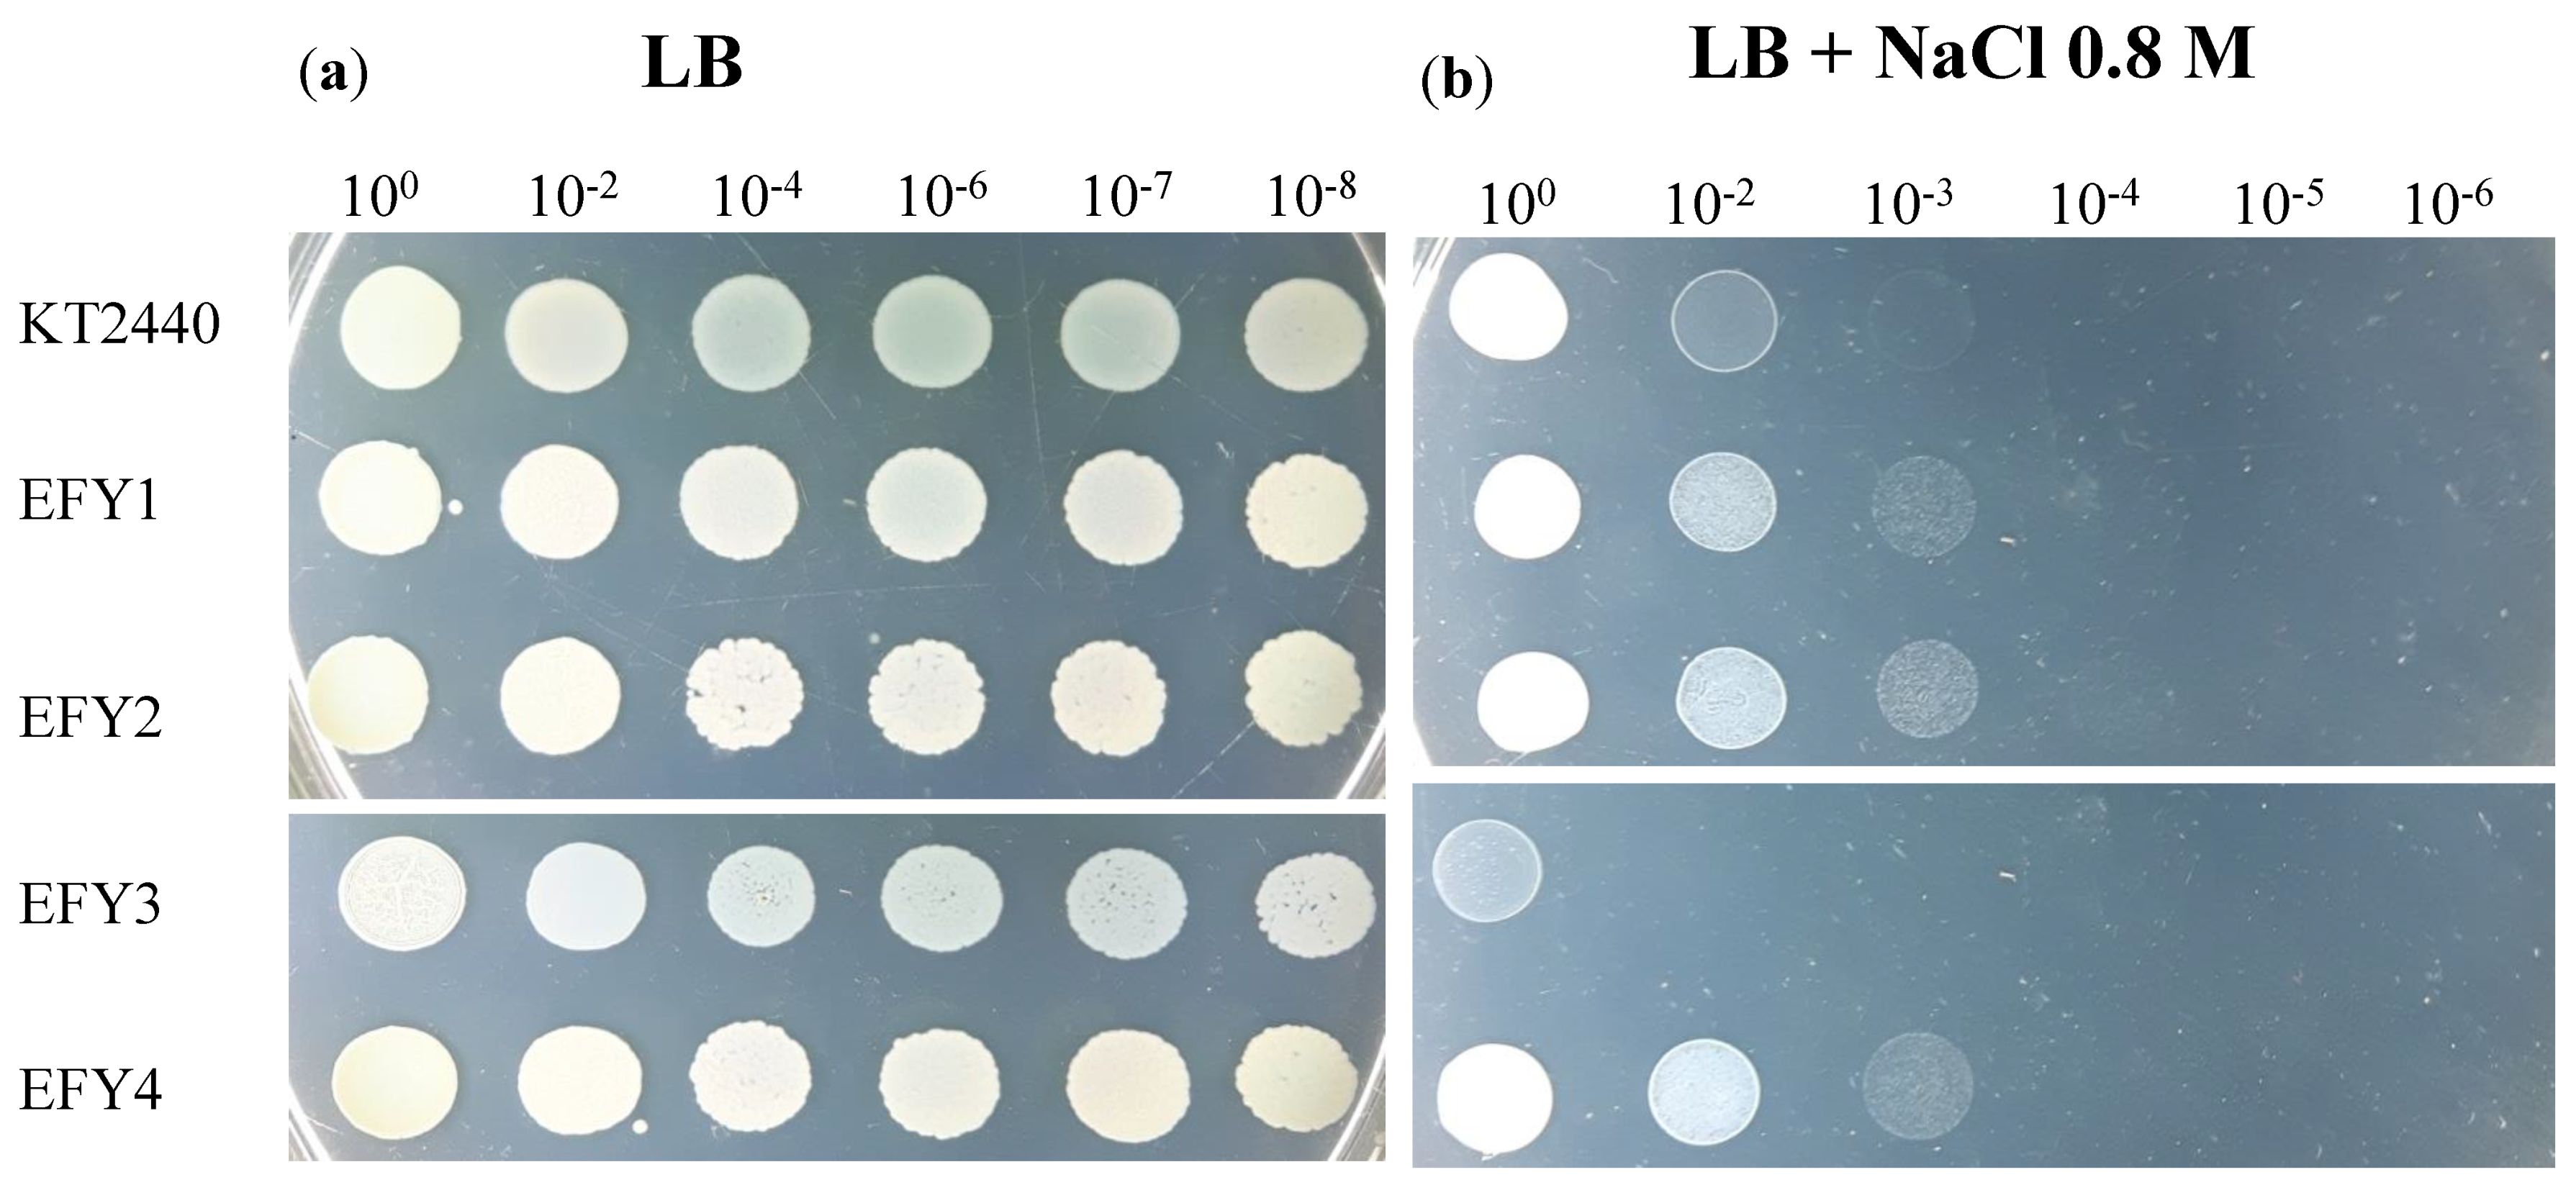
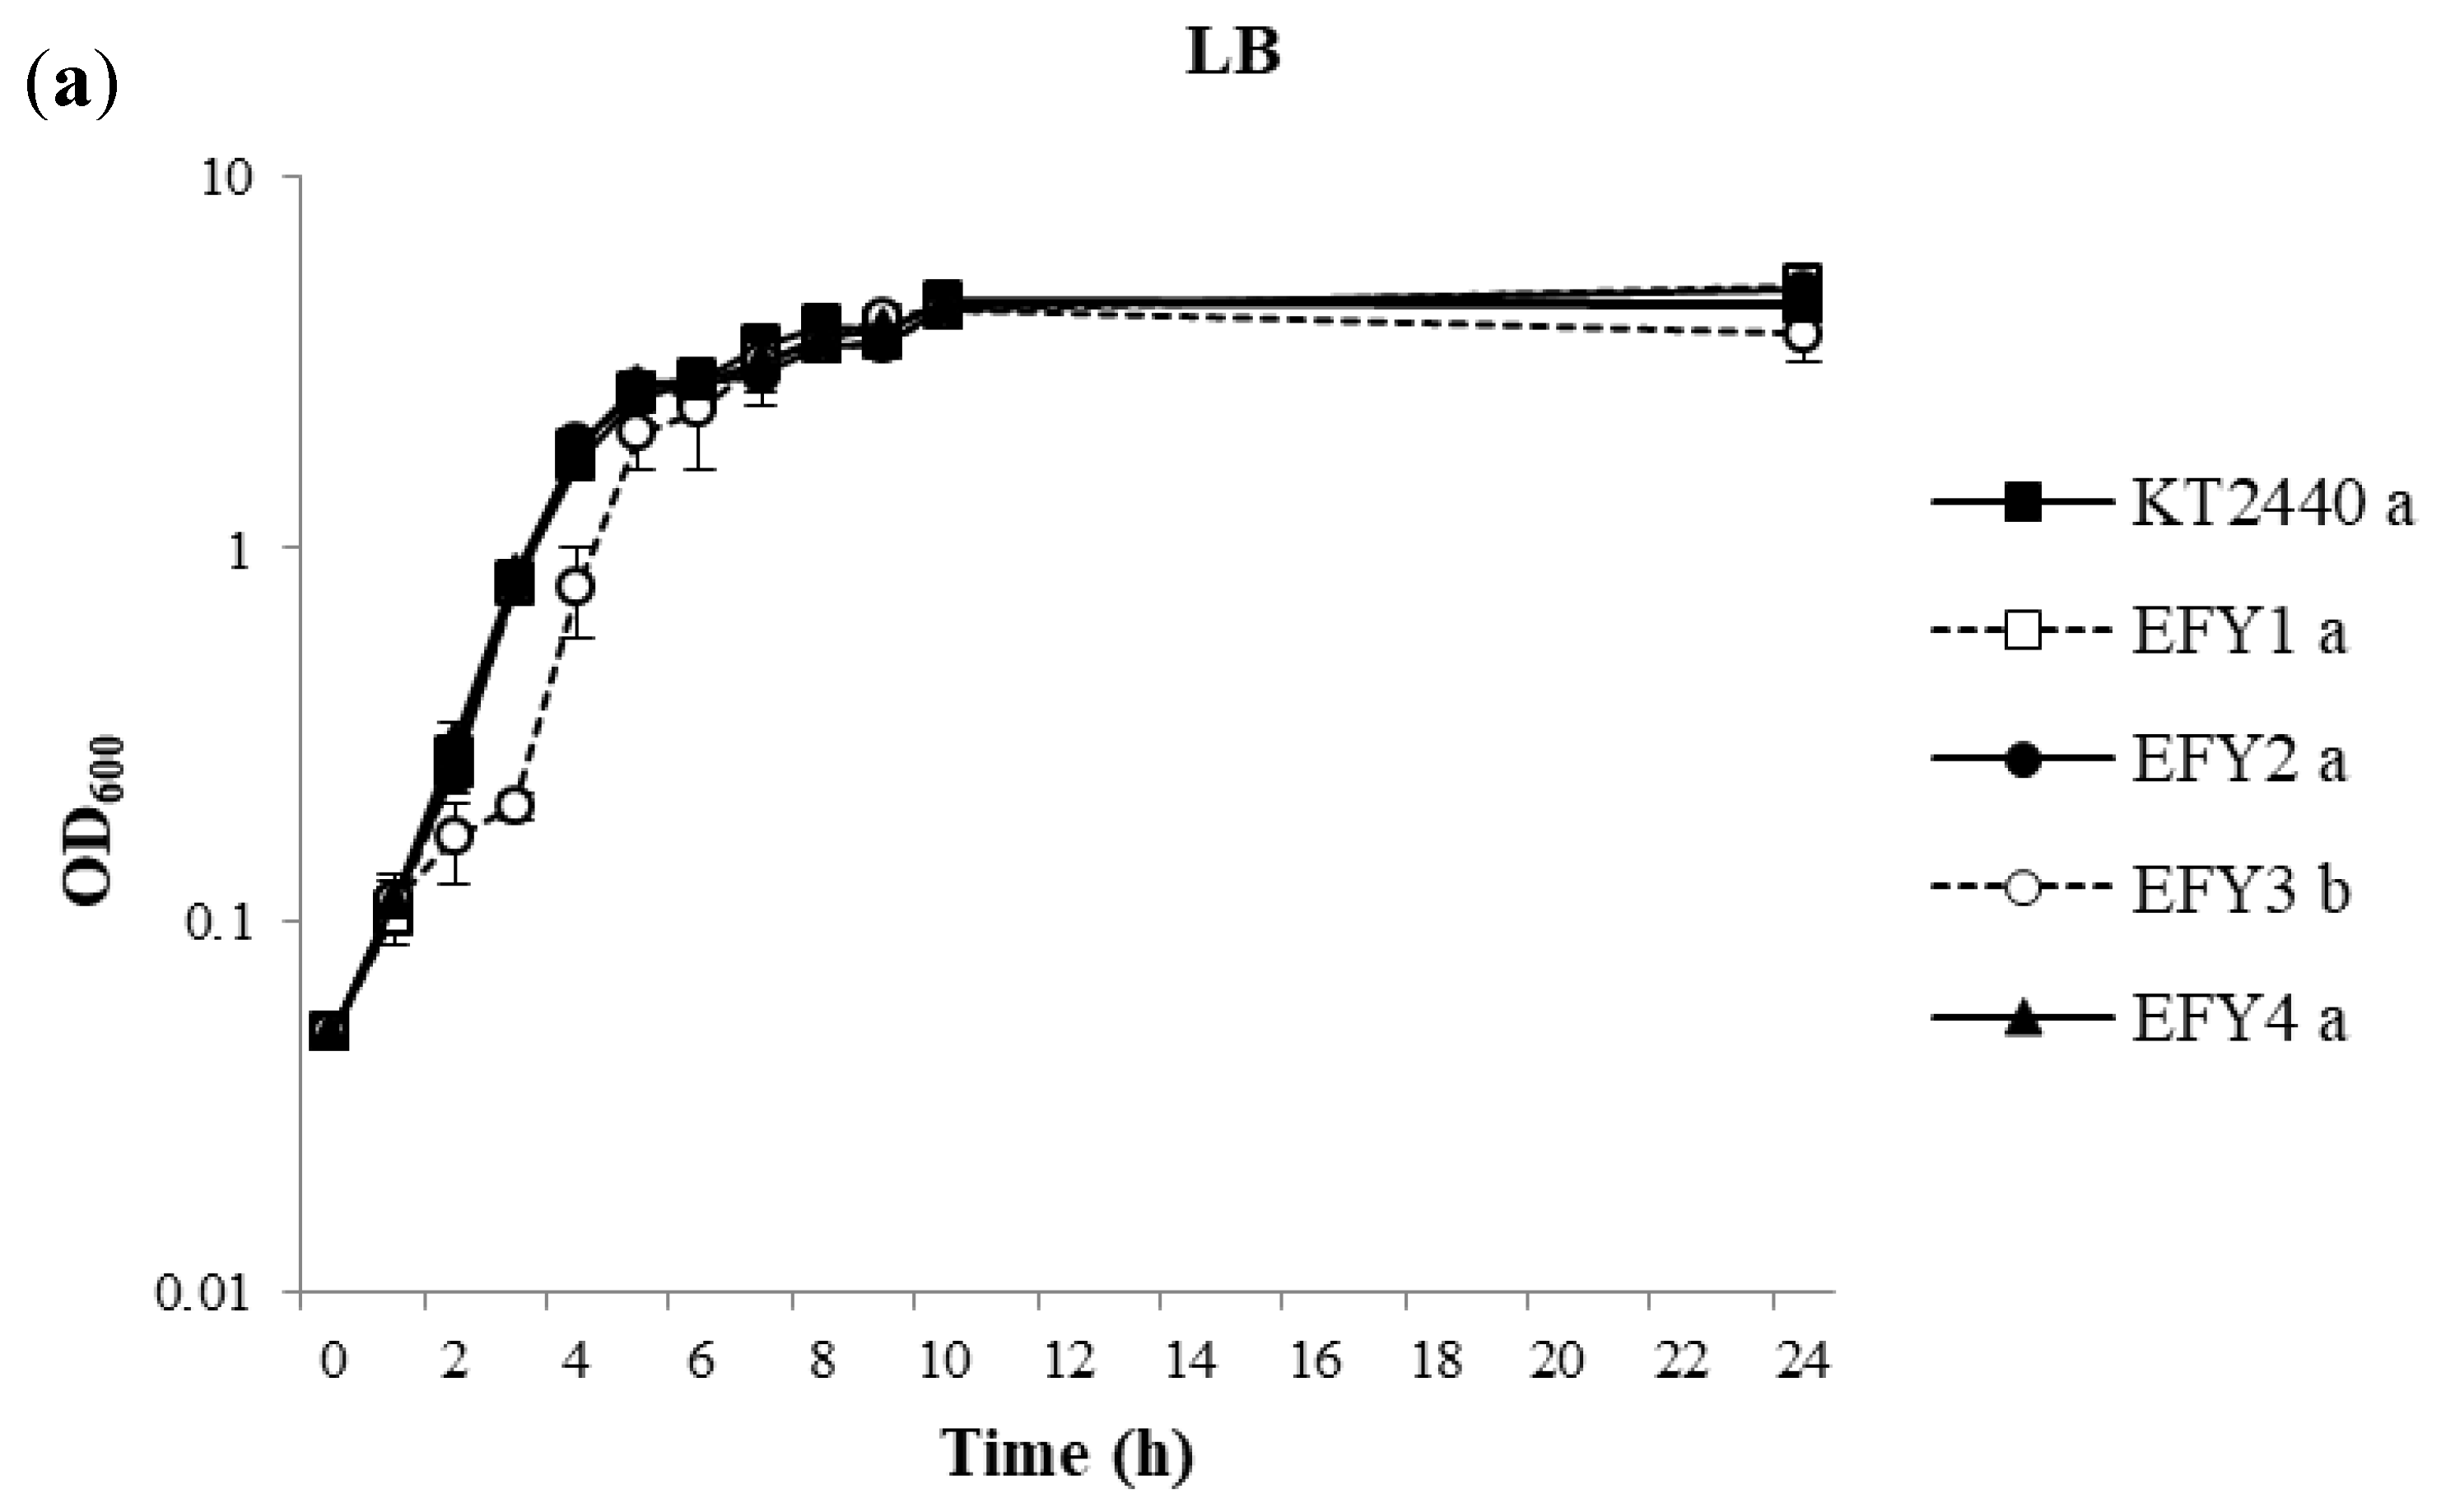
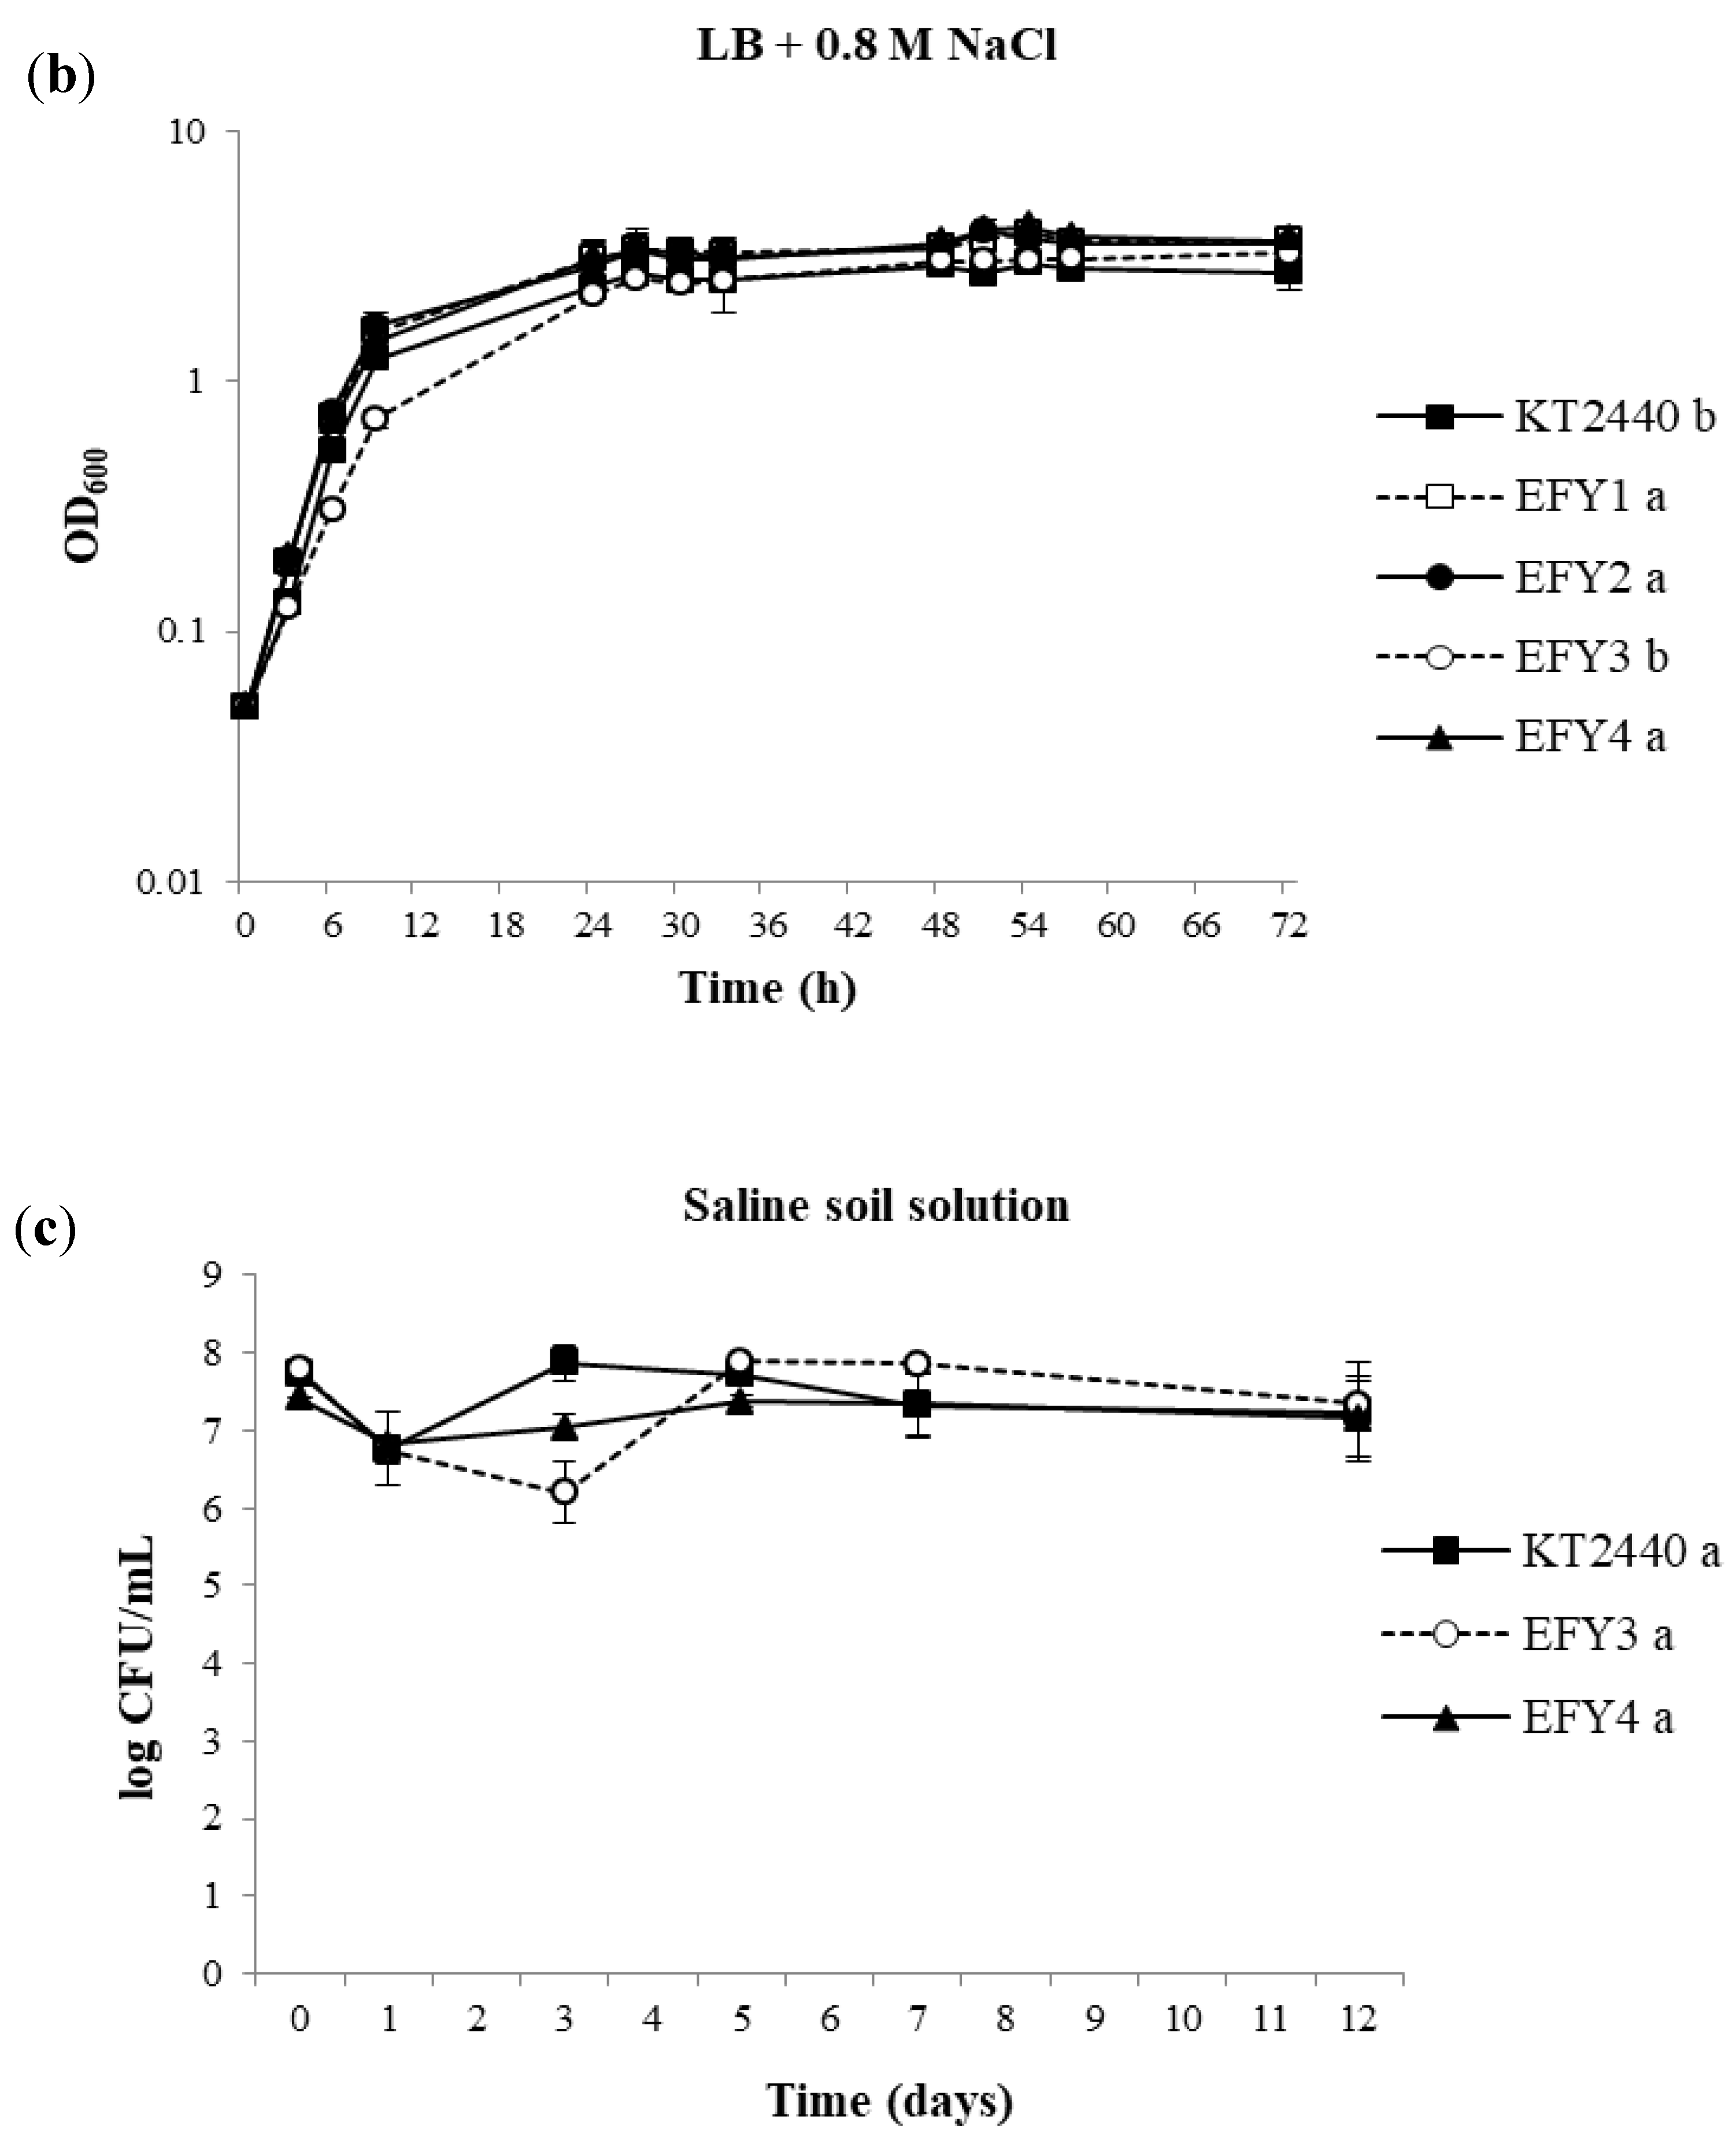
3.3. Salt Tolerance Assays

The growth of isolates was evaluated in solid and liquid media under saline and non-saline conditions. P. putida KT2440 was used as a control, since it can tolerate a saline stress concentration up to 0.8 M NaCl [43]. The evaluated bacteria showed similar growth in solid medium under non-saline conditions (Figure 2a), whereas in the presence of 0.8 M NaCl, EFY1, EFY2, and EFY4 grew notably better than P. putida KT2440 (Figure 2b). Surprisingly, EFY3 showed the lowest tolerance to 0.8 M NaCl (Figure 2b), despite being isolated from a highly saline environment. Experiments done in liquid LB medium with 0.8 M NaCl also showed a slightly reduced growth rate of this strain with respect to the others, an effect that was less evident in non-saline conditions (Figure 3a,b). One possible reason could be that EFY3 needs an “adaptation period” to a condition (rich medium) very different from its original one (strongly saline soil). With this in mind, survival of P. putida KT2440 and isolates EFY3 and EFY4 was evaluated using a sterile solution obtained from the strongly saline soil as described in Materials and Methods section. As shown in Figure 3c, a decrease in the number of recovered cells of EFY3 was observed until day 3, followed by an increase in growth so that after 12 days there were no significant differences between the evaluated strains.

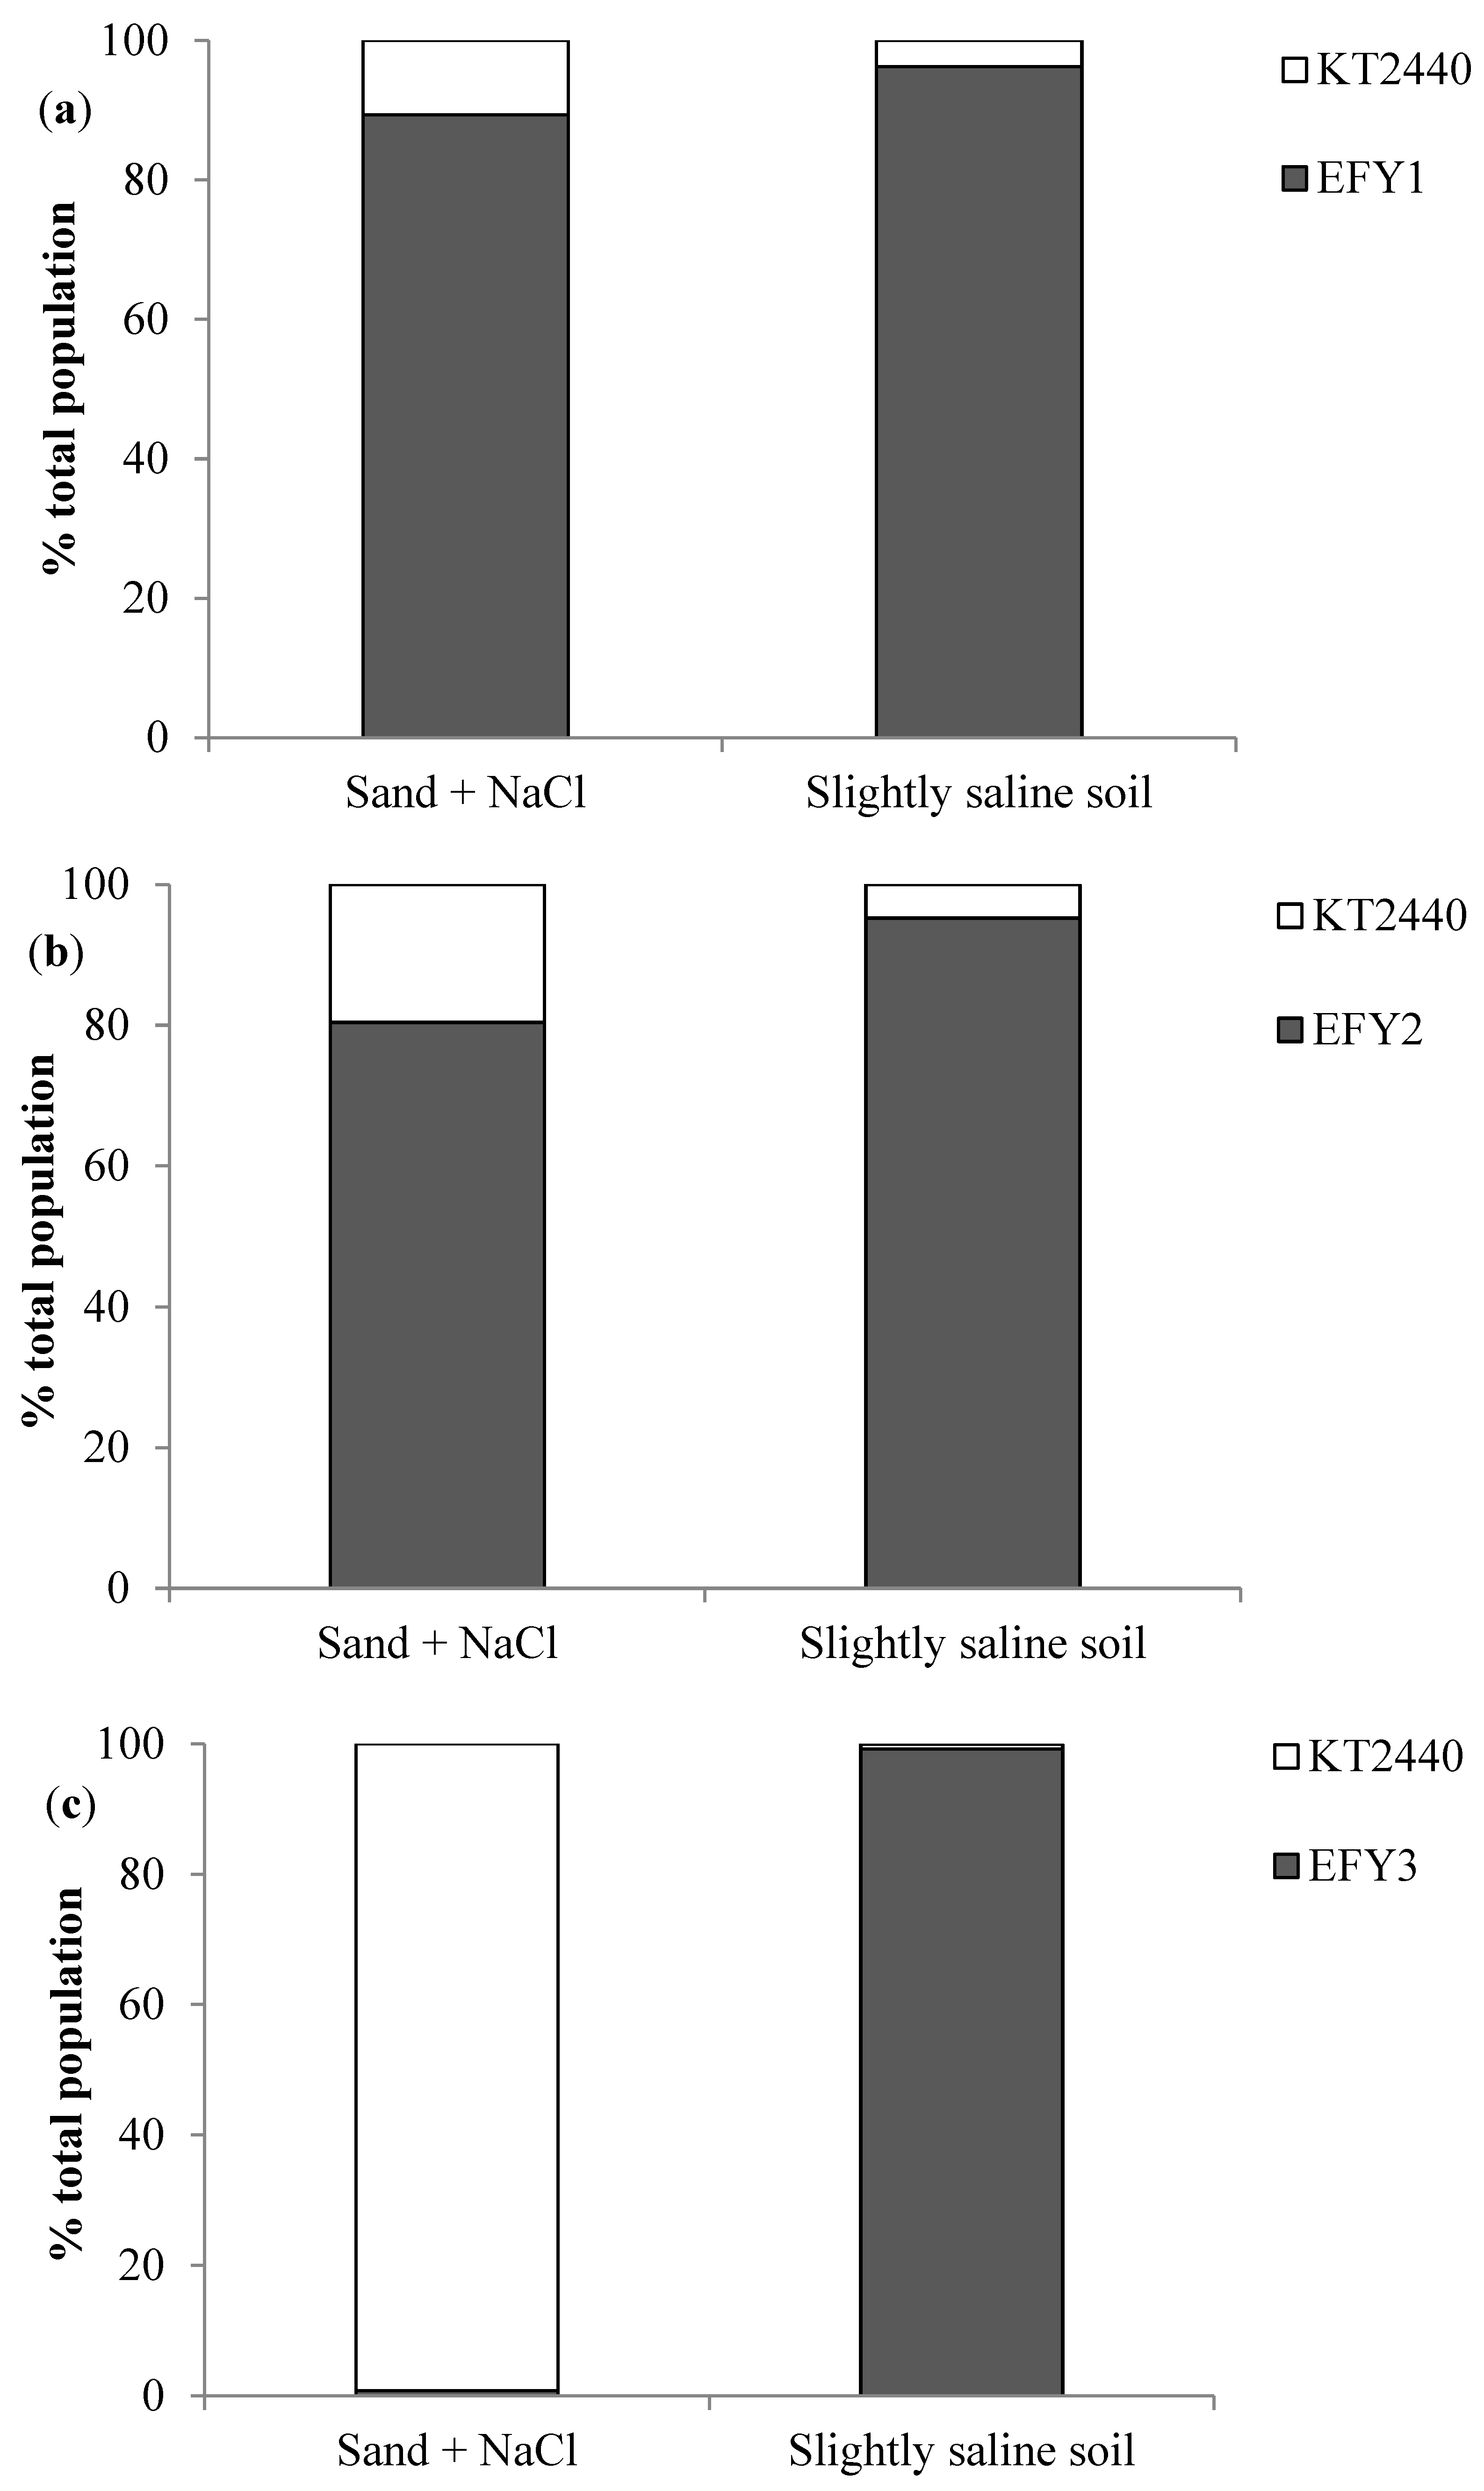
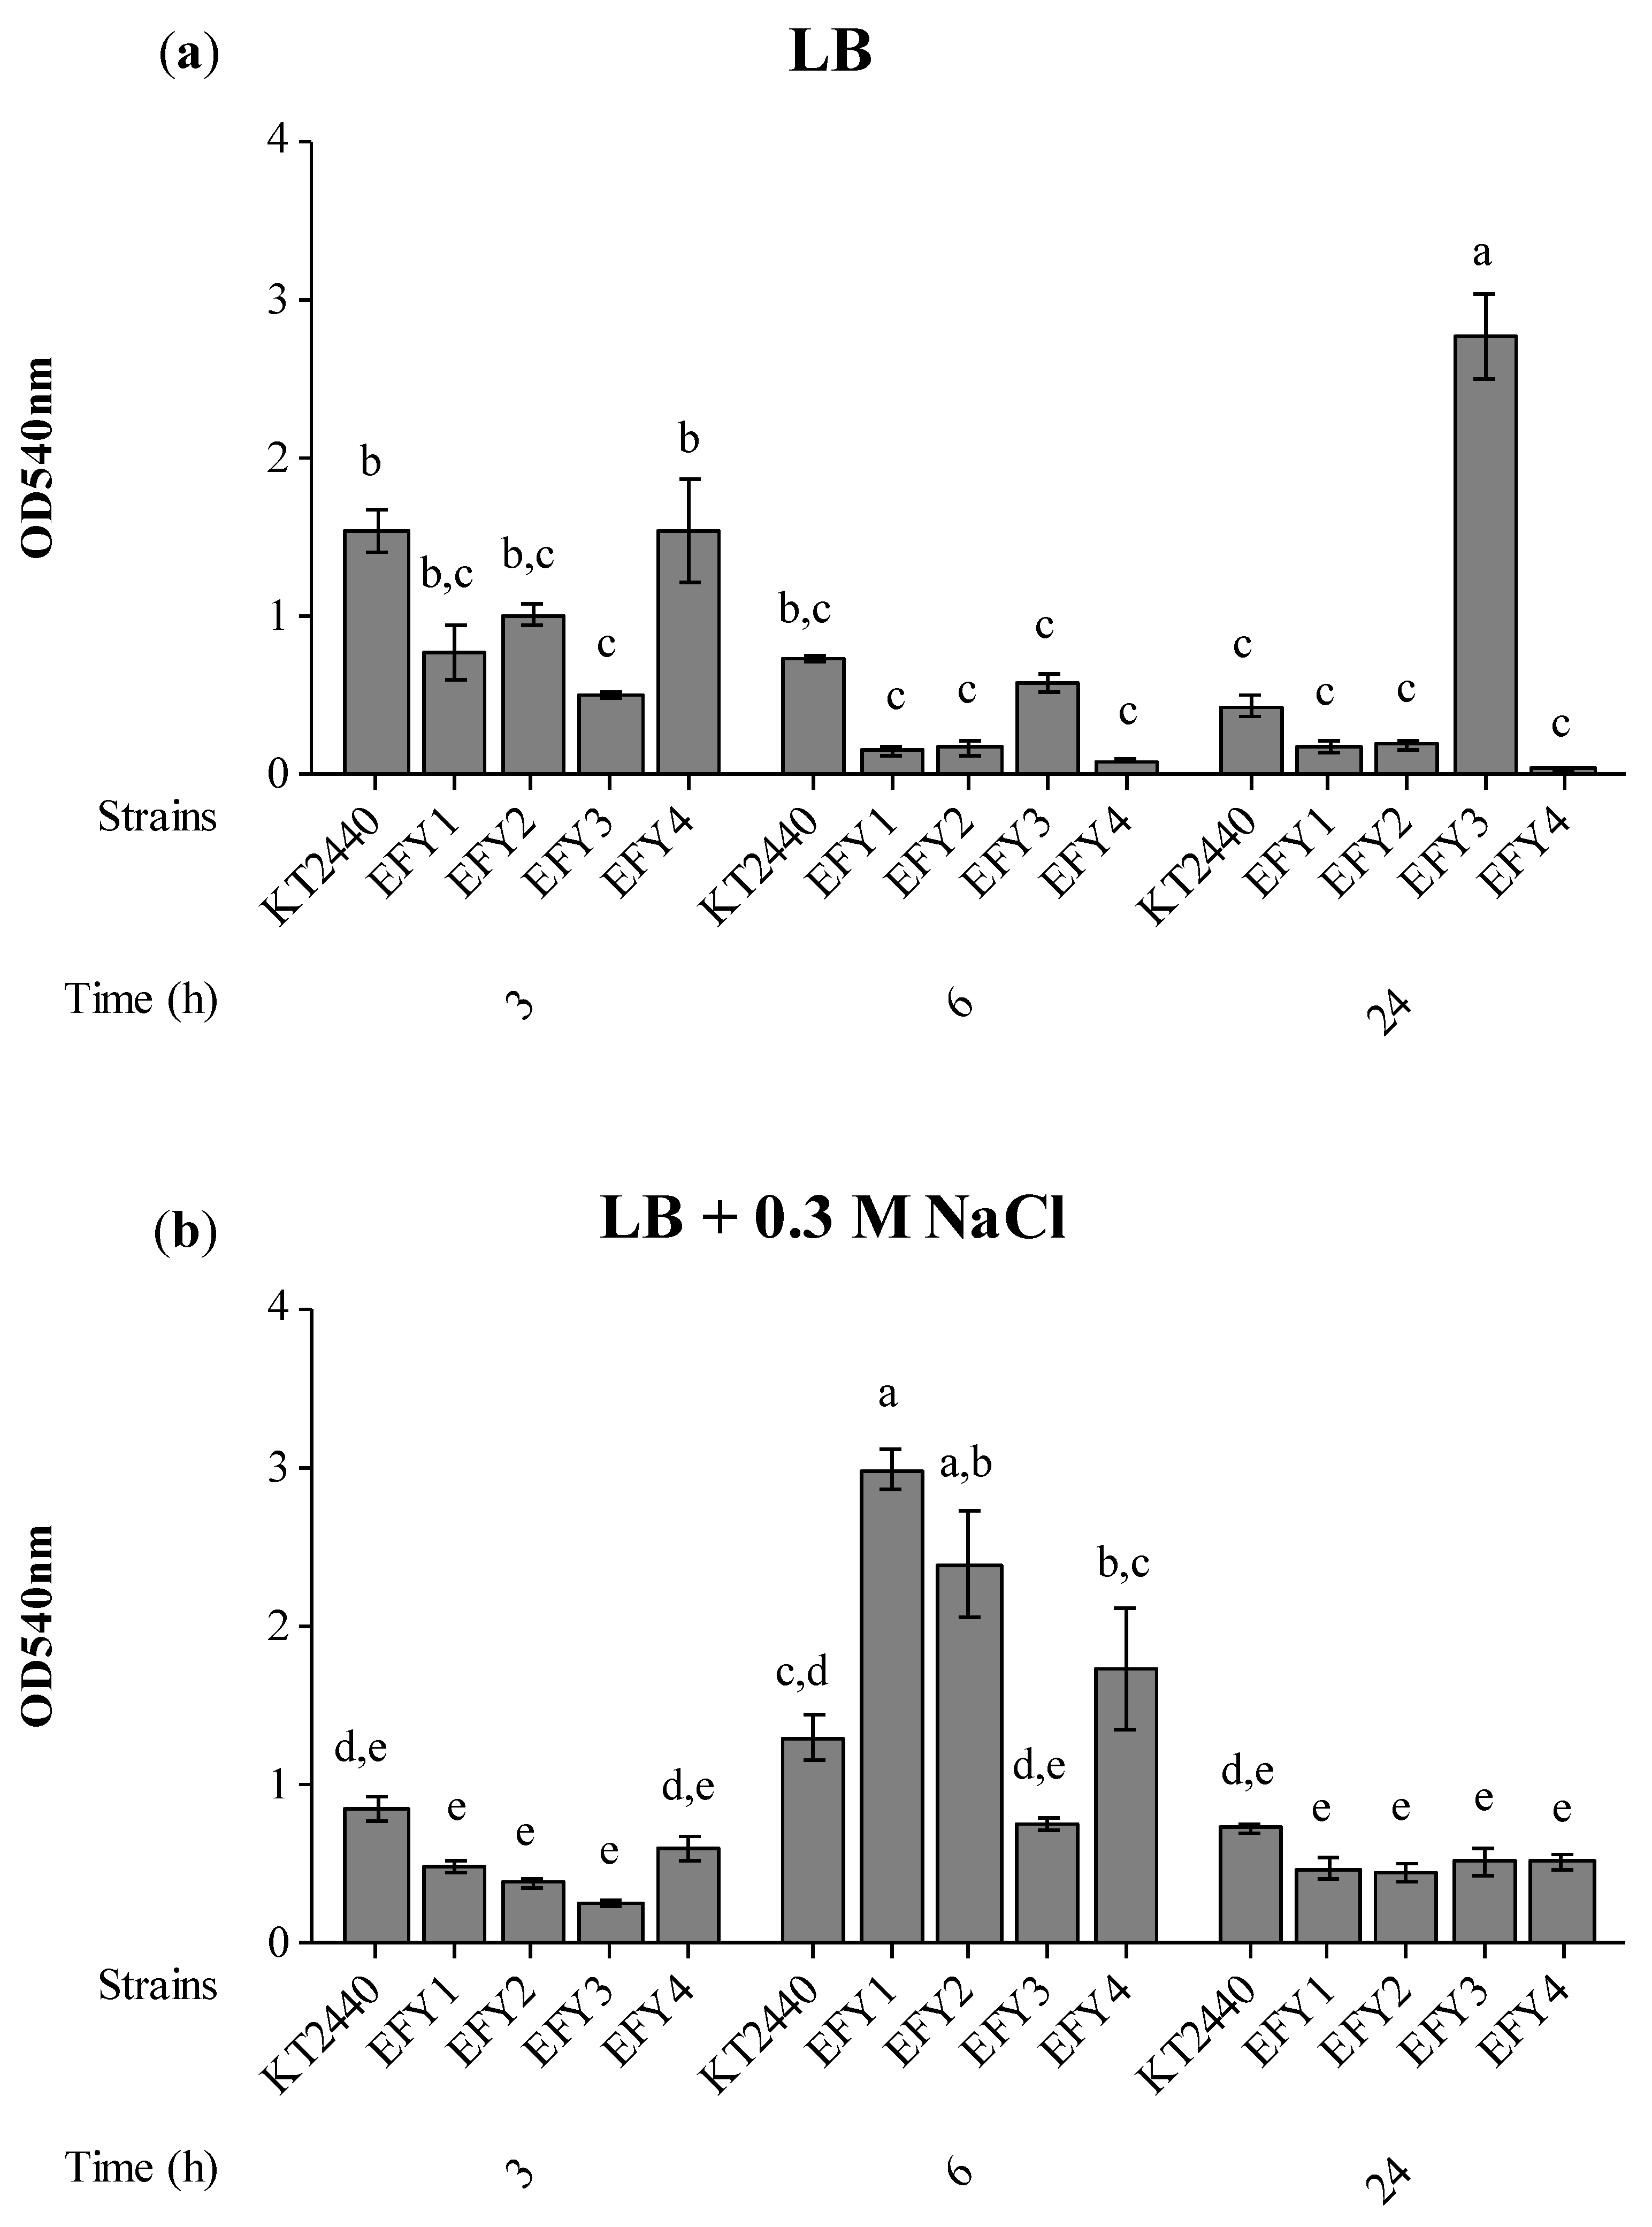
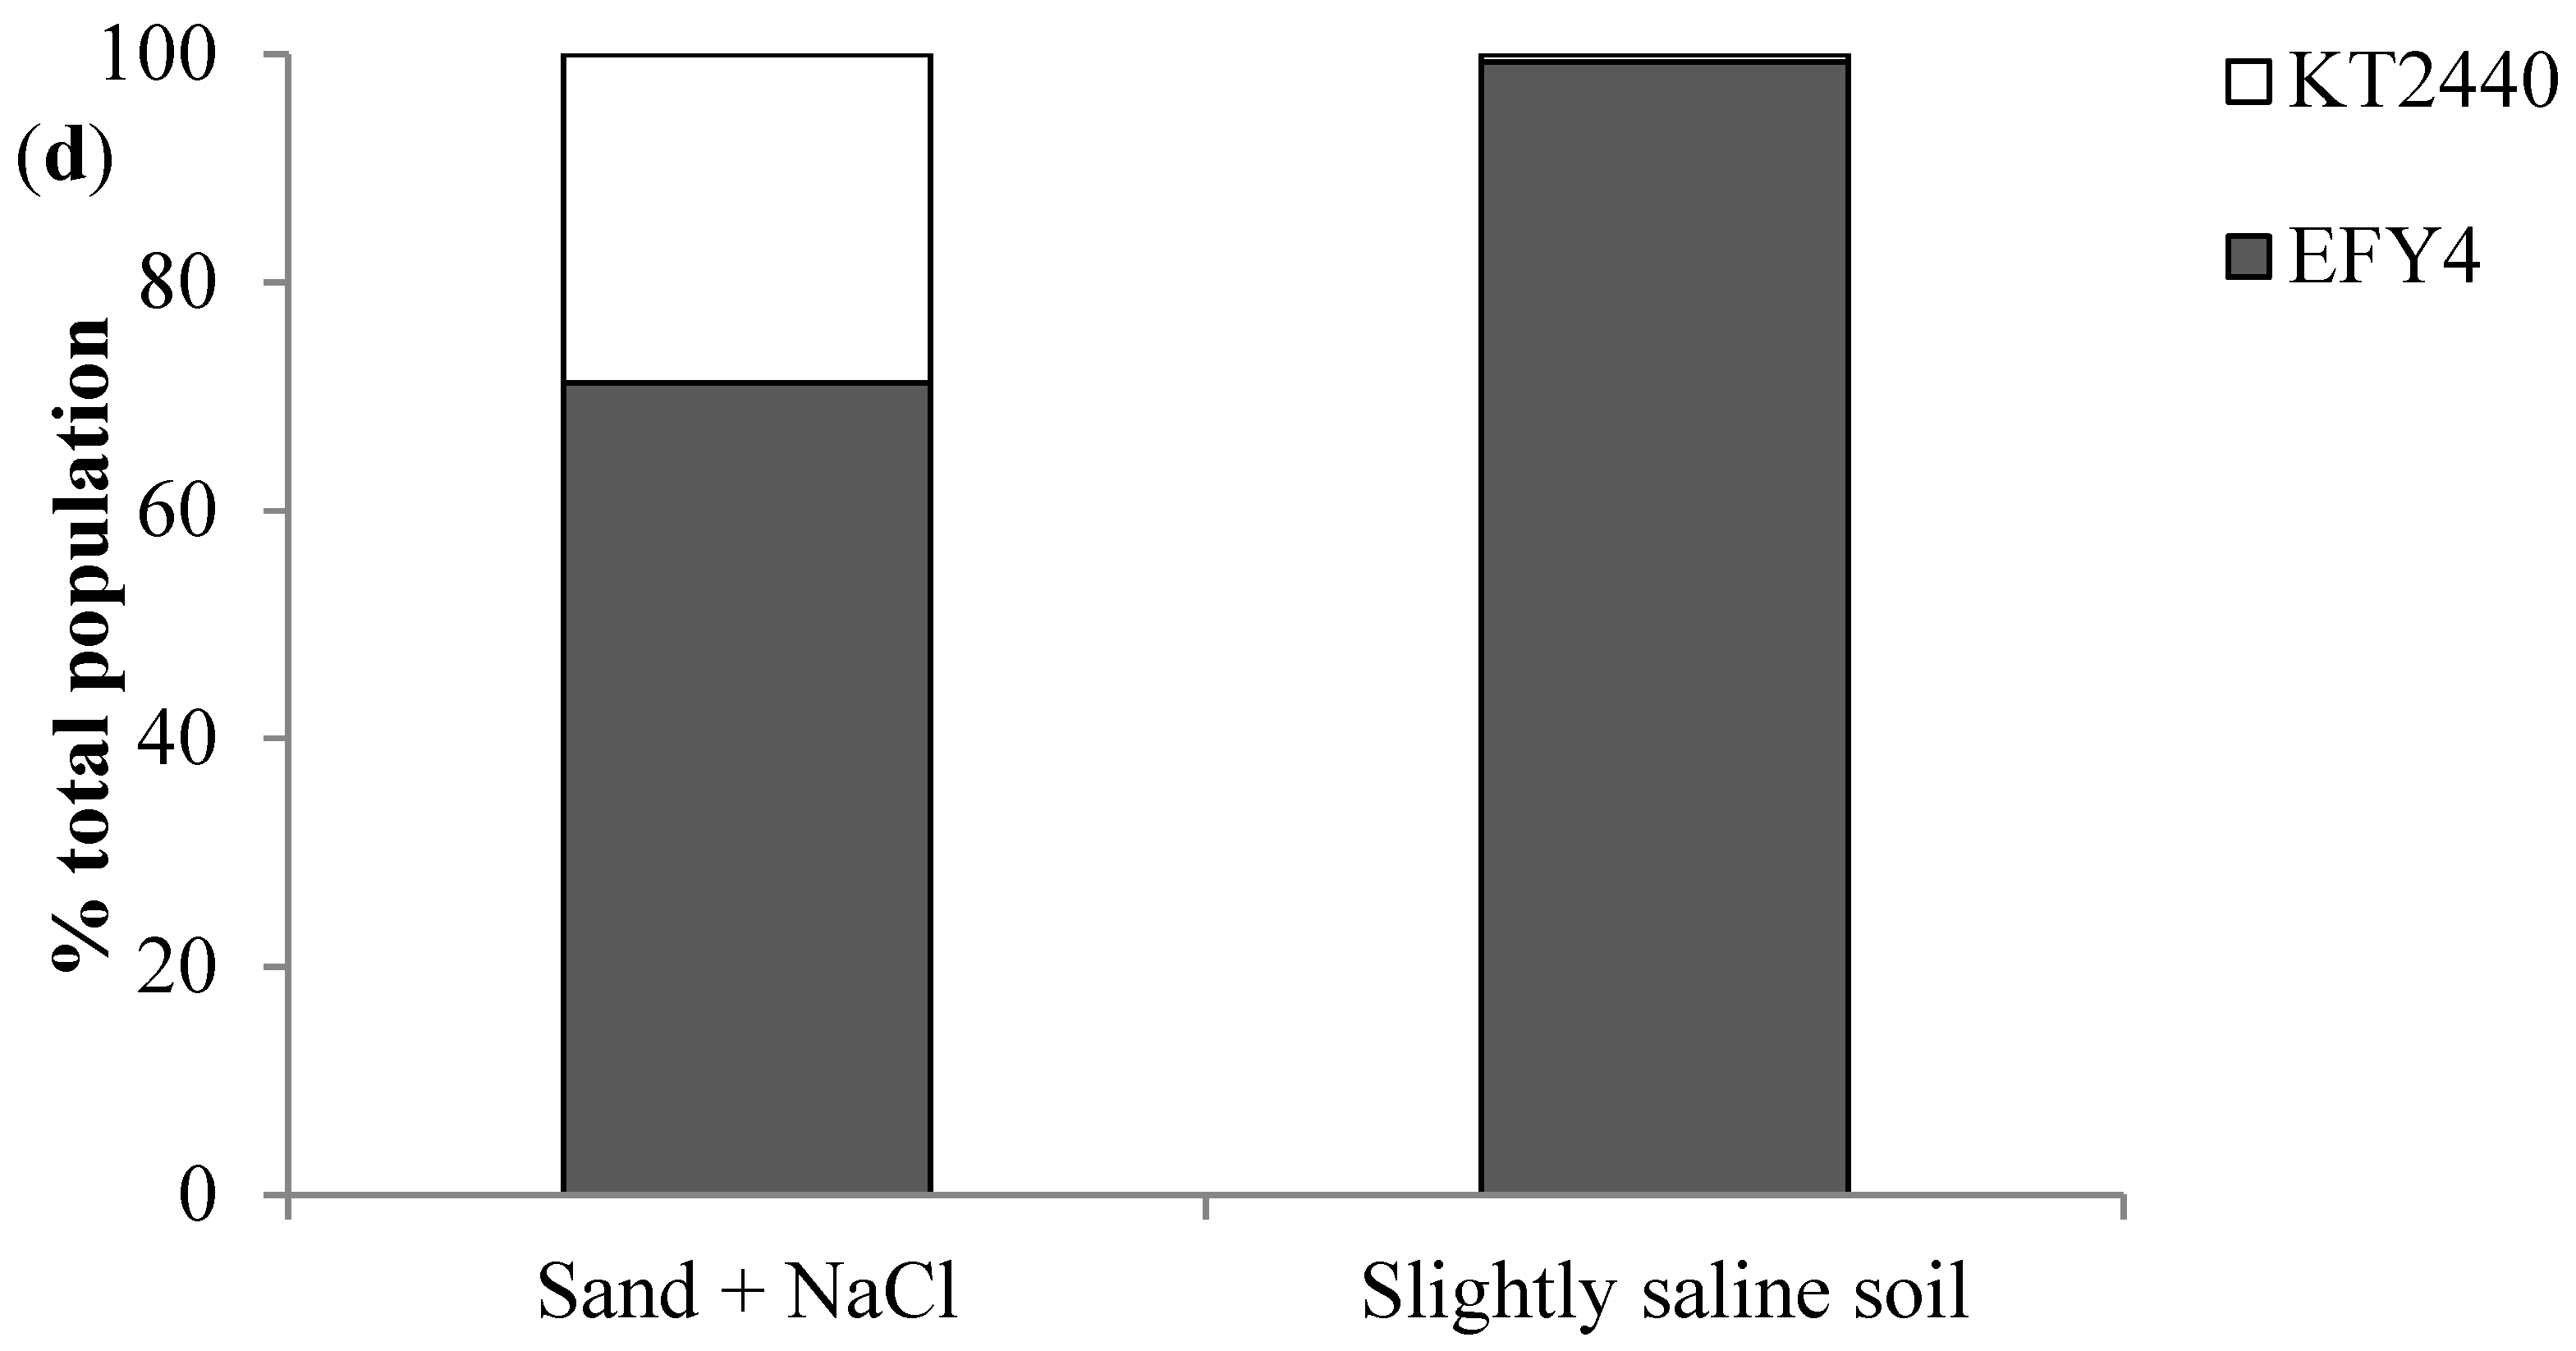
3.4. EPS Production, Surface Adhesion, Colonization, and Competition in Rhizosphere

Adhesion of the isolates to biotic and abiotic surfaces was evaluated and P. putida KT2440 strain was used as a positive control.
Biofilm formation on the surface of polystyrene microtiter plates was tested under saline (0.3 M NaCl) and non-saline conditions. As shown in Figure 4a, under non-saline conditions, the isolate EFY3 had delayed biofilm formation dynamics compared to the other bacteria, showing a lower attached biomass at early times and a higher biomass after 24 h, while the other strains have almost completely detached by then. Salinity caused delayed biofilm formation, the maximum being reached at 6h (Figure 4b), with higher biomass attached compared to non-saline conditions. In the presence of high salinity, however, the isolate EFY3 showed the lowest attached biomass. The quantitative results of biofilm formation are in agreement with the qualitative results obtained for Congo red binding, in which isolate EFY3 showed a higher presence of Congo red-related EPS under non-saline conditions. While in saline conditions, isolate EFY3 showed a slightly lower presence of EPS than the other bacteria evaluated. In a recent work, P. putida KT2440 mutants, which overproduce EPS but have low bacterial adhesion to abiotic surfaces, were shown to be able to enhance the growth of soybean and corn under saline stress [44].
Bacterial adherence to seeds is a key step for PGPB to be successful in plant growth promotion. Bacterial adhesion facilitates the subsequent proliferation of microorganisms attached to the seed and favors the colonization of the root system once the plant begins to grow [45]. Hence, isolates were also tested for adherence to biotic surfaces (soybean seeds and roots) (Table 3). The highest numbers of cells adhered to soybean seeds were for isolates EFY4 and EFY3, respectively. As for cell attachment to soybean roots, differences in the number of viable cells were observed depending on the substrate nature (sand watered with saline solution or slightly saline soil watered with distilled water). The number of viable cells of P. putida KT2440 adhered to roots of soybean grown in sand was two orders of magnitude lower compared to the viable cells adhered of the isolates (p < 0.05). Nonetheless, no significant differences were found among isolates in the number of viable cells attached to roots of soybean grown in sand watered with saline solution. Intriguingly, there were no significant differences in the CFU/g values between the isolates and P. putida KT2440 in adherence to roots of soybean grown in the slightly saline soil (p ≥ 0.05). This last result is rather surprising because the native isolates would be expected to have a higher adherence to roots of soybean grown in the slightly saline soil than the foreign strain (P. putida KT2440), since this is the niche from which they were isolated. Higher adherence to soybean roots by the rhizosphere isolates (EFY1, EFY2, and EFY4) would also be expected, however, significant differences between rhizosphere and soil isolates were not observed. Similar behavior was observed with P. entomophila FAP1 strain, an isolate from wheat rhizoplane, which was a better colonizer of the rhizosphere than of the rhizoplane of wheat plants [46].
Competitive colonization tests were performed between P. putida KT2440-Rifr strain and each one of the isolate-Tcr using as germination substrates: sand (periodically watered with 80 mM NaCl saline solution) and the slightly saline soil (EC = 1.5 dS/m, periodically watered with distilled water) (Figure 5). The rhizospheric isolates (EFY1, EFY2, and EFY4) were more competitive than the control strain, displacing the P. putida KT2440 strain from the rhizospheric population in soybean plants on both substrates (Figure 5a,b,d). However, this effect was more evident in soybean plants grown in slightly saline soil. Isolate EFY3 almost completely displaced P. putida KT2440 strain from the rhizospheric population of soybean grown in slightly saline soil. Nonetheless, the opposite occurred in the rhizosphere of plants grown in sand (Figure 5c). As expected, all isolates were able to compete and displaced the foreign strain from the rhizosphere of soybean plants grown in slightly saline soil. This is in accordance with previous studies showing that P. putida KT2440 strain, despite being a good root colonizer, does not outperform native soil microorganisms [47]. As demonstrated above, the adherence of the tested bacteria to the roots of soybean grown in slightly saline soil did not show significant differences (see Table 3); thus, the differences in CFU/mL obtained after the competition assays were not due to reduced cell adherence. The displacement of the foreign strain may be due to the fact that the indigenous microbiota is better adapted to the niche (saline soil) than the foreign bacteria, which may not survive in that niche [48].

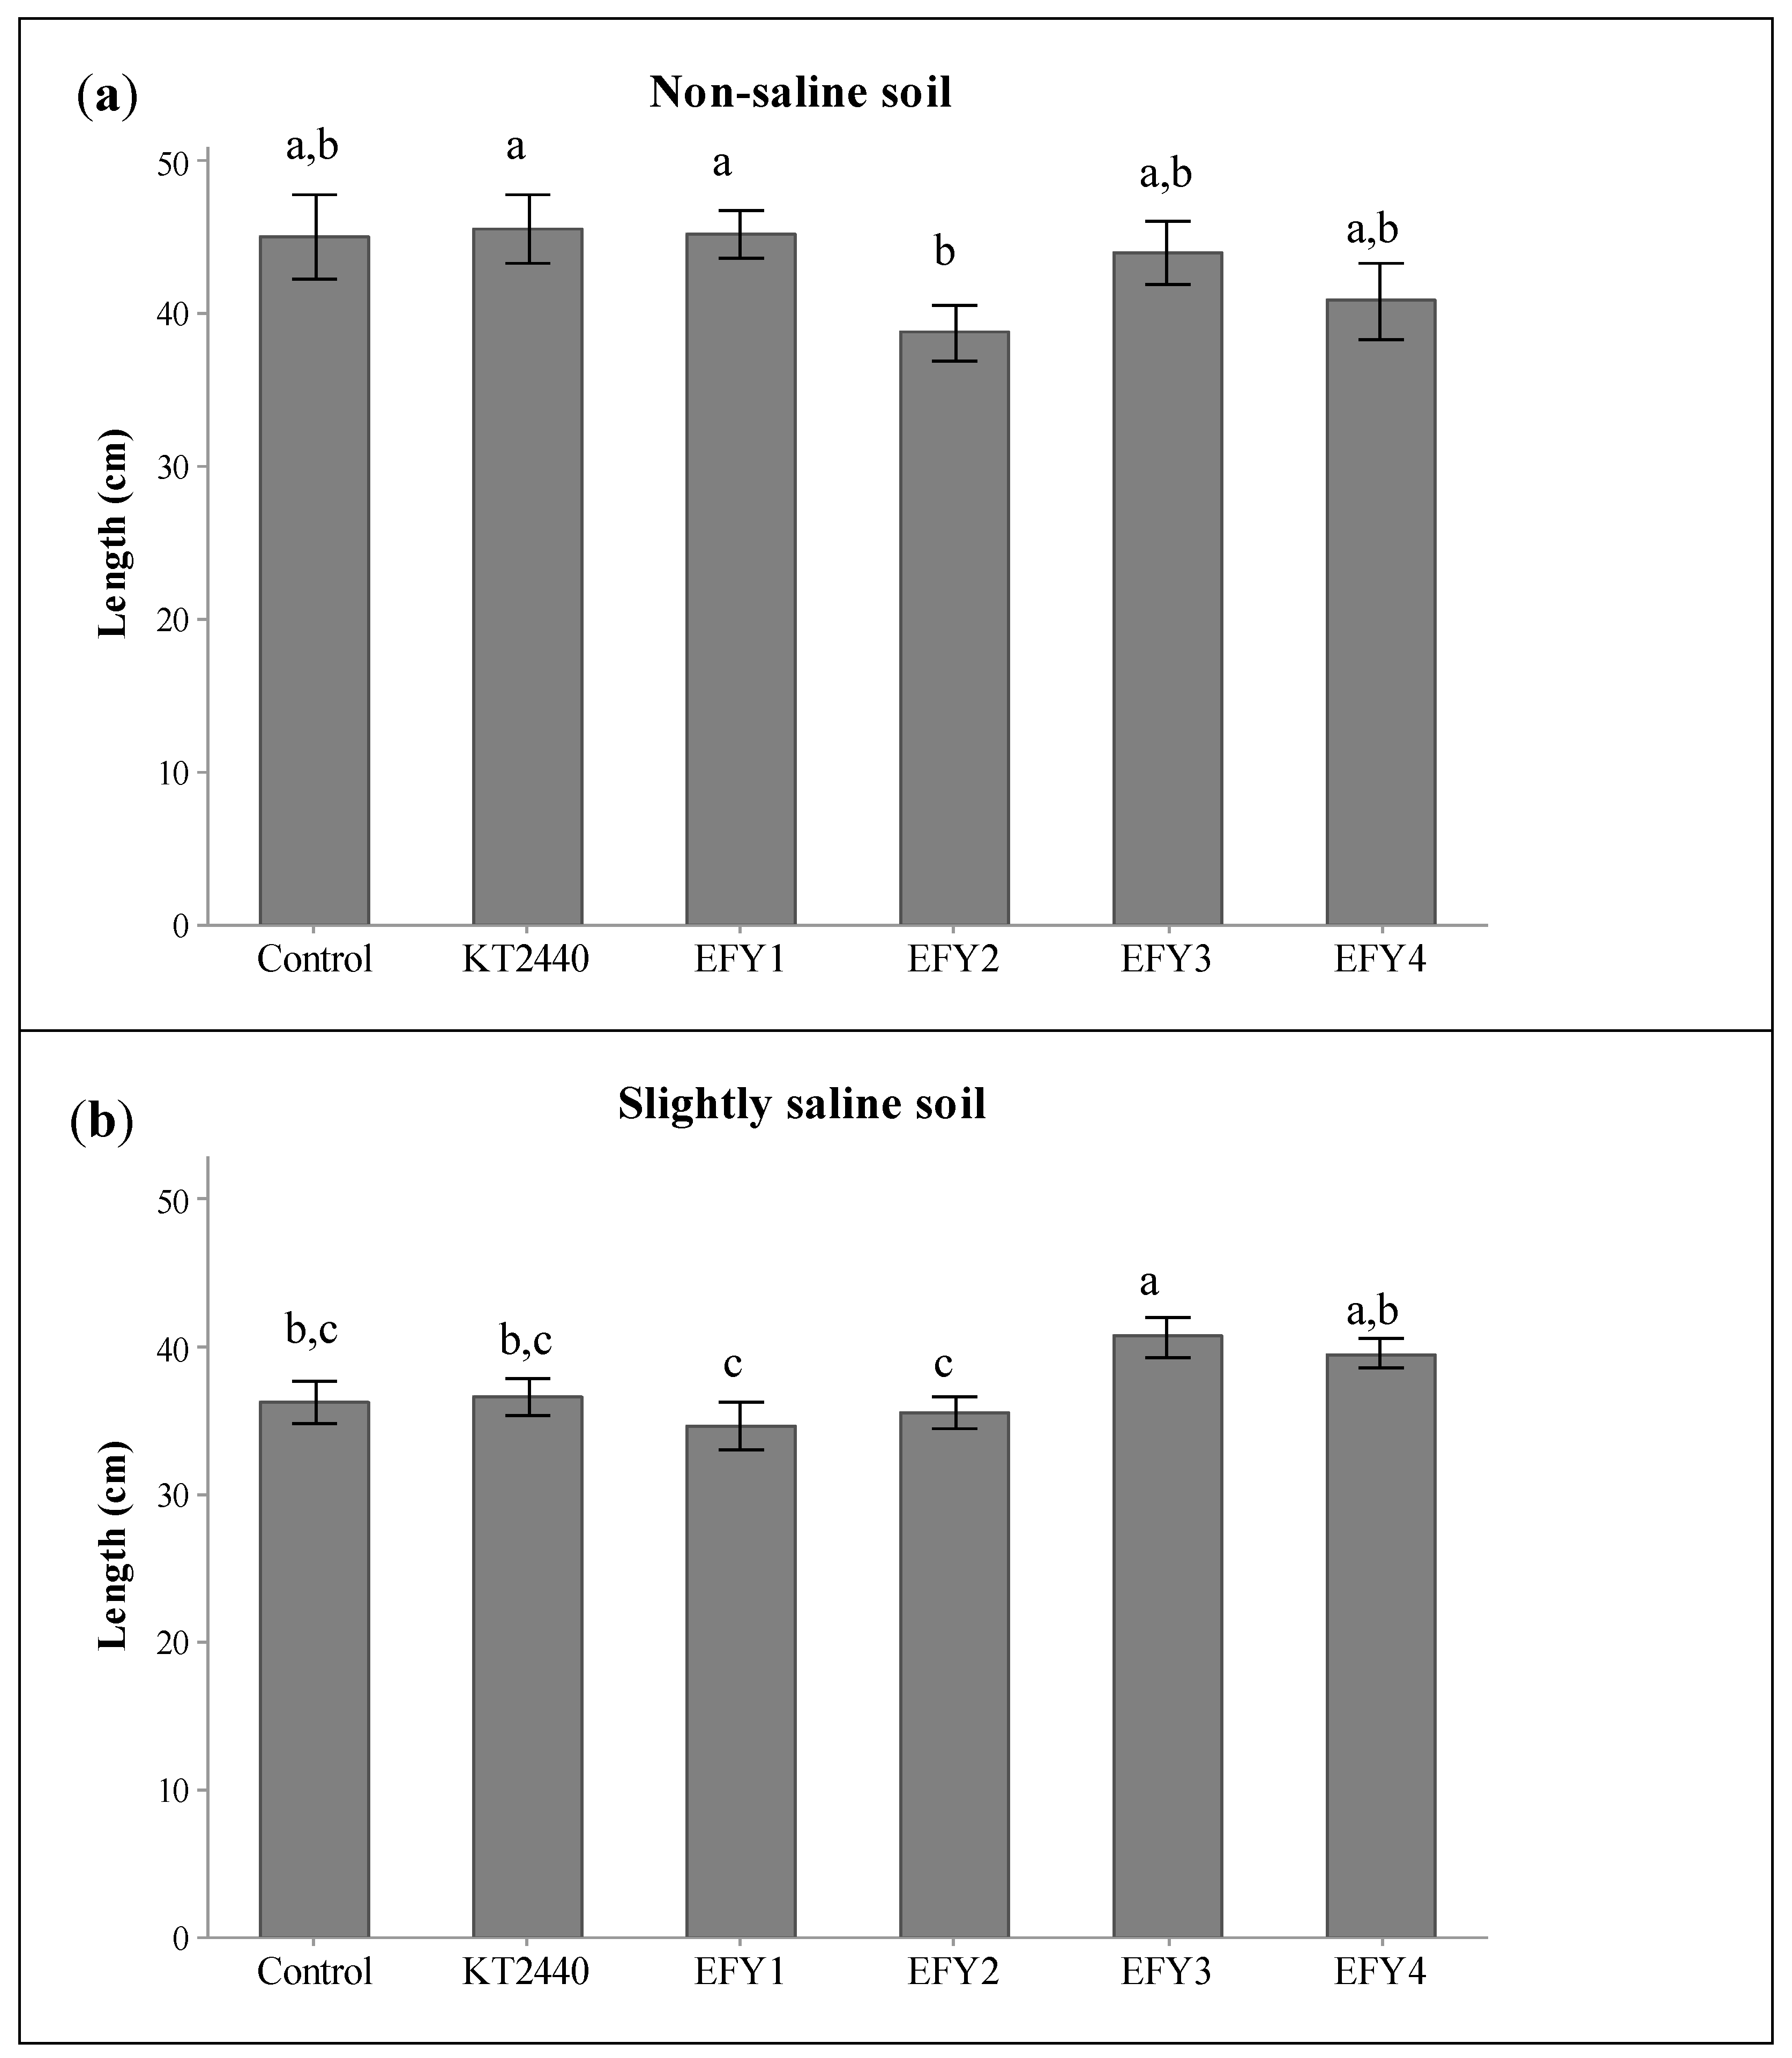
3.5. Plant Growth Promotion in Slightly Saline Soil

The effect of the four isolates as soybean plant growth promoters in non-saline and slightly saline soils was evaluated. P. putida KT2440 was included for comparison. Seeds inoculated with the isolates reached a 100% germination rate in both soils (Table 4). The seeds inoculated with P. putida KT2440 achieved a germination rate of 96% and 94%, in non-saline and slightly saline soils, respectively, whereas these values were much lower for non-inoculated seeds (80% and 60%). In non-saline soil, inoculated plants showed no increase in total length compared to non-inoculated (control) plants (Figure 6a), and even a slight decrease was observed with EFY2. In slightly saline soil, inoculation of plants with the isolate EFY3 resulted in significantly higher total length (Figure 6b). Bacterial inoculation resulted in increased vigor index of the plants in all cases, although the differences were more evident in slightly saline soil (Table 4). The highest effect was observed with EFY1 in non-saline soil and with EFY3 in slightly saline soil. Many studies evaluated the role of Pseudomonas species in promoting soybean growth and tolerance under salinity conditions. For example, inoculation of a strain of P. koreensis [49] and the Pseudomonas sp. strain AK-1 [50] improved soybean growth in artificially saline soils (addition of 150 and 200 mM NaCl saline solution, respectively). While in saline soil (2.8 dS/m) P. stutzeri MJL19 significantly promoted soybean growth [17].
Finally, the phenological stage of the plants was assessed by counting the number of plants at the V2 stage (Table 4). Stage V2 refers to the second vegetative stage after germination and is recognized when two trifoliate leaves are fully expanded on the soybean plant. In non-saline soil, inoculation with P. putida KT2440 resulted in the highest percentage of plants at the V2 stage, while the other strains did not cause differences compared to non-inoculated plants, with the exception of EFY2, which actually caused a reduction. In slightly saline soil, a strong effect was observed in plants inoculated with EFY3, and to a lesser extent with EFY1 and EFY4. These results suggest that inoculation of soybean seeds with the isolates, especially EFY3, accelerated the phenological stage of the plants. A previous study reported that inoculation of soybean seeds with P. stutzeri strain MJL19 accelerated the phenological stage of plants grown in saline soils [51]. This improvement in the maturity of soybean grown in saline soils could be a desirable plant growth promotion effect caused by inoculation of Pseudomonas strains.

4. Conclusions

Although the traditional approach of isolating potential PGPBs has been widely applied, it has certain drawbacks, such as the selection of bacteria that only exhibit desirable characteristics in in vitro assays while showing poor performance in field conditions where they must compete with the native microbiota. Here, we have presented a method that takes into account the environmental conditions of use and the plant species, as the first criteria for selection, along with the evaluation of different abilities, such as stress tolerance, adherence to biotic and abiotic surfaces, rhizosphere fitness, and plant growth promotion under similar conditions to those under which the microorganisms will be applied. Overall, the results indicate that, although isolate EFY3 does not outperform the other isolates in terms of salt tolerance and growth (especially on solid medium), this bacterium may constitute an excellent candidate for further use as a PGPB for soybean cultivation in slightly saline soils.

Supplementary Materials

The following are available online at https://www.mdpi.com/article/10.3390/agronomy11112236/s1, Supplementary Material 1: Growth of strains EFY1, EFY2, EFY3, and EFY4 in modified S1 medium. P. putida KT2440 and P. fluorescens sp. were used as positive controls and Bacillus subtilis sp. and Escherichia coli sp. as negative controls. Images were taken after incubating the plates at 30 °C for 24 h. Supplementary Material 2: Colonies of P. putida KT2440 and strains EFY1, EFY2, EFY3, and EFY4 were grown on LB (top) or LB + 0.5 M NaCl (bottom) plates containing 40 µg/mL of Congo red. Images were taken after incubating the plates at 30 °C for 48 h.

Author Contributions

Conceptualization, R.E.d.C. and P.A.V.; Methodology, S.B.C.-G., M.C.d.V.C.-D.S. and A.M.Z.; Software, S.B.C.-G. and M.E.-U.; Validation, S.B.C.-G.; Formal Analysis, S.B.C.-G.; Investigation, S.B.C.-G.; Resources, R.E.d.C. and P.A.V.; Data Curation, S.B.C.-G.; Writing—Original Draft Preparation, S.B.C.-G.; Writing—Review and Editing, S.B.C.-G., R.E.d.C., M.E.-U. and P.A.V.; Visualization, R.E.d.C. and P.A.V.; Supervision, R.E.d.C., M.E.-U. and P.A.V.; Project Administration, P.A.V.; Funding Acquisition, P.A.V. All authors have read and agreed to the published version of the manuscript.

Funding

This research was funded by Consejo Nacional de Investigaciones Científicas y Técnicas (CONICET) grant number PICT 2017-2285 and PICT 2018-3552, Fondo para la Investigación Científica y Tecnológica (FONCyT) grant number PIP 908-15, and Grant PID2019-109372GB-I00 (MCIN/ AEI /10.13039/501100011033).

Acknowledgments

The authors would like to show their gratitude to Gabriela Michavila for her assistance in the processing of genomic sequences.

Conflicts of Interest

The authors declare that there are no conflict of interest.

References

  1. Umezawa, T.; Shimizu, K.; Kato, M.; Ueda, T. Enhancement of salt tolerance in soybean with NaCl pretreatment. Physiol. Plantarum 2000, 110, 59–63. [Google Scholar] [CrossRef]
  2. Essa, T.A. Effect of salinity stress on growth and nutrient composition of three soybean (Glycine max L. Merrill) Cultivars. J. Agron. Crop. Sci. 2002, 188, 86–93. [Google Scholar] [CrossRef]
  3. Zörb, C.; Geilfus, C.M.; Dietz, K.J. Salinity and crop yield. Plant Biol. 2019, 21, 31–38. [Google Scholar] [CrossRef] [PubMed]
  4. Paul, D.; Lade, H. Plant-growth-promoting rhizobacteria to improve crop growth in saline soils: A review. Agron. Sustain. Dev. 2014, 34, 737–752. [Google Scholar] [CrossRef]
  5. Munns, R. Comparative physiology of salt and water stress. Plant Cell Environ. 2002, 25, 239–250. [Google Scholar] [CrossRef] [PubMed]
  6. Glick, B.R. Bacteria with ACC deaminase can promote plant growth and help to feed the world. Microbiol. Res. 2014, 169, 30–39. [Google Scholar] [CrossRef] [PubMed]
  7. Kloepper, J.W.; Schroth, M. Plant growth-promoting rhizobacteria on radishes. Proc. 4th Int. Conf. Plant Pathog. Bact. 1978, 2, 879–882. [Google Scholar]
  8. Bashan, Y.; Holguin, G. Proposal for the division of plant growth-promoting rhizobacteria into two classifications: Biocontrol-PGPB (Plant Growth-Promoting Bacteria) and PGPB. Soil Biol. Biochem. 1998, 30, 12251228. [Google Scholar] [CrossRef]
  9. Yang, J.; Kloepper, J.W.; Ryu, C.M. Rhizosphere bacteria help plants tolerate abiotic stress. Trends Plant Sci. 2009, 14, 1–4. [Google Scholar] [CrossRef]
  10. Kaymak, H.Ç.; Güvenç, I.; Yarali, F.; Dönmez, M.F. The effects of bio-priming with PGPR on germination of radish (Raphanus sativus L.) seeds under saline conditions. Turkish J. Agric. For. 2009, 33, 173–179. [Google Scholar] [CrossRef]
  11. Upadhyay, S.K.; Singh, D.P. Effect of salt-tolerant plant growth-promoting rhizobacteria on wheat plants and soil health in a saline environment. Plant Biol. 2015, 17, 288–293. [Google Scholar] [CrossRef]
  12. El-Nahrawy, S.; Yassin, M. Response of different cultivars of wheat plants (Triticum aestivum L.) to inoculation by Azotobacter sp. under salinity stress conditions. J. Adv. Microbiol. 2020, 20, 59–79. [Google Scholar] [CrossRef] [Green Version]
  13. Dardanelli, M.; Carletti, S.M.; Paulucci, N.S.; Medeot, D.B.; Rodriguez-Cáceres, E.A.; Vita, F.A.; Bueno, M.; Fumero, M.V.; Garcia, M.B. Benefits of plant growth-promoting rhizobacteria and rhizobia in agriculture. In Plant Growth and Health Promoting Bacteria; Microbiology Monographs; Maheshwari, D., Ed.; Springer: Berlin/Heidelberg, Germany, 2010; Volume 18, pp. 1–20. [Google Scholar] [CrossRef]
  14. Upadhyay, S.K.; Singh, J.S.; Singh, D.P. Exopolysaccharide-producing plant growth-promoting rhizobacteria under salinity condition. Pedosphere 2011, 21, 214–222. [Google Scholar] [CrossRef]
  15. Singh, R.P.; Jha, P.; Jha, P.N. The plant-growth-promoting bacterium Klebsiella sp. SBP-8 confers induced systemic tolerance in wheat (Triticum aestivum) under salt stress. J. Plant Physiol. 2015, 184, 57–67. [Google Scholar] [CrossRef]
  16. Costa-Gutierrez, S.B.; Lami, M.J.; Caram-Di Santo, M.C.; Zenoff, A.M.; Vincent, P.A.; Molina-Henares, M.A.; Espinosa-Urgel, M.; de Cristóbal, R.E. Plant growth promotion by Pseudomonas putida KT2440 under saline stress: Role of eptA. Appl. Microbiol. Biotechnol. 2020, 104, 4577–4592. [Google Scholar] [CrossRef]
  17. Lami, M.J.; Adler, C.; Caram-Di Santo, M.C.; Zenoff, A.M.; de Cristóbal, R.E.; Espinosa-Urgel, M.; Vincent, P.A. Pseudomonas stutzeri MJL19, a rhizosphere-colonizing bacterium that promotes plant growth under saline stress. J. Appl. Microbiol. 2020, 129, 1321–1336. [Google Scholar] [CrossRef] [PubMed]
  18. Al-Karhi, M.A.J.; Ismail, W.M.; Hussein, M.N. The Role of inoculation with Rhizobium leguminosarum in properties of plant (Vicia faba) under different levels of salinity. IOP Conf. Ser. Earth Environ. Sci. 2019, 01208. [Google Scholar] [CrossRef]
  19. Singh, R.P.; Jha, P.N. The multifarious PGPR Serratia marcescens CDP-13 augments induced systemic resistance and enhanced salinity tolerance of wheat (Triticum aestivum L.). PLoS ONE 2016, 11, e0155026. [Google Scholar] [CrossRef] [PubMed]
  20. Patel, T.M.; Minocheherhomji, F.P. Isolation and screening of phytohormones producing PGPR from cotton plant rhizospheric soil. J. Adv. Sci. Res. 2020, 11, 148–154. [Google Scholar]
  21. Granada, C.E.; Passaglia, L.M.; de Souza, E.M.; Sperotto, R.A. Is phosphate solubilization the forgotten child of plant growth-promoting rhizobacteria? Front. Microbiol. 2018, 9, 2054. [Google Scholar] [CrossRef] [PubMed]
  22. Richardson, A.E.; Barea, J.M.; McNeill, A.M.; Prigent-Combaret, C. Acquisition of phosphorus and nitrogen in the rhizosphere and plant growth promotion by microorganisms. Plant Soil 2009, 321, 305–339. [Google Scholar] [CrossRef]
  23. Ferreira, M.J.; Silva, H.; Cunha, A. Siderophore-producing rhizobacteria as a promising tool for empowering plants to cope with iron limitation in saline soils: A review. Pedosphere 2019, 29, 409–420. [Google Scholar] [CrossRef]
  24. Nadeem, S.M.; Ahmad, M.; Naveed, M.; Imran, M.; Zahir, Z.A.; Crowley, D.E. Relationship between in vitro characterization and comparative efficacy of plant growth-promoting rhizobacteria for improving cucumber salt tolerance. Arch. Microbiol. 2016, 198, 379–387. [Google Scholar] [CrossRef]
  25. Cardinale, M.; Ratering, S.; Suarez, C.; Zapata-Montoya, A.M.; Geissler-Plaum, R.; Schnell, S. Paradox of plant growth promotion potential of rhizobacteria and their actual promotion effect on growth of barley (Hordeum vulgare L.) under salt stress. Microbiol. Res. 2015, 181, 22–32. [Google Scholar] [CrossRef]
  26. Zachow, C.; Müller, H.; Tilcher, R.; Donat, C.; Berg, G. Catch the best: Novel screening strategy to select stress protecting agents for crop plants. Agronomy 2013, 3, 794–815. [Google Scholar] [CrossRef]
  27. Amaya-Gómez, C.V.; Porcel, M.; Mesa-Garriga, L.; Gómez-Álvarez, M.I. A framework for the selection of plant growth-promoting rhizobacteria based on bacterial competence mechanisms. Appl. Environ. Microbiol. 2020, 86, e00760-20. [Google Scholar] [CrossRef]
  28. De Gregorio, P.R.; Michavila, G.; Muller, L.R.; De Souza-Borges, C.; Pomares, M.F.; De Sá, E.L.S.; Pereira, C.; Vincent, P.A. Beneficial rhizobacteria immobilized in nano-bers for potential application as soybean seed bioinoculants. PLoS ONE 2017, 12, e0176930. [Google Scholar] [CrossRef] [Green Version]
  29. Gould, W.D.; Hagedorn, C.; Bardinelli, T.R.; Zablotowicz, R.M. New selective media for enumeration and recovery of fluorescent pseudomonads from various habitats. Appl. Environ. Microbiol. 1985, 49, 28–32. [Google Scholar] [CrossRef] [Green Version]
  30. Scheinert, P.; Krausse, R.; Ullmann, U.; Söller, R.; Krupp, G. Molecular differentiation of bacteria by PCR amplification of the 16S–23S rRNA spacer. J. Microbiol. Methods 1996, 26, 103–117. [Google Scholar] [CrossRef]
  31. Saitou, N.; Nei, M. The neighbor-joining method: A new method for reconstructing phylogenetic trees. Mol. Biol. Evol. 1987, 4, 406–425. [Google Scholar] [CrossRef] [PubMed]
  32. Tamura, K.; Nei, M.; Kumar, S. Prospects for inferring very large phylogenies by using the neighbor-joining method. Proc. Natl. Acad. Sci. USA 2004, 101, 11030–11035. [Google Scholar] [CrossRef] [PubMed] [Green Version]
  33. Kumar, S.; Stecher, G.; Tamura, K. MEGA7: Molecular Evolutionary Genetics Analysis version 7.0 for bigger datasets. Mol. Biol. Evol. 2016, 33, 1870–1874. [Google Scholar] [CrossRef] [PubMed] [Green Version]
  34. Walter, M.V.; Barbour, K.; McDowell, M.; Seidler, R.J. A method to evaluate survival of genetically engineered bacteria in soil extracts. Curr. Microbiol. 1987, 15, 193–197. [Google Scholar] [CrossRef]
  35. Friedman, L.; Kolter, R. Two genetic loci produce distinct carbohydrate-rich structural components of the Pseudomonas aeruginosa biofilm matrix. J. Bacteriol. 2004, 186, 4457–4465. [Google Scholar] [CrossRef] [PubMed] [Green Version]
  36. O’Toole, G.A.; Kolter, R. Initiation of biofilm formation in Pseudomonas fluorescens WCS365 proceeds via multiple, convergent signalling pathways: A genetic analysis. Mol. Microbiol. 1998, 28, 449–461. [Google Scholar] [CrossRef] [PubMed]
  37. de Lorenzo, V.; Herrero, M.; Jakubzik, U.; Timmis, K.N. Mini-Tn5 transposon derivatives for insertion mutagenesis, promoter probing, and chromosomal insertion of cloned DNA in gram-negative eubacteria. J. Bacteriol. 1990, 172, 6568–6572. [Google Scholar] [CrossRef] [Green Version]
  38. Espinosa-Urgel, M.; Salido, A.; Ramos, J.L. Genetic analysis offunc- tions involved in adhesion of Pseudomonas putida to seeds. J. Bacteriol. 2000, 182, 2363–2369. [Google Scholar] [CrossRef] [Green Version]
  39. Ajithkumar, P.V.; Gangadhara, K.P.; Manilal, P.; Kunhi, A.A.M. Soil inoculation with Pseudomonas aeruginosa 3MT eliminates the inhibitory effect of 3-chloro- and 4-chlorobenzoate on tomato seed germination. Soil Biol. Biochem. 1998, 30, 1053–1059. [Google Scholar] [CrossRef]
  40. Safdar, H.; Amin, A.; Shafiq, Y.; Ali, A.; Yasin, R. A review: Impact of salinity on plant growth. Nat. Sci. 2019, 17, 34–40. [Google Scholar] [CrossRef]
  41. Raimondo, E.E.; Aparicio, J.D.; Briceño, G.E.; Fuentes, M.S.; Benimeli, C.S. Lindane bioremediation in soils of different textural classes by an Actinobacteria consortium. J. Soil Sci. Plant Nutr. 2019, 19, 29–41. [Google Scholar] [CrossRef]
  42. Marrero, M.A.; Agaras, B.; Wall, L.G.; Valverde, C. Enriquecimiento diferencial de Pseudomonas spp. en el rizoplano de distintas especies cultivadas. Rev. Argent. Microbiol. 2015, 47, 132–137. [Google Scholar] [CrossRef] [Green Version]
  43. Costa-Gutierrez, S.B. Microflora of the Soybean Rhizosphere in Conditions of High Salinity: ISOLATION and Study of Pseudomonas putida Strains Benefits Against Saline Stress. Ph.D. Thesis, National University of Tucumán, Tucumán, Argentina, 2019. [Google Scholar]
  44. Costa-Gutierrez, S.B.; Raimondo, E.E.; Lami, M.J.; Vincent, P.A.; Espinosa-Urgel, M.; de Cristóbal, R.E. Inoculation of Pseudomonas mutant strains can improve growth of soybean and corn plants in soils under salt stress. Rhizosphere 2020, 16, 100255. [Google Scholar] [CrossRef]
  45. Compant, S.; Clément, C.; Sessitsch, A. Plant growth-promoting bacteria in the rhizo- and endosphere of plants: Their role, colonization, mechanisms involved and prospects for utilization. Soil Biol. Biochem. 2010, 42, 669–678. [Google Scholar] [CrossRef] [Green Version]
  46. Ansari, F.A.; Ahmad, I. Biofilm development, plant growth promoting traits and rhizosphere colonization by Pseudomonas entomophila FAP1: A promising PGPR. Adv. Microbiol. 2018, 8, 235–251. [Google Scholar] [CrossRef] [Green Version]
  47. Molina, L.Á.; Ramos, C.; Duque, E.; Ronchel, M.C.; García, J.M.; Wyke, L.; Ramos, J.L. Survival of Pseudomonas putida KT2440 in soil and in the rhizosphere of plants under greenhouse and environmental conditions. Soil Biol. Biochem. 2000, 32, 315–321. [Google Scholar] [CrossRef]
  48. Bashan, Y. Inoculants of plant growth-promoting bacteria for use in agriculture. Biotechnol. Adv. 1998, 16, 729–770. [Google Scholar] [CrossRef]
  49. Adhikari, A.; Khan, M.A.; Lee, K.E.; Kang, S.M.; Dhungana, S.K.; Bhusal, N.; Lee, I.J. The halotolerant rhizobacterium—Pseudomonas koreensis MU2 enhances inorganic silicon and phosphorus use efficiency and augments salt stress tolerance in soybean (Glycine max L.). Microorganisms 2020, 8, 1256. [Google Scholar] [CrossRef] [PubMed]
  50. Kasotia, A.; Varma, A.; Tuteja, N.; Choudhary, D.K. Amelioration of soybean plant from saline-induced condition by exopolysaccharide producing Pseudomonas-mediated expression of high affinity K+-transporter (HKT1) gene. Curr. Sci. 2016, 1961–1967. [Google Scholar] [CrossRef]
  51. Lami, M.J. Rhizospheric Bacteria for Plant Growth Promotion and Salt Stress Tolerance in Soybean Crops. Ph.D. Thesis, National University of Tucumán, Tucumán, Argentina, 2018. [Google Scholar]
Figure 1. Comparative 16S rRNA gene sequence analysis of Pseudomonas sp. strains EFY1, EFY2, EFY3, and EFY4, and representative related strains from GenBank. The significance of each branch is indicated by a bootstrap for 1000 subsets. The percentage of replicate trees in which the associated taxa clustered together in the bootstrap test (1000 replicates) are shown next to the branches.
Agronomy 11 02236 g001
Figure 2. Growth of P. putida KT2440 and strains EFY1, EFY2, EFY3, and EFY4 on solid medium (a) LB and (b) LB + 0.8 M NaCl. Ten microliters of 10-fold serial dilutions of the bacterial cultures were plated on the plates. Images were taken after incubating the plates at 30 °C for 24 h.
Agronomy 11 02236 g002
Figure 3. Growth curves in: (a) LB, (b) LB + 0.8 M NaCl, and (c) strongly saline soil solution. Evaluated strains: (■) P. putida KT2440, (□) EFY1, (●) EFY2, (○) EFY3, and (▲) EFY4. Data are plotted as mean values ± standard error. Different letters indicate significant differences among the kinetics of the growth curves (p < 0.05, Tukey’s test).
Agronomy 11 02236 g003aAgronomy 11 02236 g003b
Figure 4. Bacterial adhesion to the surface of polystyrene microtiter plates of P. putida KT2440 and the isolates EFY1, EFY2, EFY3, and EFY4, grown in (a) LB and (b) LB + 0.3 M NaCl. Data are plotted as mean values ± standard error. Different letters indicate significant differences among the strains in the same media (p < 0.05, Tukey’s test).
Agronomy 11 02236 g004
Figure 5. Competitive colonization between P. putida KT2440-Rifr and strains (a) EFY1-Tcr, (b) EFY2-Tcr, (c) EFY3-Tcr, and (d) EFY4-Tcr, in the rhizosphere of soybean plants grown in sand (watered with 80 mM NaCl saline solution) and in slightly saline soil (EC = 1.5 dS/m, watered with distilled water). Data are for plants after 10 days and are given as the proportion of KT2440-Rifr and the isolate-Tcr in the total population (means and standard deviations of our tests).
Agronomy 11 02236 g005aAgronomy 11 02236 g005b
Figure 6. Total length of soybean plants grown in (a) non-saline and (b) slightly saline soils. Soybean seeds were inoculated with P. putida KT2440 strain and the isolates EFY1, EFY2, EFY3, and EFY4. The control corresponds to non-inoculated seeds. Data are plotted as mean values ± standard error. Different letters indicate significant differences among the strains under the same condition (p < 0.05, Tukey’s test).
Agronomy 11 02236 g006
Table 1. Physicochemical characteristics of soil samples.
PropertiesSlightly Saline SoilStrongly Saline SoilNon-Saline Soil
Silt a (%)66.861.263.7
Clay a (%)5.714.55.0
Sand a (%)27.524.331.3
pH b8.48.88.1
EC c (dS/m)1.529.80.5
Sum of cations d (cmol/Kg)26.066.817.7
Na+ (ppm)498.96496.9124.1
K+ (ppm)1049.11450.8624.0
Ca++ (ppm)3834.01342.02750.0
Mg++ (ppm)230.450.4219.6
EC: Electrical conductivity. a Soil texture analysis by hydrometer: modification of the Bouyoucos method. b Soil to distilled water ratio of 1:2.5. c Extraction method with acetate NH4, pH7. d In saturation paste of soil.
Table 2. Number of culturable cells in soil and rhizosphere samples.
MediumSoybean RhizosphereSlightly Saline Soil SampleStrongly Saline Soil Sample
LB 1×1.6 × 107 ± 5.0 × 10⁶ a3.0 × 106 ± 3.0 × 10⁵ b3.6 × 105 ± 8.0 × 10⁴ b
LB 1× + NaCl6.0 × 105 ± 4.0 × 10⁴ a6.6 × 105 ± 1.2 × 10⁵ a1.0 × 105 ± 1.5 × 10⁴ b
LB 0.1×1.8 ×107 ± 2.4 × 10⁶ a4.2 × 106 ± 3.0 × 10⁵ b5.7 × 105 ± 3.0 × 10⁴ c
LB 0.1× + NaCl3.0 × 105 ± 8.0 × 10⁴ a4.5 × 105 ± 7.0 × 10⁴ a1.4 × 105 ±1.2 × 10⁴ b
M9-glucose9.9 × 106 ± 7.0 × 10⁵ a1.5 × 106 ± 3.1 × 10⁵ b3.0 × 105 ± 4.0 × 10⁴ b
M9-glucose + NaCl5.4 × 105 ± 6.0 × 10⁴ a4.2 × 105 ± 5.0 × 10⁴ b4.5 × 104 ± 1.5 × 10⁴ c
M9-citrate9.0 × 106 ± 1.0 × 10⁶ a1.4 × 106 ± 2.0 × 10⁵ b1.8 × 105 ± 1.3 × 10⁴ b
M9-citrate + NaCl1.5 × 106 ± 2.0 × 10⁵ a4.2 × 105 ± 7.0 × 10⁴ b6.0 × 104 ± 4.0 × 10³ c
M9-benzoate6.5 × 105 ± 5.0 × 10⁴ a3.9 × 105 ± 2.0 × 10⁴ b4.5 × 105 ± 5.0 × 10⁴ b
M9-benzoate + NaCl6.0 × 106 ± 8.0 × 10⁵ a4.8 × 105 ± 3.0 × 10⁴ b2.0 × 103 ± 5.0 × 101 c
Modified S11.2 × 106 ± 8.0 × 10⁵ a6.0 × 103 ± 3.0 × 10² b4.2 × 102 ± 1.1 × 101 c
Data correspond to CFU/g of soil or fresh weight of soybean root, as appropriate, and are mean values ± standard errors. NaCl was supplied at 0.8 M (final). Values within rows followed by different letters indicate significant differences (p < 0.05, Tukey’s test).
Table 3. Quantitative analysis of soybean seed adhesion and root colonization of P. putida KT2440 and the isolates EFY1, EFY2, EFY3, and EFY4. Soybean plants were grown in sand (watered with 80 mM NaCl saline solution) and in slightly saline soil (EC = 1.5 dS/m, watered with distilled water).
StrainsSoybean Seeds (UFC/mL)Soybean Roots in Sand + NaCl (CFU/g Root)Soybean Roots in Slightly Saline Soil (CFU/g Root)
KT24401.6 × 106 ± 6.8 × 10⁵ b3.6 × 106 ± 4.1 × 10⁶ b2.4 × 106 ± 1.5 × 10⁶ a
EFY13.6 × 106 ± 2.6 × 10⁶ b2.9 × 108 ± 3.8 × 10⁸ a5.0 × 106 ± 7.6 × 10⁵ a
EFY26.4 × 106 ± 4.0 × 10⁵ b8.9 × 108 ± 9.3 × 10⁸ a3.8 × 106 ± 2.0 × 10⁵ a
EFY38.1 × 106 ± 2.8 × 10⁶ a, b6.1 × 108 ± 1.0 × 10⁸ a2.8 × 106 ± 4.3 × 10⁶ a
EFY41.6 × 107 ± 6.7 × 10⁶ a7.9 × 108 ± 1.2 × 10⁸ a7.1 × 106 ± 4.8 × 10⁶ a
Data express mean ± standard deviation values of four independent trials. Values within columns followed by different letters indicate significant differences among the strains in each condition (p < 0.05, Tukey’s test).
Table 4. Germination rate (%), vigor index, and percentage of soybean plants in phenological stage V2 after 21 days of growth under non-saline and slightly saline soils.
StrainsGermination Rate (%)Vigor IndexV2 (% of Plants in Phenological State V2)
Non-SalineSalineNon-SalineSalineNon-SalineSaline
Control80.0 ± 5.6 c60.0 ± 5.6 c360.4 ± 82.9 c217.8 ± 38.2 c36.6 ± 4.7 b19.5 ± 3.0 c
KT244096.0 ± 0.0 b94.0 ± 2.8 b438.0 ± 106.0 a,b344.9 ± 58.0 b47.9 ± 2.9a18.7 ± 2.9c
EFY1100.0 ± 0.0 a100.0 ± 0.0 a451,8 ± 77.9 a347.3 ± 72.5 b38.0 ± 2.8 b30.0 ± 2.8 b
EFY2100.0 ± 0.0 a100.0 ± 0.0 a388,2 ± 88.4 b,c356.5 ± 49.0 b14.0 ± 2.8 c10.0 ± 2.8 d
EFY3100.0 ± 0.0 a100.0 ± 0.0 a440,5 ± 100.4 a,b407.8 ± 68,0 a38.0 ± 2.8 b64.5 ± 2.9 a
EFY4100.0 ± 0.0 a100.0 ± 0.0 a408.9 ± 123.0 a,b,c396.2 ± 46.5 a34.0 ± 2.8 b31.2 ± 2.9 b
Different letters indicate significant differences among the strains for each condition (p < 0.05, Tukey’s test).
Publisher’s Note: MDPI stays neutral with regard to jurisdictional claims in published maps and institutional affiliations.

