
Bioactive Compounds and Antioxidant Capacity of Valencian Pepper Landraces

 ,
,  ,
, 

Abstract
1. Introduction
2. Results
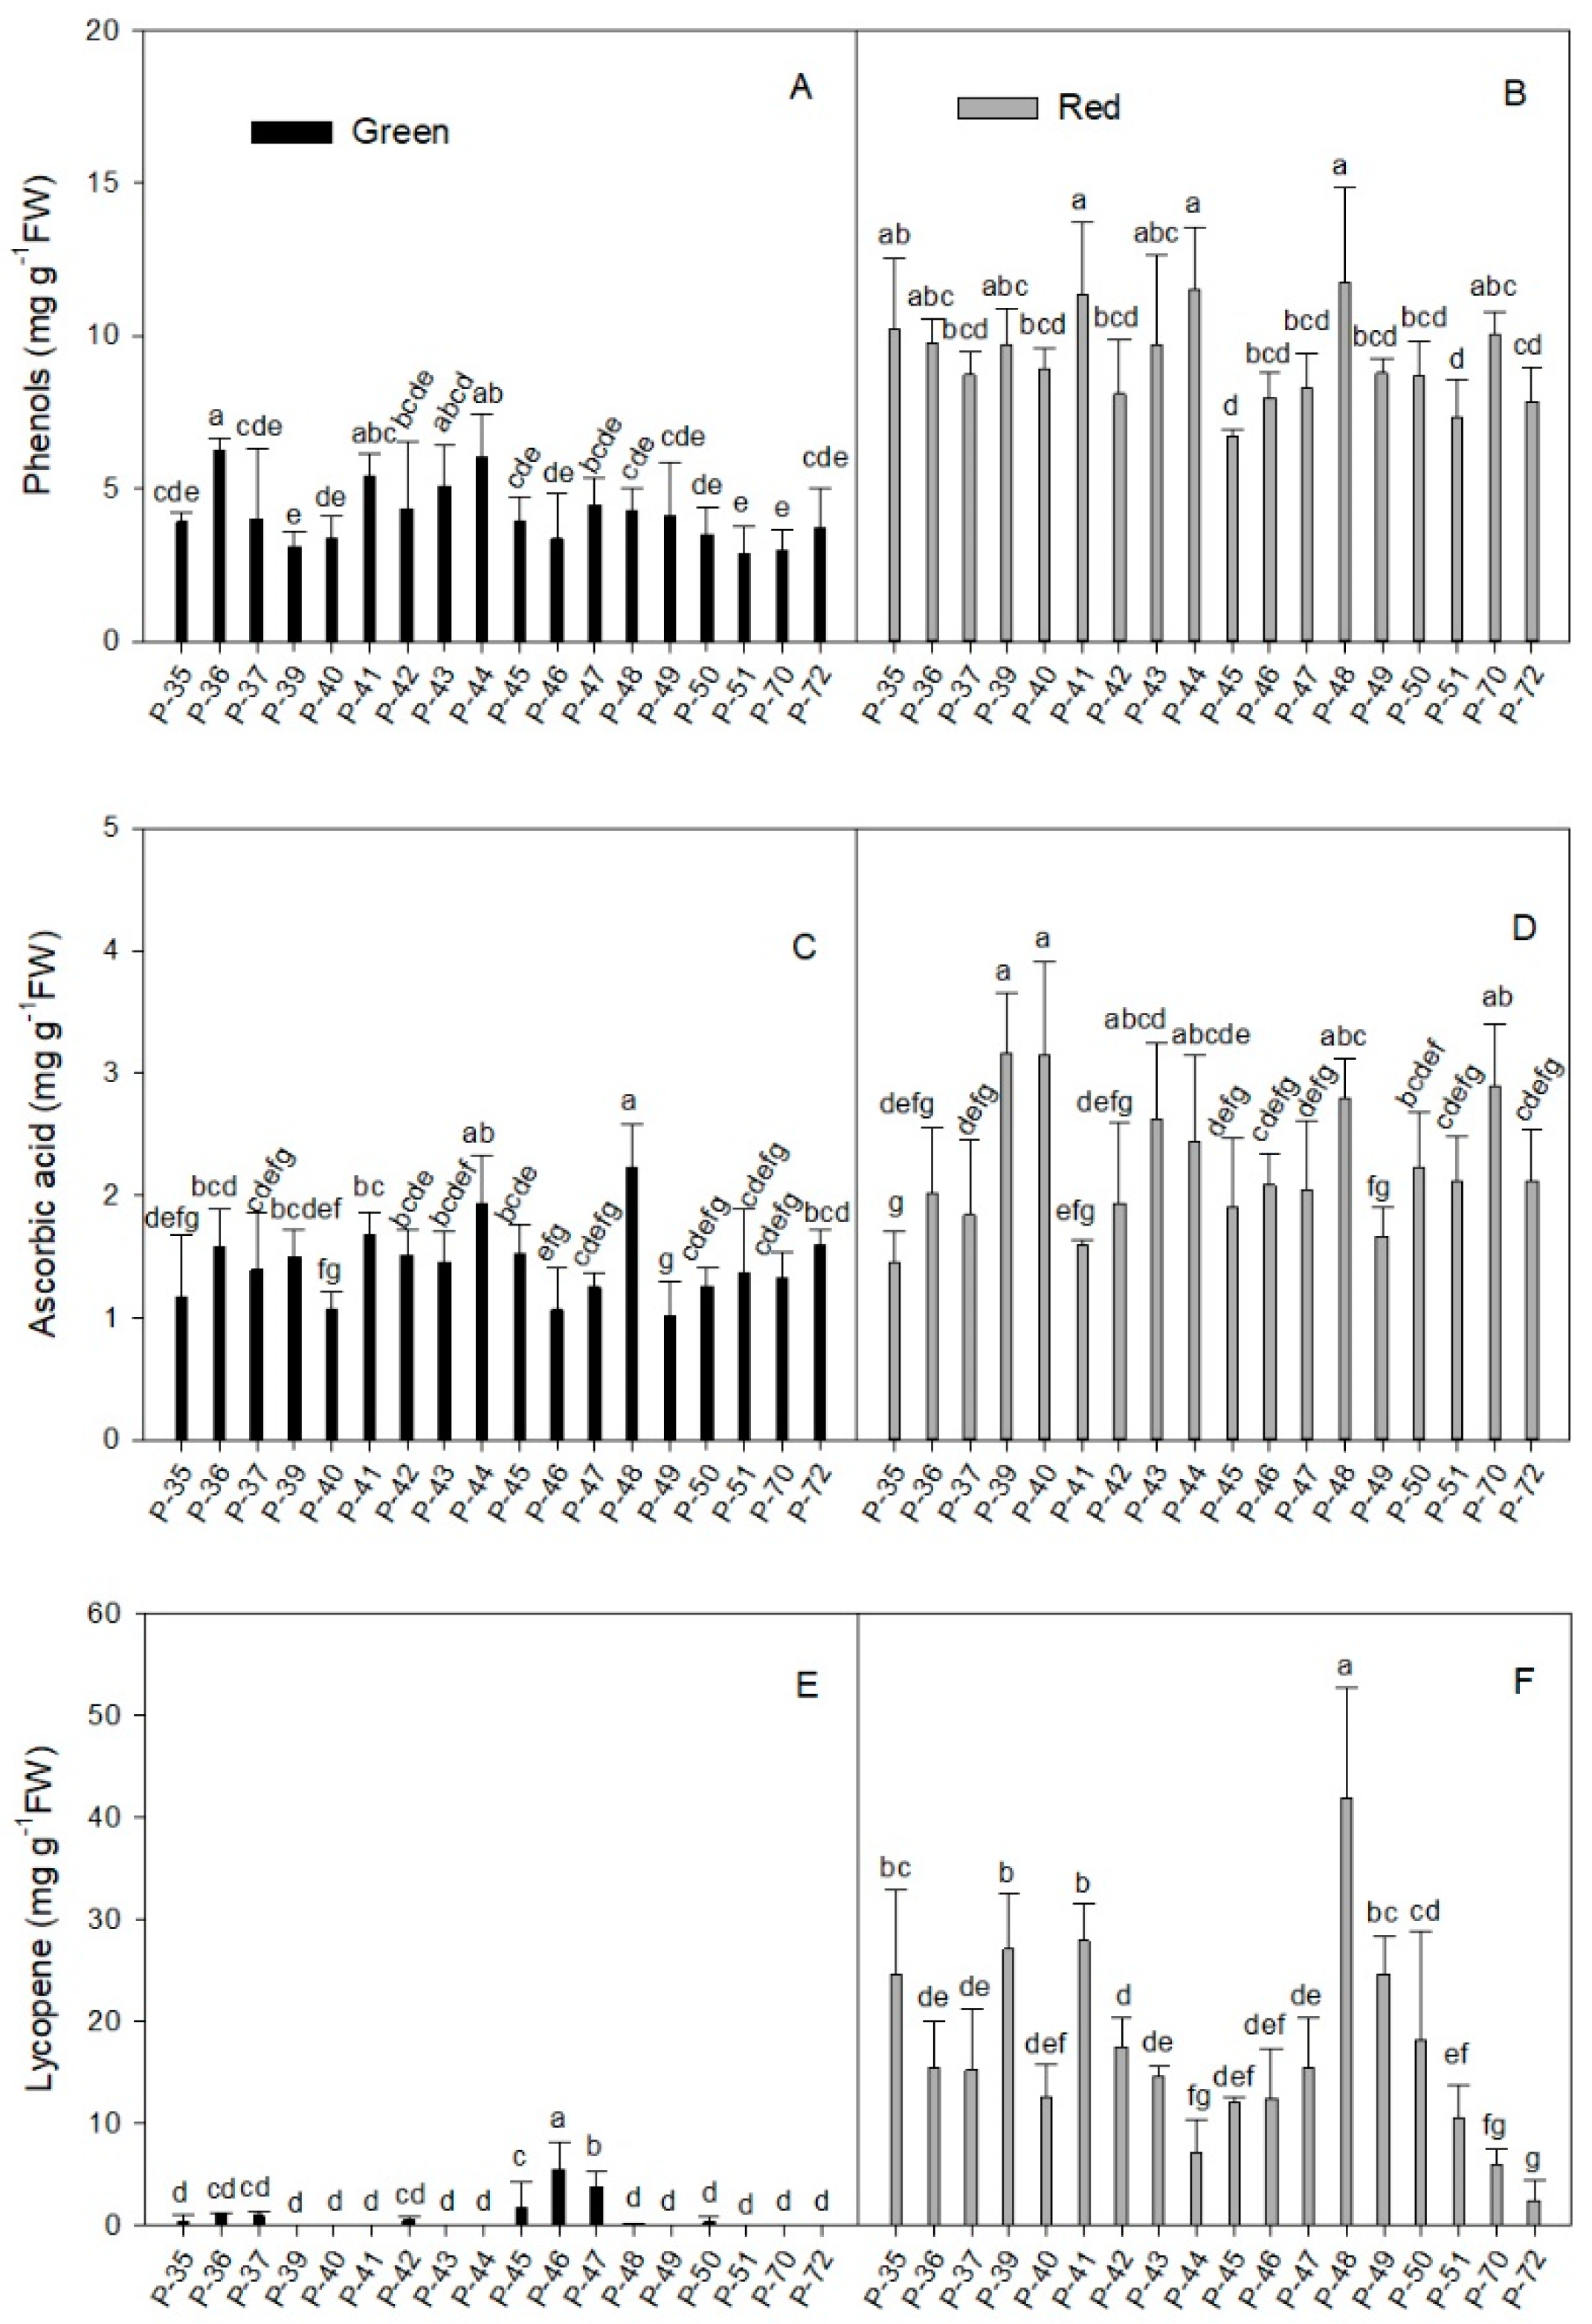
2.1. Nutraceutical Compounds and Antioxidant Capacity
2.1.1. Phenols
2.1.2. Total Ascorbic Acid
2.1.3. Lycopene
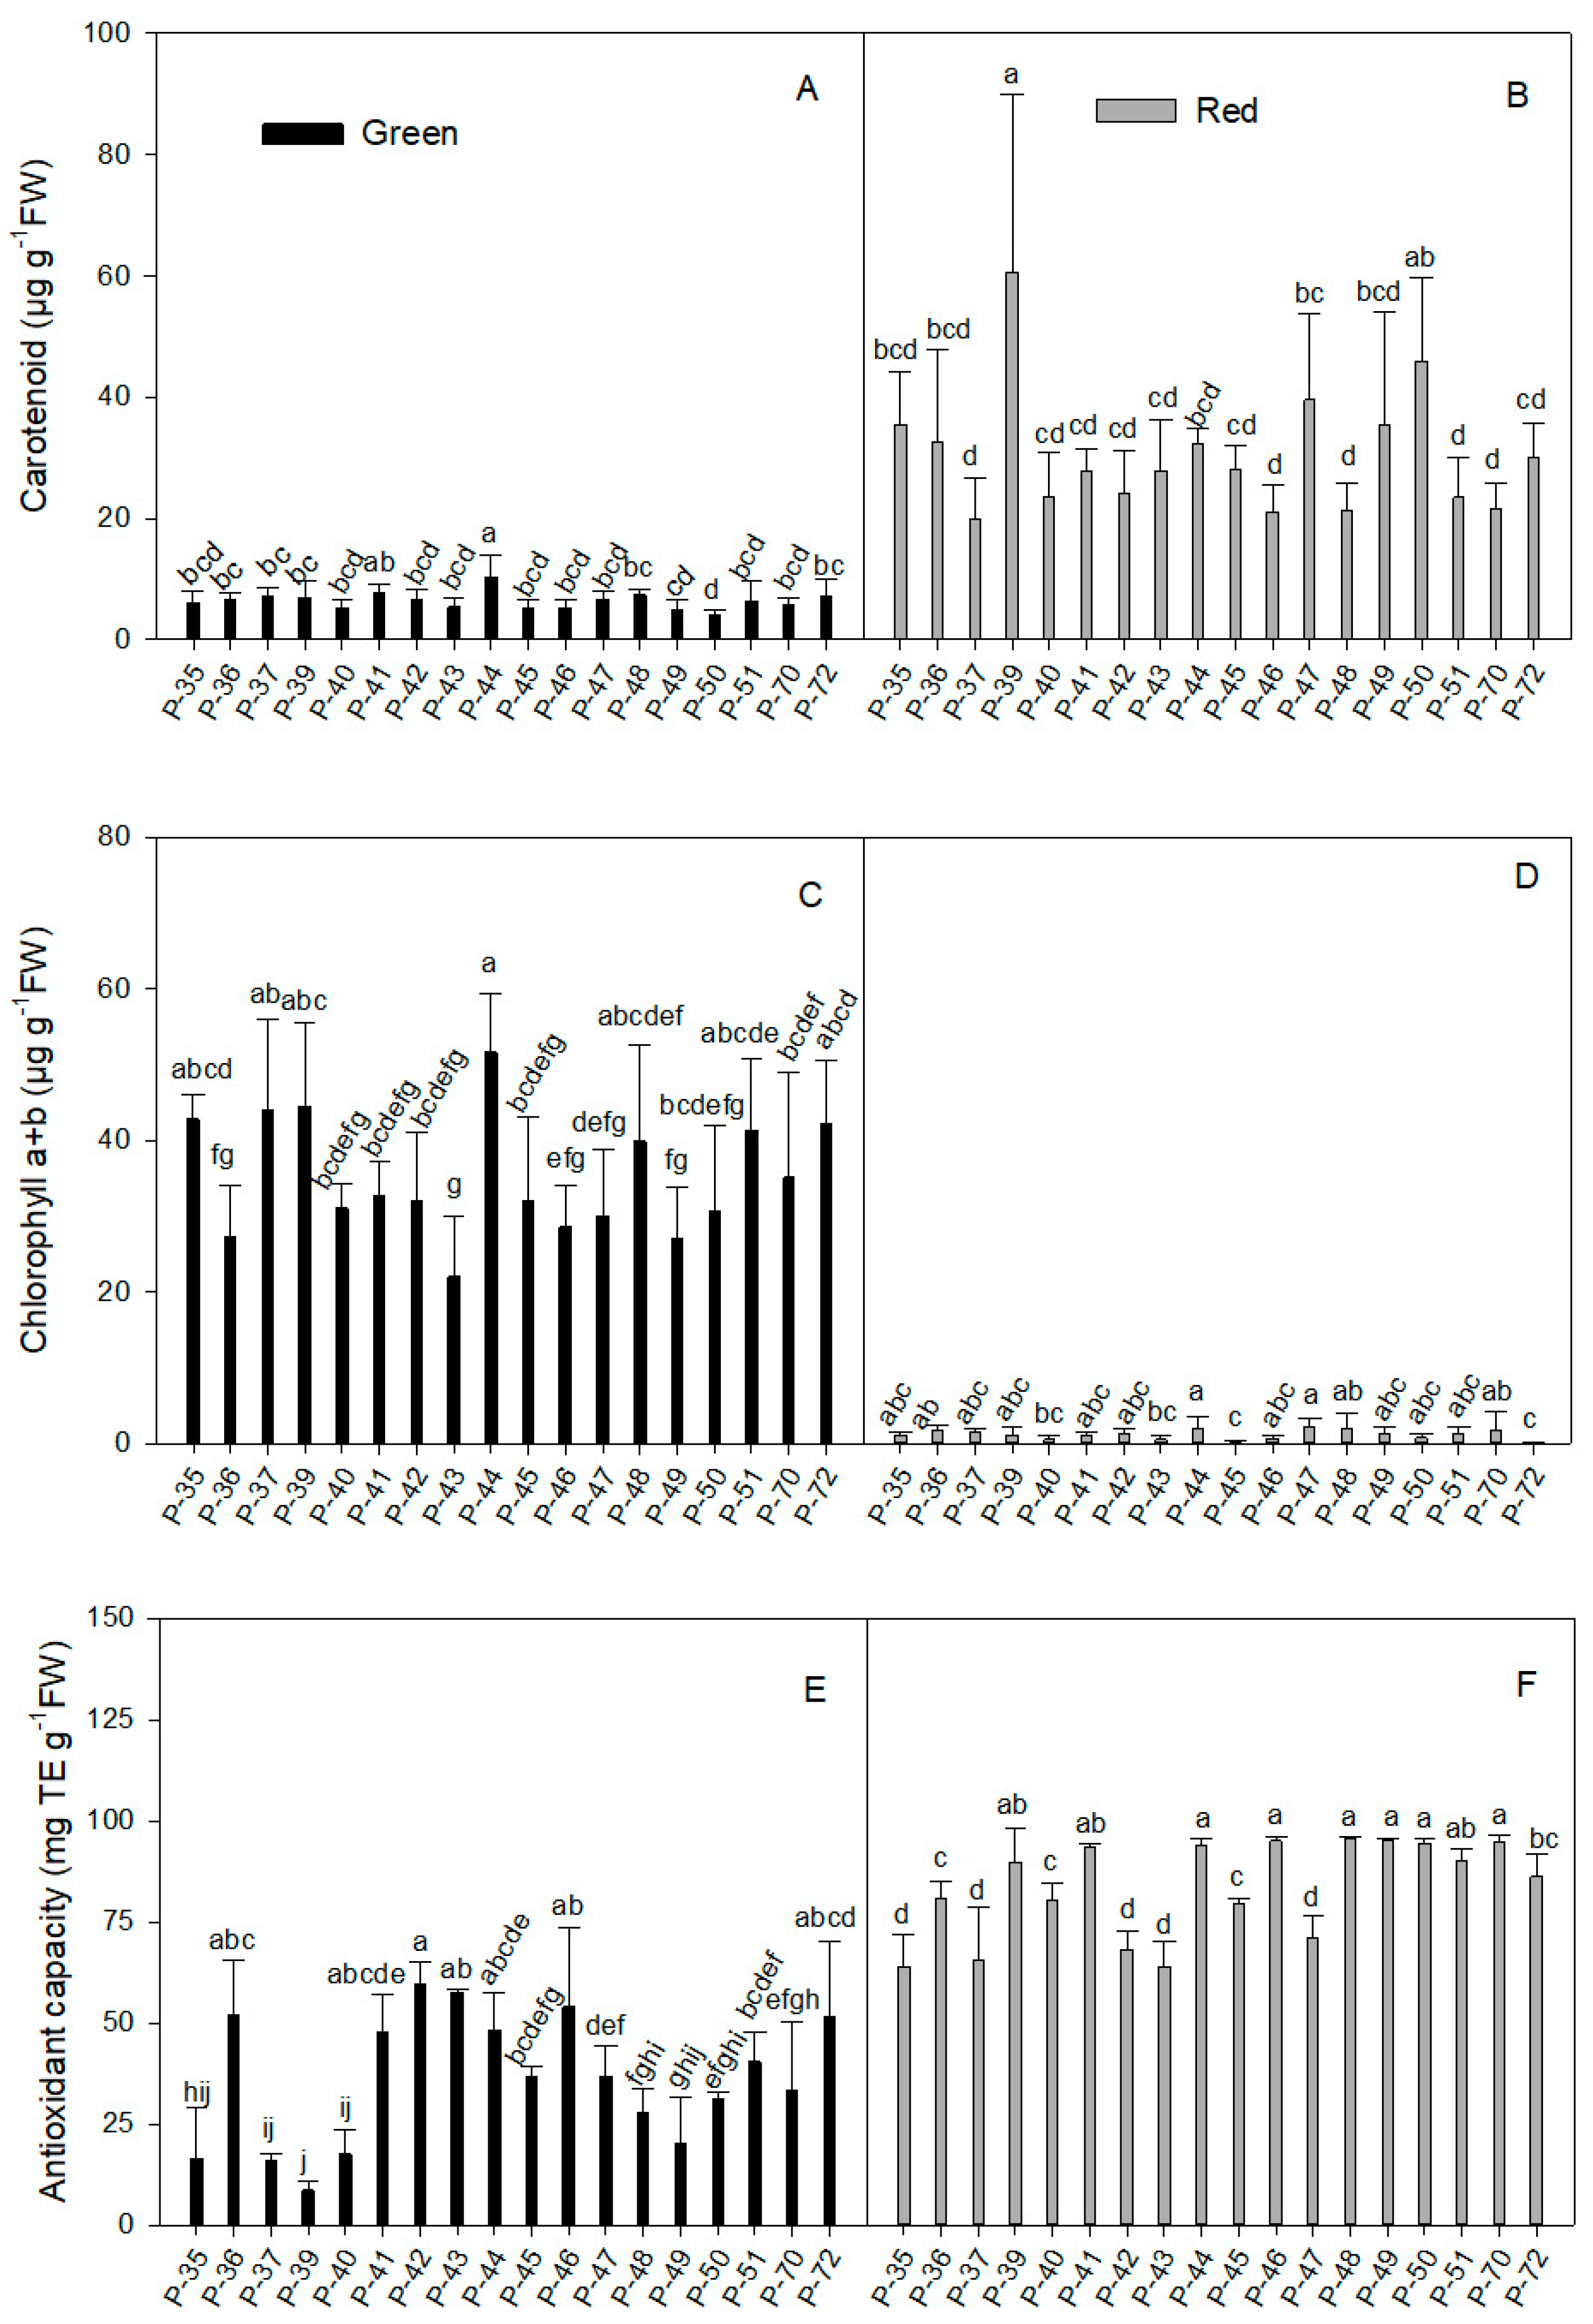
2.1.4. Carotenoid
2.1.5. Total Chlorophyll Concentration
2.1.6. Antioxidant Capacity
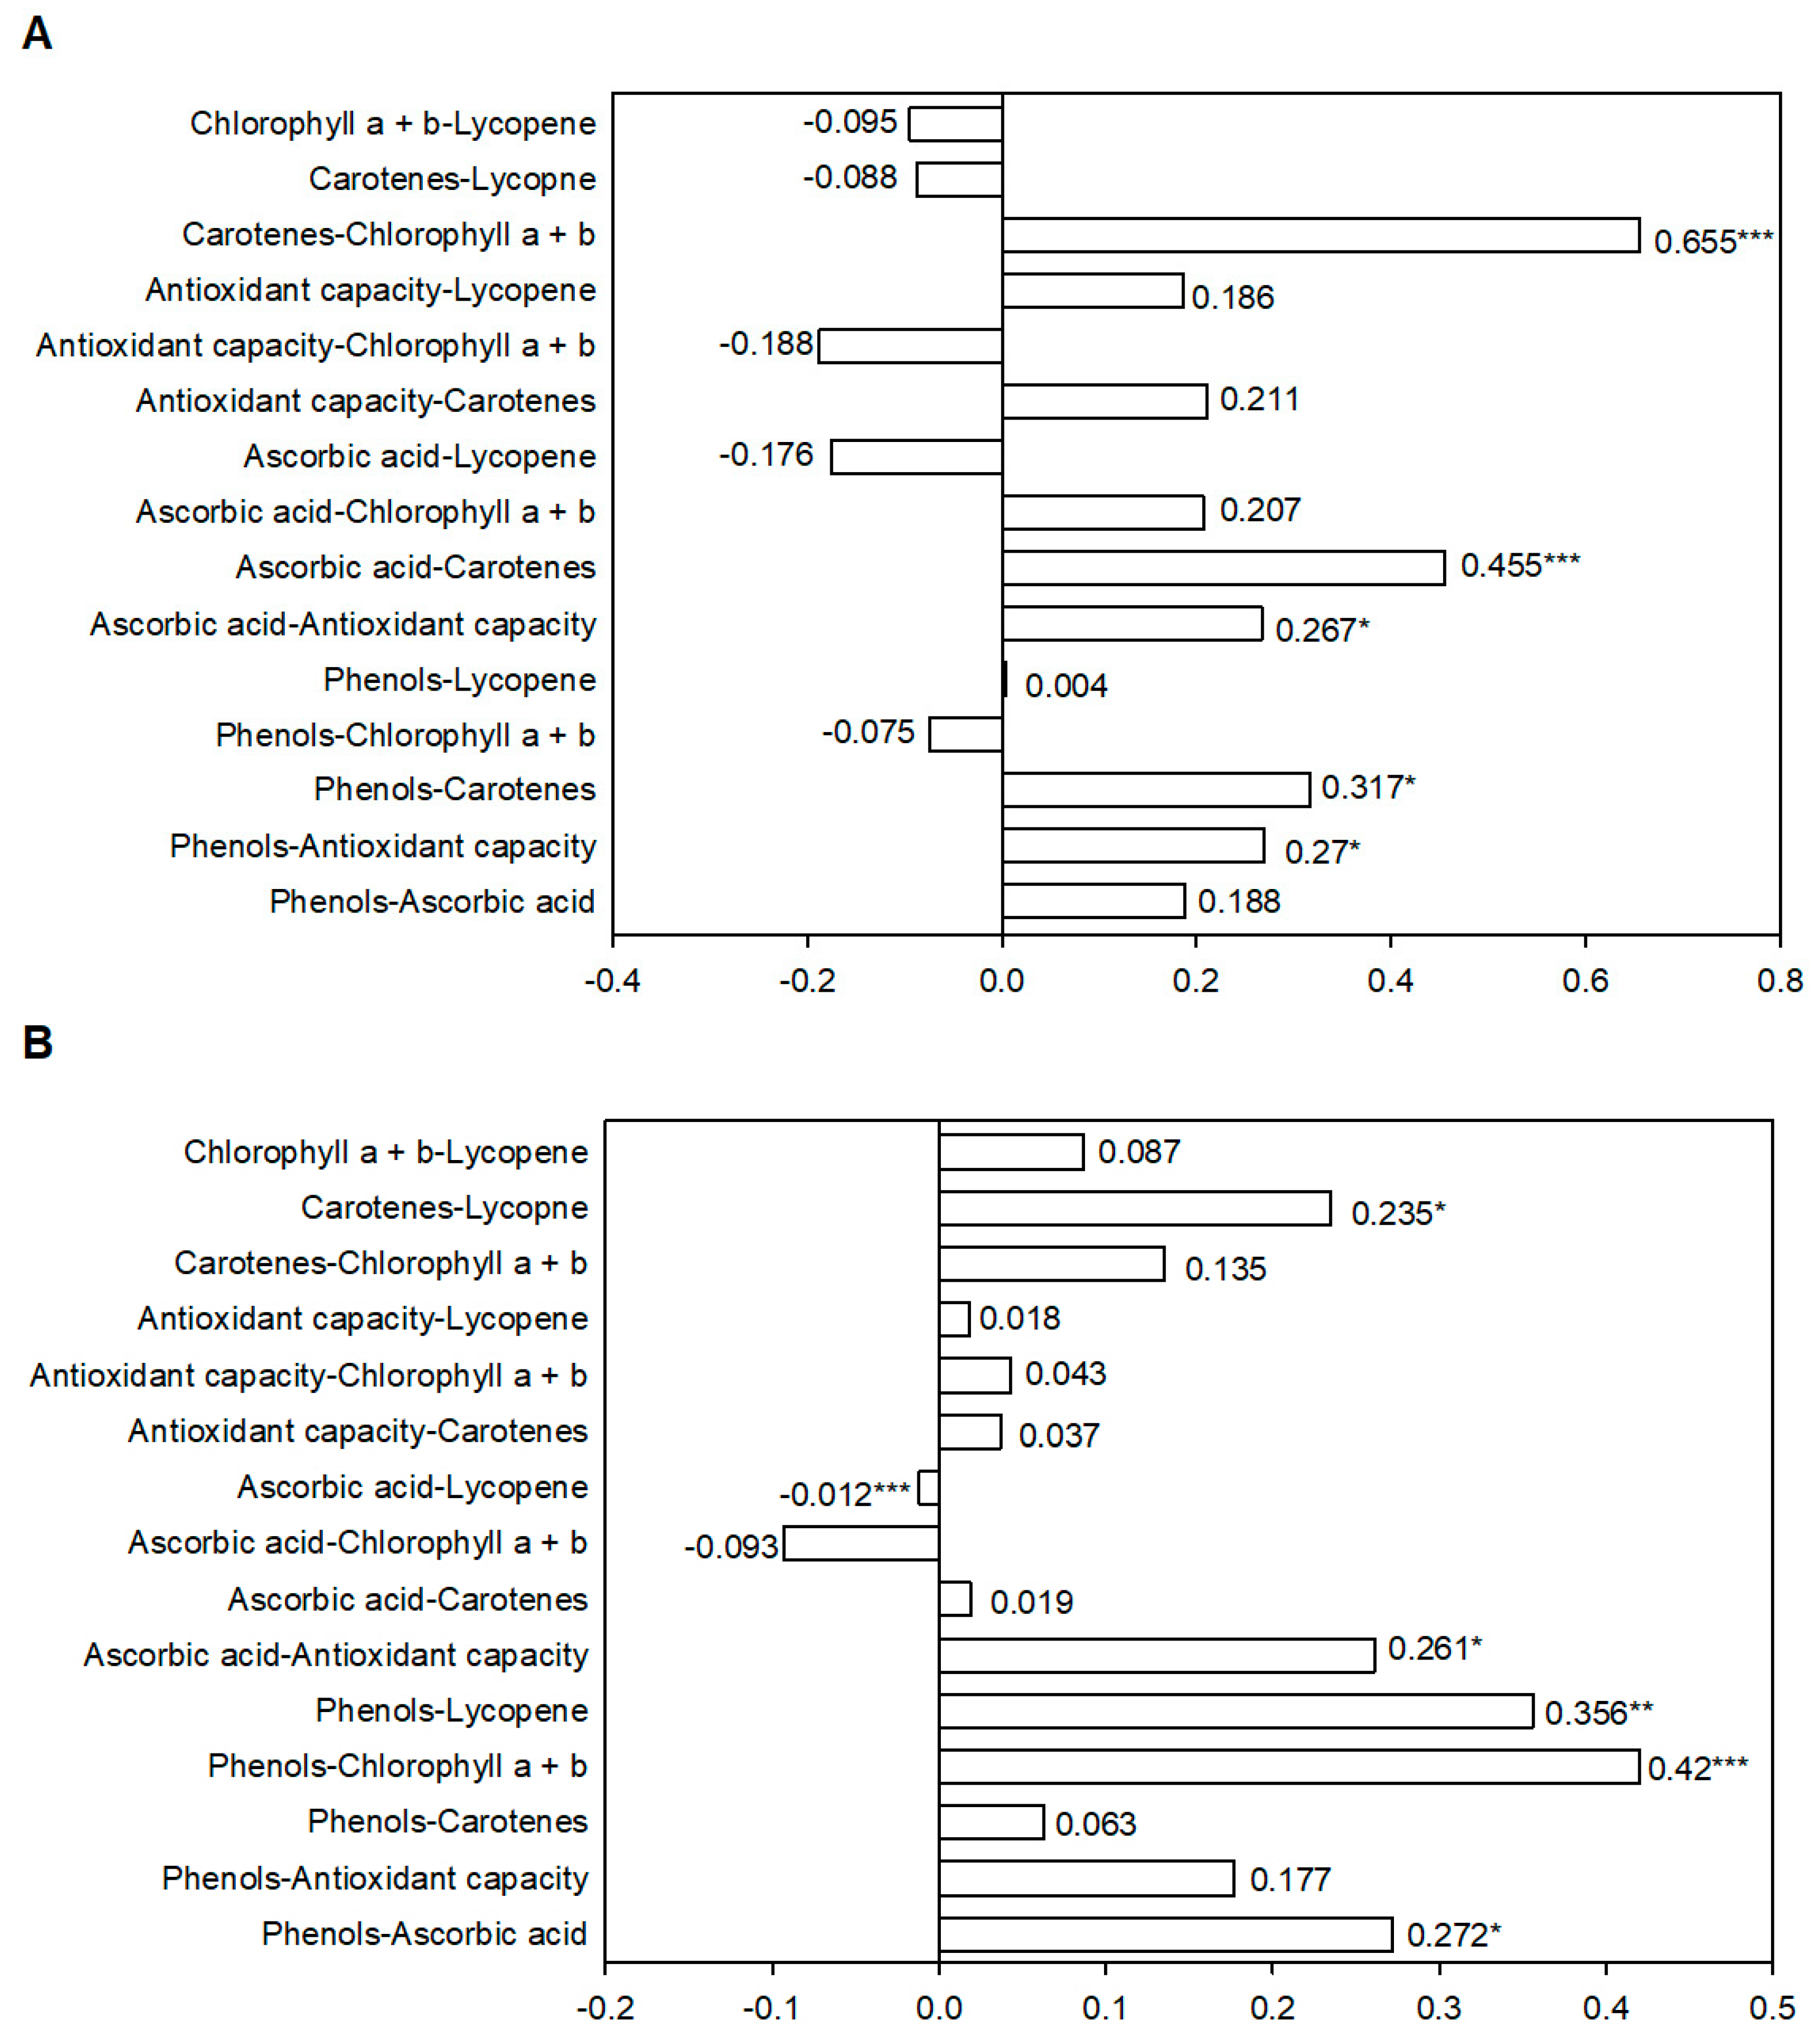
2.2. Nutraceutical Compounds and Antioxidant Capacity Correlations in Green and Red Fruits
2.3. PCA Analysis
2.4. Differences between Accession Groups
3. Discussion
4. Materials and Methods
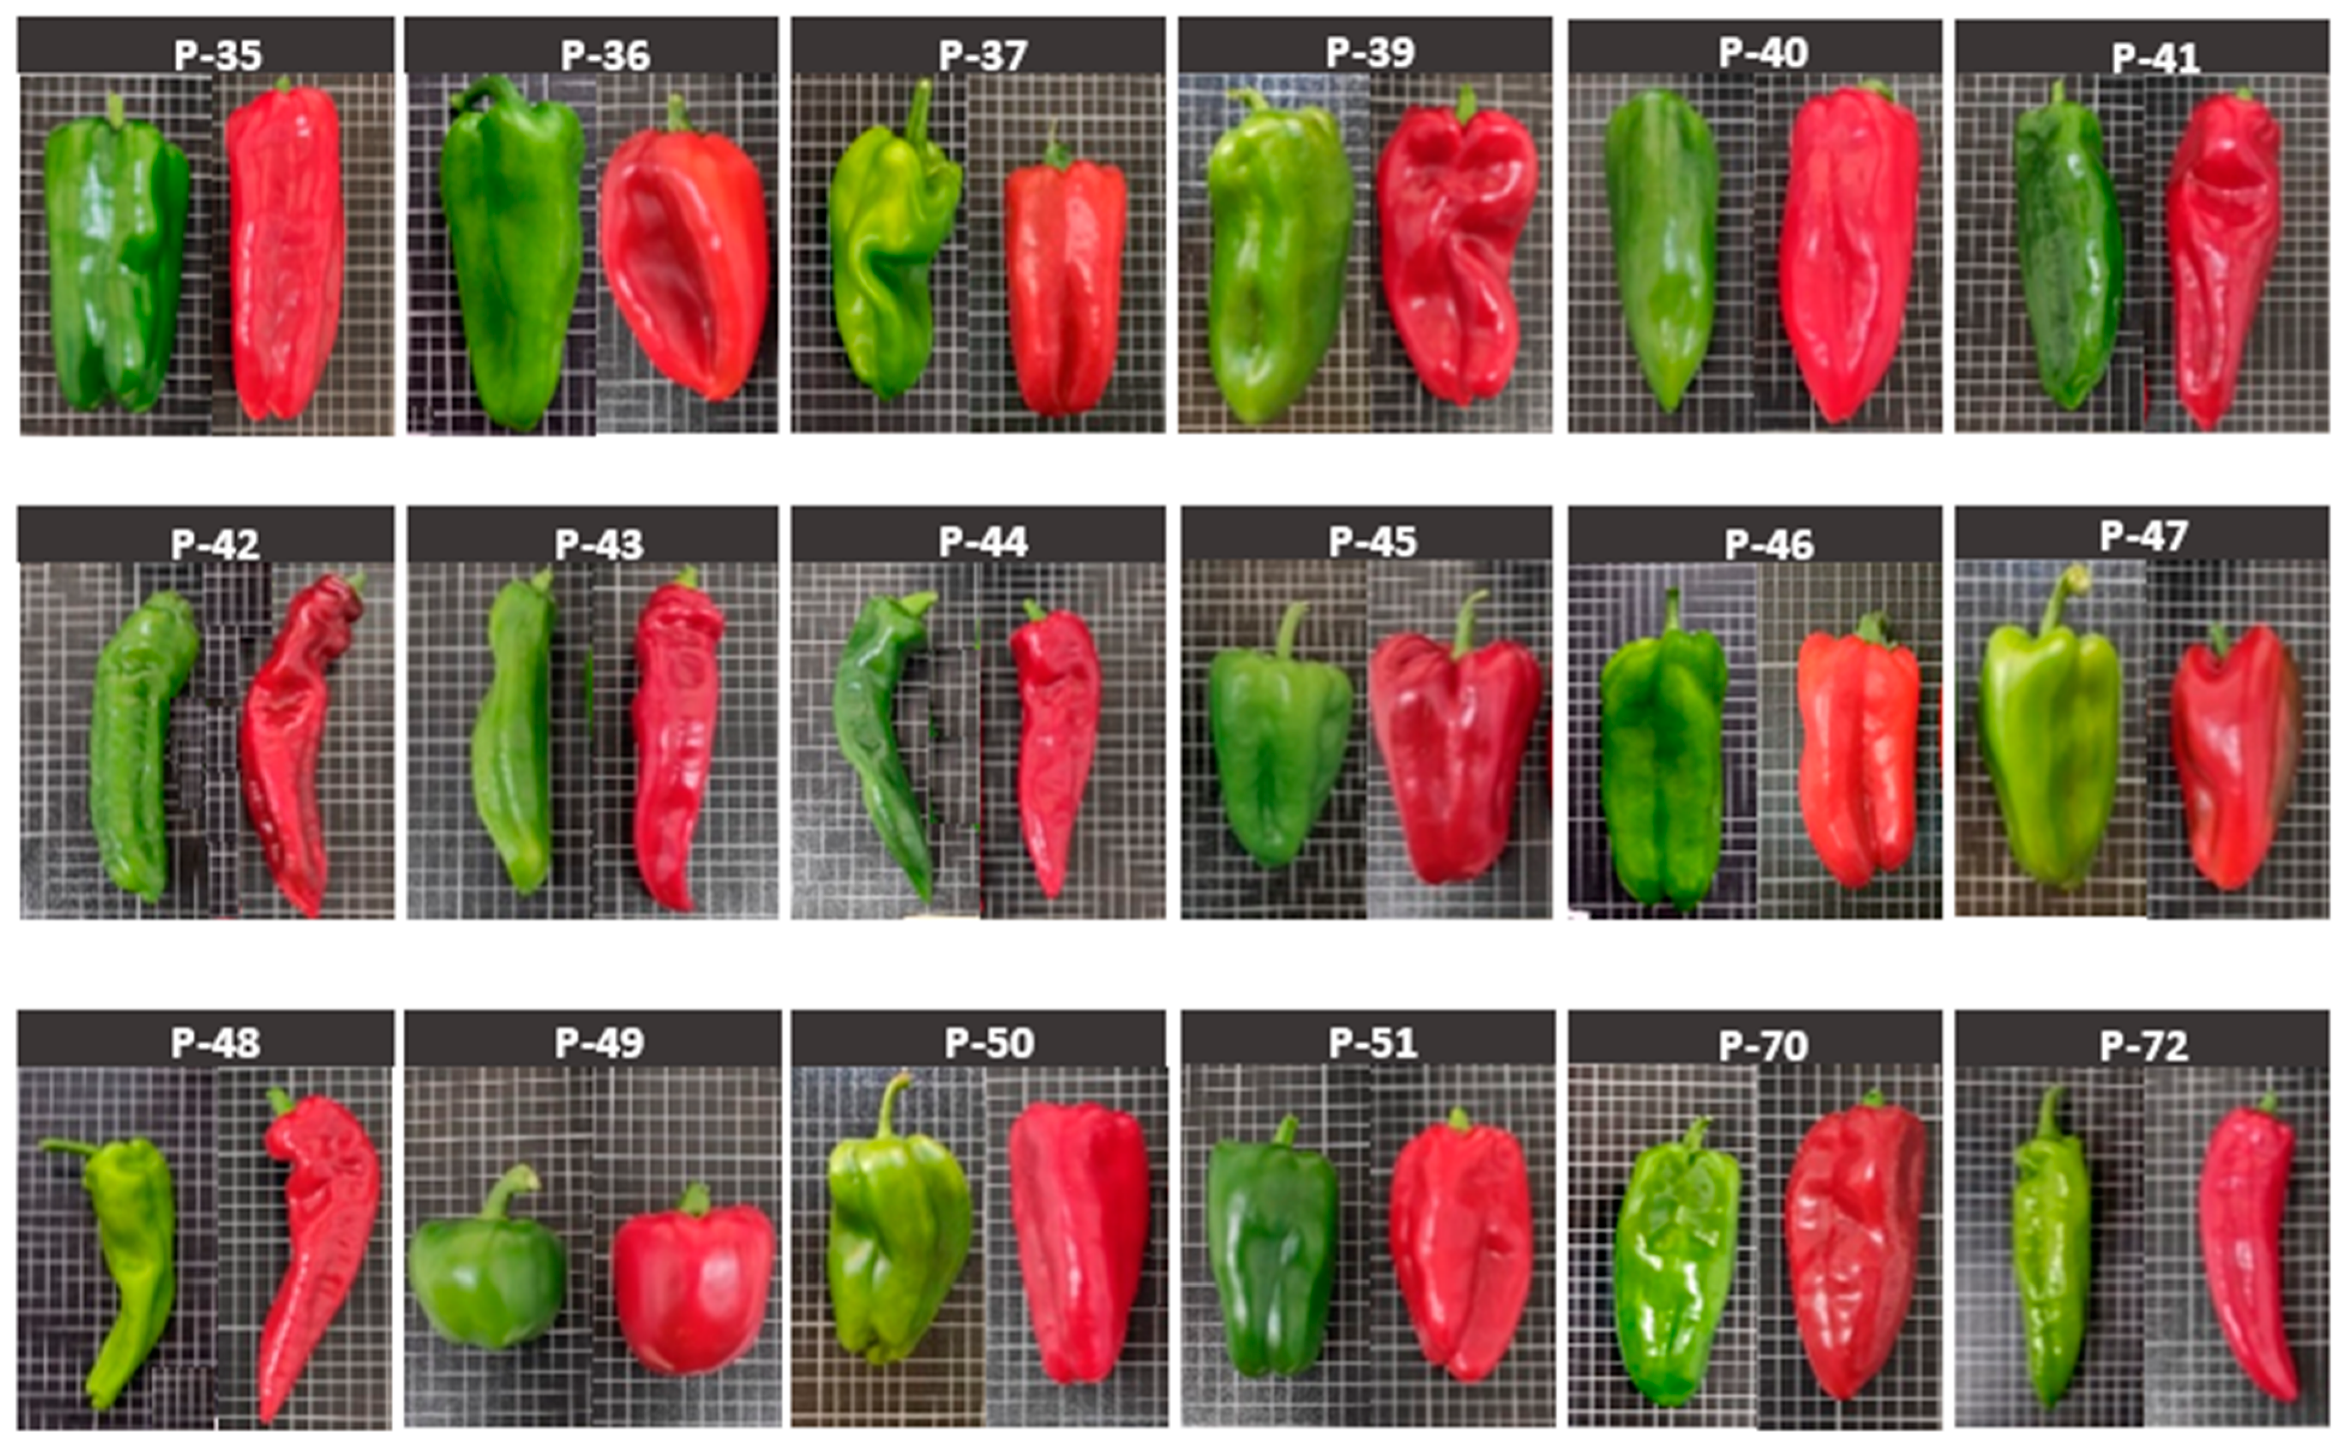
4.1. Plant Material
4.2. Greenhouse Experiment
4.3. Nutraceutical Compounds and Antioxidant Capacity
4.3.1. Sample Preparation
4.3.2. Total Phenolic Analysis
4.3.3. Ascorbic Acid Concentration
4.3.4. Antioxidant Capacity Measurements
4.3.5. Carotenoids and Chlorophyll Concentration
4.3.6. Lycopene Concentration
4.4. Statistical Analysis
5. Conclusions
Author Contributions
Funding
Institutional Review Board Statement
Informed Consent Statement
Data Availability Statement
Conflicts of Interest
Sample Availability
References
- Chávez-Mendoza, C.; Sánchez, E.; Munõz-Márquez, E.; Sida-Arreola, J.P.; Flores-Cordova, M. Bioactive compounds and antioxidant activity in different grafted varieties of bell pepper. Antioxidants 2015, 4, 427–446. [Google Scholar] [CrossRef]
- Jain, S.M.; Gupta, S.D. Biotechnology of Neglected and Underutilized Crops; Springer: Berlin, Germany, 2013. [Google Scholar]
- Cebrino, F.; Ruiz, M.; Yuste, M.; García, M.; Gómez, D. Characterization of traditional tomato varieties grown in organic conditions. Span. J. Agric. Res. 2011, 2, 444–452. [Google Scholar] [CrossRef]
- Ribes-Moya, A.; Raigón, M.; Moreno-Peris, E.; Fita, A.; Rodríguez-Burruezo, A. Response to organic cultivation of heirloom Capsicum peppers: Variation in the level of bioactive compounds and effect of ripening. PLoS ONE 2018, 13, e0207888. [Google Scholar] [CrossRef]
- Rouphael, Y.; Schwarz, D.; Krumbein, A.; Colla, G. Impact of grafting on product quality of fruit vegetables. Sci. Hortic. 2010, 127, 172–179. [Google Scholar] [CrossRef]
- Kumar, A.; Verma, A.K. Biodiversity loss and its Ecological impact in India. Int. J. Biol. Sci. 2017, 8, 156–160. [Google Scholar]
- Castillo, R. Agricultura tradicional campesina: Características ecológicas. Tecnol. Marcha 2008, 21, 3–13. [Google Scholar]
- Fratianni, F.; Cozzolino, A.; d’Acierno, A.; Nazzaro, F.; Riccardi, R.; Spigno, P. Qualitative Aspects of Some of Some Traditional Landraces of the Tomato “Piennolo” (Solanum lycopersicum L.) of the Campania Region, Southern Italy. Antioxidants 2020, 9, 565. [Google Scholar] [CrossRef]
- Gragera-Facundo, J.; Gutiérrez-Perera, J.; González-García, J.; Esteban-Perdigón, A.; Giraldo-Ramos, E.; Gil-Torralvo, C. Trabajos preliminares de selección de variedades tradicionales de tomate en condiciones de cultivo ecológico. Acta Hortic. 2008, 50, 48–52. [Google Scholar]
- Majerska, J.; Michalska, A.; Figiel, A. A review of new directions in managing fruit and vegetable processing by-products. Trends in Food Sci. Technol. 2019, 88, 207–219. [Google Scholar] [CrossRef]
- Samuels, J. The Solanaceae-novel crops with high potential. Org. Grower. 2009, 9, 32–34. [Google Scholar]
- Knapp, S.; Bohs, L.; Nee, M.; Spooner, D. Solanaceae: A model for linking genomics with biodiversity. Comp. Funct. Genom. 2004, 5, 285–291. [Google Scholar] [CrossRef]
- González-Gordo, S.; Bautista, R.; Claros, M.; Cañas, A.; Palma, J.; Corpas, F. Nitric oxide-dependent regulation of sweet pepper fruit ripening. J. Exp. Bot. 2019, 70, 4557–4570. [Google Scholar] [CrossRef]
- Food and Agriculture Organization Faostat. Food and Agriculture Data; Food and Agriculture Organization: Rome, Italy, 2019; Available online: http://www.fao.org/faostat/en/#data/QC (accessed on 31 August 2020).
- Daood, H.; Kapitány, J.; Biacs, P.; Albrecht, K. Drying temperature, endogenous antioxidants and capsaicinoids affect carotenoid stability in paprika (red pepper spice). J. Sci. Food Agric. 2006, 86, 2450–2457. [Google Scholar] [CrossRef]
- Dillard, C.; German, J. Phytochemicals: Nutraceuticals and human health. J. Sci. Food Agric. 2000, 80, 1744–1756. [Google Scholar] [CrossRef]
- Botonaki, A.; Polymeros, K.; Tsakiridou, E.; Mattas, K. The role of food quality certification on consumers’ food choices. Brit. Food J. 2006, 108, 77–90. [Google Scholar] [CrossRef]
- Pandey, K.; Rizvi, S. Plant polyphenols as dietary antioxidants in human health and disease. Oxid. Med. Cell. Longev. 2009, 2, 270–278. [Google Scholar] [CrossRef]
- Howard, L.; Talcott, S.; Brenes, C.; Villalon, B. Changes in phytochemical and antioxidant activity of selected pepper landraces (Caspicum species) as influenced by maturity. J. Agric. Food Chem. 2000, 48, 1713–1720. [Google Scholar] [CrossRef] [PubMed]
- Zhuang, Y.; Chen, L.; Sun, L.; Cao, J. Bioactive characteristics and antioxidant activities of nine peppers. J. Funct. Foods. 2012, 4, 331–338. [Google Scholar] [CrossRef]
- Gisbert-Mullor, R.; Ceccanti, C.; Gara Padilla, Y.; López-Galarza, S.; Calatayud, A.; Conte, G.; Guidi, L. Effect of Grafting on the Production, Physico-Chemical Characteristics and Nutritional Quality of Fruit from Pepper Landraces. Antioxidants 2020, 9, 501. [Google Scholar] [CrossRef]
- Chávez-Mendoza, C.; Sánchez, E.; Carvajal-Millán, E.; Munõz-Márquez, E.; Guevara-Aguillar, A. Characterization of the nutraceutical quality and antioxidant activity in bell pepper in response to grafting. Molecules 2013, 18, 15689–15703. [Google Scholar] [CrossRef]
- López-Marín, J.; González, A.; Pérez-Alfocea, F.; Egea-Gilabert, C.; Fernández, J. Grafting is an efficient alternative to shading screens to alleviate thermal stress in greenhouse-grown sweet pepper. Sci. Hortic. 2013, 149, 39–46. [Google Scholar] [CrossRef]
- Vrcek, I.; Samobor, V.; Bojic, M.; Saric, M.; Vukobratovic, M.; Erhatic, R.; Horvat, D.; Matotan, Z. The effect of grafting on the antioxidant properties of tomato (Solanum lycopersicum L.). Span. J. Agric. Res. 2011, 3, 844–851. [Google Scholar] [CrossRef]
- Helmja, K.; Vaher, M.; Gorbatšova, J.; Kaljurand, M. Characterization of bioactive compounds contained in vegetables of the Solanaceae family by capillary electrophoresis. Proc. Eston. Acad. Sci. Chem. 2007, 56, 172–186. [Google Scholar]
- Antonious, G.; Lobel, L.; Kochhar, T.; Berke, T.; Jarret, R. Antioxidants in Capsicum chinense: Variation among countries of origin. J. Environ. Sci. Heal. B 2009, 44, 621–626. [Google Scholar] [CrossRef]
- Sun, T.; Xu, Z.; Wu, C.; Janes, M.; Prinyawiwatkul, W.; No, H. Antioxidant activities of different colored sweet bell peppers (Capsicum annuum L.). J. Food Sci. 2007, 72, 98–102. [Google Scholar] [CrossRef] [PubMed]
- Shaha, R.; Rahman, S.; Asrul, A. Bioactive compounds in chilli peppers (Capsicum annuum L.) at various ripening (green, yellow and red) stages. Ann. Biol Res. 2013, 4, 27–34. [Google Scholar]
- Kevers, C.; Falkowski, M.; Tabart, J.; Defraigne, J.; Dommes, J.; Pincemail, J. Evolution of antioxidant capacity during storage of selected fruits and vegetables. J. Agric. Food Chem. 2007, 55, 8596–8603. [Google Scholar] [CrossRef]
- Rodríguez-Burruezo, A.; Raigón, M.; Prohens, J.; Nuez, F. Characterization for bioactive compounds of Spanish pepper landraces. Acta Hortic. 2011, 918, 537–543. [Google Scholar] [CrossRef]
- Vera-Guzmán, A.; Chávez-Servia, J.; Carrillo-Rodríguez, J.; López, M. Phytochemical evaluation of wild and cultivated pepper (Capsicum annuum L. and C. pubescens Ruiz & Pav.) from Oaxaca, Mexico. Chil. J. Agric. Res. 2011, 71, 578–585. [Google Scholar]
- Navarro, J.; Flores, P.; Garrido, C.; Martinez, V. Changes in the contents of antioxidant compounds in pepper fruits at different ripening stages, as affected by salinity. Food Chem. 2006, 96, 66–73. [Google Scholar] [CrossRef]
- Blanco-Ríos, A.; Medina-Juarez, L.; González-Aguilar, G.; Gamez-Meza, N. Antioxidant activity of the phenolic and oily fractions of different sweet bell peppers. J. Mex. Chem. Soc. 2013, 57, 137–143. [Google Scholar] [CrossRef]
- Marín, A.; Ferreres, F.; Tomás-Barberán, F.; Gil, M. Characterization and quantitation of antioxidant constituents of sweet pepper (Capsicum annuum L.). J. Agric. Food Chem. 2004, 52, 3861–3869. [Google Scholar] [CrossRef]
- Hervert-Hernandez, D.; Sayago-Ayerdi, S.; Goñi, I. Bioactive compounds of four hot pepper varieties (Capsicum annuum L.), antioxidant capacity, and intestinal bioaccessibility. J. Agric. Food Chem. 2010, 58, 3399–3406. [Google Scholar] [CrossRef] [PubMed]
- Materska, M.; Perucka, I. Antioxidant activity of the main phenolic compounds isolated from hot pepper (Capsicum annuum L.). J. Agric. Food Chem. 2005, 53, 1750–1756. [Google Scholar] [CrossRef]
- Awad, M.; Al-Qurashi, A.; Mohamed, S. Antioxidant capacity, antioxidant compounds and antioxidant enzyme activities in five date cultivars during development and ripening. Sci. Hortic. 2011, 129, 688–693. [Google Scholar] [CrossRef]
- Yu, P.; Davy, B.; Wilson, J.; Melby, C. Antioxidant properties of cereal products. J. Food. Sci. 2002, 67, 2600–2603. [Google Scholar] [CrossRef]
- Kähkönen, M.P.; Hopia, A.; Vuorela, H.; Rauha, J.; Pihlaja, K.; Kujala, T.; Heinonen, M. Antioxidant activity of plant extracts containing phenolic compounds. J. Agr. Food Chem. 1999, 47, 3954–3962. [Google Scholar] [CrossRef]
- Stushnoff, C.; McSay, A.; Forsline, P.; Luby, J. Diversity of Phenolic Antioxidant Content and Radical Scavenging Capacity in the USDA Apple Germplasm Core Collection. Acta Hortic. 2003, 623, 305–312. [Google Scholar] [CrossRef]
- Thompson, K.; Marshall, M.; Sims, C.; Wei, C.; Sargent, S.; Scott, J. Cultivar, maturity, and heat treatment on lycopene content in tomatoes. J. Food Sci. 2000, 65, 791–795. [Google Scholar] [CrossRef]
- Bramley, P. Regulation of carotenoid formation during tomato fruit ripening and development. J. Exp. Bot. 2002, 53, 2107–2113. [Google Scholar] [CrossRef]
- Schofield, A.; Vasantha Rupasinghe, H.; Gopinadhan, P. Postharvest Biology and Technology of Fruits, Vegetables and Flowers, 1st ed.; Paliyath, G., Murr, D.P., Handa, A.K., Lurie, S., Eds.; Wiley: New York, NY, USA, 2008; pp. 282–300. [Google Scholar]
- Ronen, G.; Carmel-Goren, L.; Zamir, D.; Hirschberg, J. An alternative pathway to β-carotene formation in plant chromoplasts discovered by map-based cloning of Beta and old-gold color mutations in tomato. Proc. Natl. Acad. Sci. USA 2000, 97, 11102–11107. [Google Scholar] [CrossRef]
- Edge, R.; McGarvey, D.; Truscott, T. The carotenoids as anti-oxidants—A review. J. Photoch. Photobio. B. 1997, 41, 189–200. [Google Scholar] [CrossRef]
- Rao, A.V.; Rao, L.G. Carotenoids and human health. Pharmacol. Res. 2007, 55, 207–216. [Google Scholar] [CrossRef] [PubMed]
- Dutta, S.; Singh, S.; Saha, S.; Akoijam, R.; Boopathi, T.; Banerjee, A.; Vanlalhmangaiha, L.; Roy, S. Diversity in bird’s eye chilli (Capsicum frutescens L.) landraces of north-east India in terms of antioxidant activities. Proc. Natl. Acad. Sci. USA 2016, 87, 1317–1326. [Google Scholar] [CrossRef]
- Sánchez-Torres, P.; Raigón, M.; Gammoudi, N.; Gisbert, C. Effects of grafting combinations on the nutritional composition of pepper fruit. Fruits 2016, 71, 249–256. [Google Scholar] [CrossRef]
- Deli, J.; Molnar, P.; Toth, G. Carotenoid composition in the fruits of red paprika (Capsicum annuum var lycopersiciforme rubrum) during ripening; biosynthesis of carotenoids in red paprika. J. Agric. Food Chem. 2001, 49, 1517–1523. [Google Scholar] [CrossRef] [PubMed]
- Alam, M.; Saleh, M.; Mohsin, G.M.; Nadirah, T.; Aslani, F.; Rahman, M.; Roy, S.; Juraimi, A.; Alam, M. Evaluation of phenolics, capsaicinoids, antioxidant properties, and major macro-micro minerals of some hot and sweet peppers and ginger landraces of Malaysia. J. Food Process. Preserv. 2020, 44, 1–11. [Google Scholar] [CrossRef]
- Hornero-Méndez, D.; Gómez-Ladrón de Guevara, R.; Mínguez-Mosquera, I. Carotenoid biosynthesis changes in five red pepper (Capsicum annuum L.) cultivars during ripening. Cultivar selection for breeding. J. Agric. Food Chem. 2000, 48, 3857–3864. [Google Scholar] [CrossRef] [PubMed]
- Hornero-Méndez, D.; Minguez-Mosquera, I. Xanthophyll esterification accompanying carotenoid overaccumulation in chromoplast of Capsicum annuum ripening fruits is a constitutive process and useful for ripeness index. J. Agric. Food Chem. 2000, 48, 1617–1622. [Google Scholar] [CrossRef]
- Hornero-Méndez, D.; Mínguez-Mosquera, M. Chlorophyll disappearance and chlorophyllase activity during ripening of Capsicum annuum L fruits. J. Sci. Food Agric. 2002, 82, 1564–1570. [Google Scholar] [CrossRef]
- Flores, P.; Sánchez, E.; Fenoll, J.; Hellín, P. Genotypic variability of carotenoids in traditional tomato cultivars. Food Res. Int. 2017, 100, 510–516. [Google Scholar] [CrossRef]
- Tripodi, P.; Cardi, T.; Bianchi, G.; Migliori, C.; Schiavi, M.; Rotino, G.; Scalzo, R. Genetic and environmental factors underlying variation in yield performance and bioactive compound content of hot pepper varieties (Capsicum annuum) cultivated in two contrasting Italian locations. Eur. Food Res. Technol. 2018, 244, 1555–1567. [Google Scholar] [CrossRef]
- Scopa, A.; Posca, G.; Bufo, S.; Scrano, L. Comparative HPLC determination of ascorbic and dehydroascorbic acids in” Peperoni di Senise”, a geographically eurolabelled sweet pepper. Adv. Food Sci. 2006, 28, 39–45. [Google Scholar]
- Domínguez-Martínez, I.; Meza-Márquez, O.; Osorio-Revilla, G.; Proal-Nájera, J.; Gallardo-Velázquez, T. Determination of capsaicin, ascorbic acid, total phenolic compounds and antioxidant activity of Capsicum annuum L. var. serrano by mid infrared spectroscopy (Mid-FTIR) and chemometric analysis. J. Korean Soc. Appl Biol Chem. 2014, 57, 133–142. [Google Scholar]
- Osuna-García, J.; Marisa, M.; Cynthia, A. Endogenous levels of tocopherols and ascorbic acid during fruit ripening of New Mexican-type chile (Capsicum annuum L.) cultivars. J. Agr. Food Chem. 1999, 46, 5093–5096. [Google Scholar] [CrossRef]
- Palma, J.; Terán, F.; Contreras-Ruiz, A.; Rodríguez-Ruiz, M.; Corpas, F. Antioxidant profile of pepper (Capsicum annuum L.) fruits containing diverse levels of capsaicinoids. Antioxidants 2020, 9, 878. [Google Scholar] [CrossRef]
- Orobiyi, A.; Ahissou, H.; Gbaguidi, F.; Sanoussi, F.; Houngbèmè, A.; Dansi, A.; Sanni, A. Capsaicin and ascorbic acid content in the high yielding chili pepper (Capsicum annuum L.) landraces of northern benin. Int. J. Curr. Microbiol. Appl. Sci. 2015, 4, 394–403. [Google Scholar]
- Guil-Guerrero, J.; Martínez-Guirado, C.; Rebolloso-Fuentes, M.; Carrique-Pérez, A. Nutrient composition and antioxidant activity of 10 pepper (Capsicum annuum) varieties. Eur. Food Res. Technol. 2006, 224, 1–9. [Google Scholar] [CrossRef]
- Topuz, A.; Ozdemir, F. Assessment of carotenoids, capsaicinoids and ascorbic acid composition of some selected pepper cultivars (Capsicum annuum L.) grown in Turkey. J. Food Comp. Anal. 2007, 20, 596–602. [Google Scholar] [CrossRef]
- Martínez, S.; López, M.; González-Raurich, M.; Alvarez, B. The effects of ripening stage and processing systems on vitamin C content in sweet peppers (Capsicum annuum L.). Int. J. Food Sci. Nutr. 2005, 56, 45–51. [Google Scholar] [CrossRef] [PubMed]
- Ghasemnezhad, M.; Sherafati, M.; Payvast, G. Variation in phenolic compounds, ascorbic acid and antioxidant activity of five coloured bell pepper (Capsicum annum) fruits at two different harvest times. J. Funct. Foods 2011, 3, 44–49. [Google Scholar] [CrossRef]
- Pfendt, L.; Vukašinović, V.; Blagojević, N.; Radojević, M. Second order derivative spectrophotometric method for determination of vitamin C content in fruits, vegetables and fruit juices. Eur. Food Res. Technol. 2003, 217, 269–272. [Google Scholar] [CrossRef]
- Szeto, Y.; Tomlinson, B.; Benzie, I. Total antioxidant and ascorbic acid content of fresh fruits and vegetables: Implications for dietary planning and food preservation. Br. J. Nutr. 2002, 87, 55–59. [Google Scholar] [CrossRef] [PubMed]
- Latham, M. Human nutrition in the Developing World; Food & Agriculture Organization of the United Nations: Rome, Italy, 1997. [Google Scholar]
- Dutta, D.; Chaudhuri, U.; Chakraborty, R. Structure, health benefits, antioxidant property and processing and storage of carotenoids. Afr. J. Biotechnol. 2005, 4, 1510–1520. [Google Scholar] [CrossRef]
- Rice-Evans, C.; Miller, J.; Paganga, G. Antioxidant properties of phenolic compounds. Trends Plant. Sci. 1997, 2, 152–159. [Google Scholar] [CrossRef]
- Araújo, L.; Neves, L.; Sousa, D.; Zeviani, W.; Silva, L.; Marostega, T. Biochemical descriptors: Importance of the genetic divergence study in peppers. Hortic. Bras. 2019, 37, 210–214. [Google Scholar] [CrossRef]
- Plazas, M.; López-Gresa, M.; Vilanova, S.; Torres, C.; Hurtado, M.; Gramazio, P.; Andújar, I.; Herráiz, F.; Bellés, J.; Prohens, J. Diversity and relationships in key traits for functional and apparent quality in a collection of eggplant: Fruit phenolics content, antioxidant activity, polyphenol oxidase activity, and browning. J. Agric. Food Chem. 2013, 61, 8871–8879. [Google Scholar] [CrossRef]
- Kaushik, P.; Prohens, J.; Vilanova, S.; Gramazio, P.; Plazas, M. Phenotyping of eggplant wild relatives and interspecific hybrids with conventional and phenomics descriptors provides insight for their potential utilization in breeding. Front. Plant. Sci. 2016, 7, 1–17. [Google Scholar] [CrossRef] [PubMed]
- Rivera, A.; Monteagudo, A.; Igartua, E.; Taboada, A.; García-Ulloa, A.; Pomar, F.; l Riveiro-Leira, M.; Silvar, C. Assessing genetic and phenotypic diversity in pepper (Capsicum annuum L.) landraces from North-West Spain. Sci. Hortic. 2016, 203, 1–11. [Google Scholar] [CrossRef]
- Penella, C.; Nebauer, S.G.; Quiñones, A.; San Bautista, A.; López-Galarza, S.; Calatayud, A. Some rootstocks improve pepper tolerance to mild salinity through ionic regulation. Plant. Sci. 2015, 230, 12–22. [Google Scholar] [CrossRef]
- Maroto, J. Horticultura Herbácea Especial, 5th ed.; Mundi-Prensa: Madrid, Spain, 2002. [Google Scholar]
- Dewanto, V.; Wu, X.; Adom, K.; Liu, R. Thermal processing enhances the nutritional value of tomatoes by increasing total antioxidant activity. J. Agric. Food Chem. 2002, 50, 3010–3014. [Google Scholar] [CrossRef] [PubMed]
- Kampfenkel, K.; Van Montagu, M.; Inzé, D. Extraction and determination of ascorbate and dehydroascorbate from plant tissue. Anal. Biochem. 1995, 225, 165–167. [Google Scholar] [CrossRef] [PubMed]
- Brand-Williams, W.; Cuvelier, M.; Berset, C. Use of a free radical method to evaluate antioxidant activity. LWT 1995, 28, 25–30. [Google Scholar] [CrossRef]
- Porra, R.; Thompson, W.; Kriedemann, P.E. Determination of accurate extinction coefficients and simultaneous equations for assaying chlorophylls a and b extracted with four different solvents: Verification of the concentration of chlorophyll standards by atomic absorption spectroscopy. Biochim. Biophys. Acta Bioenerg. 1989, 975, 384–394. [Google Scholar] [CrossRef]
- Adejo, G.; Agbali, F.; Otokpa, O. Antioxidant, total lycopene, ascorbic acid and microbial load estimation in powdered tomato varieties sold in Dutsin-Ma market. OALib J. 2015, 2, 1–7. [Google Scholar] [CrossRef]


| Phytochemicals Concentration | Unit/Scale | Mean | Range | CV (%) | F-Ratio |
|---|---|---|---|---|---|
| Green Fruit | |||||
| Phenols | mg g−1 FW | 4.17 ± 1.43 | 1.83–7.24 *** | 34.32 | 2.59 |
| Ascorbic acid | mg g−1 FW | 1.44 ± 0.40 | 0.60–2.47 *** | 27.93 | 3.65 |
| Lycopene | mg g−1 FW | 0.62 ± 1.4 | 0–8.25 ** | 225.06 | 2.46 |
| Carotenoid concentration | µg g−1 FW | 6.35 ± 2.15 | 2.64–13.11 * | 33.87 | 2.12 |
| Chlorophyll a + b | µg g−1 FW | 35.07 ± 10.97 | 14.85–62.82 ** | 31.29 | 2.85 |
| Antioxidant capacity | mg TE g−1 FW | 36.57 ± 17.88 | 6.12–77.84 *** | 48.91 | 8.31 |
| Red Fruit | |||||
| Phenols | mg g−1 FW | 9.20 ± 1.97 | 5.66–15.87 *** | 21.45 | 3.20 |
| Ascorbic acid | mg g−1 FW | 2.24 ± 0.66 | 1.05–3.94 *** | 29.86 | 3.73 |
| Lycopene | mg g−1 FW | 16.98 ± 10.11 | 0.42–49.28 *** | 59.51 | 15.50 |
| Carotenoid concentration | µg g−1 FW | 30.58 ± 14.05 | 12.17–103.88 *** | 45.95 | 3.38 |
| Chlorophyll a + b | µg g−1 FW | 1.18 ± 1.10 | 0–5.31 | 93.18 | 1.46 |
| Antioxidant capacity | mg TE g−1 FW | 83.92 ± 12.4 | 49.68–96.31 *** | 14.77 | 19.42 |
| Component 1 | Component 2 | Component 3 | |
|---|---|---|---|
| Green Fruits | |||
| Phenols | 0.385 | 0.458 | |
| Ascorbic acid | 0.541 | 0.050 | |
| Lycopene | −0.247 | 0.357 | |
| Carotenoid | 0.575 | −0.027 | |
| Chlorophyll a + b | 0.384 | −0.499 | |
| Antioxidant capacity | 0.142 | 0.640 | |
| Eigenvalue | 2.60 | 1.73 | |
| Variance explained (%) | 43.32 | 28.82 | |
| Cumulative variance explained (%) | 43.32 | 72.14 | |
| Red Fruits | |||
| Phenols | 0.602 | 0.136 | −0.155 |
| Ascorbic acid | 0.239 | −0.658 | −0.220 |
| Lycopene | 0.483 | 0.268 | 0.379 |
| Carotenoid | 0.201 | −0.316 | 0.807 |
| Chlorophyll a + b | 0.464 | 0.350 | −0.269 |
| Antioxidant capacity | 0.303 | −0.504 | −0.245 |
| Eigenvalue | 2.02 | 1.22 | 1.03 |
| Variance explained (%) | 33.59 | 20.31 | 17.09 |
| Cumulative variance explained (%) | 33.59 | 53.90 | 70.99 |
| Green Fruits | |||||||||||||||||
| First/Second PC | |||||||||||||||||
| Group | |||||||||||||||||
| A | B | C | D | ||||||||||||||
| Phenols | 5.51 | ± | 1.43 | a | 3.84 | ± | 1.35 | b | 3.46 | ± | 0.98 | b | 4.21 | ± | 1.23 | b | *** |
| Ascorbic acid | 1.66 | ± | 0.31 | a | 1.70 | ± | 0.45 | a | 1.20 | ± | 0.33 | b | 1.34 | ± | 0.29 | b | *** |
| Lycopene | 0.50 | ± | 0.65 | b | 0.20 | ± | 0.41 | b | 0.14 | ± | 0.32 | b | 1.86 | ± | 2.49 | a | *** |
| Carotenoid | 7.80 | ± | 2.49 | a | 7.11 | ± | 1.80 | a | 5.36 | ± | 1.87 | b | 5.63 | ± | 1.45 | b | *** |
| Chlorophyll a + b | 35.92 | ± | 11.61 | ab | 42.56 | ± | 10.05 | a | 34.36 | ± | 9.89 | bc | 28.20 | ± | 8.56 | c | ** |
| DPPH | 51.89 | ± | 10.18 | a | 27.07 | ± | 19.11 | a | 26.55 | ± | 13.03 | b | 46.12 | ± | 12.97 | b | *** |
| Red Fruits | |||||||||||||||||
| First/Second PC | |||||||||||||||||
| Group | |||||||||||||||||
| A | B | C | D | ||||||||||||||
| Phenols | 10.04 | ± | 2.13 | a | 10.00 | ± | 1.60 | a | 7.77 | ± | 1.08 | b | 8.86 | ± | 1.96 | ab | *** |
| Ascorbic acid | 1.96 | ± | 0.58 | b | 2.68 | ± | 0.62 | a | 2.27 | ± | 0.64 | ab | 2.09 | ± | 0.69 | b | ** |
| Lycopene | 24.96 | ± | 10.56 | a | 14.60 | ± | 10.12 | b | 10.01 | ± | 4.76 | b | 15.82 | ± | 3.23 | b | *** |
| Carotenoid | 32.01 | ± | 12.24 | ab | 35.85 | ± | 12.85 | a | 25.23 | ± | 6.01 | b | 23.93 | ± | 7.54 | b | ** |
| Chlorophyll a + b | 1.60 | ± | 1.04 | a | 1.51 | ± | 1.50 | a | 0.53 | ± | 0.64 | b | 1.10 | ± | 0.69 | ab | ** |
| DPPH | 83.18 | ± | 12.99 | b | 93.57 | ± | 3.86 | a | 86.61 | ± | 6.72 | b | 65.90 | ± | 8.50 | c | *** |
| Red Fruits | |||||||||||||||||
| First/Third PC | |||||||||||||||||
| Group | |||||||||||||||||
| A | B | C | D | ||||||||||||||
| Phenols | 9.52 | ± | 1.76 | b | 10.78 | ± | 1.94 | a | 8.17 | ± | 1.03 | c | 8.20 | ± | 2.20 | c | *** |
| Ascorbic acid | 2.07 | ± | 0.70 | 2.54 | ± | 0.59 | 2.26 | ± | 0.65 | 2.11 | ± | 0.67 | ns | ||||
| Lycopene | 22.97 | ± | 7.17 | a | 17.59 | ± | 15.64 | ab | 10.65 | ± | 5.55 | c | 14.76 | ± | 2.80 | bc | *** |
| Carotenoid | 38.03 | ± | 12.48 | a | 26.95 | ± | 9.36 | b | 23.58 | ± | 6.50 | b | 26.67 | ± | 6.40 | b | *** |
| Chlorophyll a + b | 1.33 | ± | 0.86 | a | 1.88 | ± | 1.58 | ab | 0.80 | ± | 0.73 | b | 0.66 | ± | 0.69 | b | ** |
| DPPH | 84.49 | ± | 13.45 | ab | 91.28 | ± | 6.71 | a | 83.49 | ± | 11.97 | b | 70.54 | ± | 8.00 | c | *** |
| Code | Germplasm Code | Fruit Description | Origin |
|---|---|---|---|
| P-35 | BGV005087(1) | Rectangular shape, blocky and with four shoulders, and locule marked | Fanzara, Castellón, Spain |
| P-36 | BGV005035(1) | Irregular, rectangular-conical shape but inconsistent pattern, slightly marked shoulders | Chelva, Valencia, Spain |
| P-37 | BGV005097(1) | Triangular shape and truncated apex | Castillo de Villamalefa, Castellón, Spain |
| P-39 | BGV005115(1) | Triangular shape and truncated apex | Alicante, Spain |
| P-40 | BGV005125(1) | Rounded-elongated triangular shape and truncated apex | Elda, Alicante, Spain |
| P-41 | BGV014141(1) | Elongated (horn type), very slightly marked shoulders | Vinaròs, Castellón, Spain |
| P-42 | BGV014145(1) | Elongated (horn type), very slightly marked shoulders | Almenara, Castellón, Spain |
| P-43 | BGV014146(1) | Elongated (horn type), very slightly marked shoulders | Castellón de la Plana, Castellón, Spain |
| P-44 | BGV016188(1) | Elongated (horn type), very slightly marked shoulders | Guardamar del Segura, Alicante, Spain |
| P-45 | BGV005064(1) | Triangular shape and truncated apex | Ademuz, Valencia, Spain |
| P-46 | BGV005085(1) | Rectangular shape, blocky and with four shoulders, and locule marked | Onda, Castellón, Spain |
| P-47 | BGV005040(1) | Rounded-elongated triangular shape and truncated apex | Siete Aguas, Valencia, Spain |
| P-48 | BGV005034(1) | Elongated (horn type), very slightly marked shoulders | Chelva, Valencia, Spain |
| P-49 | BGV005046(1) | Ball-like shape with very slightly marked shoulders | Benissa, Alicante, Spain |
| P-50 | BGV005116(1) | Triangular shape and truncated apex | Rojales, Alicante, Spain |
| P-51 | BGV014553(1) | Rectangular shape, blocky and with four shoulders, and locule marked | Tales, Castellón, Spain |
| P-70 | IVIA 70(2) | Rounded-elongated triangular shape and apex truncated | Moncada, Valencia, Spain |
| P-72 | IVIA 72(2) | Elongated (horn type), very slightly marked shoulders | Canal de Navarrés, Valencia, Spain |
Publisher’s Note: MDPI stays neutral with regard to jurisdictional claims in published maps and institutional affiliations. |
© 2021 by the authors. Licensee MDPI, Basel, Switzerland. This article is an open access article distributed under the terms and conditions of the Creative Commons Attribution (CC BY) license (http://creativecommons.org/licenses/by/4.0/).
Share and Cite
Martínez-Ispizua, E.; Martínez-Cuenca, M.-R.; Marsal, J.I.; Díez, M.J.; Soler, S.; Valcárcel, J.V.; Calatayud, Á. Bioactive Compounds and Antioxidant Capacity of Valencian Pepper Landraces. Molecules 2021, 26, 1031. https://doi.org/10.3390/molecules26041031
Martínez-Ispizua E, Martínez-Cuenca M-R, Marsal JI, Díez MJ, Soler S, Valcárcel JV, Calatayud Á. Bioactive Compounds and Antioxidant Capacity of Valencian Pepper Landraces. Molecules. 2021; 26(4):1031. https://doi.org/10.3390/molecules26041031
Chicago/Turabian StyleMartínez-Ispizua, Eva, Mary-Rus Martínez-Cuenca, José Ignacio Marsal, María José Díez, Salvador Soler, José Vicente Valcárcel, and Ángeles Calatayud. 2021. "Bioactive Compounds and Antioxidant Capacity of Valencian Pepper Landraces" Molecules 26, no. 4: 1031. https://doi.org/10.3390/molecules26041031
APA StyleMartínez-Ispizua, E., Martínez-Cuenca, M.-R., Marsal, J. I., Díez, M. J., Soler, S., Valcárcel, J. V., & Calatayud, Á. (2021). Bioactive Compounds and Antioxidant Capacity of Valencian Pepper Landraces. Molecules, 26(4), 1031. https://doi.org/10.3390/molecules26041031