Article

Norway Spruce Stem Parameters in Sites with Different Stand Densities in Lithuanian Hemiboreal Forest

by
Lina Beniušienė
1,*,
Edmundas Petrauskas
2,
Marius Aleinikovas
1,
Iveta Varnagirytė-Kabašinskienė
1,
Ričardas Beniušis
3 and
Benas Šilinskas
1
1
Institute of Forestry, Lithuanian Research Centre for Agriculture and Forestry, Liepų str. 1, Girionys, LT-53101 Kaunas, Lithuania
2
Agriculture Academy, Vytautas Magnus University, Studentų str. 11, LT-53361 Kaunas, Lithuania
3
Lithuanian State Forest Service, Pramonės str., 11A, LT-51327 Kaunas, Lithuania
*
Author to whom correspondence should be addressed.
Forests 2021, 12(2), 201; https://doi.org/10.3390/f12020201
Submission received: 13 January 2021 / Revised: 29 January 2021 / Accepted: 6 February 2021 / Published: 10 February 2021
(This article belongs to the Section Forest Ecology and Management)

Abstract

:
Background and Objectives: The study aimed to determine the changes of the main stem and branch parameters of Norway spruce (Picea abies (L.) H. Karst) trees under different stand densities. More specifically, the objective was to develop the models for the determination of branch diameter in 0–6 m log from root collar, taken as one of the parameters directly influencing the stem quality. The study continues a piece of research on stem and branch parameters’ responses to different stand density (SD) in the plantations of coniferous tree species in Lithuania. Materials and Methods: The following key parameters were measured in this study: total tree height, diameter at breast height, height to the lowest live branch, height to the lowest dead branch, and diameter of all branches in 0–6 m log. The linear regression models to predict branch diameter in 0–6 m log were developed based on stand density (SD), tree characteristics (tree diameter at breast height, DBH; and tree height, H) and other related stem and branch parameters. Results and Conclusions: Directly measured tree DBH, branch diameters and number of branches in 0–6 m log decreased significantly with the increasing SD. In the 0–6 m log, the branch diameter and the diameter of the thickest branch were identified as the main parameters related to stem quality. The best fitted models, developed including SD, tree DBH, branch diameter, and diameter of the thickest branch in 0–3 m log, can be proposed as a predictor for stem-wood quality for Norway spruce in hemiboreal forest zone.

1. Introduction

The growth of trees with high-quality stemwood depends on tree genetics, environmental factors, and applied forest management methods [1,2,3,4]. Most often silvicultural techniques are planned to increase tree growth and to enhance short-term wood supply [5,6]. To improve the final forest production and timber yield, the variety of forest management methods are applied in the managed forests. The following measures are often preferred: improved regeneration material (seedlings), fertilization, selection of site-specific regeneration methods, different intensities of intermediate cuttings, etc. [6,7,8]. The optimal environmental conditions, appropriate silvicultural techniques and harvesting regime provide the basis for the growth of good quality wood [2,9]. It is well known that intermediate cuttings improve the growth of the remaining trees. Otherwise, the development of the good quality stem-wood requires a complex knowledge on past management practices, soil fertility and moisture regimes, and climatic parameters, etc. For example, relatively large variations in stem-wood quality of Scots pine are found in the sites of medium soil fertility [10]. Most often, the codominant trees with narrow crowns and thin branches develop the stems of better quality.
Extensive studies on experiment-based forest thinnings, representing different designs and methods, were established for growth and yield assessment of Scots pine and Norway spruce [5,11,12,13,14,15,16]. The timber quality is affected by several variables, such as stand density at different stand age, stem radial increment, tree diameter at breast height (DBH), tree height increment, number and size of branches, and branch age [14,17,18]. As reviewed by Mäkinen et al. [19], earlier findings indicated that the wood quality of Norway spruce is less affected by site fertility or growing space than Scots pine.
The study by Huuskonen et al. [20] showed that high initial stand density and thinning of Scots pine stand were associated with lower branching, while a large increase in tree DBH resulted in a higher probability of branching. For Norway spruce, the relationships between living branch basal diameters, stem height, DBH, and stand age were analyzed in France [21]. Following this study, the branch diameter could be expressed as a function of branch insertion height, stem size and stand parameters. As shown by Schmidt, Kändler, [9], DBH, height–DBH-ratio, age, and distance to forest edge; also, altitude, terrain slope, stand type and inventory team competences were the variables, which significantly affected the quality of Norway spruce.
Norway spruce (Picea abies (L.) H. Karst) dominates Europe’s forests, and this species is one of two dominated coniferous tree species in Lithuania. The wood of Norway spruce is widely used in timber industry, especially in the northern European countries. Otherwise, only a limited number of studies in the Baltic countries have analyzed the stem and wood properties of Norway spruce [22,23,24,25].
This study aimed to determine effect of different stand densities on stem and branch parameters along butt logs (0–6 m log) of Norway spruce trees. More specifically, the objective of this study was to develop the models for the determination of branch diameter in 0–6 m log, taken as one of the parameters directly influencing the stem quality. The study continues a research on stem and branch parameters response to different stand densities in the coniferous stands in Lithuania, conducted within a long-term experiment [26].

2. Material and Methods

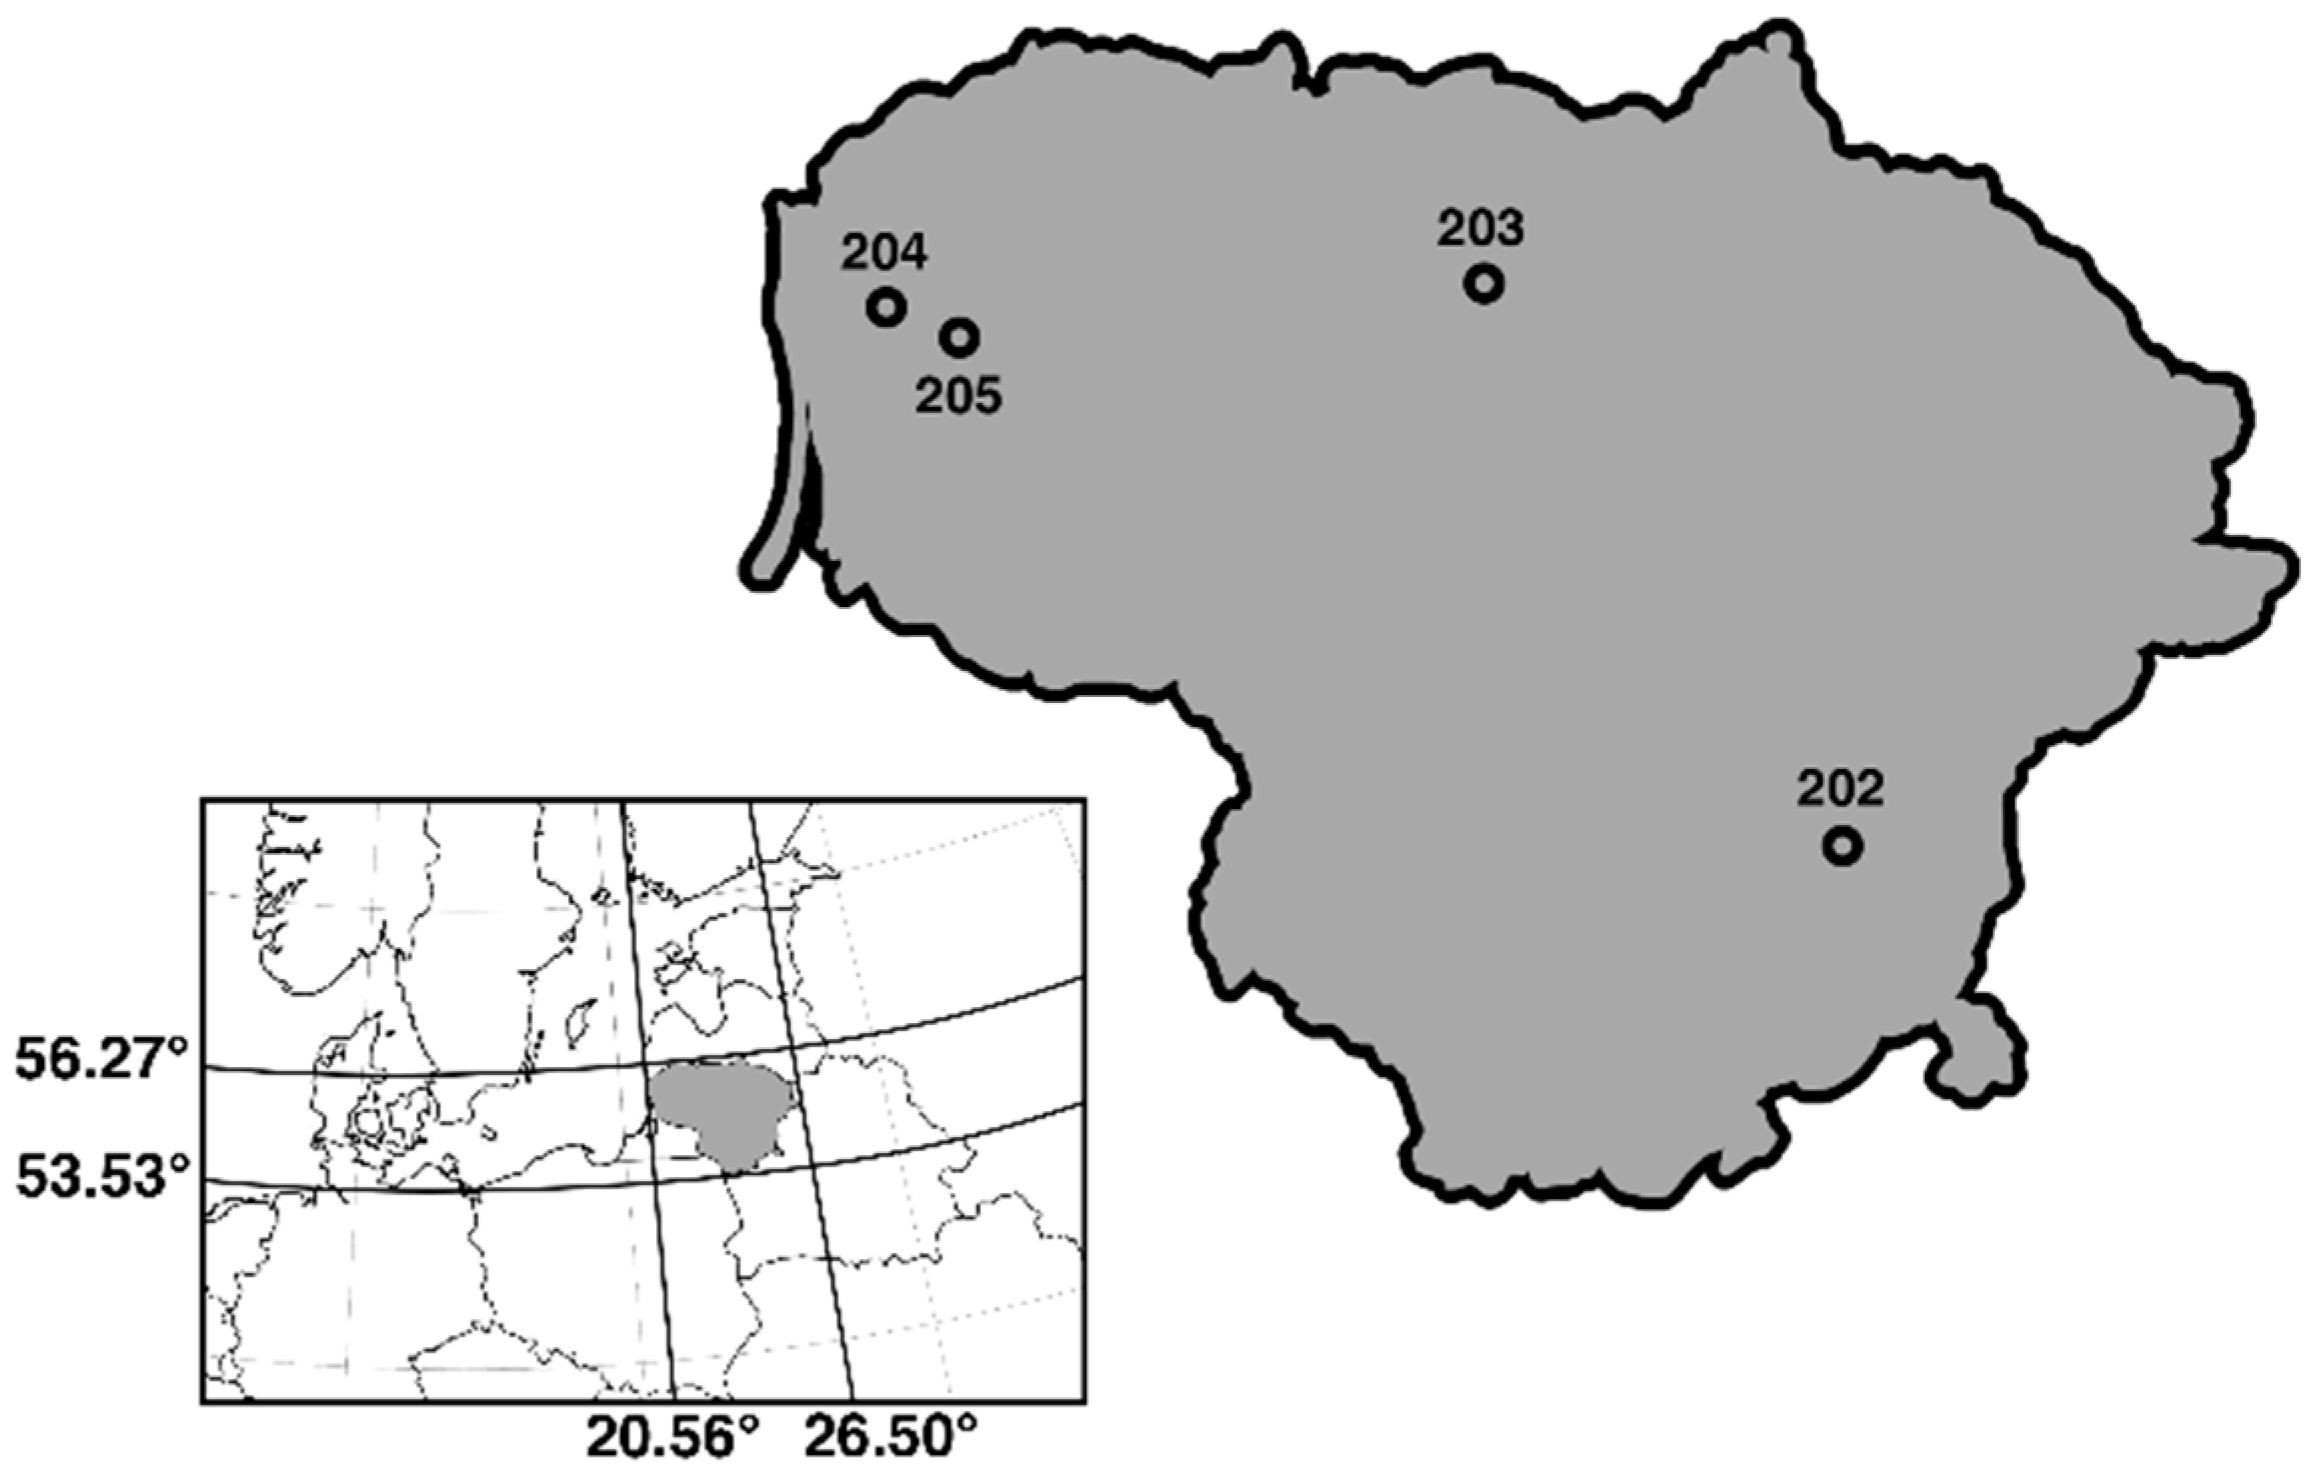
2.1. Study Site and Material

The study was conducted in the territory of Lithuania, representing the southern hemiboreal forest zone. In the territory, the forests cover 33.6% of the land area and 55.6% of the forested area is covered by coniferous stands; among them, Norway spruce (Picea abies (L.) H. Karst) covers 21.0% [27].
For this study, four pure Norway spruce study sites were selected in a long-term experimental area, established for the investigation of Norway spruce growth under different thinning regimes in 1990–1992 [24]. The study sites were selected in different geographical regions of Lithuania (Figure 1). The typical 36–43-year-old Norway spruce stands represented different stand densities and thinning regimes. General information about the study sites is given in Table 1 and Table 2.
The first and second study sites (202 and 203) were ploughed in rows every 2.0 m before planting. In sites 202 and 203, two-year-old spruce seedlings were planted with an initial density of 5000 seedlings ha−1 in 1982, and 10,000 seedlings ha−1 in 1980, respectively. In the third study site (204), four-year-old spruce seedlings were planted with an initial density of 4000 seedlings ha−1 in 1981, followed by additional planting a year after. In the fourth study site (205), the area for planting was ploughed and 0.4–0.7 m high rows were made every 2.0 m. Two-year-old spruce seedlings were planted on the rows with the initial density of 10,000 seedlings ha−1 in 1983. In each study site, a different thinning intensity was selected (see Table 2), with the first thinning being performed in 1990–1992. The number of trees left in 1 ha after the first thinning is taken as a reference stand density (SD) in this paper.

2.2. Field Measurements

At the initial stage of this study, all trees in four sample sites were mapped, and a probabilistic systematic sample system was applied for the selection of trees. For each selected tree, the following stem and branch parameters of standing trees were measured: tree height (H), diameter at breast height (DBH, cm), height of the lowest live branch (Hlb), height of the lowest dead branch (Hdb), and the diameters of each branch (cm) along a butt log (hereafter, 0–6 m log). Tree H and Hlb were measured with a clinometer Haglöf EC II (precision 0.1m), and Hdb was measured with a tape measure (precision 0.01 m). Tree DBH was measured with a tree calliper (precision 1 mm) at 1.3 meters above ground.
The measurements of the other parameters were performed according to the following scheme. For each live and dead branch equal to or thicker than 10 mm, branch diameter was measured 1 cm from the branch bark ridge and collar, parallel to the stem axis. The mean branch diameters were calculated for individual groups, representing different part of stem log: 0–3, 3–6, and 0–6 m log (Dbr0-6) from root collar. Additionally, the diameter of the thickest branches per 0–3, 3–6, and 0–6 m log (Dmaxbr0-6) were measured. The number of branches per 0–6, 0–3, and 3–6 m log (Nbr3-6) were fixed. The percentage branch area (Brarea), as a ratio between cumulative cross-sectional area at branch collar (cm2) and outer surface area of 0–6 m log (cm2) of every tree multiplied by 100, was calculated.
The sections of 0–3, 3–6, and 0–6 m logs were analyzed following the National standard [30]. In total, 840 trees were measured in eighteen study plots within four study sites. The field measurements were made in 2018–2019. The field measurements described above were planned to follow the scheme used for the study of Scots pine, described in detail in Ref. [26].

2.3. Data and Statistical Analysis

The significant differences between the sites with different stand densities were determined using analysis of variance (ANOVA) followed by Duncan’s multiple-range test. Different letters next to the mean values show statistically significant differences at p < 0.05 between the sites. Pearson correlation was applied to measure the linear correlation between two variables, giving an example of the site 204, chosen accidentally.
One of the main parameters for the assessment of the stem quality, the parameter Dbr0-6, was selected to model. Using SAS general linear models, the model for Dbr0-6 was developed including the following variables: stand density (SD), tree characteristics (H and DBH), and other related parameters, such as Dbr0-3, Dbr3-6, Nbr0-3, Nbr3-6, Dmaxbr0-3, Dmaxbr3-6, and Brarea. For the prediction of Dbr0-6, the general Equation (1) was developed:
Dbr0-6 = a0 + a1SD + a2DBH + a3H + a4Dbr0-3 + a5Dbr3-6 + a6 Nbr0-3 + a7 Nbr3-6 + a8 Dmaxbr0-3 + a9 Dmaxbr3-6 + a10 Brarea + ε
where, a0 is the intercept; a1,a2, … an are parameter estimates; SD is stand density; DBH is diameter at breast height; H is tree height; Dbr0-3 is the branch diameter in 0–3 m log from ground level; Dbr3-6 is branch diameter in 3–6 m log; Nbr0-3 is the number of branches in 0–3 m log; Nbr3-6 is the number of branches in 3–6 m log; Dmaxbr0-3 is the diameter of the thickest branch in 0–3 m log; Dmaxbr3-6 is the diameter of the thickest branch in 3–6 m log; Brarea is the percentage branch area from 0–6 m log surface area (Brarea); and ε is an error term.
All parameters in the models were chosen as random effects. The linear models to describe Dbr0-6 in relation to different stand and tree characteristics were determined by the stepwise procedure. The linear models were improved by eliminating nonsignificant parameters at p < 0.05. The statistical package SAS 9.4 (SAS Institute Inc., Cary, NC, USA) was used to analyze the data in this study.

3. Results

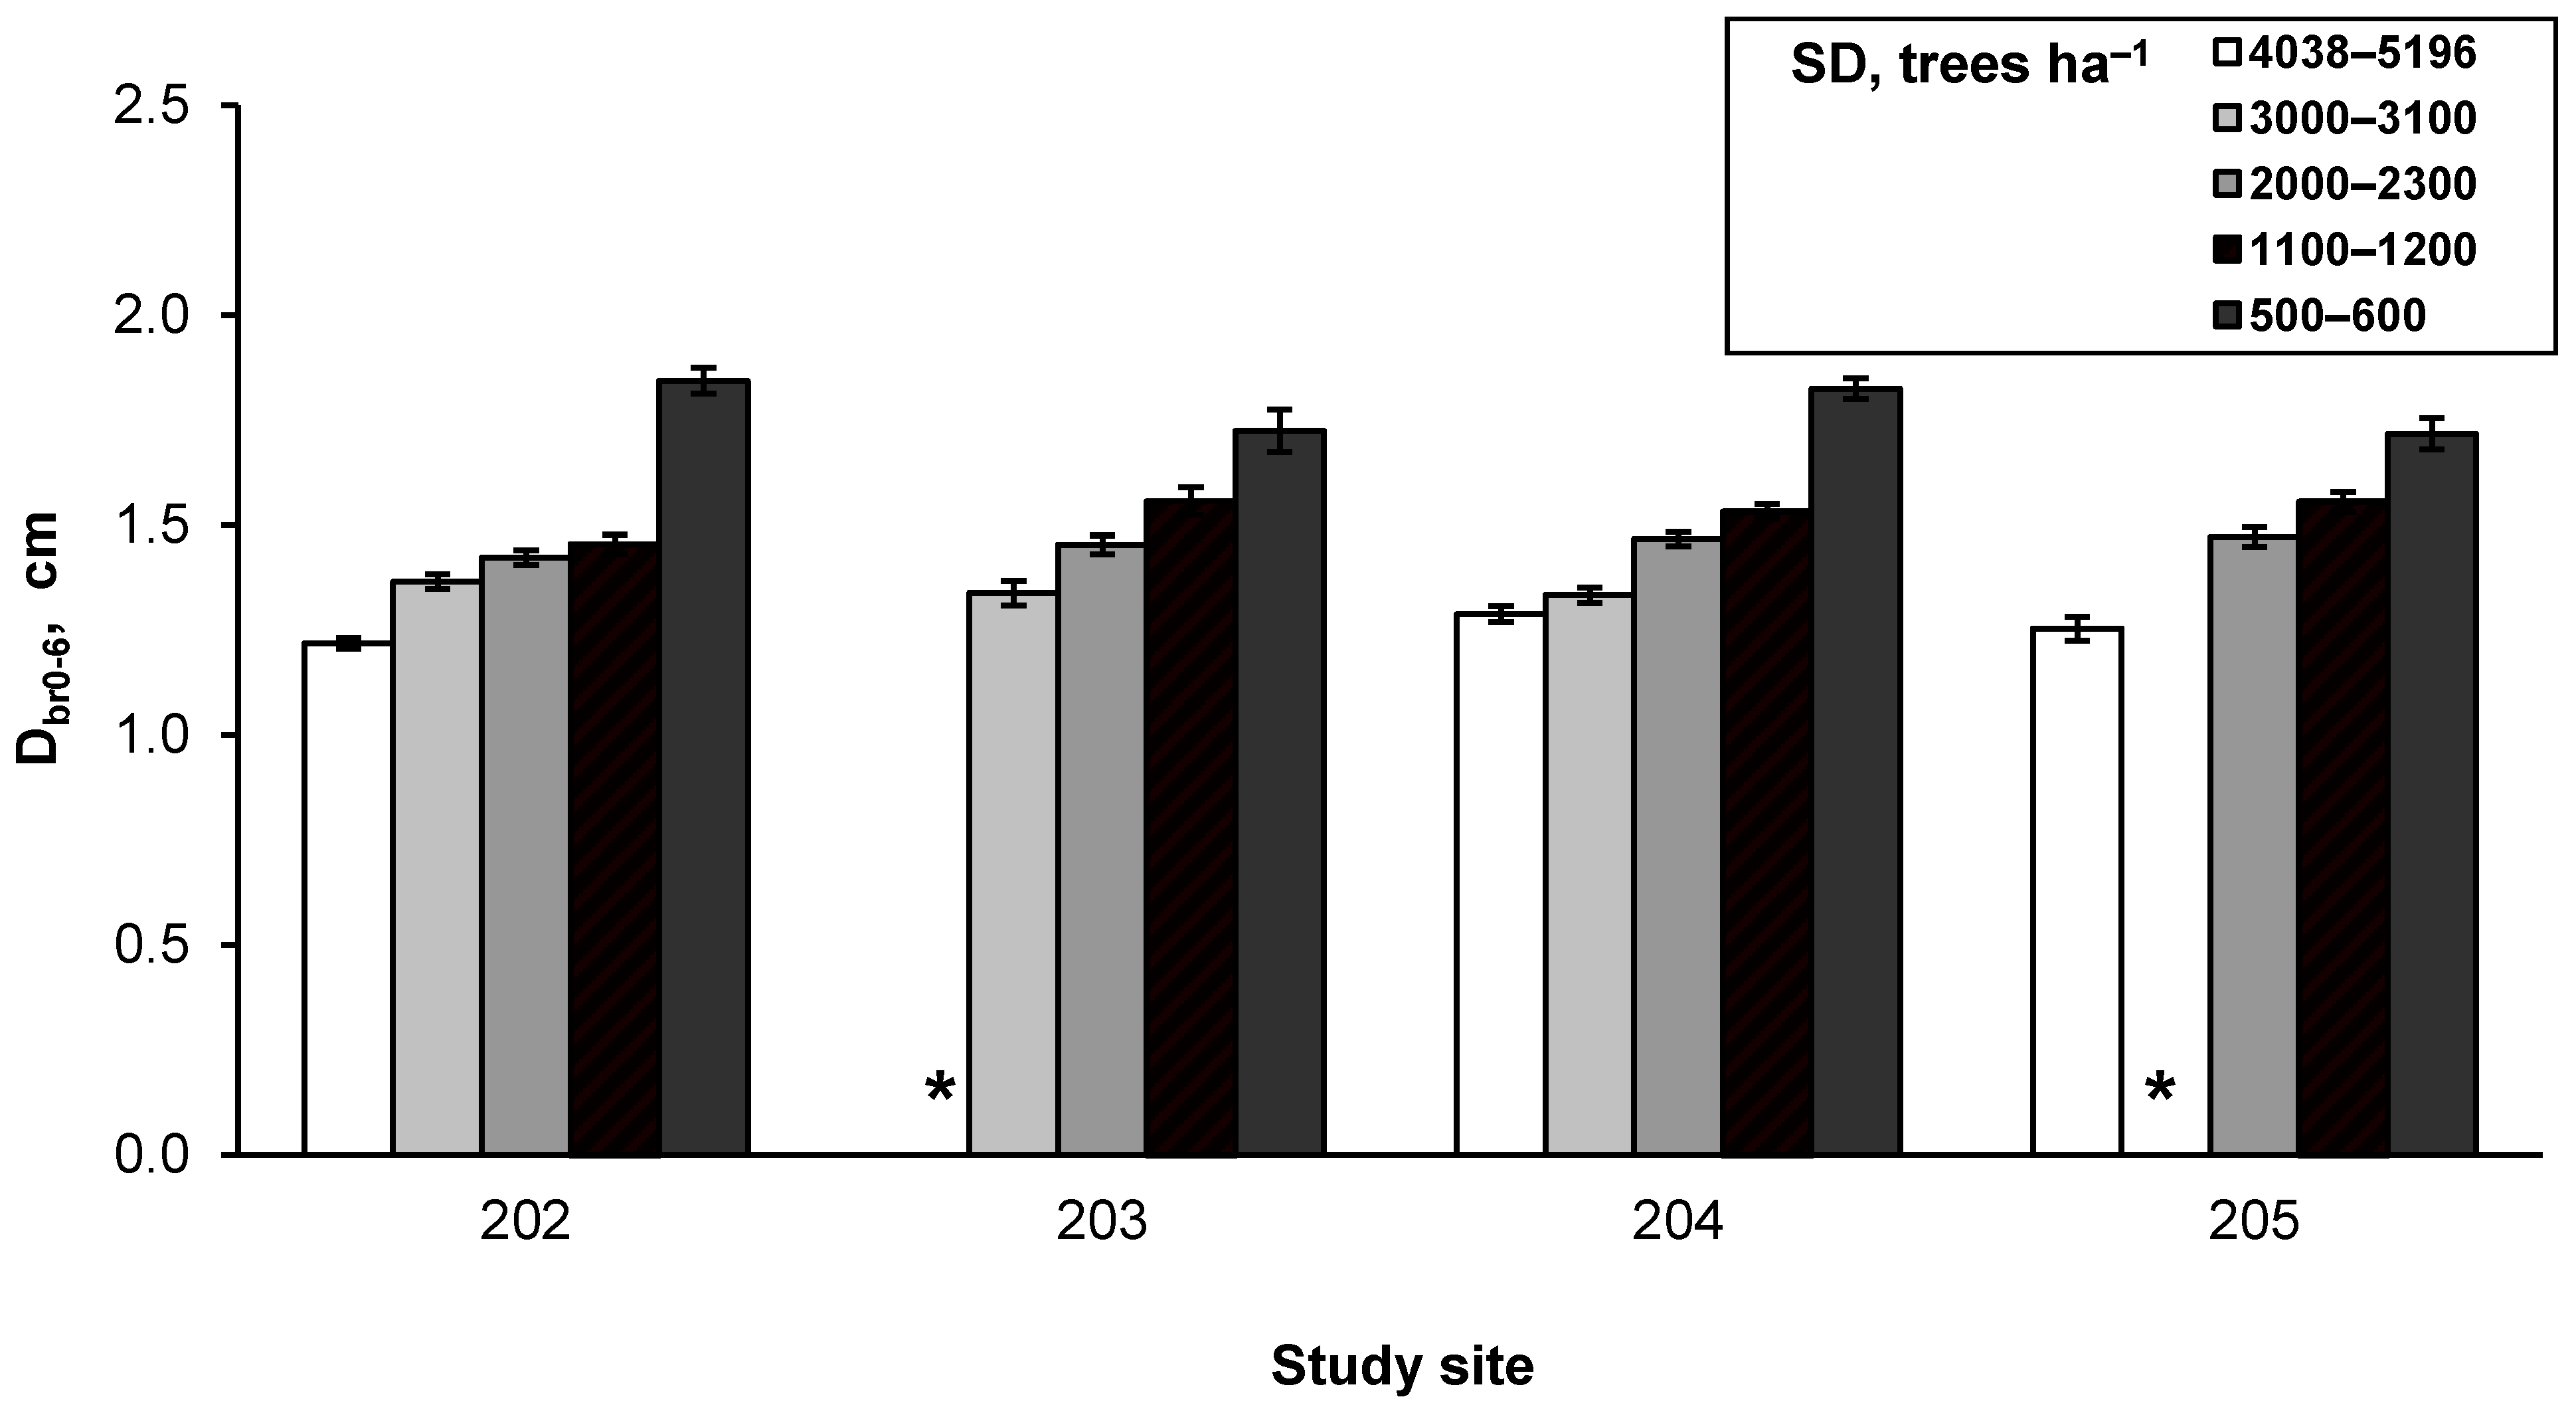
3.1. Tree Stem and Branch Characteristics at the Sites of Different Stand Densities

The mean tree height (H) ranged between 18.1 and 23.7 m and did not clearly respond to different stand densities (SD) in all Norway spruce sites (Table 3). The highest mean tree H difference of 3.1 meters between the lowest and the highest stand density was fixed in the study site 202. In other study sites, slight differences in mean H were obtained. Statistically significant (p < 0.05) differences in mean tree diameter at breast height (DBH) were fixed between the stand densities in all study sites. Similar values of mean DBH were found between the stand densities of 1200 and 2100–2300 trees ha−1. The highest difference of mean DBH between the lowest and highest stand densities amounted 10.94–13.02 cm in the study sites 202 and 204; and 6.6–7.9 cm in the study sites 203 and 205.
The number of branches in 0–6 m log (Nbr0-6) tended to decrease with increasing SD (Table 4). However, nonsignificant differences in Nbr0-6 were found between the adjacent stand densities in the study sites 203 and 205. The Nbr0-6 differed by 1.3–2.1 times between the highest and the lowest SD in all Norway spruce sites with the lowest difference of 1.3 times in the site 203.
The mean branch diameter in 0–6 m log (Dbr0-6) decreased significantly with increasing SD (Table 4, Figure 2). The Dbr0-6 values between the lowest and the highest stand densities differed by 1.3–1.5 times in all study sites.
The mean branch diameters in the bottom (Dbr0-3, 0–3 m log) and upper (Dbr3-6, 3–6 m log) stem logs also decreased significantly with increasing SD, except for some similarities between the adjacent stand densities.
The mean height to the lowest live branch (Hlb) increased statistically significantly (p < 0.05) with increasing SD at sites 202, 203 and 204 (Table 4). At these sites, the Hlb values differed by 1.2–1.9 times between the highest and the lowest SD. However, the Hlb values did not significantly differ among different stand densities at site 205. Only slight differences of the height of the lowest dead branch (Hdb) were found among the sites with different SD.
The highest percentage branch area for 0–6 m log surface area (Brarea) was found in the sites with the stand density of 500–600 trees ha−1 (Table 4). The mean Brarea tended to decrease with increasing SD. The difference of mean Brarea between the lowest and highest stand densities amounted from 1.6–1.7 (the sites 203 and 204) to 2.6–2.9 times (sites 202 and 205).

3.2. Relationships between Stand, Tree Stem and Branch Characteristics

The correlation coefficients between stand and tree characteristics with stem quality parameters for Norway spruce study sites are presented in Table 5. As an example, the data analysis from study site 204 was given. The SD and main tree characteristics (H, DBH) showed different correlations with the branch parameters. Moderately strong negative correlations between SD and DBH, Hlb, Dbr0-6, Dbr0-3 and Dbr3-6 were obtained. The correlation between SD and Nbr0-6 was weak; however, the correlations were moderate between SD and Dmaxbr0-3, Dmaxbr3-6, and Brarea. The correlations between DBH with Dbr0-6, Dbr0-3, Dbr3-6, Dmaxbr0-3, and Dmaxbr3-6 were moderate (r = 0.55–0.64). The correlation between Dbr0-6 and all branch parameters was strong to very strong (r = 0.79–0.98).

3.3. Modelling Branch Diameter in Relation to Stand, Tree Stem and Branch Characteristics

The linear models to describe Dbr0-6 in relation to different stand and tree characteristics were determined by the stepwise procedure (Table 6). First, Model 1 was determined as a general linear model and included all variables available from this study. The Dbr0-6 was predicted by the SD, tree DBH, tree H, branch diameters Dbr0-3 and Dbr3-6, amount of branches Nbr0-3 and Nbr3-6, diameters of the thickest branch Dmaxbr0-3 and Dmaxbr3-6, and the percentage branch area from 0–6 m log surface area (Brarea). As the next step, the linear model was improved by removing nonsignificant (p > 0.05) variables from Model 1. Focusing on the potential practical benefits of the model, several options were tested. Model 2 included SD, DBH, Dbr0-3, and Dmaxbr0-3 (R2 = 0.900). Model 3 included all variables from Model 2 and, additionally, H was included (R2 = 0.901).
In search of a most simplified but well-fitted model, three simple models were estimated: Model 4 included the variables SD, DBH and Dbr0-3 (R2 = 0.900); Model 5 included the variables SD, DBH and Dmaxbr0-3 (R2 = 0.792); Model 6 included the variables SD, DBH, H and Brarea (R2 = 0.803) (Table 6).

4. Discussion

The present study was designed to determine the effect of different stand densities on stem and branch parameters along butt logs (0–6 m log) of Norway spruce trees; also, the models for the determination of branch diameter in 0–6 m log, as one of the parameters directly influencing the stem quality, were developed. Continuing the research on stem and branch parameters of coniferous species in Lithuania [26], this study was also performed within a long-term experiment, established in 1990–1992 [24].
The results of this study showed that the stand density (SD) affected the number of stem and branch parameters: the mean branch diameter in 0–3 m (Dbr0-3) and 3–6 m (Dbr3-6) log from root collar; the diameter of the thickest branch (Dmaxbr0-3 and Dmaxbr3-6); the number of branches (Nbr0-3 and Nbr3-6), and the percentage branch area from 0–6 m log surface area (Brarea). Following previous studies, SD at different stand age, DBH, tree H, number and size of branches, and branch age affect tree stem parameters, defining the stem-wood quality [14,17,18].
Our study found greater impact of SD on tree H than on tree DBH. It is likely that the greatest increase in height of the studied Norway spruce trees was fixed before the age of 36–43 years. The competition and intensive growth of height in Norway spruce started at around 10 years and finished around 30 [31], therefore the older trees show mainly increases of DBH. In accordance with the present results, previous studies of coniferous tree species have demonstrated that SD influenced tree growth, development, and final stand productivity [26,32,33,34,35]. Lower SD or increased growing space positively influenced tree DBH and increased tree volume but reduced total yield [32,33]. The wider spacing caused significantly lower mean tree H for Scots pine, while higher SD caused lower tree DBH [35]. Otherwise, the regulation of SD by thinning can reduce stem-wood quality by promoting branching and the development of thicker and longer branches [34,36]. A decrease in SD reduced the tree H and DBH ratio but increased the number of living branches [36]. Krajnc et al. [3] mentioned that the decrease in SD was associated with the increase in the mean and maximum branch lengths and also the branch diameter. The study by Auty et al. [37], who studied SDs of 2858, 1452, 725, 477, and 320 trees ha−1 in 57-year-old Sitka spruce stands, showed that maximum branch diameter and branch frequency were significantly influenced by respacing.
The results of the present study showed that the basic branch parameters, including the number of branches in 0–6 m log (Nbr0-6), the mean branch diameters in the 0–6, 0–3, and 3–6 m log (Dbr3-6), differed significantly between the highest and lowest SD, and some similarities were only recorded in the adjacent SDs. Overall, the Nbr0-6, Dbr0-6, Dbr0-3, Dbr3-6 decreased consistently with the increase in SD. In the sites with higher SD, the height from the root collar to the first living branch (Hlb) was higher than in the sites with lower SD. The mean height to the first dead branch (Hdb) showed insignificant variation due to the different SDs. These results are consistent with the measured stem and branch parameters of Scots pine obtained in Ref [26].
The results of the present study showed moderate to strong correlations between tree DBH and branch parameters; moderately strong correlations were also obtained between SD and branch diameters (Dbr0-6, Dbr0-3 and Dbr3-6) but weak correlation was found between SD and Nbr0-6. The main tree characteristics H, DBH, and related stem and branch parameters, which can be directly measured for standing trees, showed close relation with stem-wood quality measures [17]. Previous studies indicated that a strong relation between the DBH and branch diameter exists, and the increase in one parameter goes along with increase in another [14]. Loubère et al. [21] also found close statistical relationships between branch basal diameters, tree size and stand parameters.
With respect to the above-discussed research questions, the models for estimation of branch diameter in 0–6 m log (Dbr0-6) were developed including SD, different tree characteristics (DBH and H), and related stem and branch parameters (for practical reasons, mainly focused on the lower part of the stem, i.e., 0–3 m log). The estimated models (see Table 6) included the variables SD and DBH (and H in Model 6) that are mainly available in the databases and other variables, such as branch diameter in 0–3 m log (Dbr0-3), branch diameter in 3–6 m log (Dbr3-6), diameter of the thickest branch (Dmaxbr0-3, Dmaxbr3-6), number of branches (Nbr0-3, Nbr3-6), and the percentage branch area (Brarea). Several models for branch properties of Norway spruce were developed in Sweden, Norway and France [38,39]. It was an attempt to predict the branch properties in Finland [40]. The branch characteristics found to be predicted by tree level variables [19]. These authors analyzed the variety of SDs, from high to moderately dense plots.
For the practical benefits, relatively simple linear models for Norway spruce were estimated, including directly measured branch parameter Dbr0-3 or Dmaxbr0-3 together with SD and DBH in a single equation (Model 4; R2 = 0.900, and Model 5; R2 = 0.792). Despite relatively good results (R2 ≥ 0.900), the variable SD in the Model 3 and Model 4 showed nonsignificance, which could further cause the inaccuracies in the estimations. Among the above mentioned models, the Model 5 could be considered as the most appropriate for the practical use in Norway spruce stands. Previous studies also indicated that branch characteristics can be estimated using tree parameters reflecting the effect of the stand conditions [19]. For the predicting branch diameter of Scots pine, DBH, the ratio between H and DBH, also branch age were indicated as the best variables [18]. In a modelling context, the number and diameter of the branches could be reliably estimated from the stem DBH and volume for Norway spruce [40]. When analyzed the effect of wide spacing on increment and branch properties, the branch diameter of young Norway spruce increased with decreasing SD [41]. A generalized analysis was made by Huuskonen et al. [20], who found that the branching can be estimated by the SD at an early stage of stand development, and growth rate of tree DBH and H. The present study was designed to estimate the branch parameters in 0–6 m log; however, earlier studies found that the size of whorl branches may be predicted at any point along the stem [38].
When comparing the linear models developed for Norway spruce with similar models developed for Scots pine [26], we identified comparable relations between SD and branch parameters. In both cases, the branch diameter in the bottom part of the stem (0–6 m log) was well described by similar stand and tree variables in the even-aged coniferous stands. The best fitted models included the stand SD, tree DBH, and the diameter of the thickest branch in 0–3 m log. These models could be applied as simplified tool for the estimation of the branch diameter in 0-6 m log, partially representing stem wood quality. This study provided some knowledge about stem and branch parameters of coniferous tree species in response to different stand densities in relatively young stand age. However, the obtained findings do not allow estimation of the stem and branch parameters over the entire stand rotation. Furthermore, specific studies should be carried out to analyze the influence of tree genetics, tree social status, site fertility, climate conditions, and tree age in a modeling context [5].

5. Conclusions

The main aim of the current study was to determine the effect of different stand densities on stem and branch parameters along 0–6 m stem log in 36–43-year old Norway spruce (Picea abies (L.) H. Karst) stands. In addition, models for the estimation of branch diameter in 0–6 m log, taken as one of the parameters directly influencing stem quality, were developed. This study has identified that the mean branch diameters and the number of branches per 0–6 m stem log, similarly to per bottom (0–3 m log) and upper (3–6 m log) stem logs, decreased significantly with increasing stand density. The height from the root collar to the first living branch increased but no response was obtained for the height up to the first dead branch. For the estimation of branch diameter in 0–6 m log, the linear regression models were developed based on stand density, tree characteristics (DBH and H), and branch parameters. For practical reasons, the mean branch diameter, and the diameter of the thickest branch per 0–3 m log were chosen, and the simplified models were developed for Norway spruce. The branch parameters in 3–6 m log from the root collar were excluded from the model due to high correlation with the parameters in 0–3 m log. The best-fitted model for the estimation of branch diameter in 0–6 m log, taken as one of the factors for the assessment of Norway spruce stem-wood quality, included stand density, tree DBH, mean branch diameter or the diameter of the thickest branch in the bottom 0–3 m stem log section.

Author Contributions

Conceptualization, L.B., E.P., and I.V.-K.; Formal analysis, L.B. and B.Š.; investigation, L.B., E.P., I.V.-K., B.Š., R.B., and M.A.; methodology, L.B., E.P., and M.A.; software, L.B. and B.Š.; supervision, L.B., E.P., and I.V.-K.; writing—original draft preparation, L.B. and I.V.-K.; writing—review and editing, E.P., B.Š., R.B., and M.A. All authors have read and agreed to the published version of the manuscript.

Funding

This research received no external funding.

Acknowledgments

The paper presents the findings obtained through the long-term research program “Sustainable Forestry and Global Changes” implemented by the Lithuanian Research Centre for Agriculture and Forestry.

Conflicts of Interest

The authors declare no conflict of interest.

References

  1. Watt, M.S.; Moore, J.R.; Façon, J.-P.; Downes, G.M.; Clinton, P.W.; Coker, G.; Davis, M.R.; Simcock, R.; Parfitt, R.L.; Dando, J.; et al. Modelling the influence of stand structural, edaphic and climatic influences on juvenile Pinus radiata dynamic modulus of elasticity. For. Ecol. Manag. 2006, 229, 136–144. [Google Scholar] [CrossRef]
  2. Budeanu, M.; Şofletea, N. Stem and Crown Characteristics of Norway Spruce [Picea abies (L.) Karst] Populations from Romanian Carpathians. Not. Bot. Horti. Agrobot. Cluj-Napoca 2013, 41, 593–600. [Google Scholar] [CrossRef] [Green Version]
  3. Krajnc, L.; Farrelly, N.; Harte, A.M. The effect of thinning on mechanical properties of Douglas fir, Norway spruce, and Sitka spruce. Ann. For. Sci. 2019, 76, 3. [Google Scholar] [CrossRef] [Green Version]
  4. Russo, D.; Marziliano, P.; Macrì, G.; Proto, A.R.; Zimbalatti, G.; Lombardi, F. Does Thinning Intensity Affect Wood Quality? An Analysis of Calabrian Pine in Southern Italy Using a Non-Destructive Acoustic Method. Forests 2019, 10, 303. [Google Scholar] [CrossRef] [Green Version]
  5. Del Río, M.; Bravo-Oviedo, A.; Pretzsch, H.; Löf, M.; Ruiz-Peinado, R. A review of thinning effects on Scots pine stands: From growth and yield to new challenges under global change. For. Syst. 2017, 26, eR03S. [Google Scholar] [CrossRef]
  6. Routa, J.; Kilpeläinen, A.; Ikonen, V.-P.; Asikainen, A.; Venäläinen, A.; Peltola, H. Effects of intensified silviculture on timber production and its economic profitability in boreal Norway spruce and Scots pine stands under changing climatic conditions. Forestry 2019, 92, 648–658. [Google Scholar] [CrossRef] [Green Version]
  7. Teder, M.; Mizaraitė, D.; Mizaras, S.; Nonić, D.; Nedeljković, J.; Sarvašová, Z.; Vilkriste, L.; Zalite, Z.; Weiss, G. Structural changes of state forest management organisations in Estonia, Latvia, Lithuania, Serbia and Slovakia since 1990. Balt. For. 2015, 21, 326–339. [Google Scholar]
  8. Lundmark, H.; Josefsson, T.; Östlund, L. The introduction of modern forest management and clear-cutting in Sweden: Ridö State Forest 1832–2014. Eur. J. For. Res. 2017, 136, 269–285. [Google Scholar] [CrossRef] [Green Version]
  9. Schmidt, M.; Kändler, G. An analysis of Norway spruce stem quality in Baden-Württemberg: Results from the second German national forest inventory. Eur. J. For. Res. 2009, 128, 515–529. [Google Scholar] [CrossRef]
  10. Niemistö, P.; Kilpeläinen, H.; Poutiainen, E. Effect of first thinning type and age on growth, stem quality and financial performance of a Scots pine stand in Finland. Silva Fenn. 2018, 52. [Google Scholar] [CrossRef] [Green Version]
  11. Mäkinen, H. Thinning intensity and growth of Norway spruce stands in Finland. Forests 2004, 77, 349–364. [Google Scholar] [CrossRef] [Green Version]
  12. Eriksson, E. Thinning operations and their impact on biomass production in stands of Norway spruce and Scots pine. Biomass Bioenergy 2006, 30, 848–854. [Google Scholar] [CrossRef]
  13. Del Río, M.; Calama, R.; Cañellas, I.; Roig, S.; Montero, G. Thinning intensity and growth response in SW-European Scots pine stands. Ann. For. Sci. 2008, 65, 308. [Google Scholar] [CrossRef] [Green Version]
  14. Ikonen, V.-P.; Kellomäki, S.; Peltola, H. Sawn timber properties of Scots pine as affected by initial stand density, thinning and pruning: A simulation based approach. Silva Fenn. 2009, 43, 411–431. [Google Scholar] [CrossRef] [Green Version]
  15. Nilsson, U.; Agestam, E.; Ekö, P.-M.; Elfving, B.; Fahlvik, N.; Johansson, U.; Karlsson, K.; Lundmark, T.; Wallentin, C. Thinning of Scots pine and Norway spruce monocultures in Sweden—Effects of different thinning programmes on stand level gross- and net stem volume production. Studia For. Suec. 2010, 219, 46. [Google Scholar]
  16. Zeide, B. Thinning and growth: A full turnaround. J. For. 2001, 99, 20–25. [Google Scholar] [CrossRef]
  17. Bosela, M.; Redmond, J.; Kučera, M.; Marin, G.; Adolt, R.; Gschwantner, T.; Petráš, R.; Korhonen, K.; Kuliešis, A.; Kulbokas, G.; et al. Stem quality assessment in European National Forest Inventories: An opportunity for harmonised reporting? Ann. For. Sci. 2016, 73, 635–648. [Google Scholar] [CrossRef] [Green Version]
  18. Mäkinen, H.; Colin, F. Predicting branch angle and branch diameter of Scots pine from usual tree measurements and stand structural information. Can. J. For. Res. 1998, 28, 1686–1696. [Google Scholar] [CrossRef]
  19. Mäkinen, H.; Ojansuu, R.; Sairanen, P.; Yli-Kojola, H. Predicting branch characteristics of Norway spruce (Picea abies (L.) Karst.) from simple stand and tree measurements. Forests 2003, 76, 525–546. [Google Scholar] [CrossRef]
  20. Huuskonen, S.; Hakala, S.; Mäkinen, H.; Hynynen, J.; Varmola, M. Factors influencing the branchiness of young Scots pine trees. Forests 2013, 87, 257–265. [Google Scholar] [CrossRef] [Green Version]
  21. Loubère, M.; Saint-André, L.; Hervé, J.-C.; Vestøl, G.I. Relationships between stem size and branch basal diameter variability in Norway spruce (Picea abies (L.) Karsten) from two regions of France. Ann. For. Sci. 2004, 61, 525–535. [Google Scholar] [CrossRef] [Green Version]
  22. Pape, R. Effects of Thinning Regime on the Wood Properties and Stem Quality of Picea abies. Scand. J. For. Res. 1999, 14, 38–50. [Google Scholar] [CrossRef]
  23. Malinen, J.; Maltamo, M.; Verkasalo, E. Stem and Wood Properties of Norway Spruce on Drained Peatlands and Mineral Forest Lands in Southern Finland. Balt. For. 2005, 11, 21–38. [Google Scholar]
  24. Kuliešis, A.; Saladis, J. The effect of early thinning on the growth of pine and spruce stands. Balt. For. 1998, 1, 8–16. [Google Scholar]
  25. Šilinskas, B.; Varnagirytė-Kabašinskienė, I.; Aleinikovas, M.; Beniušienė, L.; Aleinikovienė, J.; Škėma, M. Scots Pine and Norway Spruce Wood Properties at Sites with Different Stand Densities. Forests 2020, 11, 587. [Google Scholar] [CrossRef]
  26. Beniušienė, L.; Šilinskas, B.; Beniušis, R.; Aleinikovas, M.; Petrauskas, E.; Varnagirytė-Kabašinskienė, I. Scots Pine Stem Parameters in Sites with Different Stand Densities in Lithuania. Forests 2020, 11, 716. [Google Scholar] [CrossRef]
  27. Ministry of Environment, State Forest Service. Lithuanian Statistical Yearbook of Forestry; Dagilius, R., Eigirdas, M., Kuliešis, A., Vižlenskas, D., Eds.; Lutute: Kaunas, Lithuania, 2019; p. 184. ISSN 1648-8008. [Google Scholar]
  28. World Reference Base for Soil Resources. International Soil Classification System for Naming Soils and Creating Legends for Soil Maps; World Soil Resources Reports No. 106; FAO: Rome, Italy, 2014; ISBN 978-92-5-108370-3. [Google Scholar]
  29. Vaičys, M.; Karazija, S.; Kuliešis, A.; Rutkauskas, A. Miškų Augavietės [Forest Sites]; Lutute: Kaunas, Lithuania, 2006; p. 95. (In Lithuanian) [Google Scholar]
  30. LST EN 1927-1:2008. Apvaliosios Spygliuočių Medienos Klasifikavimas Pagal Kokybę. 1 Dalis. Eglės ir Kėniai [Qualitative Classification of Softwood round Timber- Part 1: Spruces and Firs]; Lithuanian Standards Board: Vilnius, Lithuania, 2008. [Google Scholar]
  31. Spiecker, H. Growth of Norway spruce (Picea abies [L.] Karst) under changing environmental conditions in Europe. In Spruce Monocultures in Central Europe. Problems and Prospects; Klimo, E., Hager, H., Kulhavy, J., Eds.; European Forest Institute: Joensuu, Finland, 2000; pp. 11–26. ISBN 13 978-952-9844-76-0. [Google Scholar]
  32. Assmann, E. The Principles of Forest Yield Study: Studies in the Organic Production, Structure, Increment and Yield of Forest Stands; Pergamon Press: Oxford, UK, 1970; p. 505. ISBN 9781483150932. [Google Scholar]
  33. Savill, P.S.; Sandels, A.J. The Influence of Early Respacing on the Wood Density of Sitka Spruce. Forests 1983, 56, 109–120. [Google Scholar] [CrossRef]
  34. Fahlvik, N.; Ekö, P.-M.; Pettersson, N. Influence of precommercial thinning grade on branch diameter and crown ratio in Pinus sylvestris in southern Sweden. Scand. J. For. Res. 2005, 20, 243–251. [Google Scholar] [CrossRef]
  35. Liziniewicz, M.; Ekö, P.M.; Agestam, E. Effect of spacing on 23-year-old lodgepole pine (Pinus contortaDougl. var.latifolia) in southern Sweden. Scand. J. For. Res. 2012, 27, 361–371. [Google Scholar] [CrossRef]
  36. Pretzsch, H.; Rais, A. Wood quality in complex forests versus even-aged monocultures: Review and perspectives. Wood Sci. Technol. 2016, 50, 845–880. [Google Scholar] [CrossRef]
  37. Auty, D.; Weiskittel, A.R.; Achim, A.; Moore, J.R.; Gardiner, B.A. Influence of early re-spacing on Sitka spruce branch structure. Ann. For. Sci. 2011, 69, 93–104. [Google Scholar] [CrossRef] [Green Version]
  38. Colin, F.; Houllier, F. Branchiness of Norway spruce in northeastern France: Predicting the main crown characteristics from usual tree measurements. Ann. des Sci. For. 1992, 49, 511–538. [Google Scholar] [CrossRef] [Green Version]
  39. Moberg, L. Models of internal knot properties for Picea abies. For. Ecol. Manag. 2001, 147, 123–138. [Google Scholar] [CrossRef]
  40. Kärkkäinen, M. Malli männyn, kuusen ja koivun puuaineen oksaisuudesta. Silva Fenn. 1986, 20, 107–116. [Google Scholar] [CrossRef] [Green Version]
  41. Mäkinen, H.; Hein, S. Effect of wide spacing on increment and branch properties of young Norway spruce. Eur. J. For. Res. 2006, 125, 239–248. [Google Scholar] [CrossRef]
Figure 1. The location of selected study sites in Lithuania. General information about study sites No. 202-205 is given in Table 1 and Table 2.
Forests 12 00201 g001
Figure 2. Mean values of branch diameter in 0-6 meter log, Dbr0-6, in four Norway spruce study sites. Bars show standard error of the mean. For statistically significant differences between the sites at p < 0.05, see Table 4. No data marked as sign ‘*’.
Forests 12 00201 g002
Table 1. General information about selected Norway spruce study sites.
Study Sites aNumber of Study Plots bYear of Establish-ment Site Area, haStand Age, YearsLocationLatitude, LongitudeSoil Type cForest Site Type d
202519902.0238Sudervė, Vilnius distr.54°68′31″
25°10′42″
Dystric PlanosolNcp
203419910.8039Rozalimas, Pakruojis distr.55°89′78″
23°75′39″
Calcic LuvisolNds
204519921.1743Mikoliškės, Kretinga distr.55°82′88″
21°46′92″
Calcic LuvisolNds
205419920.3436Mostaičiai, Plungė distr.55°77′08″
21°74′64″
Haplic LuvisolNcs
a Original site numbering, taken from field maps; b Number of different stand densities (study plots) within each study site; c Soil classified according to World Reference Base for Soil Resources 2014 [28]; d Ncp: normal moisture regime fertile sandy loamy soil with sandy soil bedding rock; Nds: normal moisture regime very fertile sandy loamy soil; Ncs: normal moisture regime fertile sandy loamy soil with sandy loamy soil according to the Lithuanian classification of forest site types [29].
Table 2. Characteristics of Norway spruce study plots chosen within study sites in the long-term experimental area established in 1990–1992.
Stand Density a, Trees ha−1Thinning IntensityStand Age at Thinning, YearsStand Density at Assessment b, Trees ha−1Area of Study Plot, m2Number of Assessed Trees
Study Site–202
4038no thinning3036407160
31004 times 9, 15, 21, 34 955399160
21003 times9, 15, 34 909403760
11002 times9, 34 842402660
5001 time9 498410060
Study Site–203
2947no thinning1604200130
No data-----
22003 times11,16, 35 961204030
12002 times11, 35 921203030
6001 time11582189030
Study Site–204
4118no thinning-2510233160
30004 times 15, 20, 14, 26 928233860
20003 times15, 20, 26 634235060
12002 times15, 26 678234660
6001 time15545233260
Study Site–205
5196no thinning-145084130
No data- ----
2300 3 times8, 13, 32 92278130
12002 times8, 32 107773330
6001 time8585105930
a Stand density in each study plot left after the first thinning (1990–1992); b Stand density in each study plot at the assessment time (2018–2019).
Table 3. Mean tree height (H) and tree diameter at breast height (DBH) of Norway spruce trees at sites with different stand densities. Different capital letters given next to the mean value show statistically significant differences for H and DBH within each study site between different stand densities at p < 0.05.
Stand Density, Trees ha−1H, mDBH, cm
Study Site–202
403819.12 ± 0.19 D15.03 ± 0.31 D
310021.09 ± 0.16 B19.81 ± 0.28 C
210020.57 ± 0.18 C20.00 ± 0.30 C
110022.19 ± 0.15 A22.64 ± 0.40 B
50022.18 ± 0.17 A28.05 ± 0.44 A
Study Site–203
294718.10 ± 0.43B16.19 ± 0.64 C
220019.20 ± 0.24 A18.91 ± 0.51 B
120019.09 ± 0.28 A20.56 ± 0.72 B
60018.72 ± 0.31 AB22.79 ± 0.73 A
Study Site–204
411820.97 ± 0.22 B17.90 ± 0.48 D
300022.19 ± 0.23 A22.66 ± 0.48 C
200022.22 ± 0.17 A26.65 ± 0.52 B
120021.79 ± 0.17 A25.54 ± 0.44 B
60022.22 ± 0.21 A28.84 ± 0.47 A
Study Site–205
519622.30 ± 0.34 B21.28 ± 0.78 C
230023.73 ± 0.24 A24.41 ± 0.51 B
120023.72 ± 0.25 A24.46 ± 0.59 B
60022.94 ± 0.22 AB29.15 ± 0.57 A
Table 4. Mean values of branch parameters in four Norway spruce study sites. Different capital letters given next to the mean value show statistically significant differences for each stem and branch parameter within each study site between different stand densities at p < 0.05.
Stand Density, Trees ha−1Nbr0-6 *Dbr0-6, cmDbr0-3, cmDbr3-6, cmHlb, mHdb, mBrarea, %
Study Site–202
403844.63 ± 1.91 E1.22 ± 0.01 D1.14 ± 0.01 D1.29 ± 0.02 D11.90 ± 0.14 D0.43 ± 0.07 B0.17 ± 0.01 E
310059.85 ± 2.04 D1.37 ± 0.02 C1.24 ± 0.02 C1.48 ± 0.02 C11.32 ± 0.19 C0.29 ± 0.03 AB0.22 ± 0.01 D
210067.60 ± 1.82 C1.42 ± 0.02 BC1.29 ± 0.02 C1.58 ± 0.02 B10.56 ± 0.21 B0.29 ± 0.13 AB0.27 ± 0.01 C
110084.25 ± 2.48 B1.45 ± 0.02 B1.36 ± 0.02 B1.58 ± 0.03 B12.11 ± 0.16 D0.16 ± 0.02 A0.31 ± 0.01 B
50090.87 ± 2.60 A1.84 ± 0.03 A1.69 ± 0.03 A2.05 ± 0.04 A9.89 ± 0.19 A0.09 ± 0.01 A0.45 ± 0.02 A
Study Site–203
294762.87 ± 3.40 B1.34 ± 0.03 D1.28 ± 0.03 C1.40 ± 0.04 C8.94 ± 0.34 C0.37 ± 0.06 B0.28 ± 0.02 B
220070.83 ± 2.96 B1.45 ± 0.02 C1.35 ± 0.02 C1.59 ± 0.03 B8.00 ± 0.21 B0.24 ± 0.03 A0.31 ± 0.02 B
120081.67 ± 4.63 A1.56 ± 0.03 B1.46 ± 0.03 B1.69 ± 0.04 B7.73 ± 0.32 B0.22 ± 0.03 A0.38 ± 0.02 A
60083.90 ± 3.56 A1.72 ± 0.05 A1.58 ± 0.05 A1.90 ± 0.06 A4.66 ± 0.26 A0.21 ± 0.03 A0.44 ± 0.02 A
Study Site–204
411859.47 ± 2.65 D1.29 ± 0.02 D1.19 ± 0.01 D1.40 ± 0.03 C12.64 ± 0.17 D0.27 ± 0.05 B0.22 ± 0.01 C
300056.28 ± 1.54 CD1.33 ± 0.02 D1.21 ± 0.01 D1.47 ± 0.02 C10.95 ± 0.29 C0.27 ± 0.03 B0.18 ± 0.01 D
200064.35 ± 1.59 C1.47 ± 0.02 C1.27 ± 0.01 C1.67 ± 0.03 B9.91 ± 0.27 B0.26 ± 0.04 B0.21 ± 0.01 C
120071.07 ± 1.93 B1.53 ± 0.02 B1.34 ± 0.01 B1.73 ± 0.02 B9.20 ± 0.25 A0.24 ± 0.02 AB0.26 ± 0.01 B
60081.82 ± 1.84 A1.82 ± 0.02 A1.59 ± 0.02 A2.11 ± 0.04 A8.65 ± 0.26 A0.16 ± 0.02 A0.38 ± 0.01 A
Study Site–205
519643.63 ± 4.28 C1.25 ± 0.03 D1.08 ± 0.04 D1.34 ± 0.04 C11.84 ± 0.50 B0.86 ± 0.18 B0.13 ± 0.01 C
230078.93 ± 3.49 B1.47 ± 0.02 C1.29 ± 0.02 C1.67 ± 0.04 B12.72 ± 0.21 B0.19 ± 0.04 A0.28 ± 0.02 B
120081.00 ± 3.90 B1.56 ± 0.02 B1.37 ± 0.02 B1.75 ± 0.04 B12.65 ± 0.30 B0.15 ± 0.02 A0.32 ± 0.03 B
60092.40 ± 2.91 A1.72 ± 0.04 A1.46 ± 0.03 A2.00 ± 0.06 A10.56 ± 0.26 A0.16 ± 0.02 A0.38 ± 0.02 A
* Nbr0-6, number of branches in 0–6 m log from root collar; Dbr0-6, diameter in 0–6 m log; Dbr0-3, diameter in 0–3 m log; Dbr3-6, diameter in 3–6 m log; Hlb, height of the lowest live branch; Hdb, height of the lowest dead branch; Brarea, percentage branch area from 0–6 m log surface area.
Table 5. Correlation coefficients between tree characteristics and some parameters of stem quality for the selected Norway spruce trees in the study sites 204 (n = 300). The coefficients given in bold are statistically significant at p < 0.05.
H *HlbHdbDBHNbr0–6Dbr0–6Dbr0–3Dbr3–6Dmaxbr0–3Dmaxbr3–6Brarea
SD−0.200.590.14−0.68−0.46−0.72−0.67−0.69−0.59−0.65−0.52
H −0.020.030.600.050.180.170.160.180.18−0.14
Hlb 0.12−0.49−0.33−0.46−0.41−0.45−0.40−0.49−0.33
Hdb −0.15−0.36−0.24−0.24−0.27−0.27−0.22−0.32
DBH 0.430.640.580.620.550.620.29
Nbr0-6 0.490.540.440.550.480.78
Dbr0-6 0.950.980.880.900.79
Dbr0-3 0.890.920.840.81
Dbr3-6 0.820.890.75
Dmaxbr0-3 0.830.77
Dmaxbr3-6 0.72
* SD, stand density; H, tree height; Hlb, height of the lowest live branch; Hdb, height of the lowest dead branch; DBH, diameter at breast height; Nbr0-6, number of branches in 0–6 m log from root collar; Dbr0-6, branch diameter in 0–6 m log; Dbr0-3, branch diameter in 0–3 m log; Dbr3-6, branch diameter in 3–6 m log; Dmaxbr0-3, diameter of the thickest branch in 0–3 m log; Dmaxbr3-6, diameter of the thickest branch in 3–6 m log; Brarea, percentage branch area from 0–6 m log surface area.
Table 6. The selected linear models to describe branch diameter in 0–6 m log from root collar (Dbr0-6) in relation to stand density (SD) and tree characteristics (H, tree height; DBH, diameter at breast height; Dbr0-3, branch diameter in 0–3 m log; Dbr3-6, branch diameter in 3–6 m log; Nbr0-3, number of branches in 0–3 m log; Nbr3-6, number of branches in 3–6 m log; Dmaxbr0-3, diameter of the thickest branch in 0–3 m log; Dmaxbr3-6, diameter of the thickest branch in 3–6 m log; Brarea, percentage branch area from 0–6 m log surface area) in Norway spruce (n = 840).
VariableParameter EstimatePr > |t|Variance InflationParameter EstimatePr > |t|Variance InflationParameter EstimatePr > |t|Variance Inflation
Model 1Model 2Model 3
Intercept0.13914<0.000100.075750.017400.146750.00130
SD−0.0000020.02942.38865−0.0000050.09442.03319−0.0000040.18362.08029
H0.000440.45332.50019---−0.004260.02952.29310
DBH0.00331<0.00017.402400.00904<0.00011.748580.01061<0.00013.76615
Dbr0-30.40631<0.00018.993310.86774<0.00015.160320.85451<0.00015.39296
Dbr3-60.43160<0.00019.44931------
Nbr0-3−0.00263<0.00014.68097------
Nbr3-60.00080<0.00014.32472------
Dmaxbr0-30.004420.14014.988630.026820.00784.630080.026800.00774.63009
Dmaxbr3-6−0.003610.01272.36321------
Brarea0.29408<0.000121.51302------
R20.99190.90070.9013
Adj R20.99180.90020.9007
Model 4Model 5Model 6
Intercept0.039750.168900.81499<0.000100.86950<.00010
SD−0.0000040.12622.02758−0.00004<0.00011.78864−0.0000130.00192.10136
H------−0.008250.00312.33134
DBH0.00941<0.00011.674490.00936<0.00011.748130.02270<.00013.20227
Dbr0-30.92787<0.00011.96218------
Dmaxbr0-3---0.26671<0.00011.76056---
Brarea------1.09151<.00011.73320
R20.89980.79160.8032
Adj R20.89950.79090.8022
Publisher’s Note: MDPI stays neutral with regard to jurisdictional claims in published maps and institutional affiliations.

