
Yeasts as Complementary Model Systems for the Study of the Pathological Repercussions of Enhanced Synphilin-1 Glycation and Oxidation


Abstract
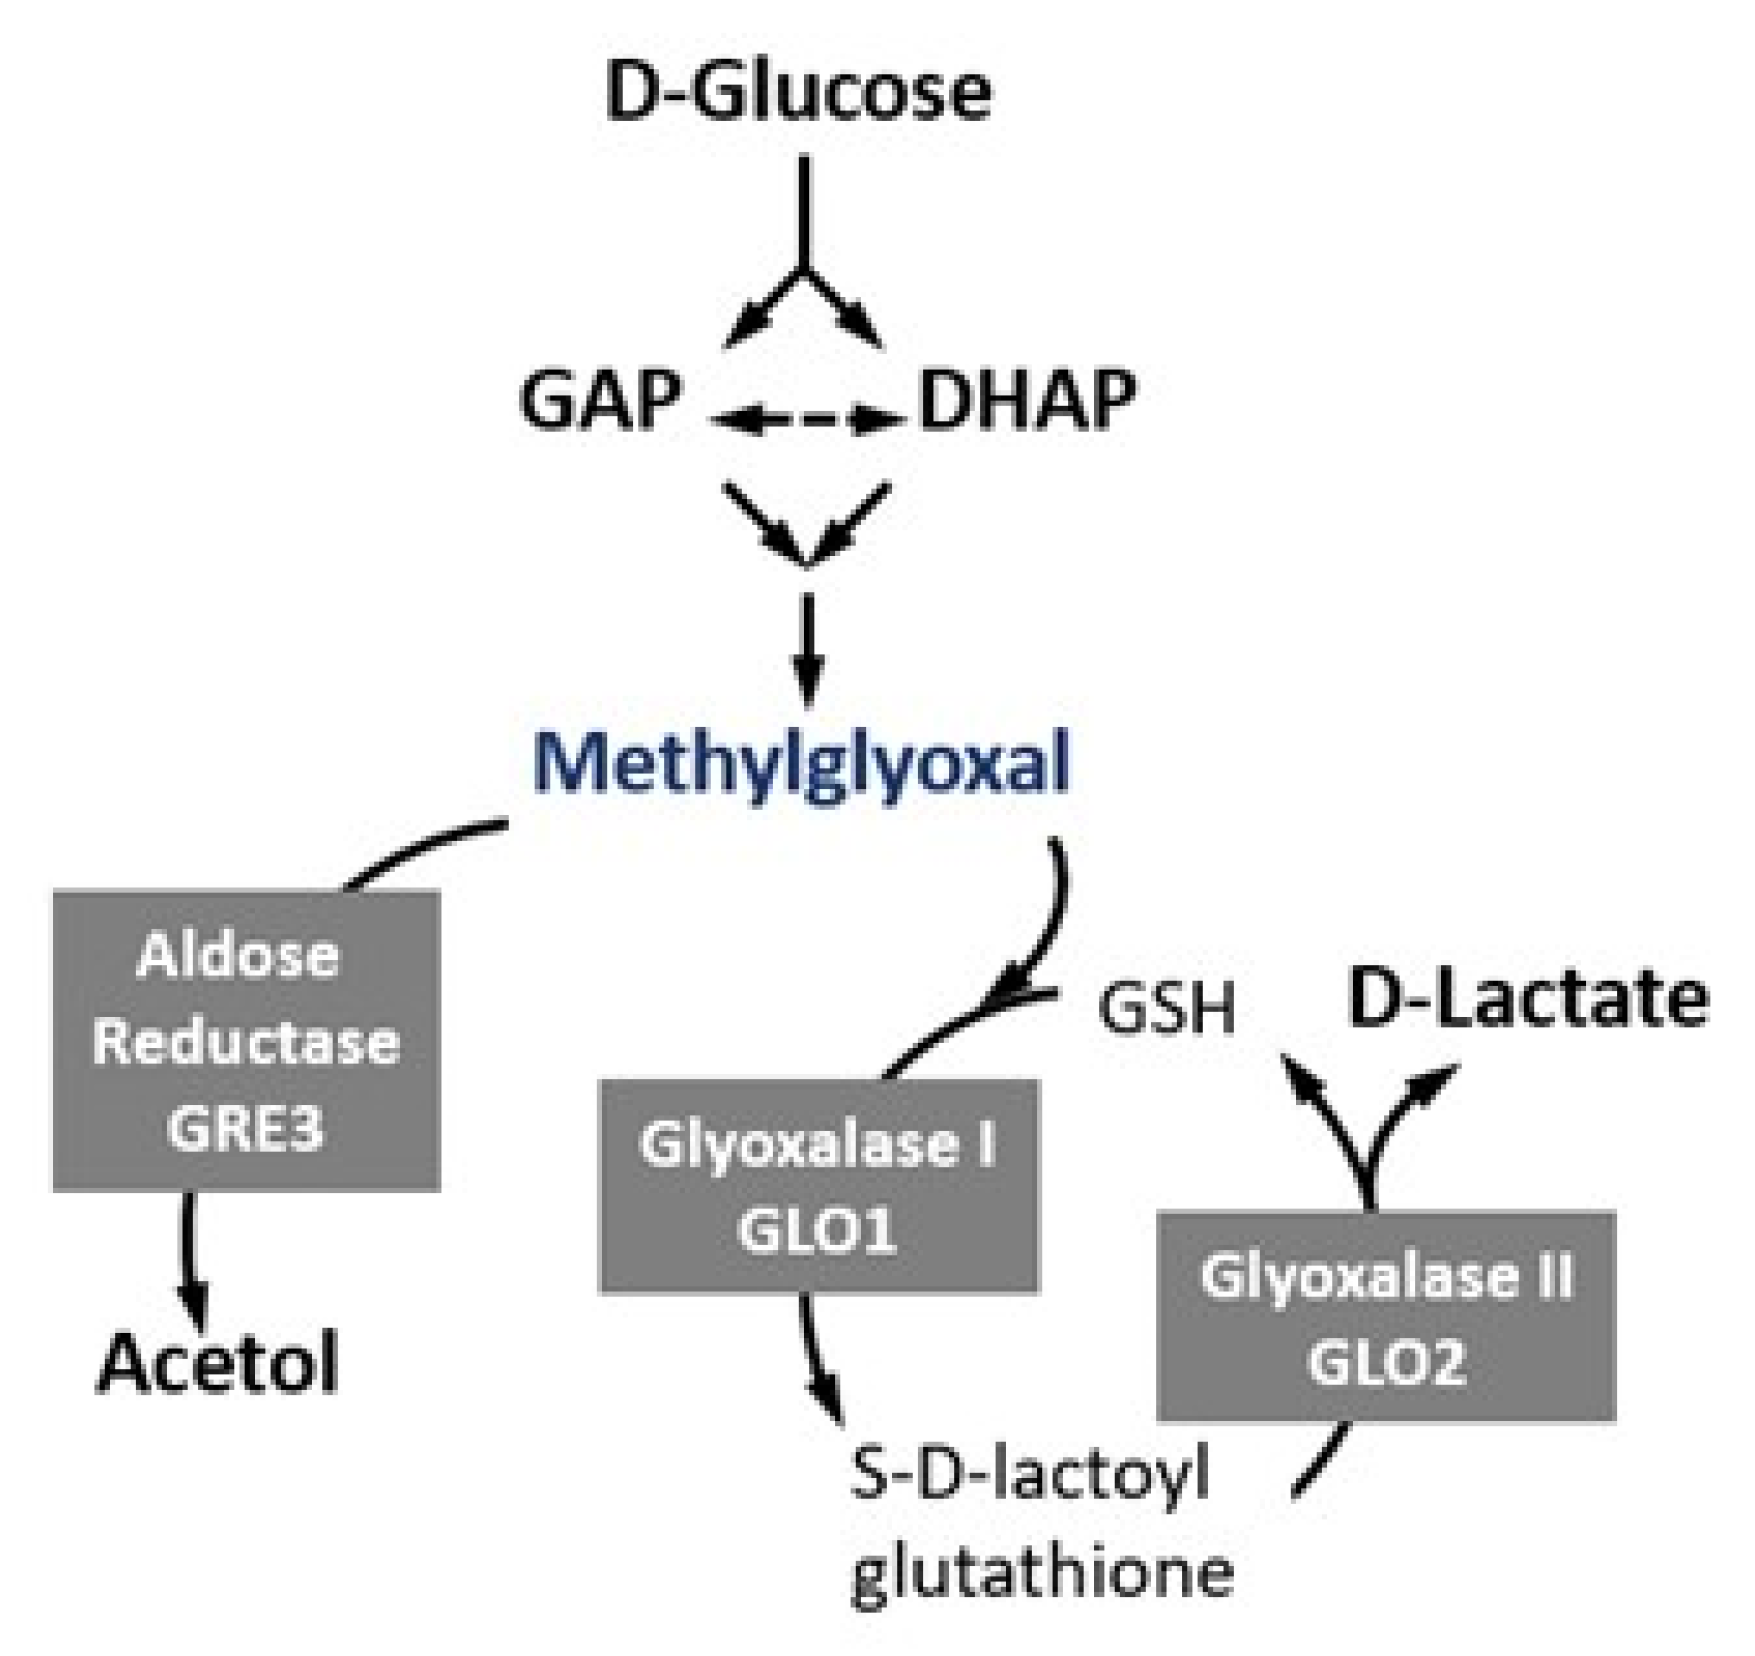
:1. Introduction
2. Results
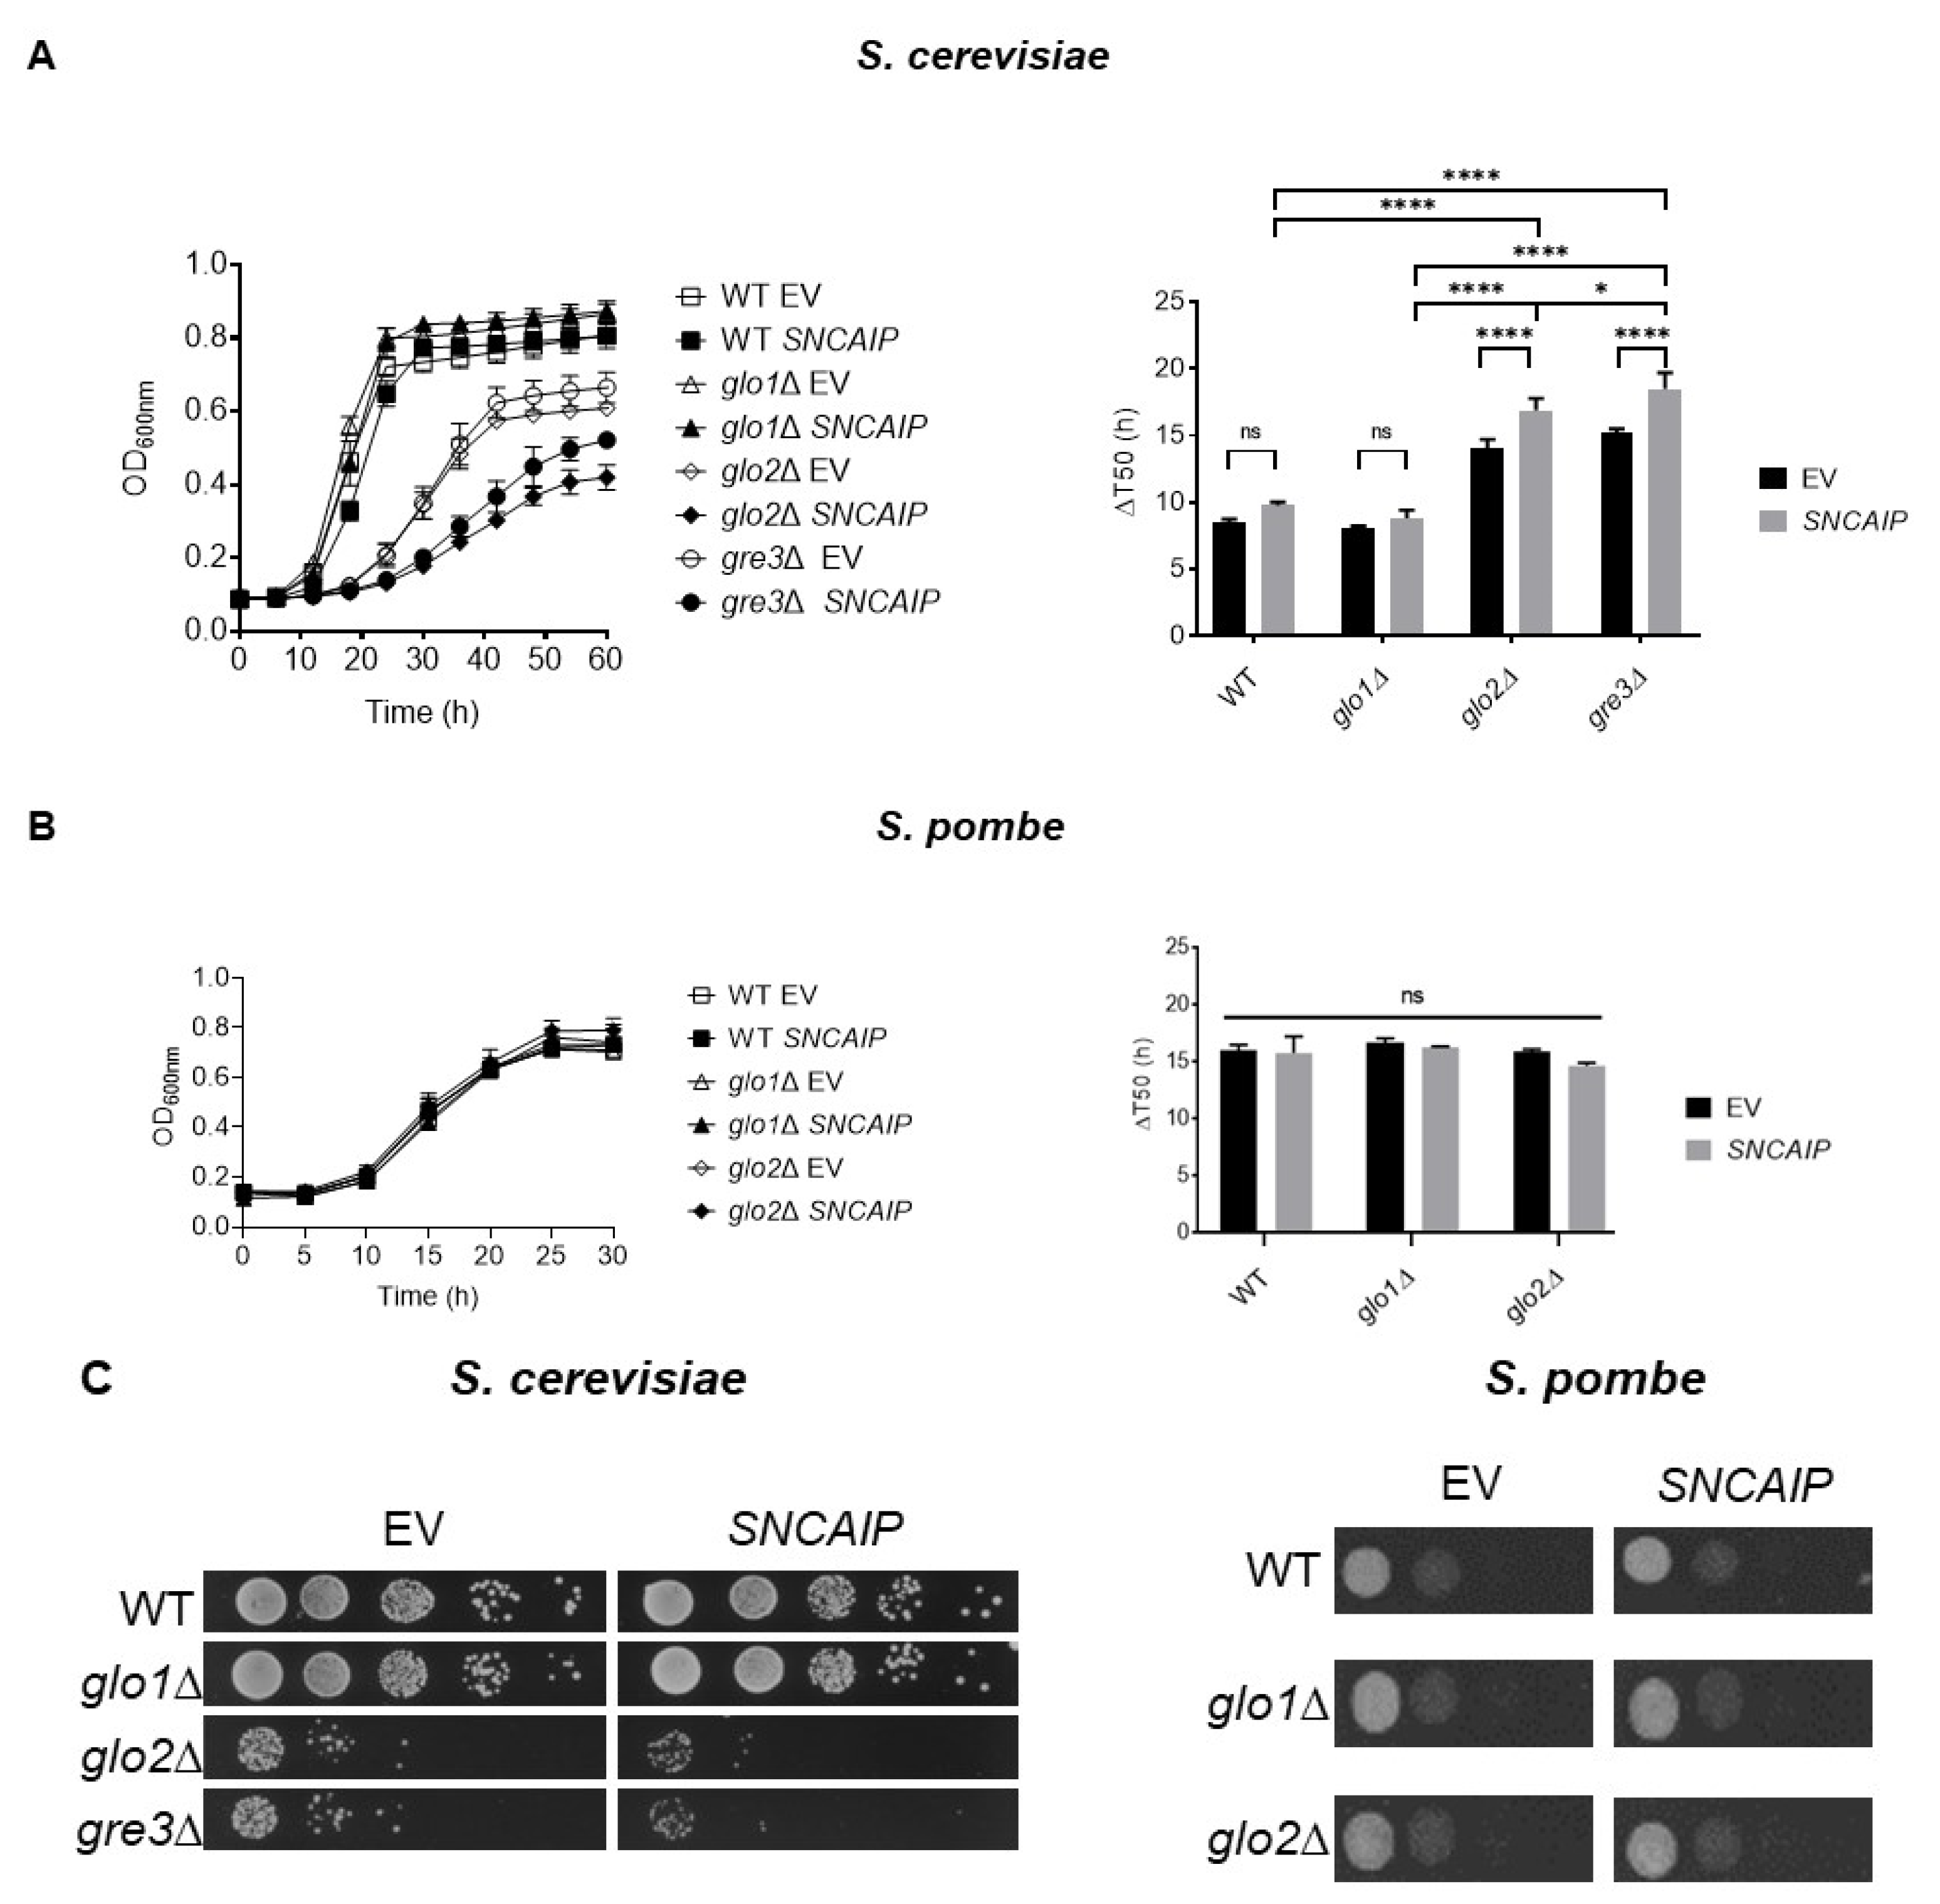
2.1. SY1 Production Results in a Growth Defect of S. cerevisiae Strains Devoid of Glo2 and Gre3
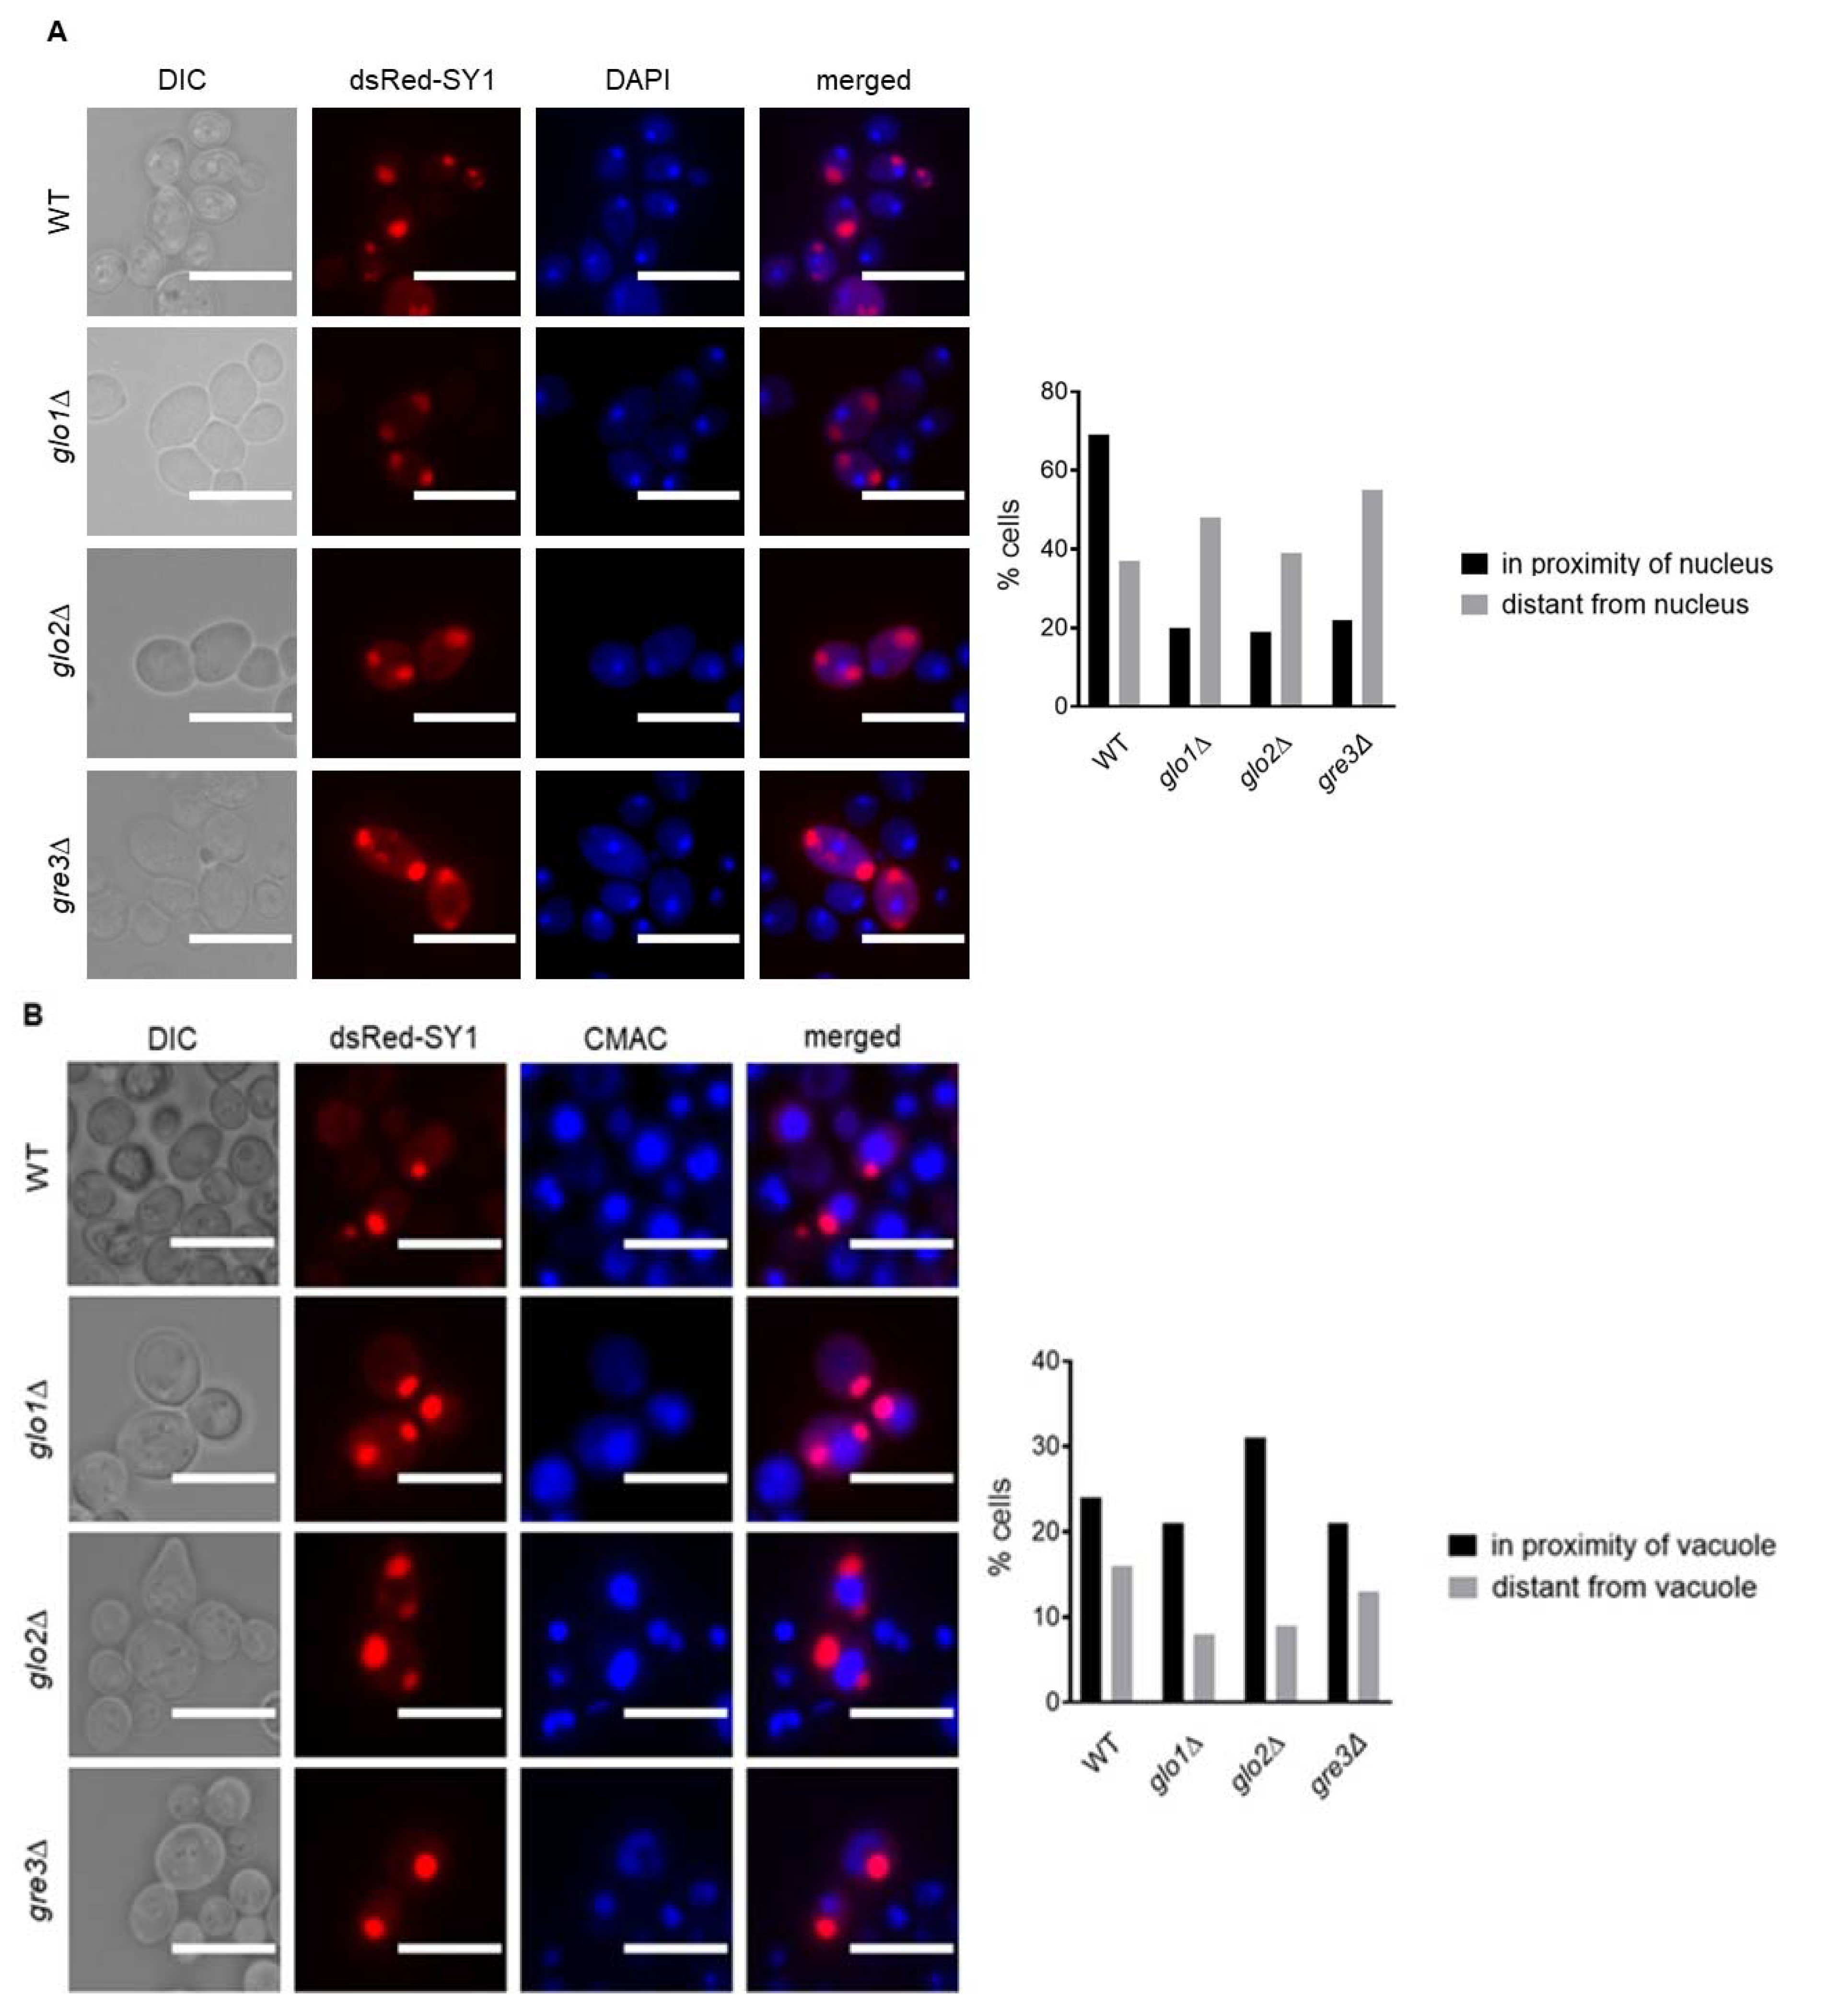
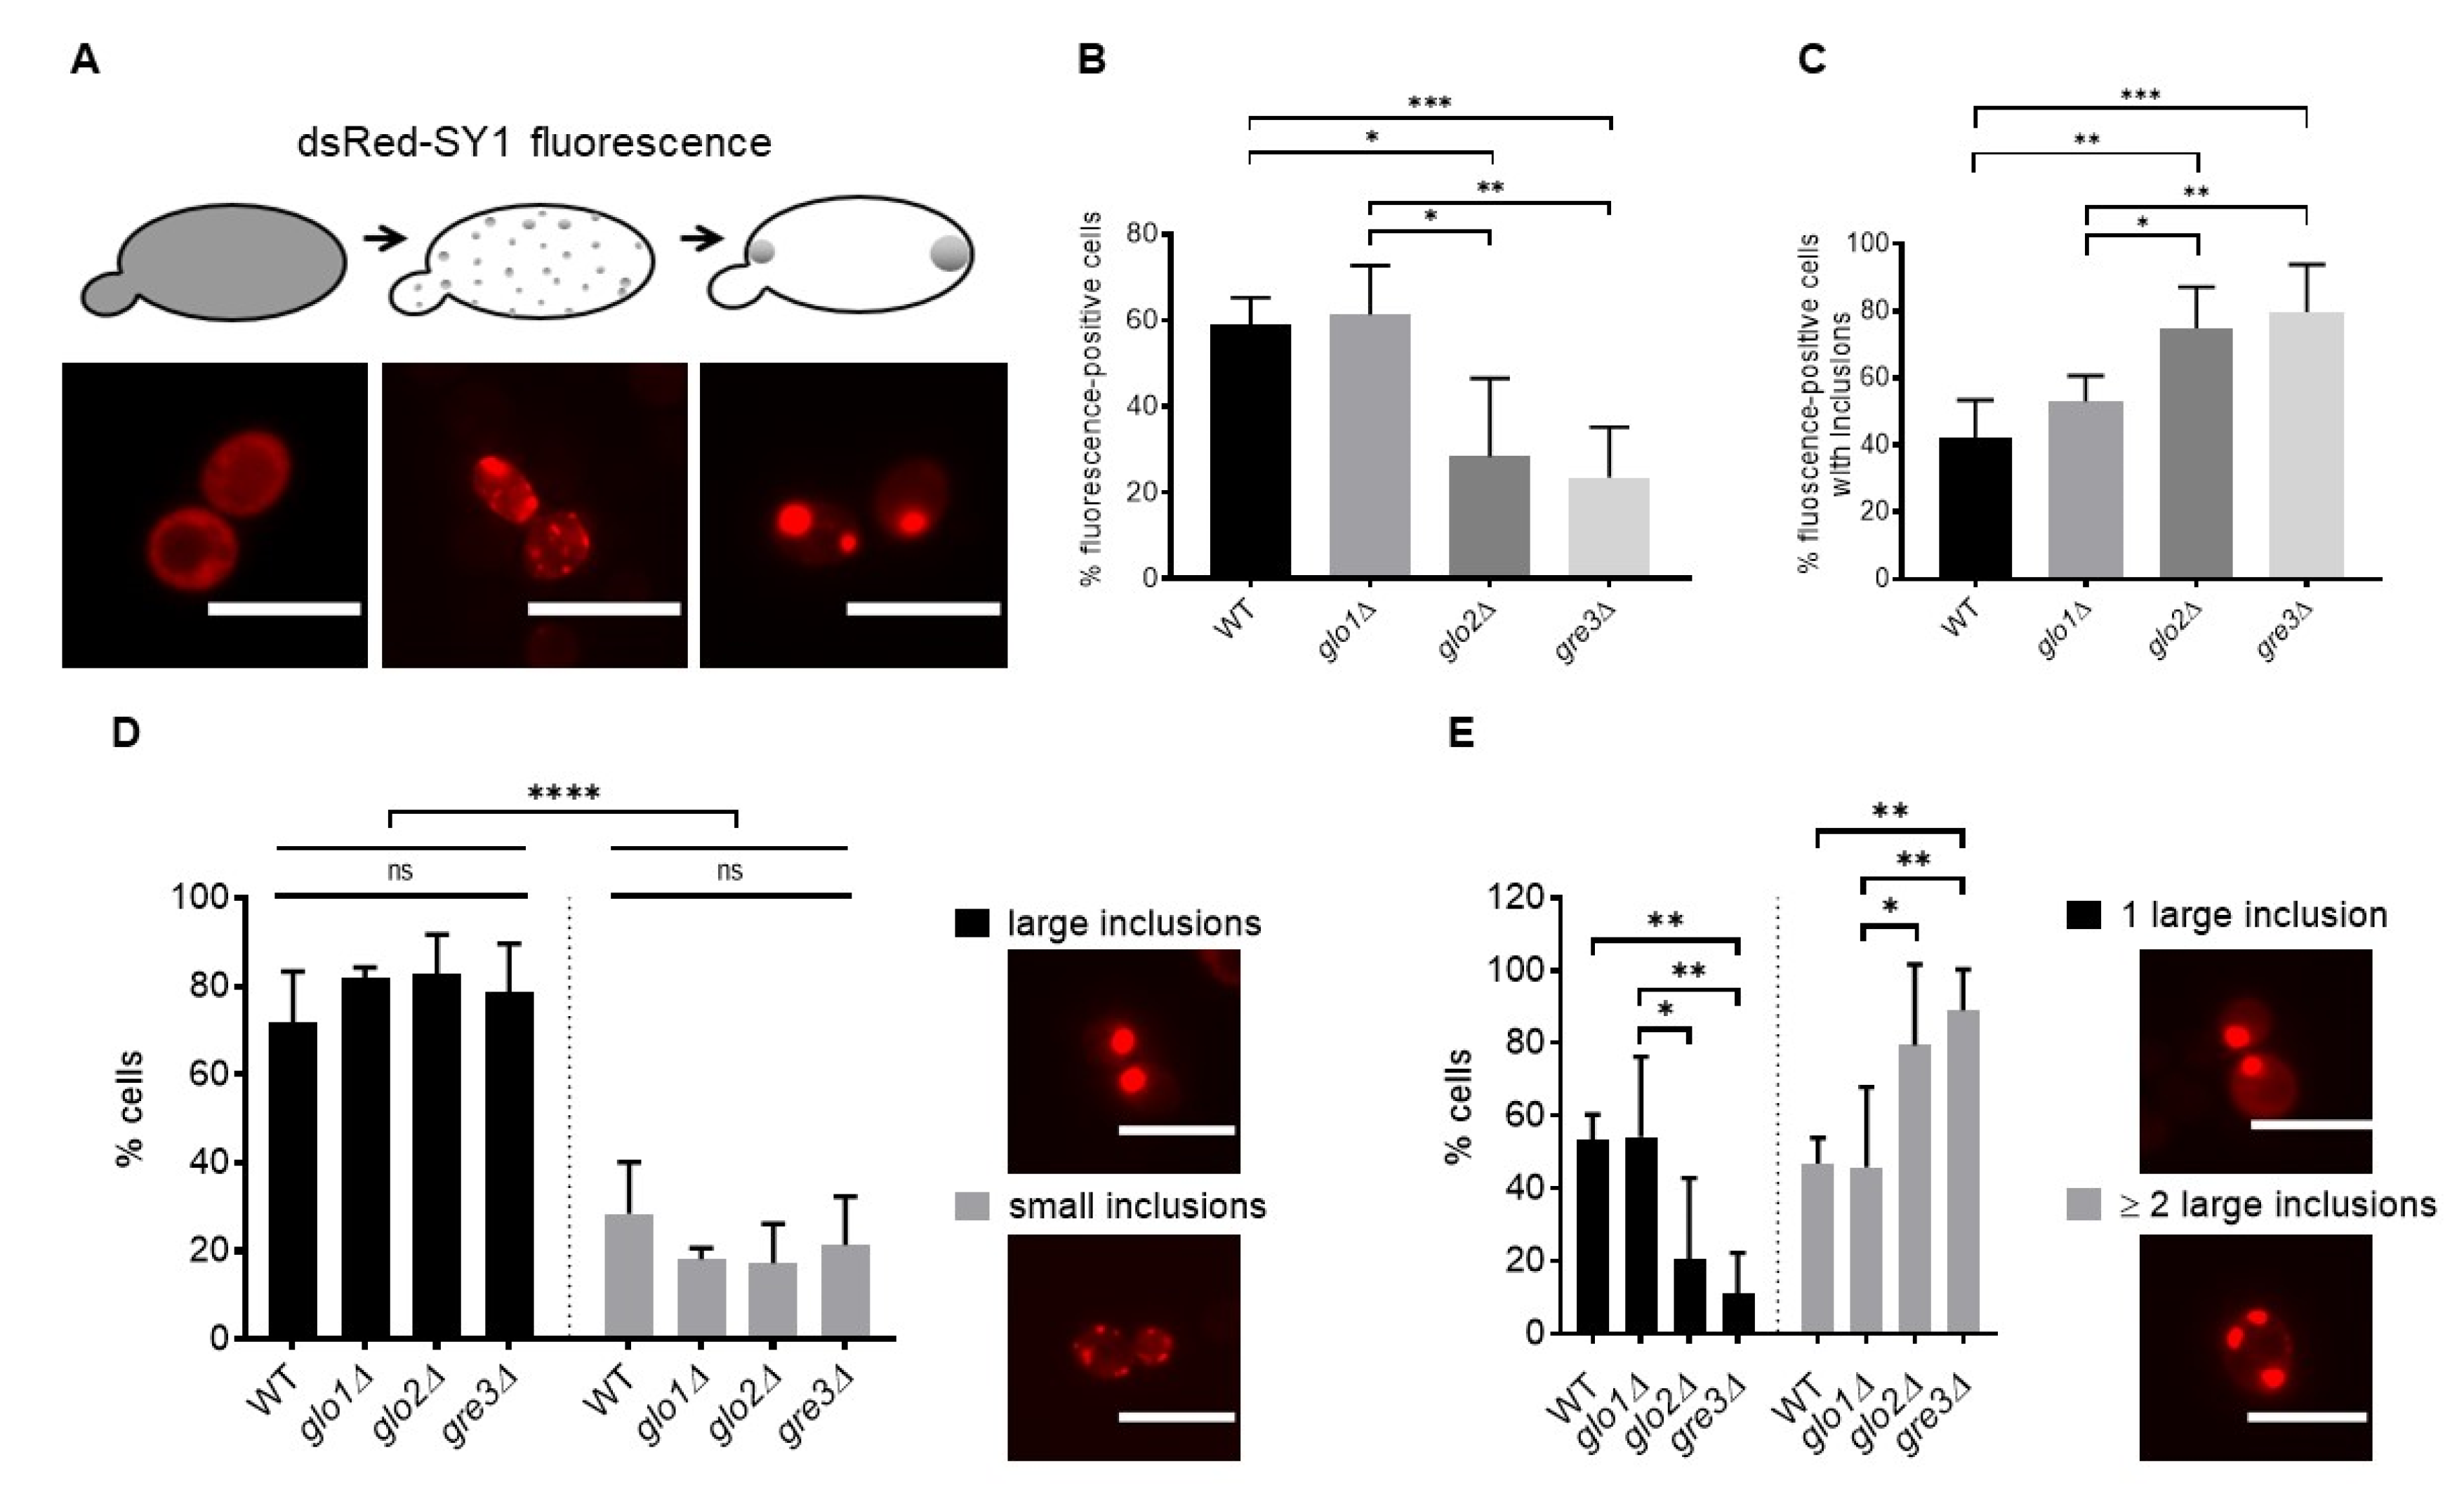
2.2. Disrupting Methylglyoxalase System and Aldose Reductase Activity Increases the Number of Large dsRed-SY1 Inclusions in S. cerevisiae
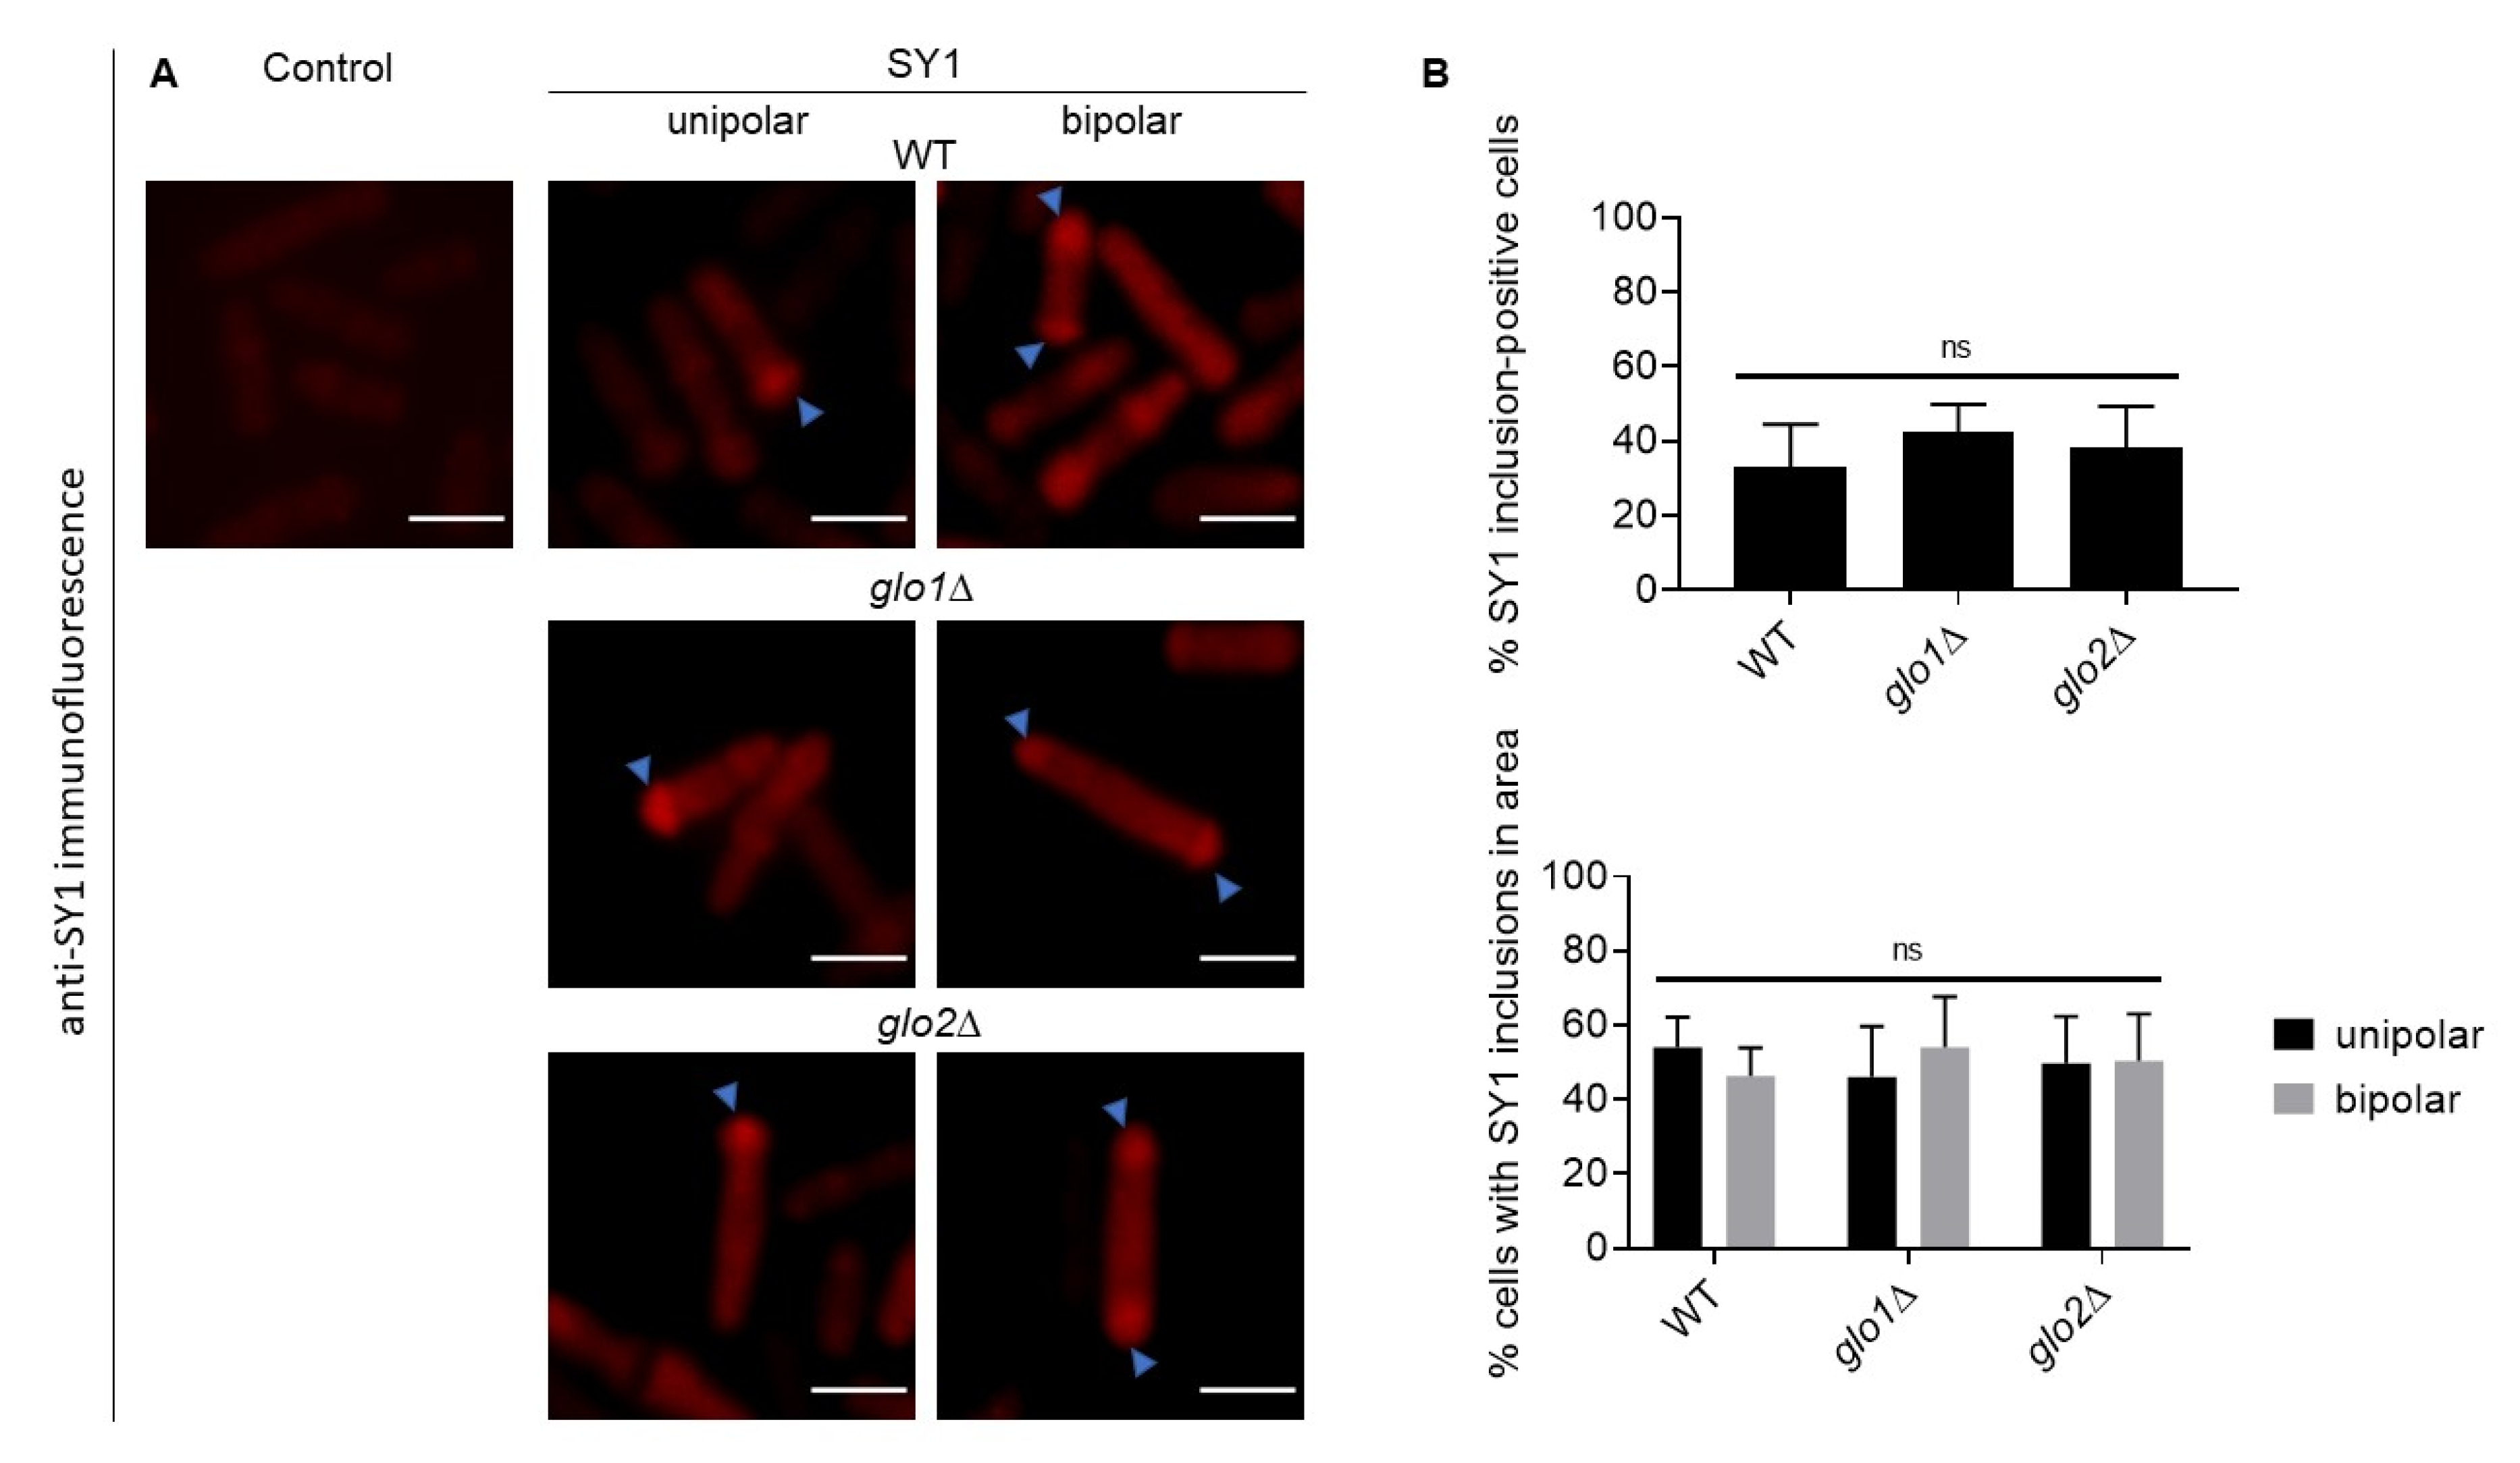
2.3. Immunofluorescent Detection of SY1 in S. pombe Reveals Polar-Localised Inclusions
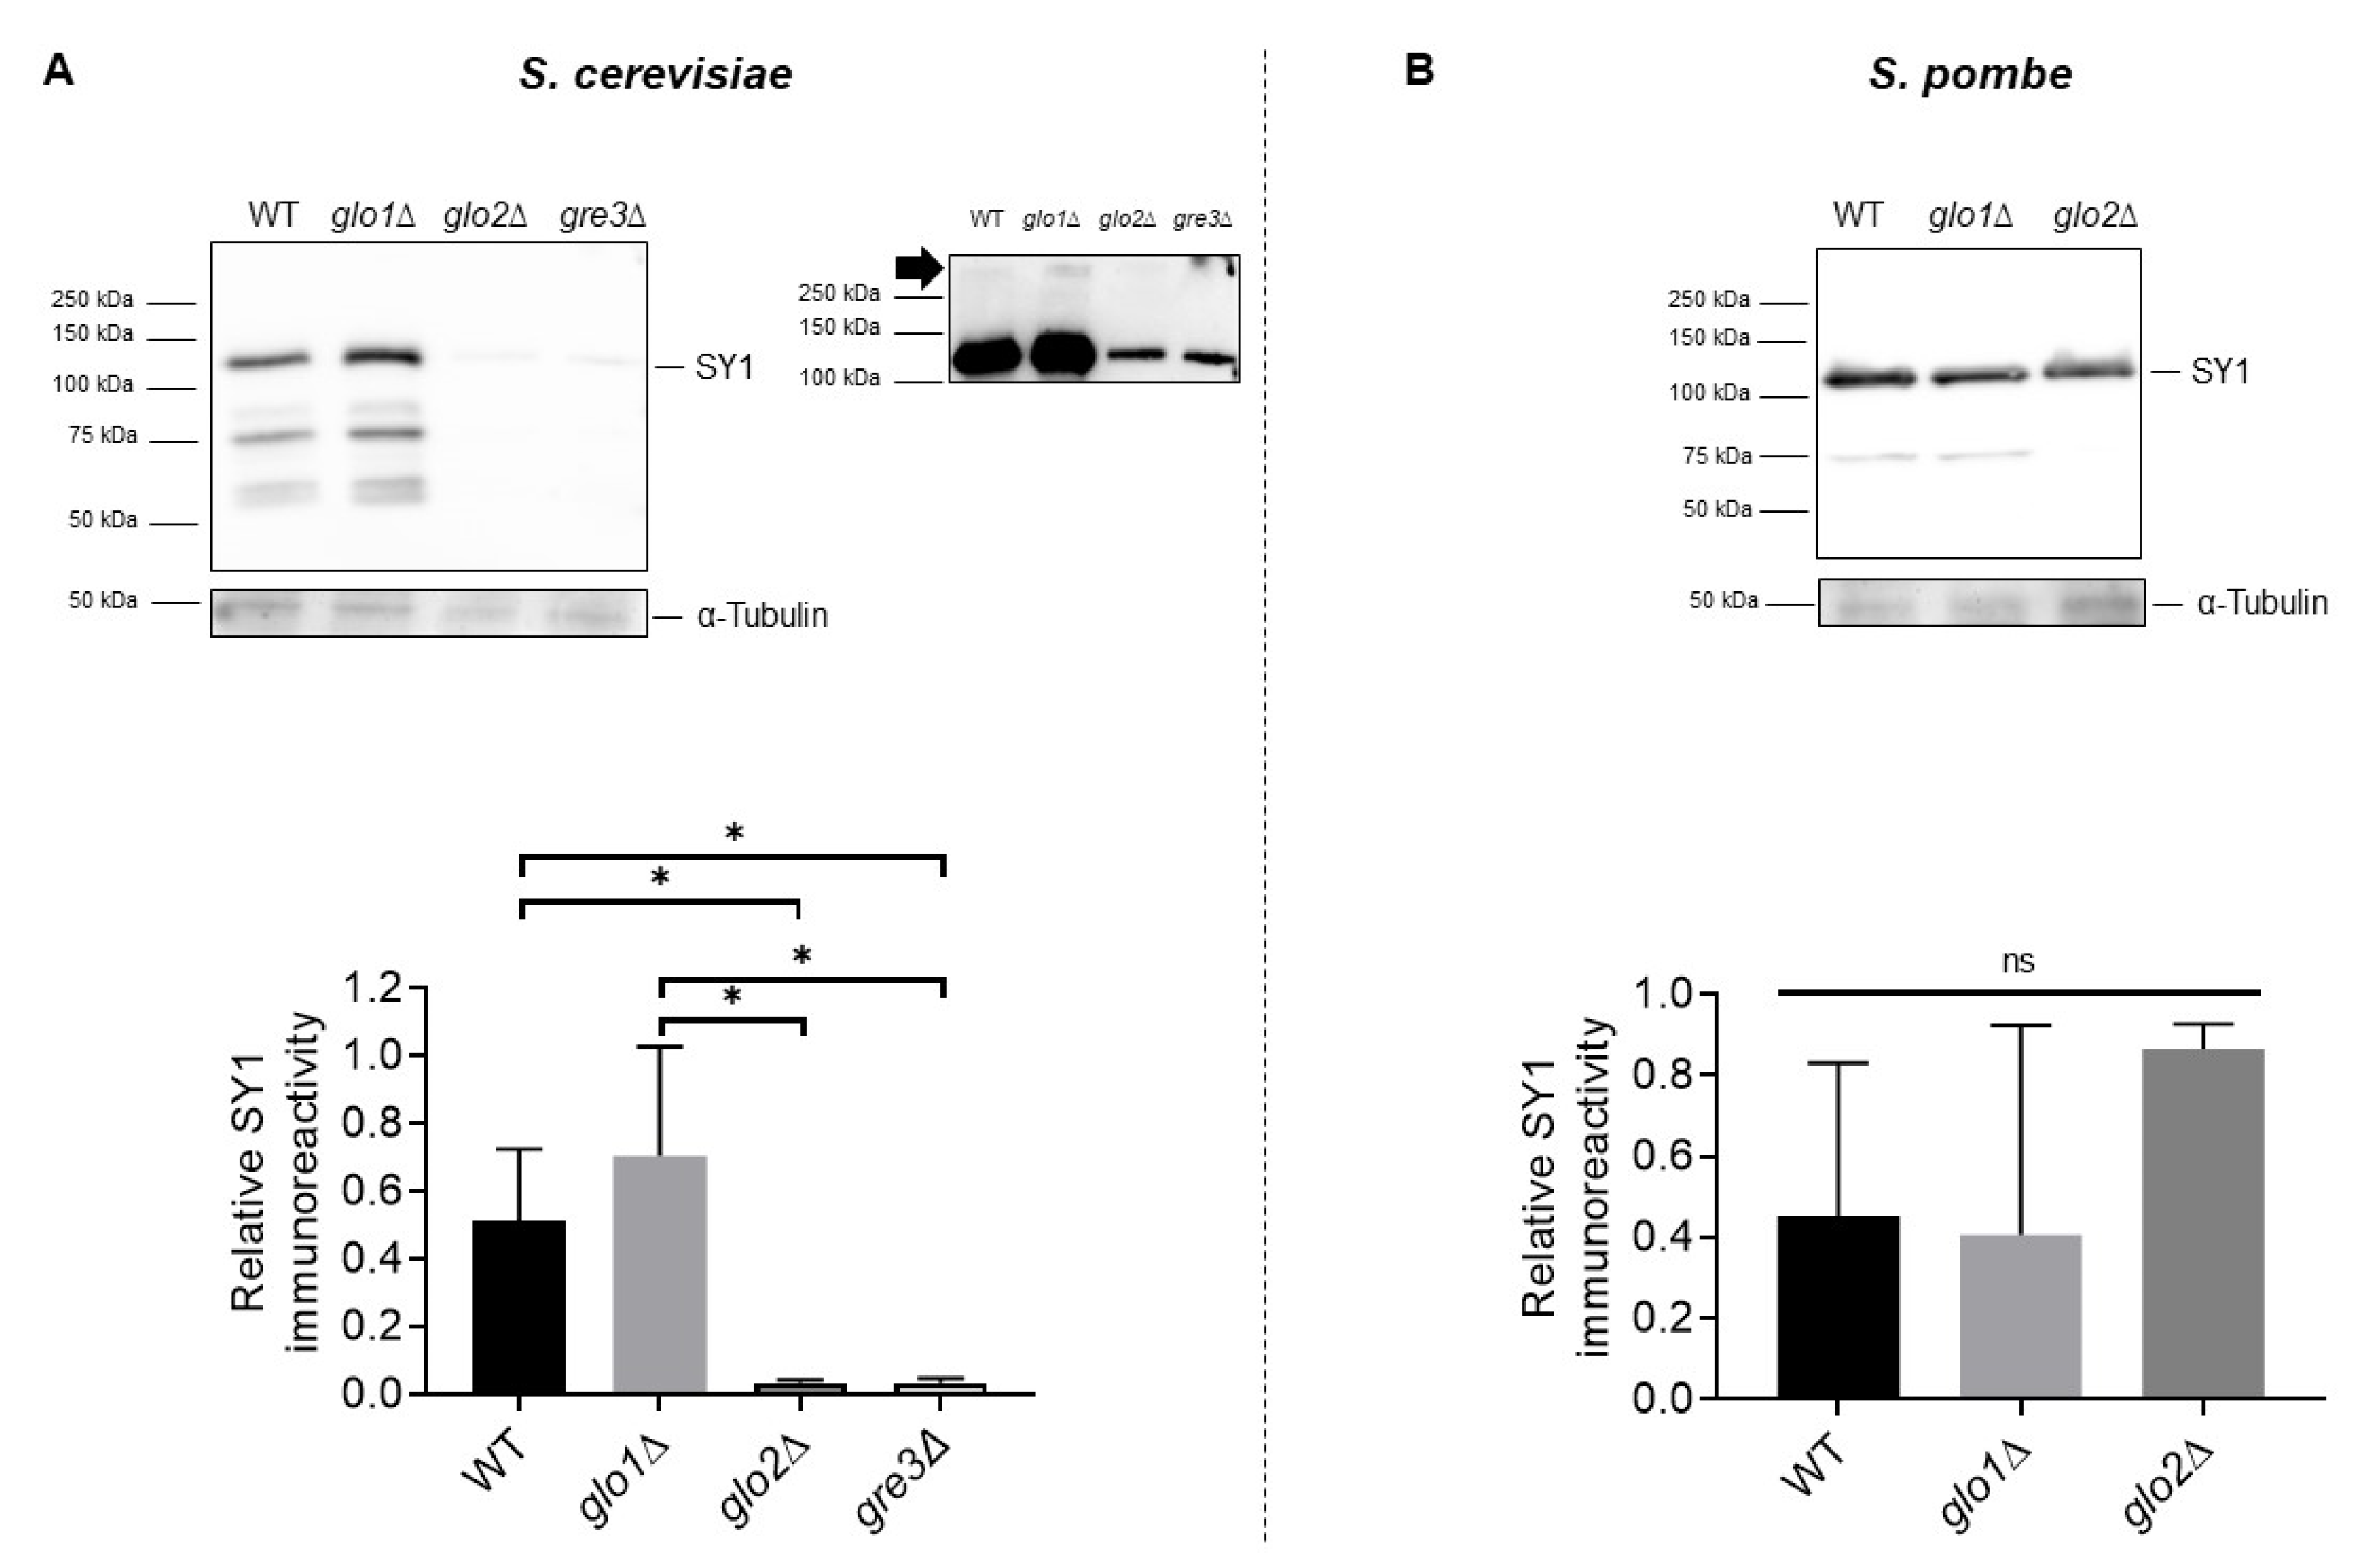
2.4. Disrupting Methylglyoxalase System and Aldose Reductase Activity Is Associated with Reduced SY1 Protein Content in S. cerevisiae
2.5. Potential Localisation of dsRed-SY1 Inclusions to IPOD in Methylglyoxalase System and Aldose Reductase-Deficient Strains Indicates the Involvement of Autophagy
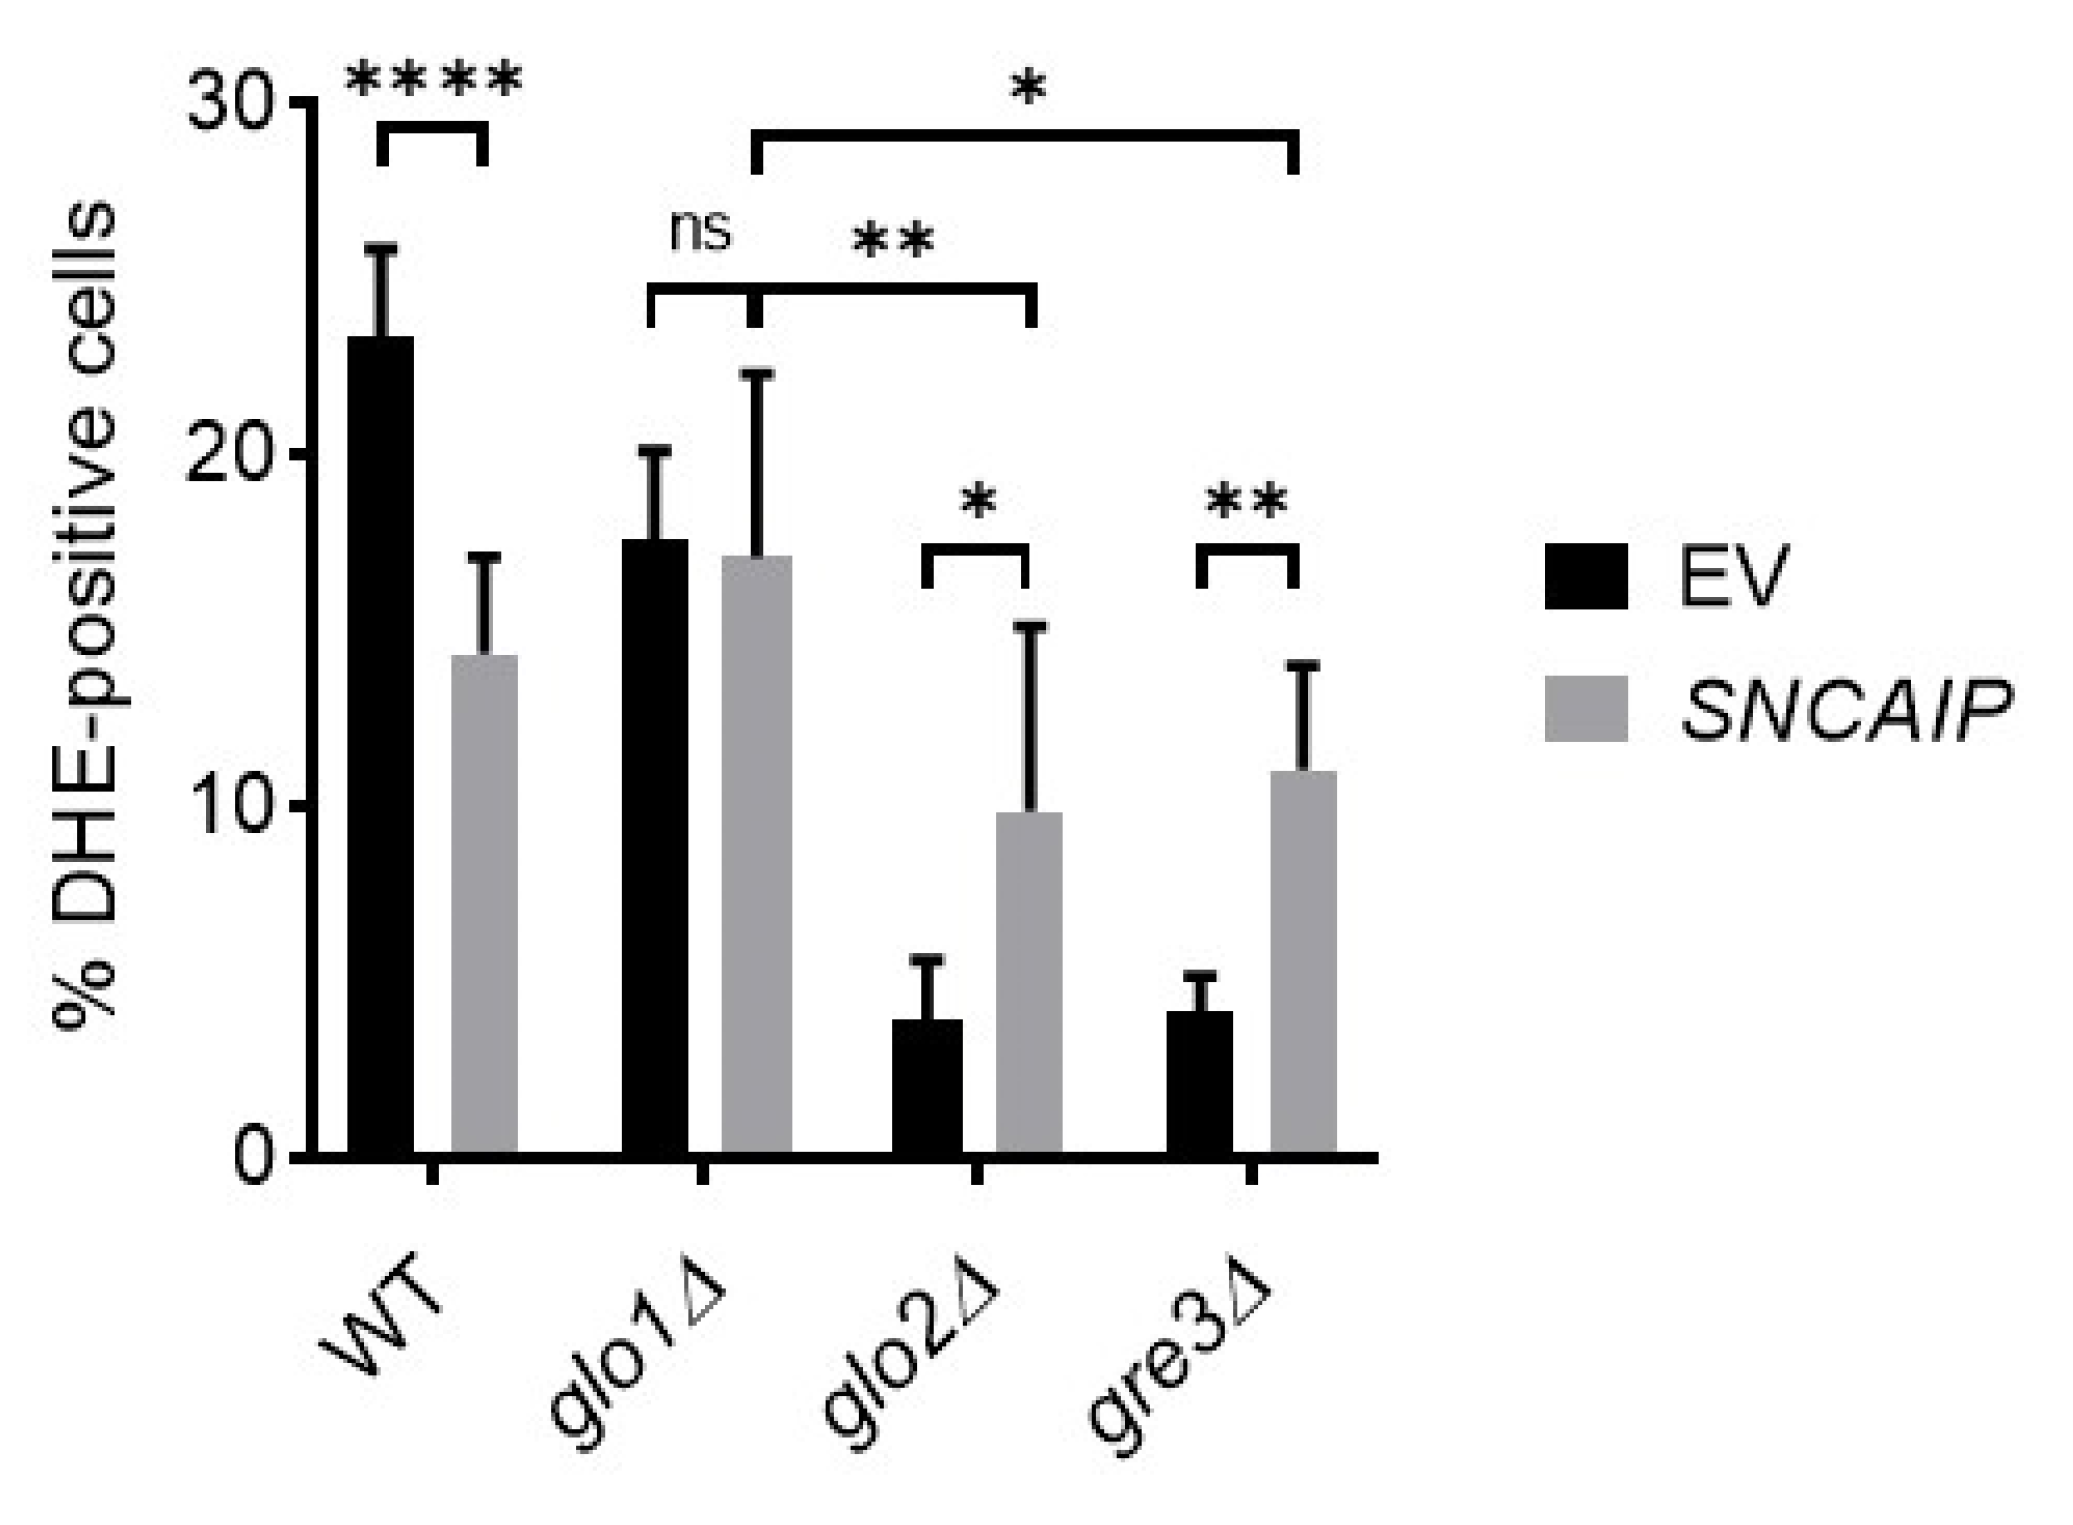
2.6. Disrupting Methylglyoxalase System and Aldose Reductase Activity Is Associated with Enhanced Oxidative Stress Levels in S. cerevisiae
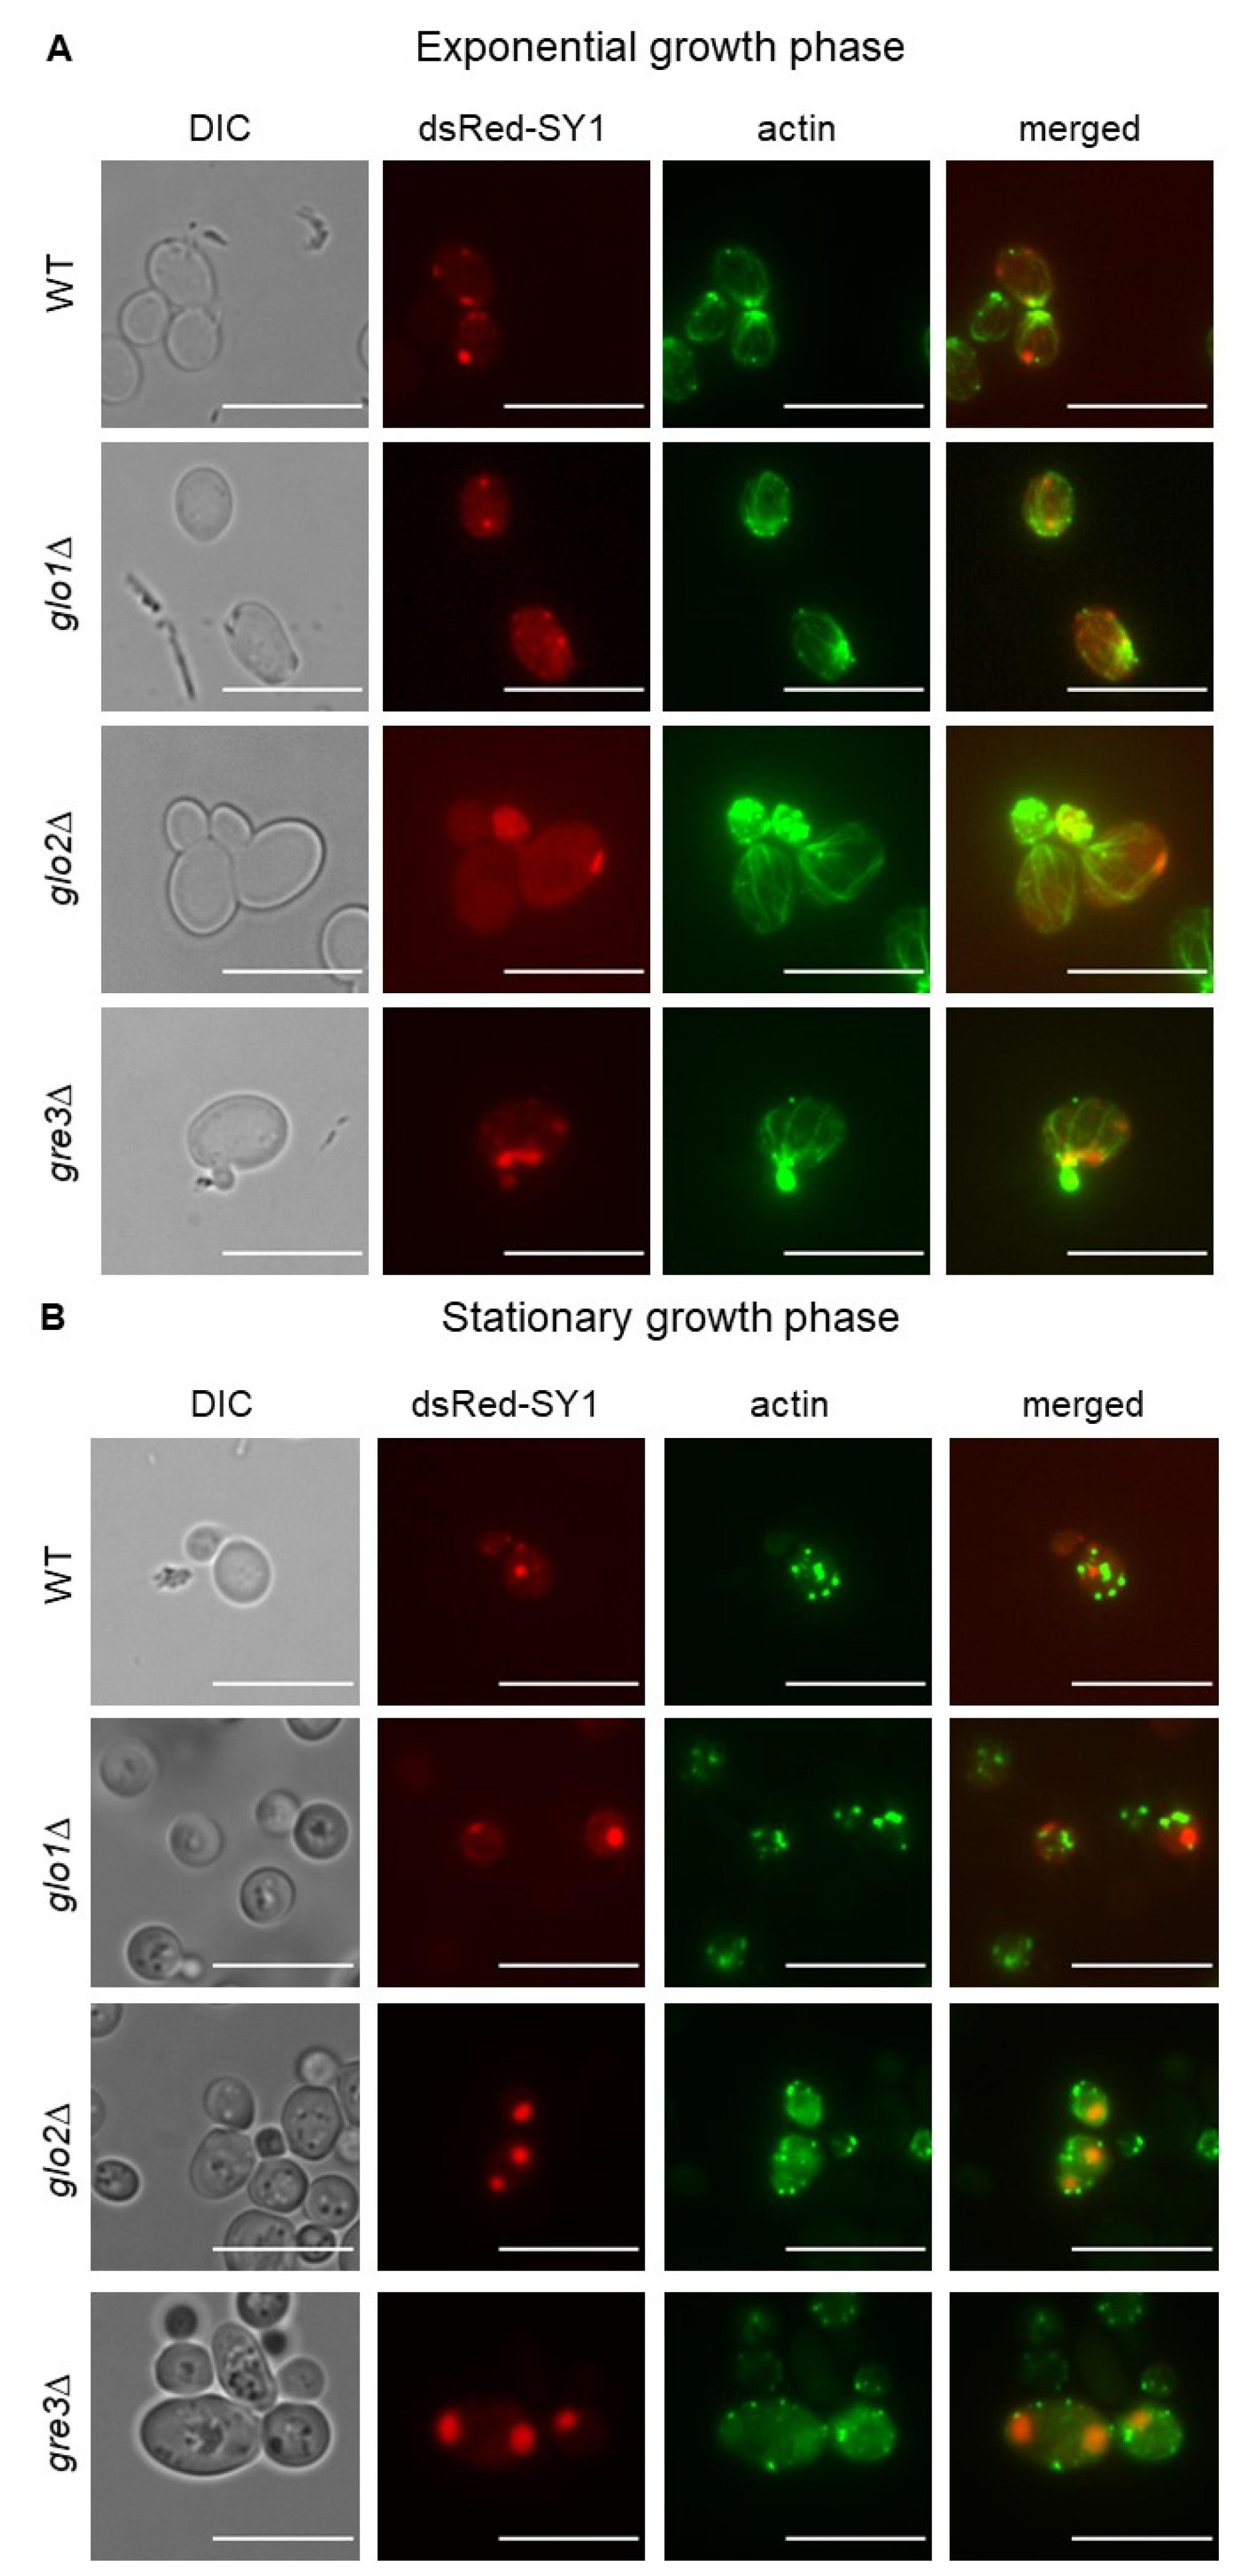
2.7. Analysis of Actin Cytoskeleton Organisation in S. cerevisiae Cells Producing dsRed-SY1
3. Discussion
4. Materials and Methods
4.1. Cell Culture, Strains, and Plasmids
4.2. Growth Analyses and Spot Assays
4.3. Oxidative Stress Measurements
4.4. Fluorescence Microscopic Analysis
4.5. Immunological Techniques
4.5.1. Western Blot Analysis
4.5.2. Immunofluorescence Microscopy
5. Conclusions
Author Contributions
Funding
Institutional Review Board Statement
Informed Consent Statement
Data Availability Statement
Acknowledgments
Conflicts of Interest
Abbreviations
| PD | Parkinson’s disease |
| αSyn | α-Synuclein |
| SY1 | Synphilin-1 |
| AGE | advanced glycation end-products |
| ROS | reactive oxygen species |
| MGO | Methylglyoxal OD optical density |
| EV | empty vector |
| ns | not significant |
| CytoQ | cytoplasmic quality control compartment |
| JUNQ/INQ | juxta/intranuclear quality control compartment |
| IPOD | insoluble protein deposit |
References
- Braak, H.; Braak, E. Pathoanatomy of Parkinson’s disease. J. Neurol. 2000, 247 (Suppl. 2), II3–II10. [Google Scholar] [CrossRef]
- Shults, C.W. Lewy bodies. Proc. Natl. Acad. Sci. USA 2006, 103, 1661–1668. [Google Scholar] [CrossRef] [PubMed] [Green Version]
- Eyal, A.; Engelender, S. Synphilin isoforms and the search for a cellular model of lewy body formation in Parkinson’s disease. Cell Cycle 2006, 5, 2082–2086. [Google Scholar] [CrossRef] [PubMed]
- Eyal, A.; Szargel, R.; Avraham, E.; Liani, E.; Haskin, J.; Rott, R.; Engelender, S. Synphilin-1A: An aggregation-prone isoform of synphilin-1 that causes neuronal death and is present in aggregates from alpha-synucleinopathy patients. Proc. Natl. Acad. Sci. USA 2006, 103, 5917–5922. [Google Scholar] [CrossRef] [PubMed] [Green Version]
- Tofaris, G.K.; Spillantini, M.G. Physiological and pathological properties of alpha-synuclein. Cell Mol. Life Sci. 2007, 64, 2194–2201. [Google Scholar] [CrossRef] [PubMed]
- Ribeiro, C.S.; Carneiro, K.; Ross, C.A.; Menezes, J.R.; Engelender, S. Synphilin-1 is developmentally localized to synaptic terminals, and its association with synaptic vesicles is modulated by alpha-synuclein. J. Biol. Chem. 2002, 277, 23927–23933. [Google Scholar] [CrossRef] [Green Version]
- Jin, H.G.; Yamashita, H.; Nakamura, T.; Fukuba, H.; Takahashi, T.; Hiji, M.; Kohriyama, T.; Matsumoto, M. Synphilin-1 transgenic mice exhibit mild motor impairments. Neurosci. Lett. 2008, 445, 12–17. [Google Scholar] [CrossRef]
- Nuber, S.; Franck, T.; Wolburg, H.; Schumann, U.; Casadei, N.; Fischer, K.; Calaminus, C.; Pichler, B.J.; Chanarat, S.; Teismann, P.; et al. Transgenic overexpression of the alpha-synuclein interacting protein synphilin-1 leads to behavioral and neuropathological alterations in mice. Neurogenetics 2010, 11, 107–120. [Google Scholar] [CrossRef]
- Krenz, A.; Falkenburger, B.H.; Gerhardt, E.; Drinkut, A.; Schulz, J.B. Aggregate formation and toxicity by wild-type and R621C synphilin-1 in the nigrostriatal system of mice using adenoviral vectors. J. Neurochem. 2009, 108, 139–146. [Google Scholar] [CrossRef]
- Smith, W.W.; Liu, Z.; Liang, Y.; Masuda, N.; Swing, D.A.; Jenkins, N.A.; Copeland, N.G.; Troncoso, J.C.; Pletnikov, M.; Dawson, T.M.; et al. Synphilin-1 attenuates neuronal degeneration in the A53T alpha-synuclein transgenic mouse model. Hum. Mol. Genet. 2010, 19, 2087–2098. [Google Scholar] [CrossRef] [Green Version]
- Casadei, N.; Pohler, A.M.; Tomas-Zapico, C.; Torres-Peraza, J.; Schwedhelm, I.; Witz, A.; Zamolo, I.; De Heer, R.; Spruijt, B.; Noldus, L.P.; et al. Overexpression of synphilin-1 promotes clearance of soluble and misfolded alpha-synuclein without restoring the motor phenotype in aged A30P transgenic mice. Hum. Mol. Genet. 2014, 23, 767–781. [Google Scholar] [CrossRef] [PubMed] [Green Version]
- Liu, J.; Li, T.; Thomas, J.M.; Pei, Z.; Jiang, H.; Engelender, S.; Ross, C.A.; Smith, W.W. Synphilin-1 attenuates mutant LRRK2-induced neurodegeneration in Parkinson’s disease models. Hum. Mol. Genet. 2016, 25, 672–680. [Google Scholar] [CrossRef] [PubMed] [Green Version]
- Shishido, T.; Nagano, Y.; Araki, M.; Kurashige, T.; Obayashi, H.; Nakamura, T.; Takahashi, T.; Matsumoto, M.; Maruyama, H. Synphilin-1 has neuroprotective effects on MPP(+)-induced Parkinson’s disease model cells by inhibiting ROS production and apoptosis. Neurosci. Lett. 2019, 690, 145–150. [Google Scholar] [CrossRef] [Green Version]
- Buttner, S.; Delay, C.; Franssens, V.; Bammens, T.; Ruli, D.; Zaunschirm, S.; de Oliveira, R.M.; Outeiro, T.F.; Madeo, F.; Buee, L.; et al. Synphilin-1 enhances alpha-synuclein aggregation in yeast and contributes to cellular stress and cell death in a Sir2-dependent manner. PLoS ONE 2010, 5, e13700. [Google Scholar] [CrossRef] [PubMed]
- Liu, B.; Larsson, L.; Caballero, A.; Hao, X.; Oling, D.; Grantham, J.; Nystrom, T. The polarisome is required for segregation and retrograde transport of protein aggregates. Cell 2010, 140, 257–267. [Google Scholar] [CrossRef] [Green Version]
- Brownlee, M. Biochemistry and molecular cell biology of diabetic complications. Nature 2001, 414, 813–820. [Google Scholar] [CrossRef]
- Vlassara, H.; Striker, G.E. Advanced glycation endproducts in diabetes and diabetic complications. Endocrinol. Metab. Clin. N. Am. 2013, 42, 697–719. [Google Scholar] [CrossRef]
- Neeper, M.; Schmidt, A.M.; Brett, J.; Yan, S.D.; Wang, F.; Pan, Y.C.; Elliston, K.; Stern, D.; Shaw, A. Cloning and expression of a cell surface receptor for advanced glycosylation end products of proteins. J. Biol. Chem. 1992, 267, 14998–15004. [Google Scholar] [CrossRef]
- El Khoury, J.; Thomas, C.A.; Loike, J.D.; Hickman, S.E.; Cao, L.; Silverstein, S.C. Macrophages adhere to glucose-modified basement membrane collagen IV via their scavenger receptors. J. Biol. Chem. 1994, 269, 10197–10200. [Google Scholar] [CrossRef]
- Vlassara, H.; Li, Y.M.; Imani, F.; Wojciechowicz, D.; Yang, Z.; Liu, F.T.; Cerami, A. Identification of galectin-3 as a high-affinity binding protein for advanced glycation end products (AGE): A new member of the AGE-receptor complex. Mol. Med. 1995, 1, 634–646. [Google Scholar] [CrossRef] [Green Version]
- Li, Y.M.; Mitsuhashi, T.; Wojciechowicz, D.; Shimizu, N.; Li, J.; Stitt, A.; He, C.; Banerjee, D.; Vlassara, H. Molecular identity and cellular distribution of advanced glycation endproduct receptors: Relationship of p60 to OST-48 and p90 to 80K-H membrane proteins. Proc. Natl. Acad. Sci. USA 1996, 93, 11047–11052. [Google Scholar] [CrossRef] [Green Version]
- Ohgami, N.; Nagai, R.; Ikemoto, M.; Arai, H.; Miyazaki, A.; Hakamata, H.; Horiuchi, S.; Nakayama, H. CD36, serves as a receptor for advanced glycation endproducts (AGE). J. Diabetes Complicat. 2002, 16, 56–59. [Google Scholar] [CrossRef]
- Vicente Miranda, H.; Outeiro, T.F. The sour side of neurodegenerative disorders: The effects of protein glycation. J. Pathol. 2010, 221, 13–25. [Google Scholar] [CrossRef]
- Jack, M.; Wright, D. Role of advanced glycation endproducts and glyoxalase I in diabetic peripheral sensory neuropathy. Transl. Res. 2012, 159, 355–365. [Google Scholar] [CrossRef] [Green Version]
- Thornalley, P.J. Dicarbonyl intermediates in the maillard reaction. Ann. N. Y. Acad. Sci. 2005, 1043, 111–117. [Google Scholar] [CrossRef]
- Racker, E. The mechanism of action of glyoxalase. J. Biol. Chem. 1951, 190, 685–696. [Google Scholar] [CrossRef]
- Takatsume, Y.; Izawa, S.; Inoue, Y. Identification of thermostable glyoxalase I in the fission yeast Schizosaccharomyces pombe. Arch. Microbiol. 2004, 181, 371–377. [Google Scholar] [CrossRef] [PubMed]
- Bito, A.; Haider, M.; Hadler, I.; Breitenbach, M. Identification and phenotypic analysis of two glyoxalase II encoding genes from Saccharomyces cerevisiae, GLO2 and GLO4, and intracellular localization of the corresponding proteins. J. Biol. Chem. 1997, 272, 21509–21519. [Google Scholar] [CrossRef] [PubMed] [Green Version]
- Inoue, Y.; Maeta, K.; Nomura, W. Glyoxalase system in yeasts: Structure, function, and physiology. Semin. Cell Dev. Biol. 2011, 22, 278–284. [Google Scholar] [CrossRef] [PubMed] [Green Version]
- Morita, T.; Huruta, T.; Ashiuchi, M.; Yagi, T. Characterization of recombinant YakC of Schizosaccharomyces pombe showing YakC defines a new family of aldo-keto reductases. J. Biochem. 2002, 132, 635–641. [Google Scholar] [CrossRef] [PubMed]
- Aguilera, J.; Prieto, J.A. The Saccharomyces cerevisiae aldose reductase is implied in the metabolism of methylglyoxal in response to stress conditions. Curr. Genet. 2001, 39, 273–283. [Google Scholar] [CrossRef] [PubMed]
- Munch, G.; Luth, H.J.; Wong, A.; Arendt, T.; Hirsch, E.; Ravid, R.; Riederer, P. Crosslinking of alpha-synuclein by advanced glycation endproducts—An early pathophysiological step in Lewy body formation? J. Chem. Neuroanat. 2000, 20, 253–257. [Google Scholar] [CrossRef]
- Choi, Y.G.; Lim, S. N(varepsilon)-(carboxymethyl)lysine linkage to alpha-synuclein and involvement of advanced glycation end products in alpha-synuclein deposits in an MPTP-intoxicated mouse model. Biochimie 2010, 92, 1379–1386. [Google Scholar] [CrossRef] [PubMed]
- Kurz, A.; Rabbani, N.; Walter, M.; Bonin, M.; Thornalley, P.; Auburger, G.; Gispert, S. Alpha-synuclein deficiency leads to increased glyoxalase I expression and glycation stress. Cell Mol. Life Sci. 2011, 68, 721–733. [Google Scholar] [CrossRef] [Green Version]
- Vicente Miranda, H.; Szego, E.M.; Oliveira, L.M.A.; Breda, C.; Darendelioglu, E.; de Oliveira, R.M.; Ferreira, D.G.; Gomes, M.A.; Rott, R.; Oliveira, M.; et al. Glycation potentiates alpha-synuclein-associated neurodegeneration in synucleinopathies. Brain 2017, 140, 1399–1419. [Google Scholar] [CrossRef] [Green Version]
- Dringen, R.; Gutterer, J.M.; Hirrlinger, J. Glutathione metabolism in brain metabolic interaction between astrocytes and neurons in the defense against reactive oxygen species. Eur. J. Biochem. 2000, 267, 4912–4916. [Google Scholar] [CrossRef]
- Hwang, C.; Sinskey, A.J.; Lodish, H.F. Oxidized redox state of glutathione in the endoplasmic reticulum. Science 1992, 257, 1496–1502. [Google Scholar] [CrossRef]
- Levy, E.; El Banna, N.; Baille, D.; Heneman-Masurel, A.; Truchet, S.; Rezaei, H.; Huang, M.E.; Beringue, V.; Martin, D.; Vernis, L. Causative Links between Protein Aggregation and Oxidative Stress: A Review. Int. J. Mol. Sci. 2019, 20, 3896. [Google Scholar] [CrossRef] [Green Version]
- Coelho, M.; Lade, S.J.; Alberti, S.; Gross, T.; Tolic, I.M. Fusion of protein aggregates facilitates asymmetric damage segregation. PLoS Biol. 2014, 12, e1001886. [Google Scholar] [CrossRef] [PubMed] [Green Version]
- Coelho, M.; Dereli, A.; Haese, A.; Kuhn, S.; Malinovska, L.; DeSantis, M.E.; Shorter, J.; Alberti, S.; Gross, T.; Tolic-Norrelykke, I.M. Fission yeast does not age under favorable conditions, but does so after stress. Curr. Biol. 2013, 23, 1844–1852. [Google Scholar] [CrossRef] [PubMed] [Green Version]
- Arrasate, M.; Mitra, S.; Schweitzer, E.S.; Segal, M.R.; Finkbeiner, S. Inclusion body formation reduces levels of mutant huntingtin and the risk of neuronal death. Nature 2004, 431, 805–810. [Google Scholar] [CrossRef] [Green Version]
- Nonaka, T.; Iwatsubo, T.; Hasegawa, M. Ubiquitination of alpha-synuclein. Biochemistry 2005, 44, 361–368. [Google Scholar] [CrossRef]
- Anderson, J.P.; Walker, D.E.; Goldstein, J.M.; de Laat, R.; Banducci, K.; Caccavello, R.J.; Barbour, R.; Huang, J.; Kling, K.; Lee, M.; et al. Phosphorylation of Ser-129 is the dominant pathological modification of alpha-synuclein in familial and sporadic Lewy body disease. J. Biol. Chem. 2006, 281, 29739–29752. [Google Scholar] [CrossRef] [PubMed] [Green Version]
- Kaganovich, D.; Kopito, R.; Frydman, J. Misfolded proteins partition between two distinct quality control compartments. Nature 2008, 454, 1088–1095. [Google Scholar] [CrossRef] [PubMed]
- Miller, S.B.; Ho, C.T.; Winkler, J.; Khokhrina, M.; Neuner, A.; Mohamed, M.Y.; Guilbride, D.L.; Richter, K.; Lisby, M.; Schiebel, E.; et al. Compartment-specific aggregases direct distinct nuclear and cytoplasmic aggregate deposition. EMBO J. 2015, 34, 778–797. [Google Scholar] [CrossRef] [PubMed] [Green Version]
- Cali, T.; Ottolini, D.; Negro, A.; Brini, M. alpha-Synuclein controls mitochondrial calcium homeostasis by enhancing endoplasmic reticulum-mitochondria interactions. J. Biol. Chem. 2012, 287, 17914–17929. [Google Scholar] [CrossRef] [PubMed] [Green Version]
- Guardia-Laguarta, C.; Area-Gomez, E.; Rub, C.; Liu, Y.; Magrane, J.; Becker, D.; Voos, W.; Schon, E.A.; Przedborski, S. alpha-Synuclein is localized to mitochondria-associated ER membranes. J. Neurosci. 2014, 34, 249–259. [Google Scholar] [CrossRef] [PubMed]
- Paillusson, S.; Gomez-Suaga, P.; Stoica, R.; Little, D.; Gissen, P.; Devine, M.J.; Noble, W.; Hanger, D.P.; Miller, C.C.J. α-Synuclein binds to the ER-mitochondria tethering protein VAPB to disrupt Ca2+ homeostasis and mitochondrial ATP production. Acta Neuropathol. 2017, 134, 129–149. [Google Scholar] [CrossRef] [PubMed] [Green Version]
- Sagot, I.; Pinson, B.; Salin, B.; Daignan-Fornier, B. Actin bodies in yeast quiescent cells: An immediately available actin reserve? Mol. Biol. Cell 2006, 17, 4645–4655. [Google Scholar] [CrossRef] [PubMed] [Green Version]
- Mishra, M.; Huang, J.; Balasubramanian, M.K. The yeast actin cytoskeleton. FEMS Microbiol. Rev. 2014, 38, 213–227. [Google Scholar] [CrossRef] [Green Version]
- Armeni, T.; Cianfruglia, L.; Piva, F.; Urbanelli, L.; Luisa Caniglia, M.; Pugnaloni, A.; Principato, G. S-D-Lactoylglutathione can be an alternative supply of mitochondrial glutathione. Free Radic. Biol. Med. 2014, 67, 451–459. [Google Scholar] [CrossRef] [PubMed]
- Zuin, A.; Vivancos, A.P.; Sanso, M.; Takatsume, Y.; Ayte, J.; Inoue, Y.; Hidalgo, E. The glycolytic metabolite methylglyoxal activates Pap1 and Sty1 stress responses in Schizosaccharomyces pombe. J. Biol. Chem. 2005, 280, 36708–36713. [Google Scholar] [CrossRef] [PubMed] [Green Version]
- Zhao, Q.; Su, Y.; Wang, Z.; Chen, C.; Wu, T.; Huang, Y. Identification of glutathione (GSH)-independent glyoxalase III from Schizosaccharomyces pombe. BMC Evol. Biol. 2014, 14, 86. [Google Scholar] [CrossRef] [Green Version]
- Gostimskaya, I.; Grant, C.M. Yeast mitochondrial glutathione is an essential antioxidant with mitochondrial thioredoxin providing a back-up system. Free Radic. Biol. Med. 2016, 94, 55–65. [Google Scholar] [CrossRef]
- Chang, F.; Martin, S.G. Shaping fission yeast with microtubules. Cold Spring Harb. Perspect. Biol. 2009, 1, a001347. [Google Scholar] [CrossRef] [Green Version]
- Motegi, F.; Arai, R.; Mabuchi, I. Identification of two type V myosins in fission yeast, one of which functions in polarized cell growth and moves rapidly in the cell. Mol. Biol. Cell 2001, 12, 1367–1380. [Google Scholar] [CrossRef] [Green Version]
- Moreno, S.; Klar, A.; Nurse, P. Molecular genetic analysis of fission yeast Schizosaccharomyces pombe. Methods Enzymol. 1991, 194, 795–823. [Google Scholar] [CrossRef]
- Kim, D.U.; Hayles, J.; Kim, D.; Wood, V.; Park, H.O.; Won, M.; Yoo, H.S.; Duhig, T.; Nam, M.; Palmer, G.; et al. Analysis of a genome-wide set of gene deletions in the fission yeast Schizosaccharomyces pombe. Nat. Biotechnol. 2010, 28, 617–623. [Google Scholar] [CrossRef] [Green Version]
- Fennessy, D.; Grallert, A.; Krapp, A.; Cokoja, A.; Bridge, A.J.; Petersen, J.; Patel, A.; Tallada, V.A.; Boke, E.; Hodgson, B.; et al. Extending the Schizosaccharomyces pombe molecular genetic toolbox. PLoS ONE 2014, 9, e97683. [Google Scholar] [CrossRef] [PubMed] [Green Version]
- Maundrell, K. Thiamine-repressible expression vectors pREP and pRIP for fission yeast. Gene 1993, 123, 127–130. [Google Scholar] [CrossRef]
- Vandebroek, T.; Vanhelmont, T.; Terwel, D.; Borghgraef, P.; Lemaire, K.; Snauwaert, J.; Wera, S.; Van Leuven, F.; Winderickx, J. Identification and isolation of a hyperphosphorylated, conformationally changed intermediate of human protein tau expressed in yeast. Biochemistry 2005, 44, 11466–11475. [Google Scholar] [CrossRef] [PubMed]
- Hagan, L.; Carr, A.M.; Grallert, A.; Nurse, P. (Eds.) Fission Yeast: A Laboratory Manual; Cold Spring Harbor Laboratory Press: Cold Spring Harbor, NY, USA, 2016. [Google Scholar]
- Hagan, I.M.; Hyams, J.S. The use of cell division cycle mutants to investigate the control of microtubule distribution in the fission yeast Schizosaccharomyces pombe. J. Cell Sci. 1988, 89 Pt 3, 343–357. [Google Scholar]


| Glo1 | Glo2 | Gre3 | ||
|---|---|---|---|---|
| S. cerevisiae | gene | GLO1 (Lactoylglutathione lyase) | GLO2 and GLO4 (Hydroxyacylglutathione hydrolase) | GRE3 (NADPH-dependent aldose reductase) |
| function | catalyzes the formation of S-D-lactoylglutathione | catalyzes the hydrolysis of S-D-lactoyl-glutathione to form glutathione and D-lactic acid | reduces methylglyoxal to acetol and (R)-lactaldehyde | |
| S. pombe Ortholog | gene | glo1+ (Lactoylglutathione lyase) | glo2+ (Hydroxyacylglutathione hydrolase) | non existing |
| function | the same as S. cerevisiae Glo1 | function not experimentally validated yet | no S. pombe aldose reductase has reported MGO-detoxifying activity | |
| Human Ortholog | gene | GLO1 (Lactoylglutathione lyase) | GLO2 (Hydroxyacylglutathione hydrolase) | AKR1B10 (aldo-keto reductase family 1 member B10) |
| function | the same as S. cerevisiae Glo1 | the same as S. cerevisiae Glo2 | catalyzes the NADPH-dependent reduction of a wide variety of carbonyl-containing compounds |
Publisher’s Note: MDPI stays neutral with regard to jurisdictional claims in published maps and institutional affiliations. |
© 2021 by the authors. Licensee MDPI, Basel, Switzerland. This article is an open access article distributed under the terms and conditions of the Creative Commons Attribution (CC BY) license (http://creativecommons.org/licenses/by/4.0/).
Share and Cite
Seynnaeve, D.; Mulvihill, D.P.; Winderickx, J.; Franssens, V. Yeasts as Complementary Model Systems for the Study of the Pathological Repercussions of Enhanced Synphilin-1 Glycation and Oxidation. Int. J. Mol. Sci. 2021, 22, 1677. https://doi.org/10.3390/ijms22041677
Seynnaeve D, Mulvihill DP, Winderickx J, Franssens V. Yeasts as Complementary Model Systems for the Study of the Pathological Repercussions of Enhanced Synphilin-1 Glycation and Oxidation. International Journal of Molecular Sciences. 2021; 22(4):1677. https://doi.org/10.3390/ijms22041677
Chicago/Turabian StyleSeynnaeve, David, Daniel P. Mulvihill, Joris Winderickx, and Vanessa Franssens. 2021. "Yeasts as Complementary Model Systems for the Study of the Pathological Repercussions of Enhanced Synphilin-1 Glycation and Oxidation" International Journal of Molecular Sciences 22, no. 4: 1677. https://doi.org/10.3390/ijms22041677